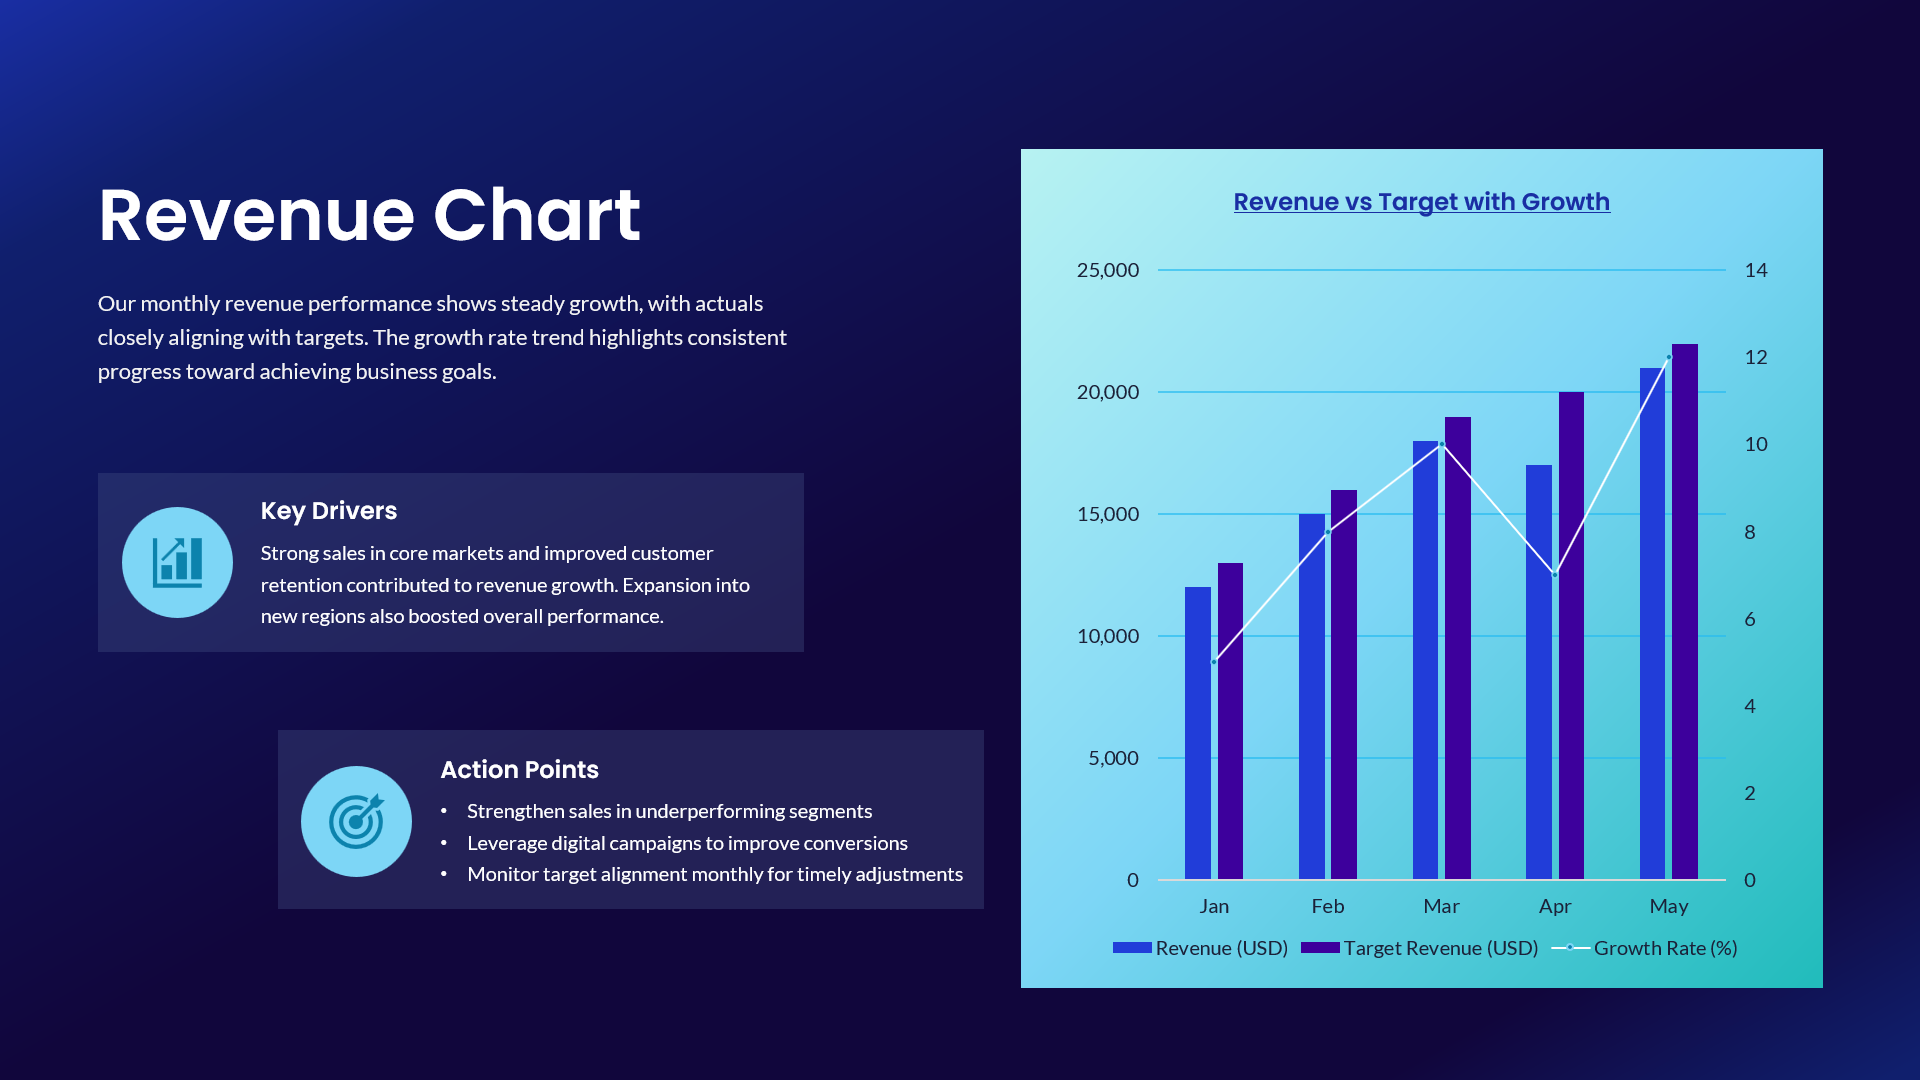
Revenue vs Target Growth Chart Template for PowerPoint & Google Slides


Description
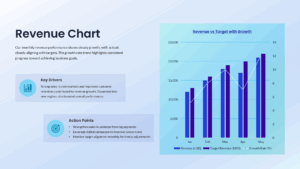
Present your financial performance with clarity using this Revenue vs Target Growth Chart slide. Designed with a dual-axis combination chart, this template compares monthly revenue against target revenue while simultaneously tracking growth rate percentage. The bar columns visually distinguish actual revenue and target figures, while the overlaid line graph highlights performance trends across key reporting periods.
The clean layout features a bold dark background contrasted with a gradient chart panel, ensuring strong visual focus on data insights. Clearly labeled axes, monthly markers, and a concise legend make the slide easy to interpret in executive meetings and boardroom presentations. Supporting content sections for Key Drivers and Action Points allow you to contextualize results, explain performance fluctuations, and outline strategic next steps—all within a single, cohesive slide.
Fully editable in PowerPoint and Google Slides, this template enables you to update revenue data, adjust growth percentages, and customize colors to match your brand guidelines. You can expand the timeline, modify currency formats, or adapt the layout for quarterly or annual reporting. Whether you are presenting to investors, leadership teams, or department heads, this revenue performance slide ensures your financial story is communicated with precision and impact.
Who is it for
Finance managers, CFOs, business analysts, sales directors, and startup founders can use this slide to present revenue tracking and performance analysis. It is also ideal for project managers and consultants delivering KPI updates or business review presentations.
Other Uses
Repurpose this slide for budget vs actual comparisons, sales pipeline tracking, forecast reviews, or operational performance dashboards. It can also support investor updates, quarterly business reviews, or strategic planning sessions focused on revenue optimization.
Login to download this file

Item ID
SB05685Designed By
Niranjana
Related Templates

4 Step Revenue Growth Flow Diagram Template for PowerPoint & Google Slides
Process

Application Revenue Line Chart KPI Template for PowerPoint & Google Slides
Revenue
Entertainment Industry Revenue Bar Chart Template for PowerPoint & Google Slides
Bar/Column
Monthly Recurring Revenue KPI Bar Chart Template for PowerPoint & Google Slides
Bar/Column
Quarterly Revenue Comparison Bar Chart Template for PowerPoint & Google Slides
Bar/Column

Growth Arrow for Progress & Growth template for PowerPoint & Google Slides
Arrow
Revenue Management Business Strategy Template for PowerPoint & Google Slides
Revenue
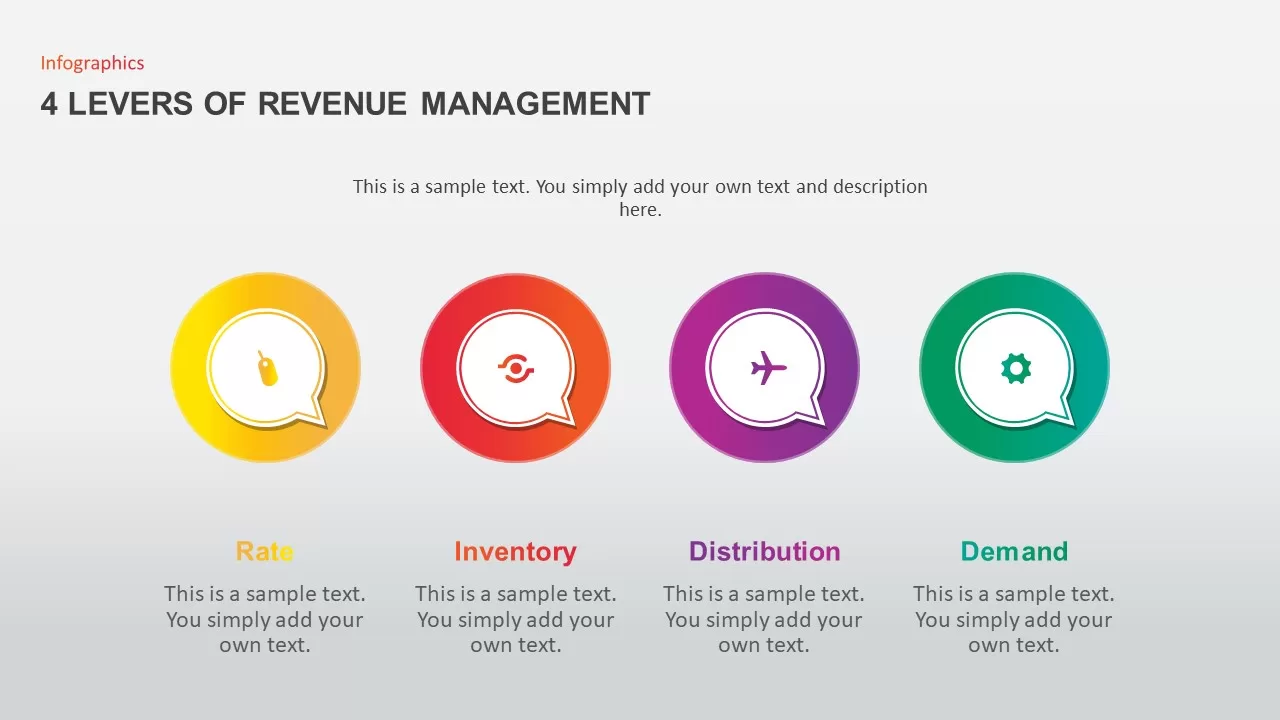
4 Levers of Revenue Management Infographic Template for PowerPoint & Google Slides
Infographics
Annual Recurring Revenue Metrics Template for PowerPoint & Google Slides
Bar/Column
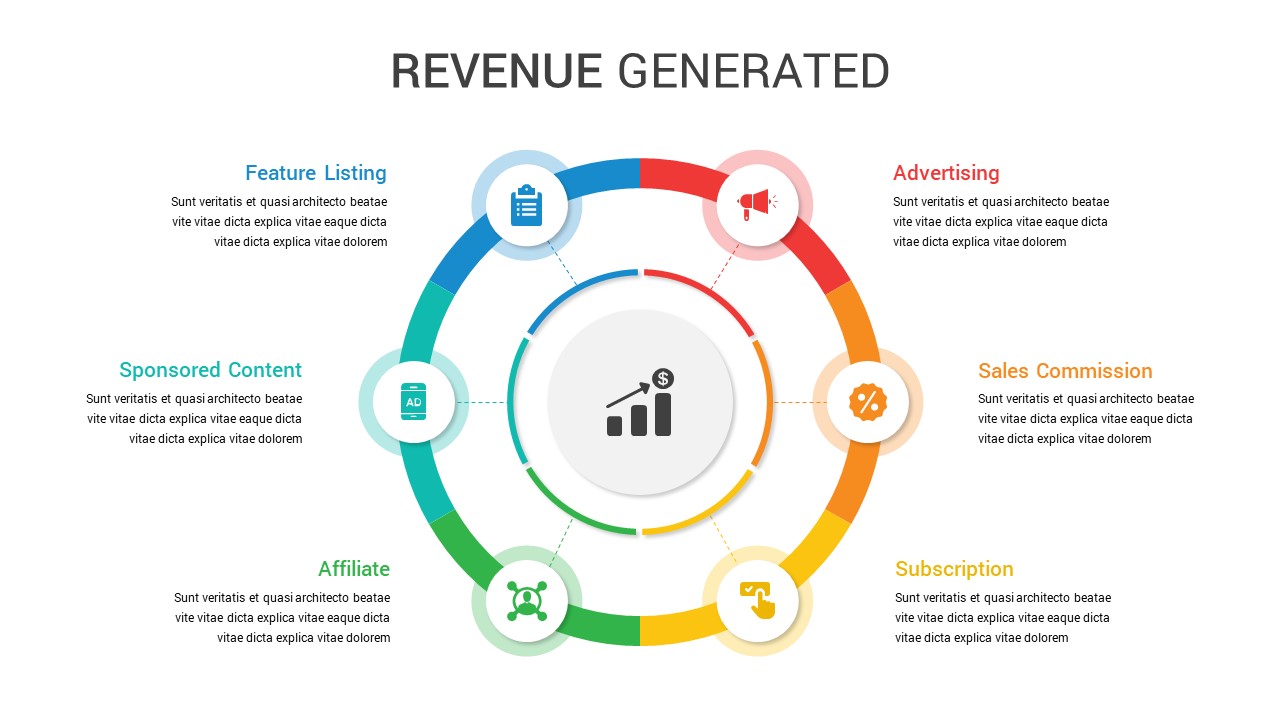
Circular Revenue Generation Diagram Template for PowerPoint & Google Slides
Revenue
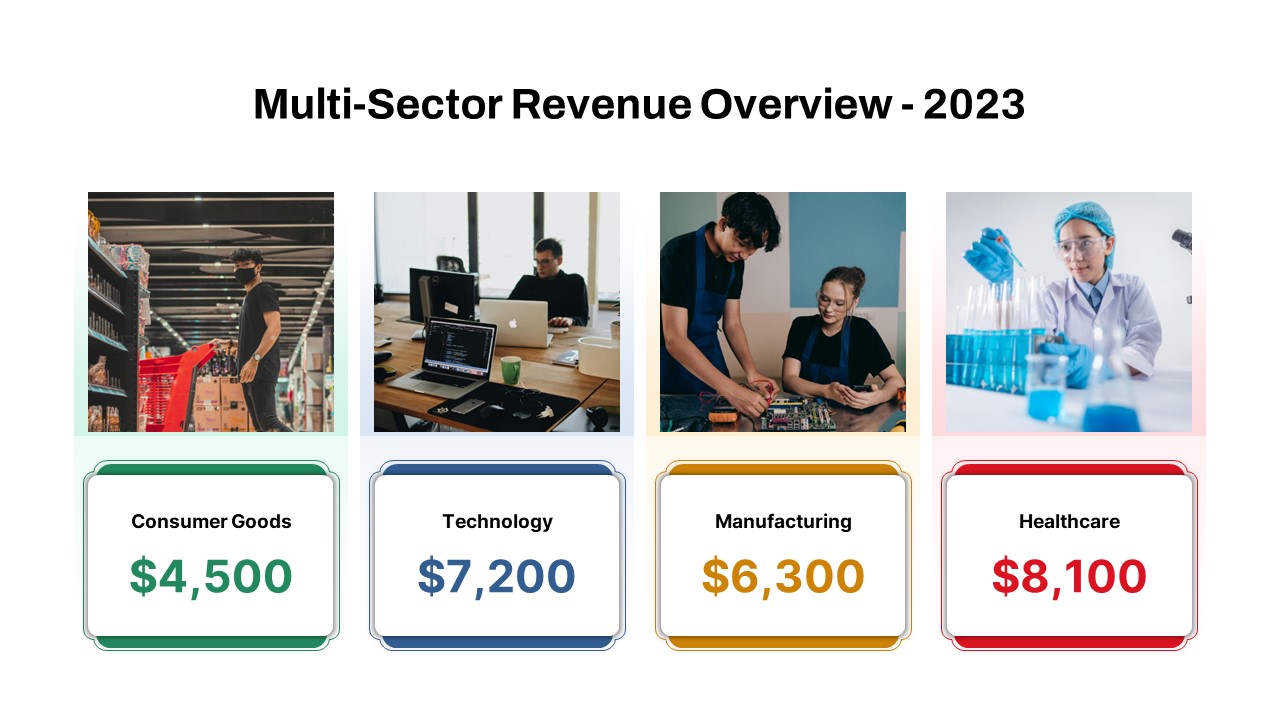
Multi-Sector Revenue Breakdown Cards Template for PowerPoint & Google Slides
Comparison
Regional Revenue Comparison Overview Template for PowerPoint & Google Slides
Comparison
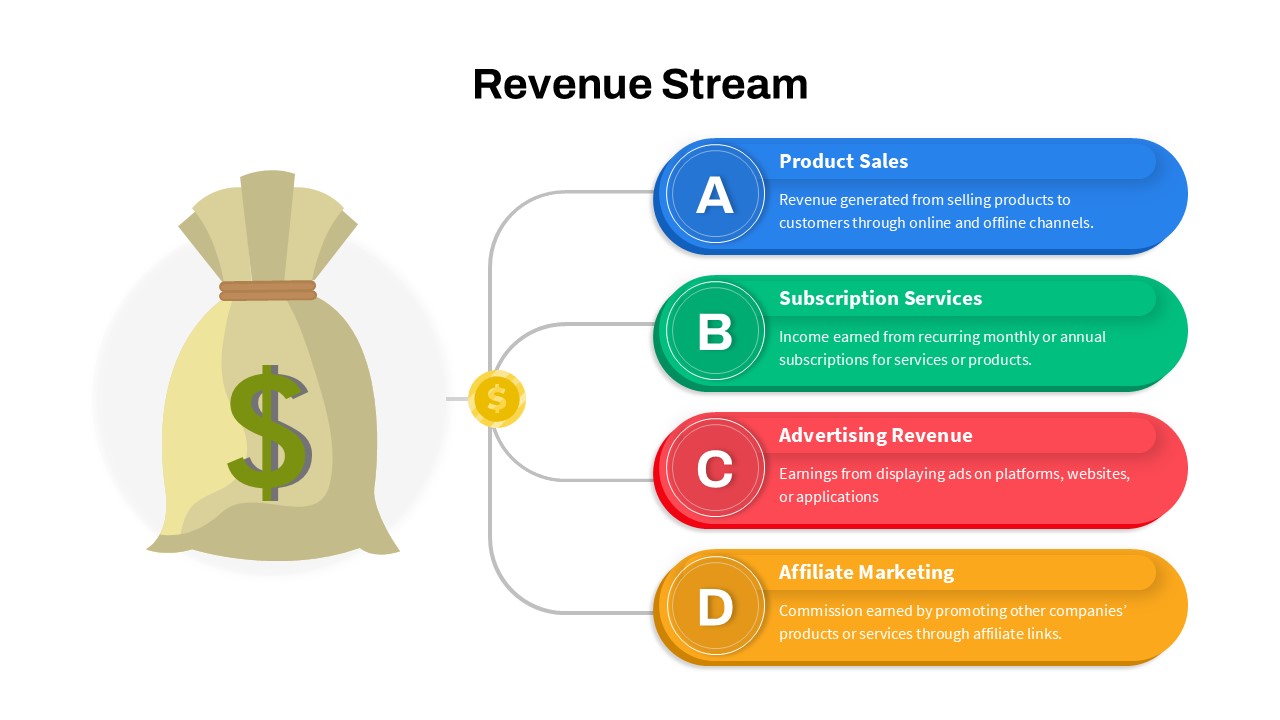
Revenue Streams: Four Channels Diagram Template for PowerPoint & Google Slides
Business Models
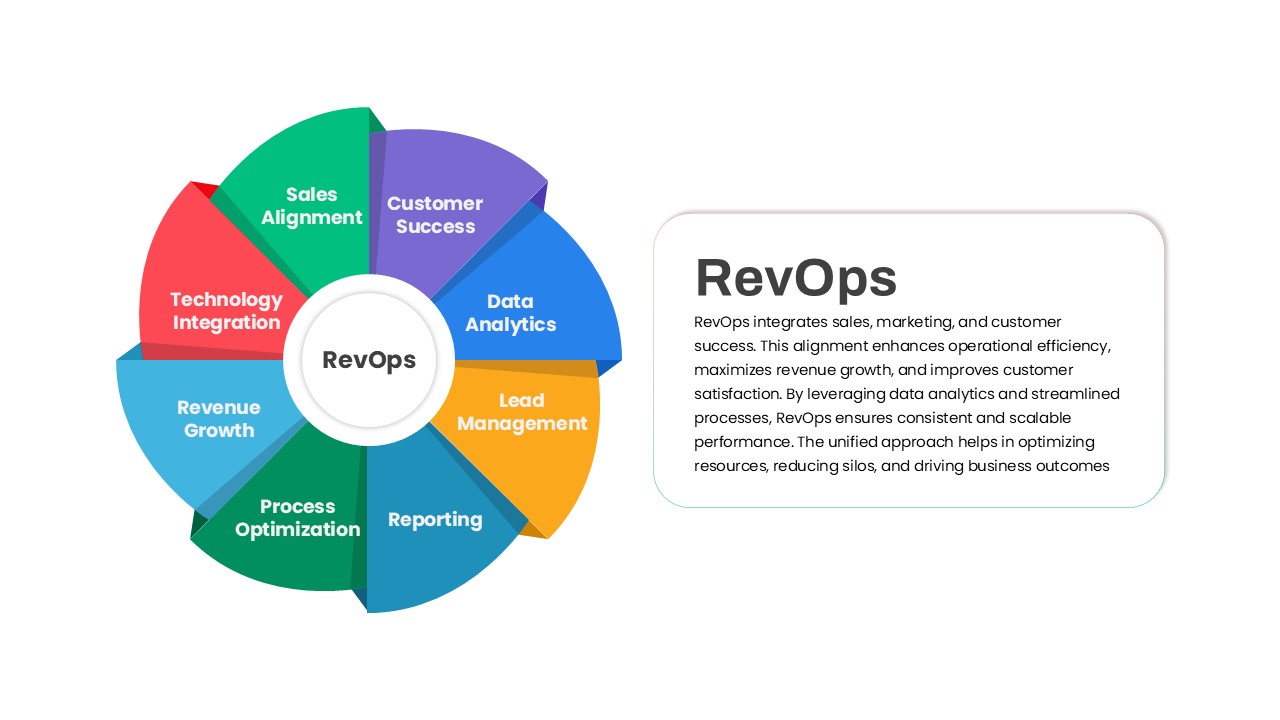
RevOps Revenue Operations Diagram Template for PowerPoint & Google Slides
Revenue
Six Revenue Stream Model Infographic Template for PowerPoint & Google Slides
Circular
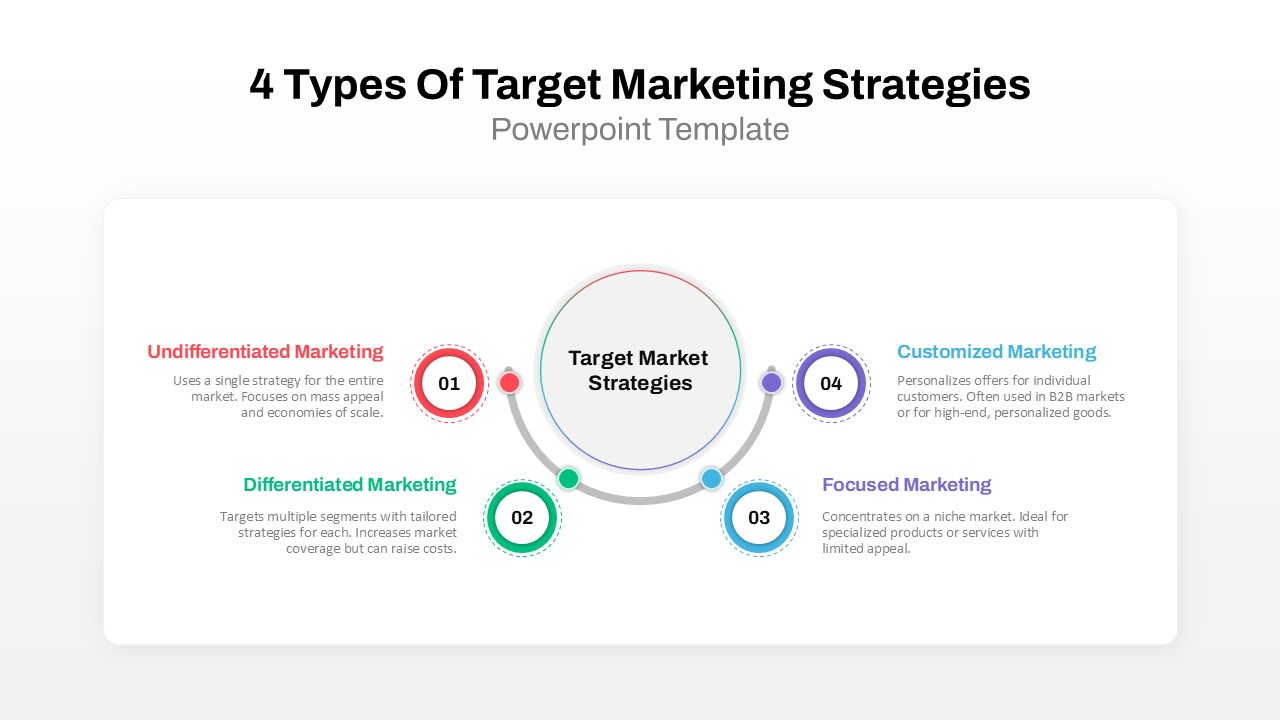
4 Types of Target Marketing Strategies PowerPoint Template for PowerPoint & Google Slides
Comparison
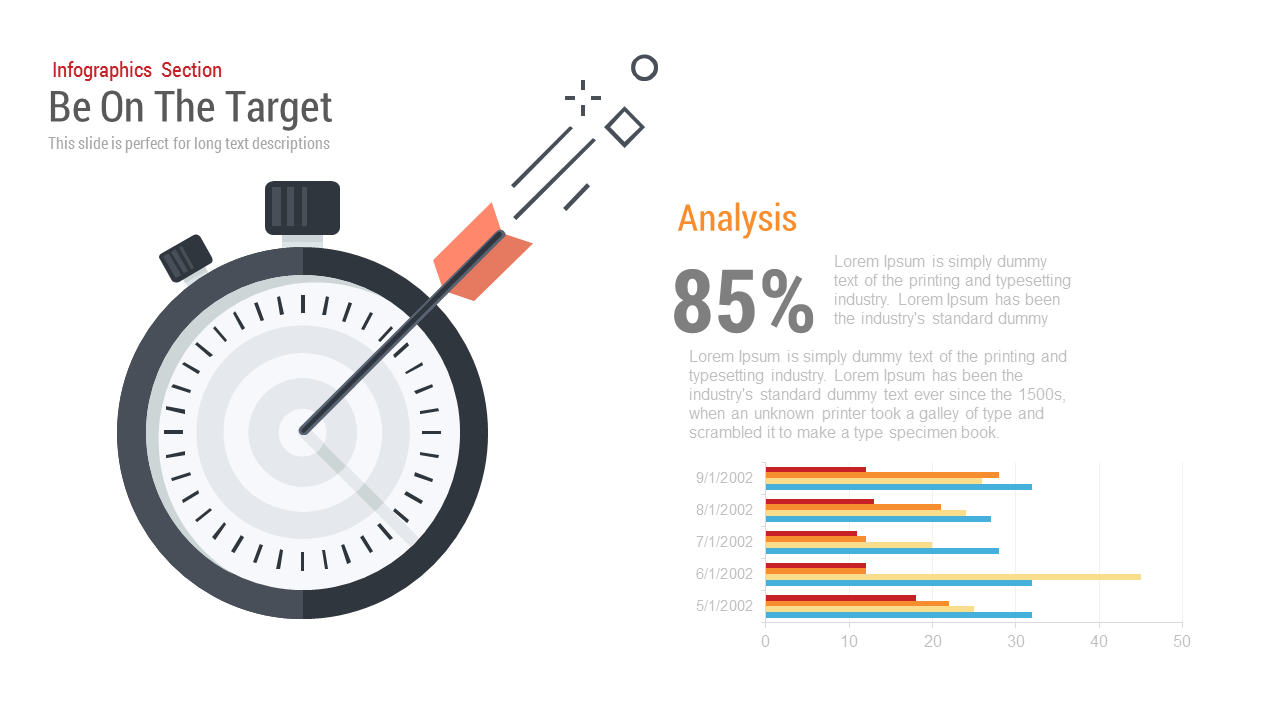
Be On The Target template for PowerPoint & Google Slides
Circular
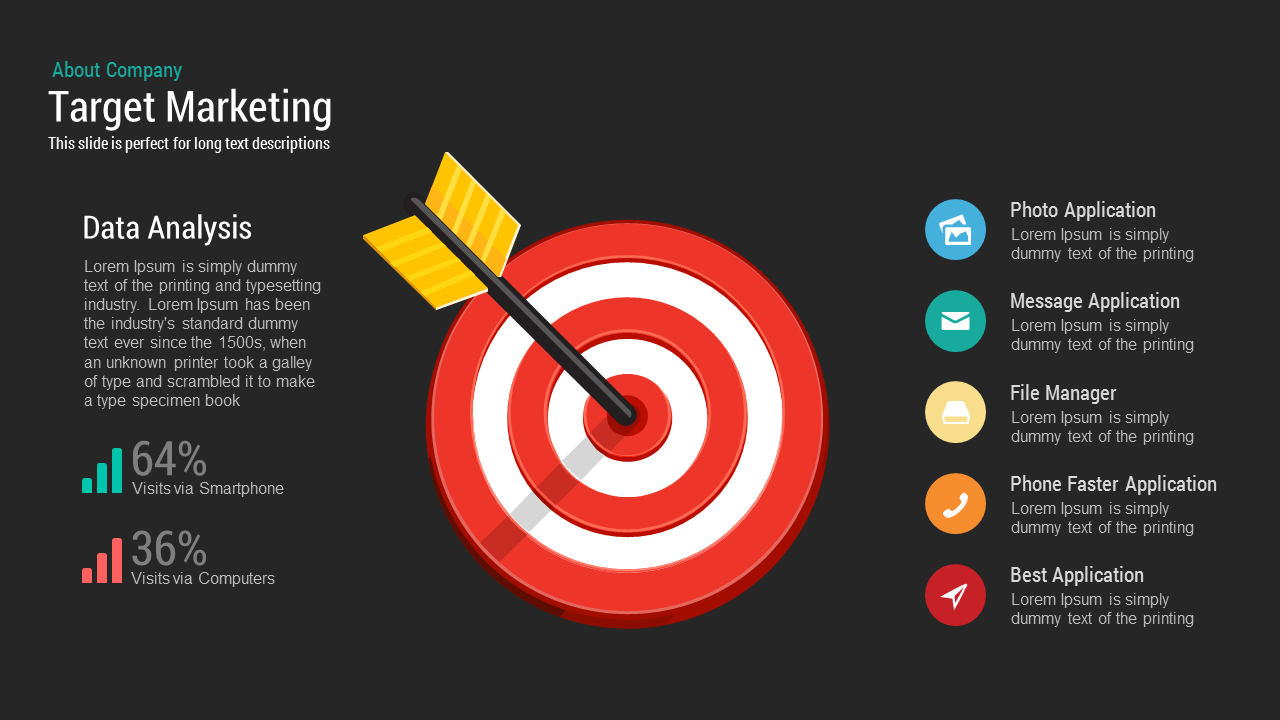
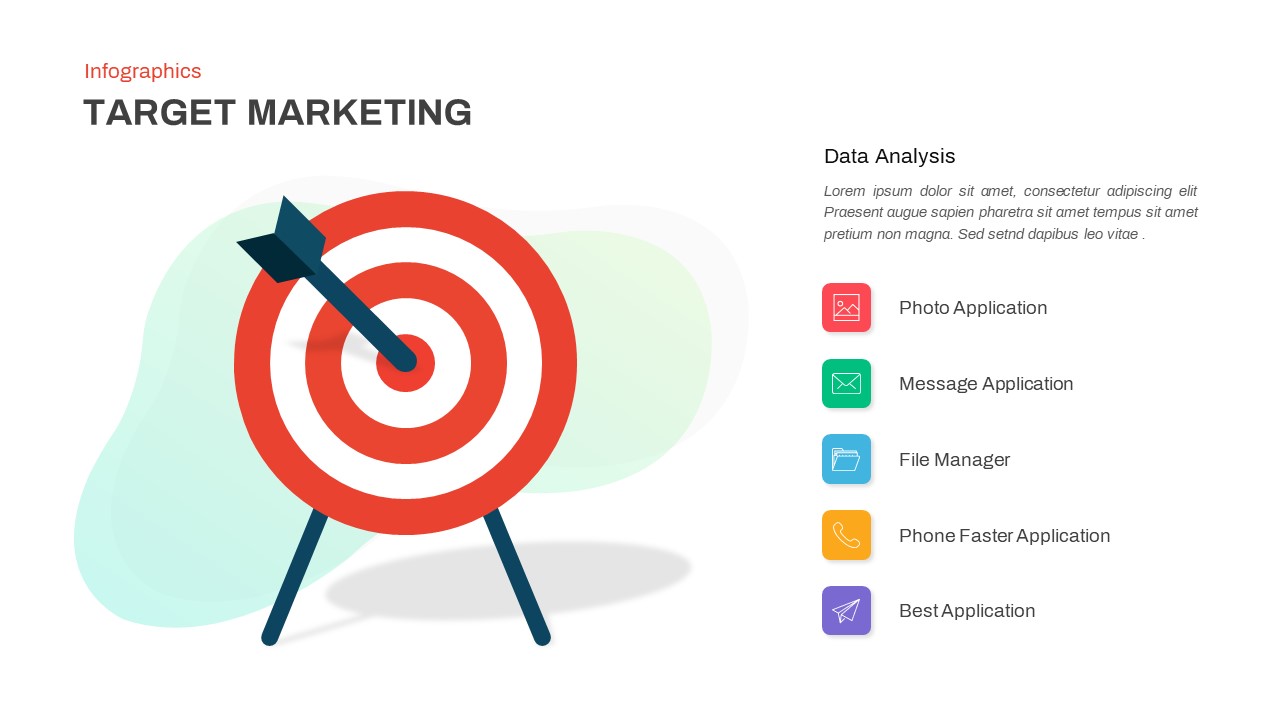
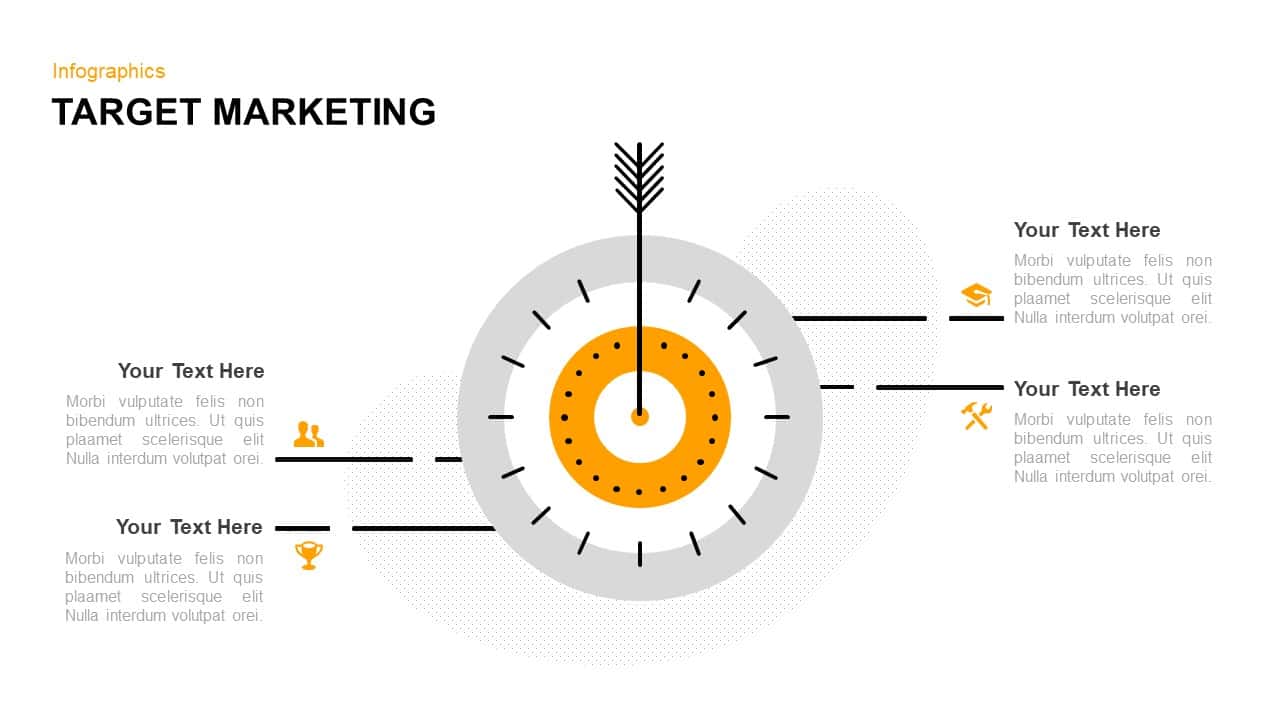
Target Marketing template for PowerPoint & Google Slides
Business
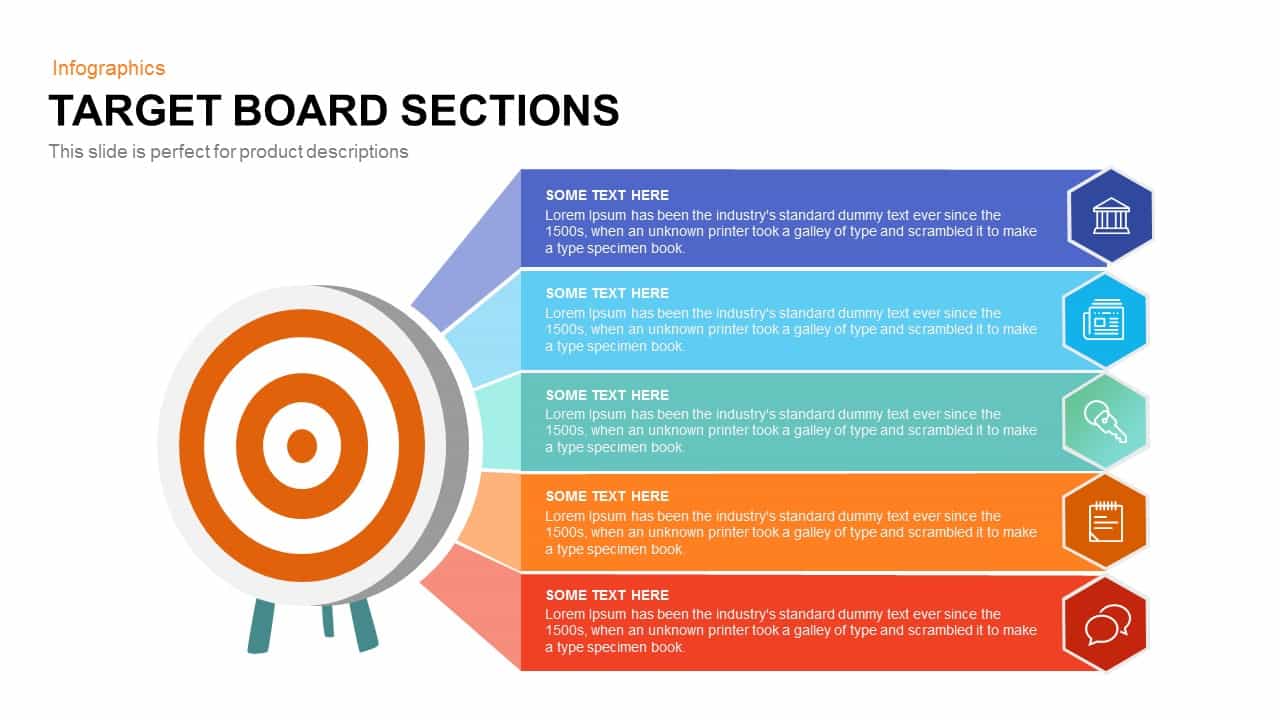
Target Board Sections Circular Diagram Template for PowerPoint & Google Slides
Circular
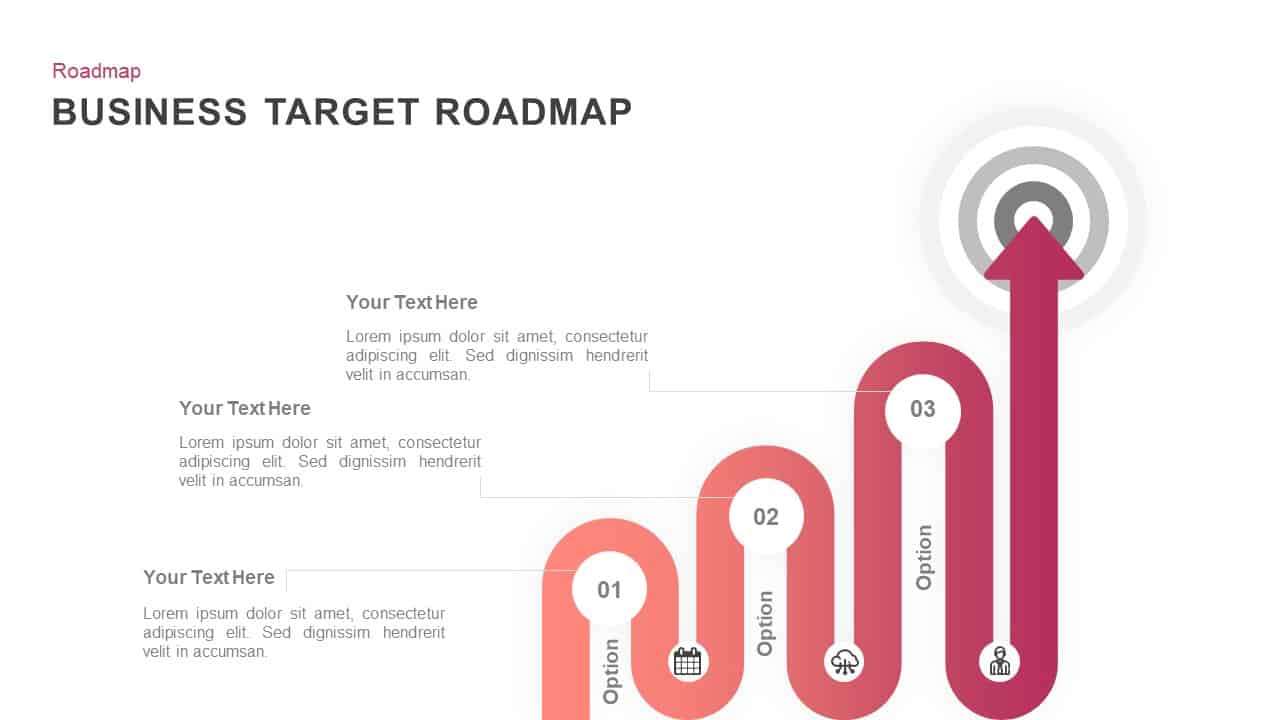
Business Target Milestone Roadmap Template for PowerPoint & Google Slides
Roadmap
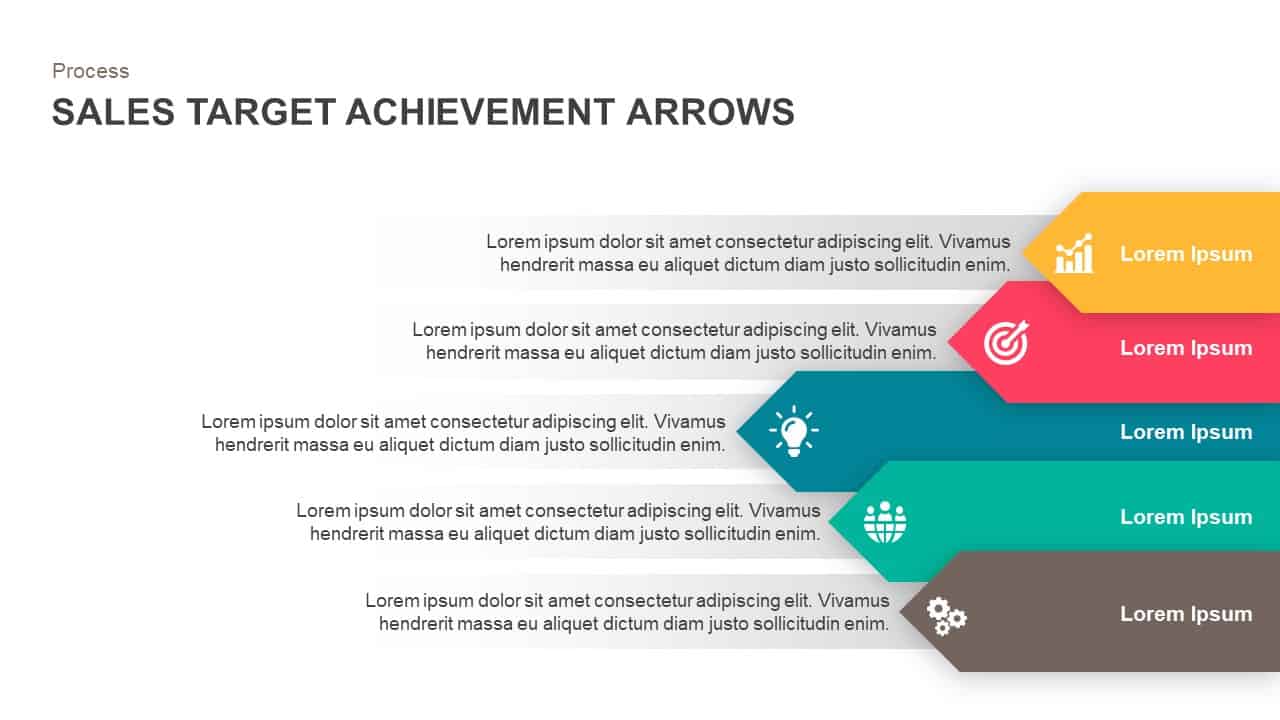
Sales Target Achievement Arrows Template for PowerPoint & Google Slides
Arrow
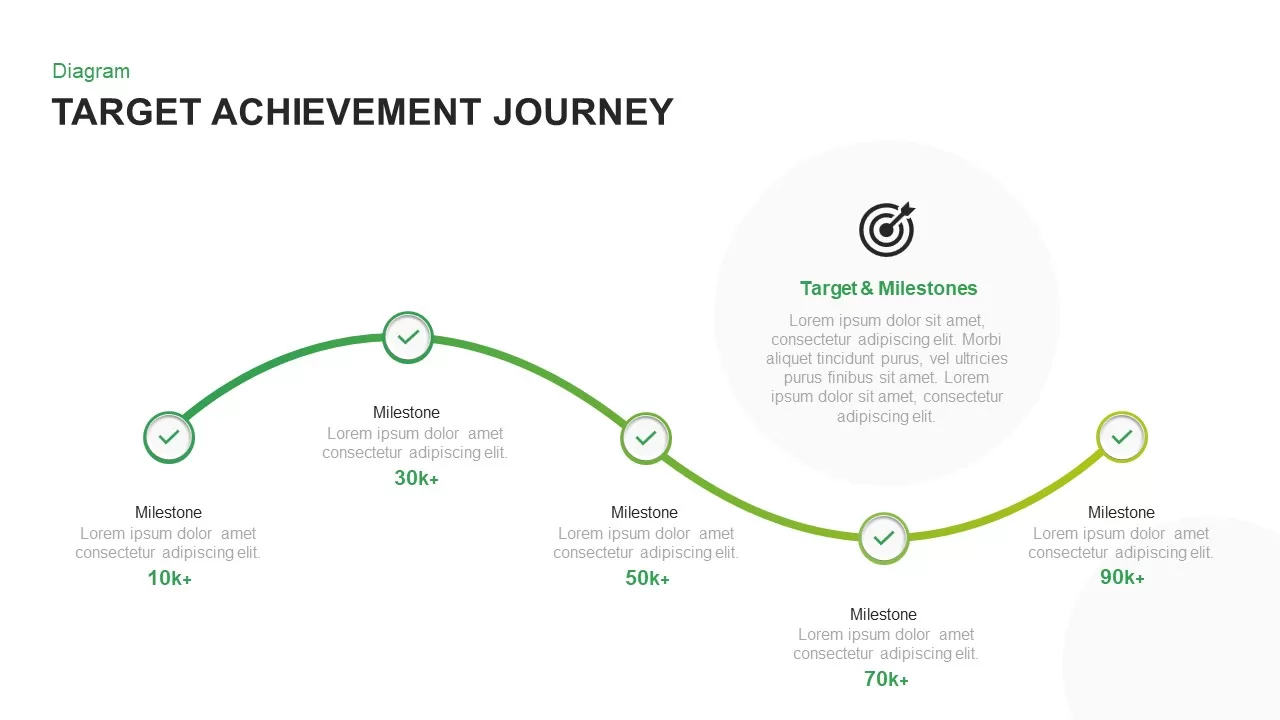
Target Achievement Milestone Curve Template for PowerPoint & Google Slides
Roadmap
Target Marketing Infographic Slide Pack Template for PowerPoint & Google Slides
Infographics
Target Marketing Infographic Callouts Template for PowerPoint & Google Slides
Circular
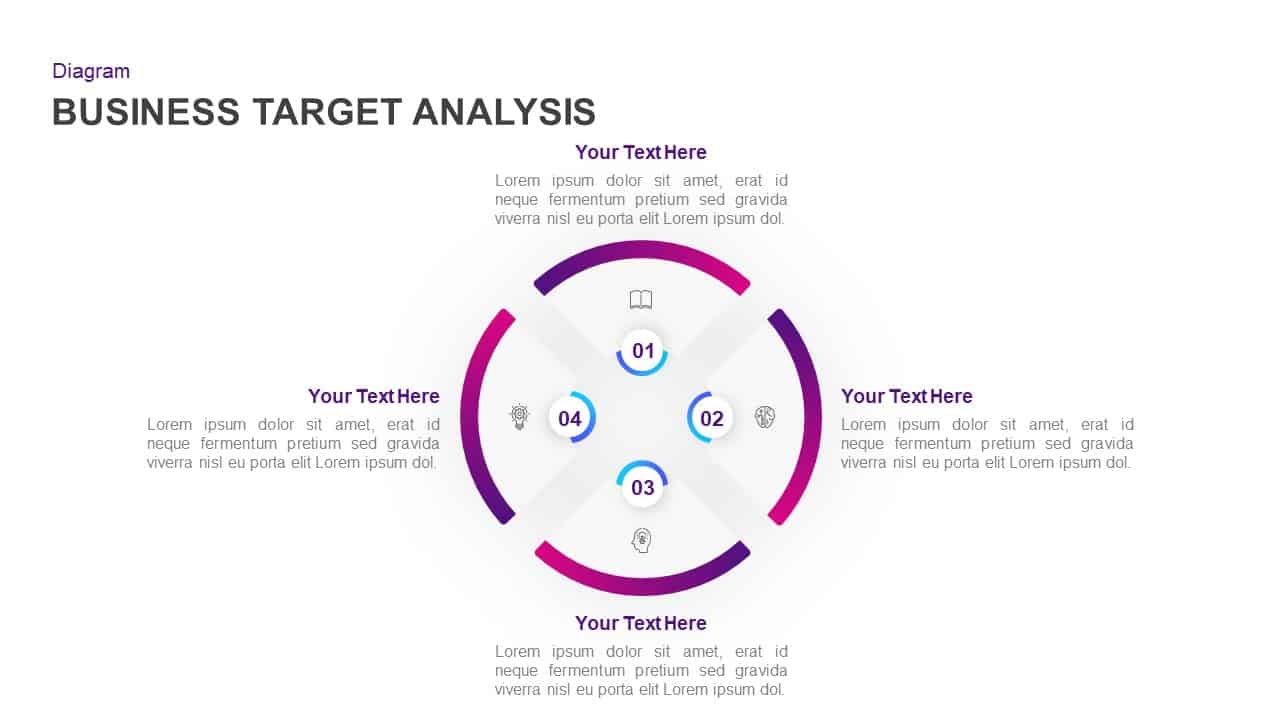
Business Target Analysis Diagram Template for PowerPoint & Google Slides
Circular
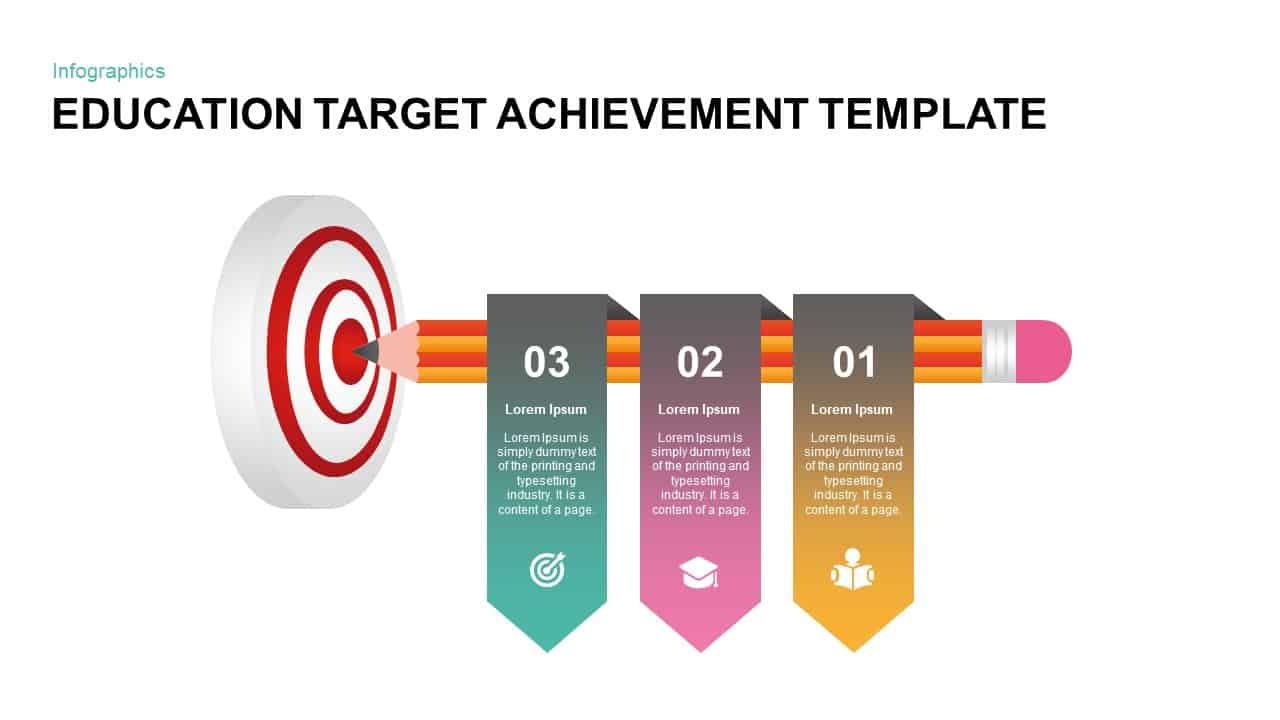
Education Target Achievement Infographic Template for PowerPoint & Google Slides
Goals
Goal Arrow and Target Infographic Template for PowerPoint & Google Slides
Goals
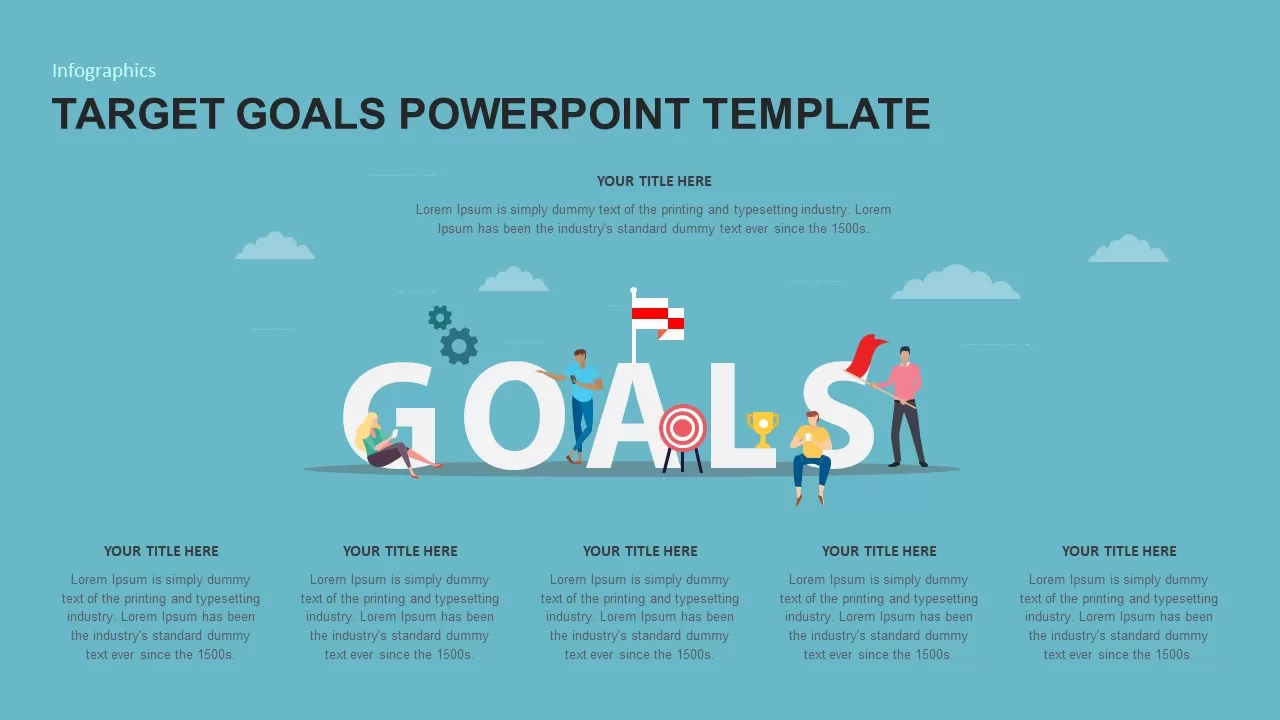
Target Goals Infographic Slide Template for PowerPoint & Google Slides
Goals
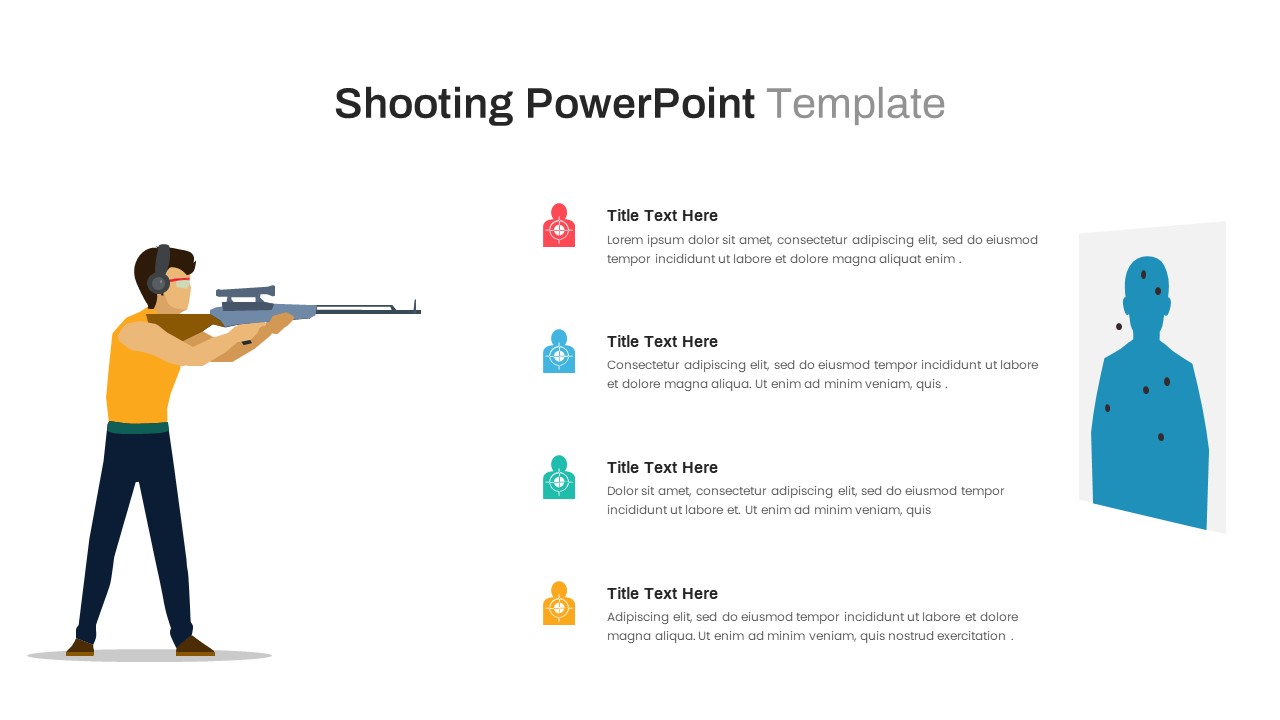
Shooting Target Process Infographic Template for PowerPoint & Google Slides
Process
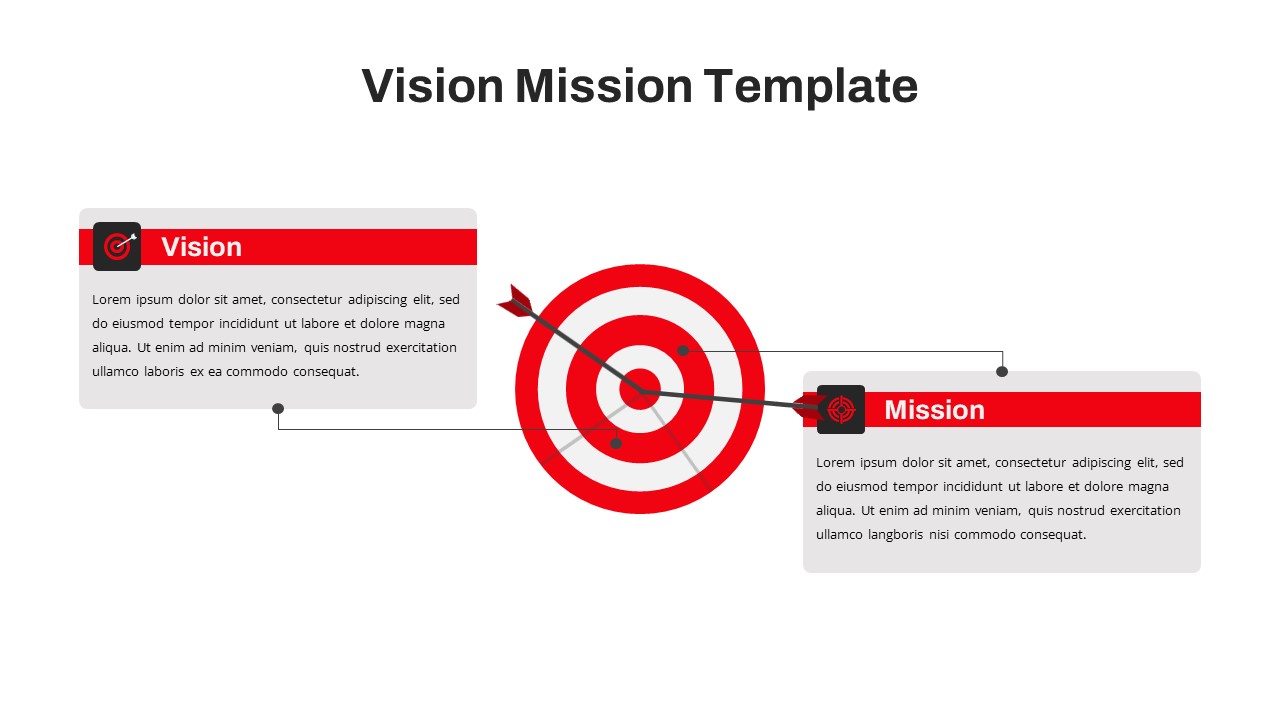
Free Vision and Mission Target Diagram Template for PowerPoint & Google Slides
Vision and Mission
Free
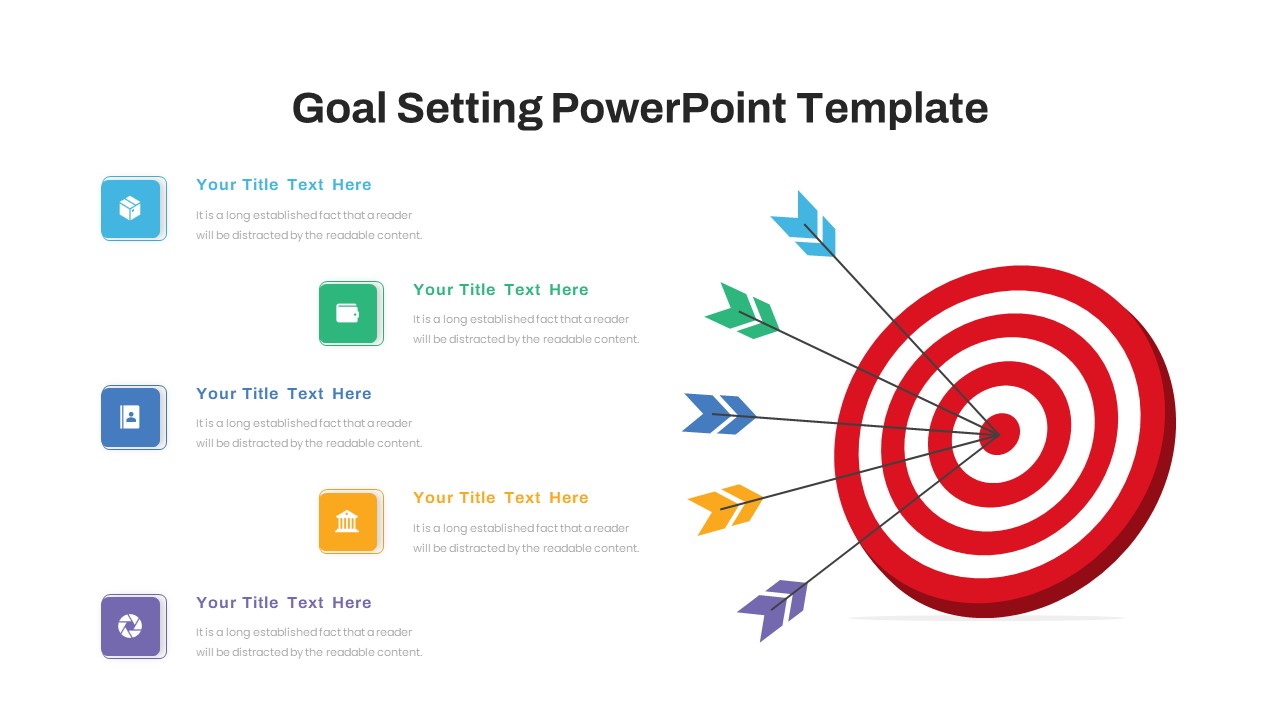
Free Goal Setting Target Infographic Slide Template for PowerPoint & Google Slides
Goals
Free
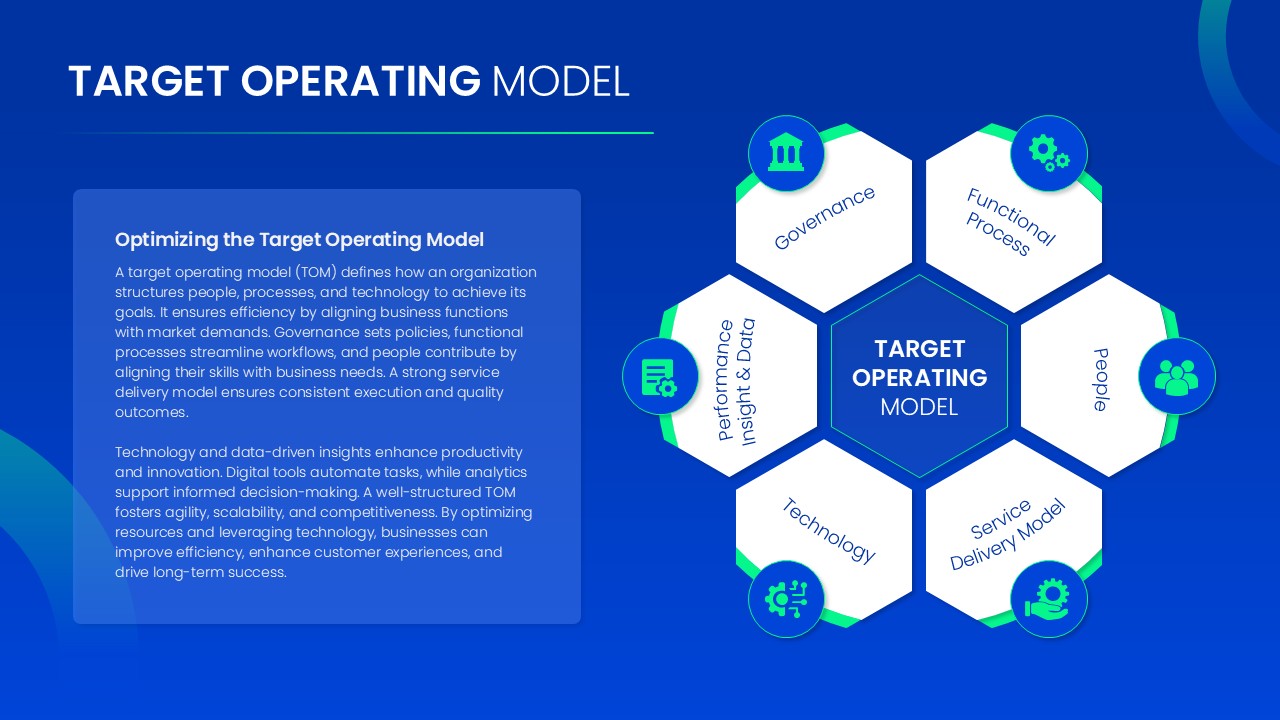
Target Operating Model Diagram Template for PowerPoint & Google Slides
Business Strategy
Two-Box Analysis & Target Comparison Template for PowerPoint & Google Slides
Comparison
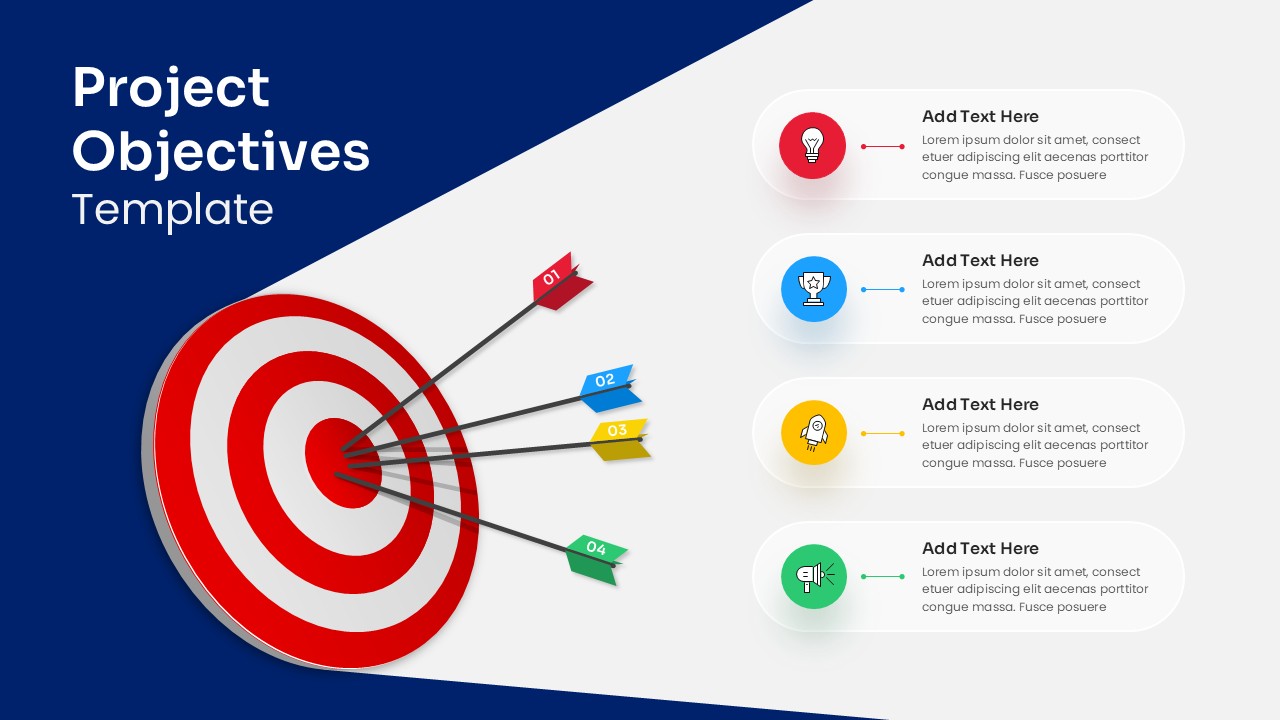
Project Objectives Target Diagram Template for PowerPoint & Google Slides
Goals
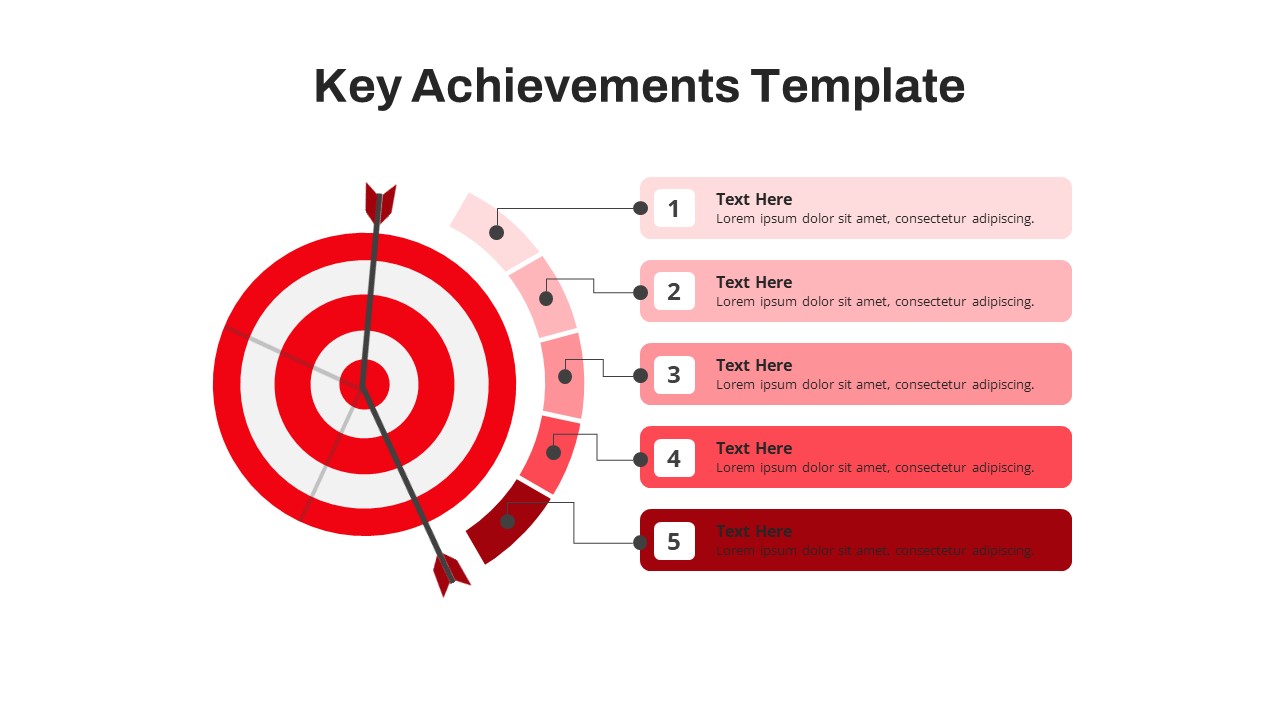
Free Target Milestone Achievements Slide for PowerPoint & Google Slides
Accomplishment
Free
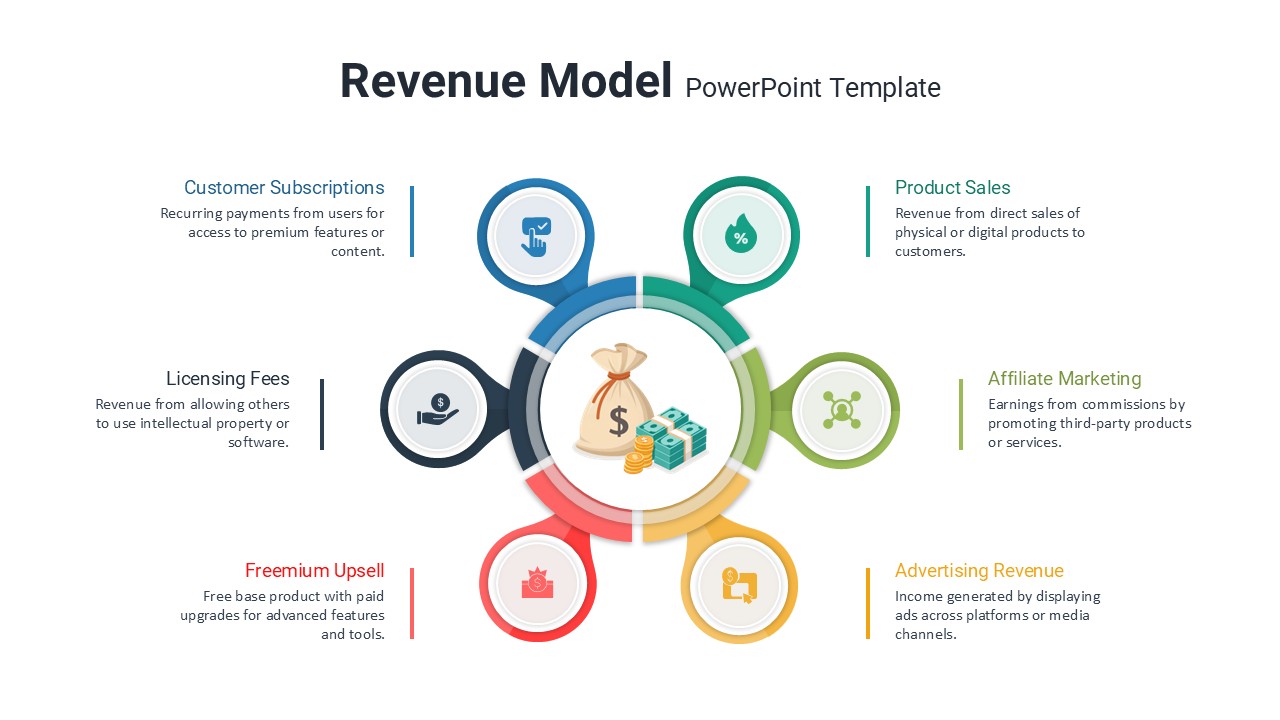
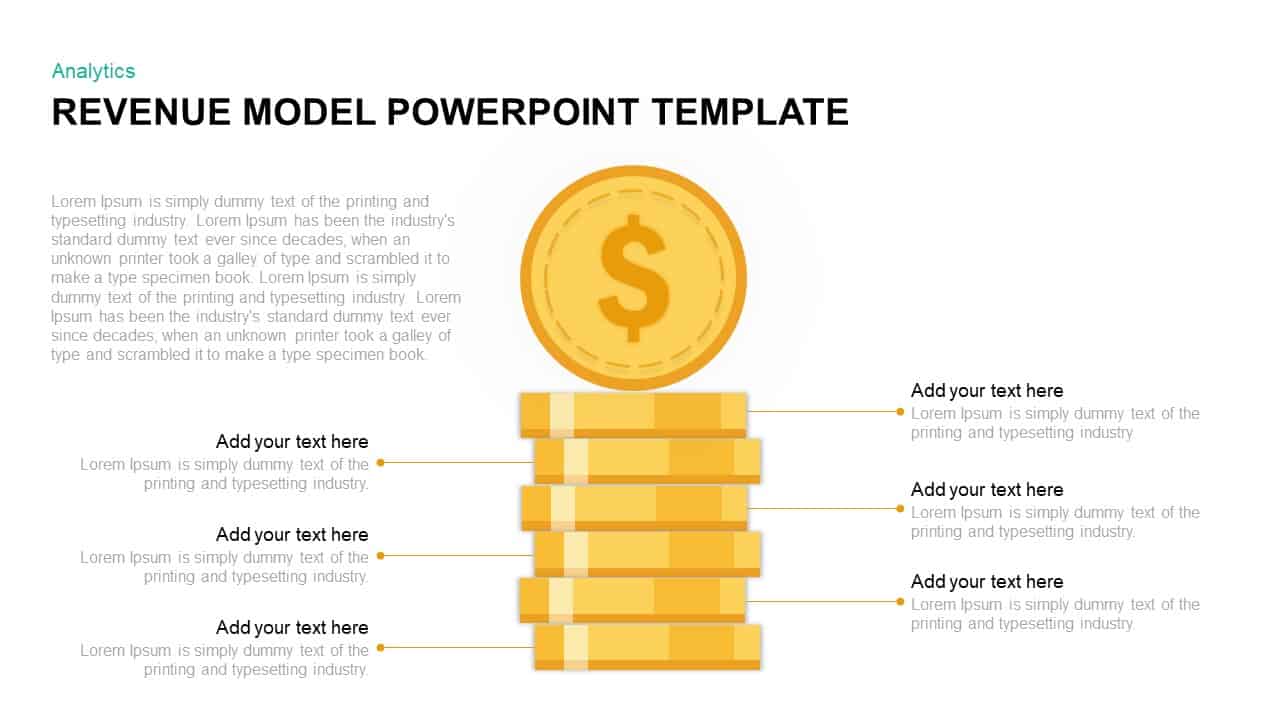
Revenue Model PowerPoint Template
Finance
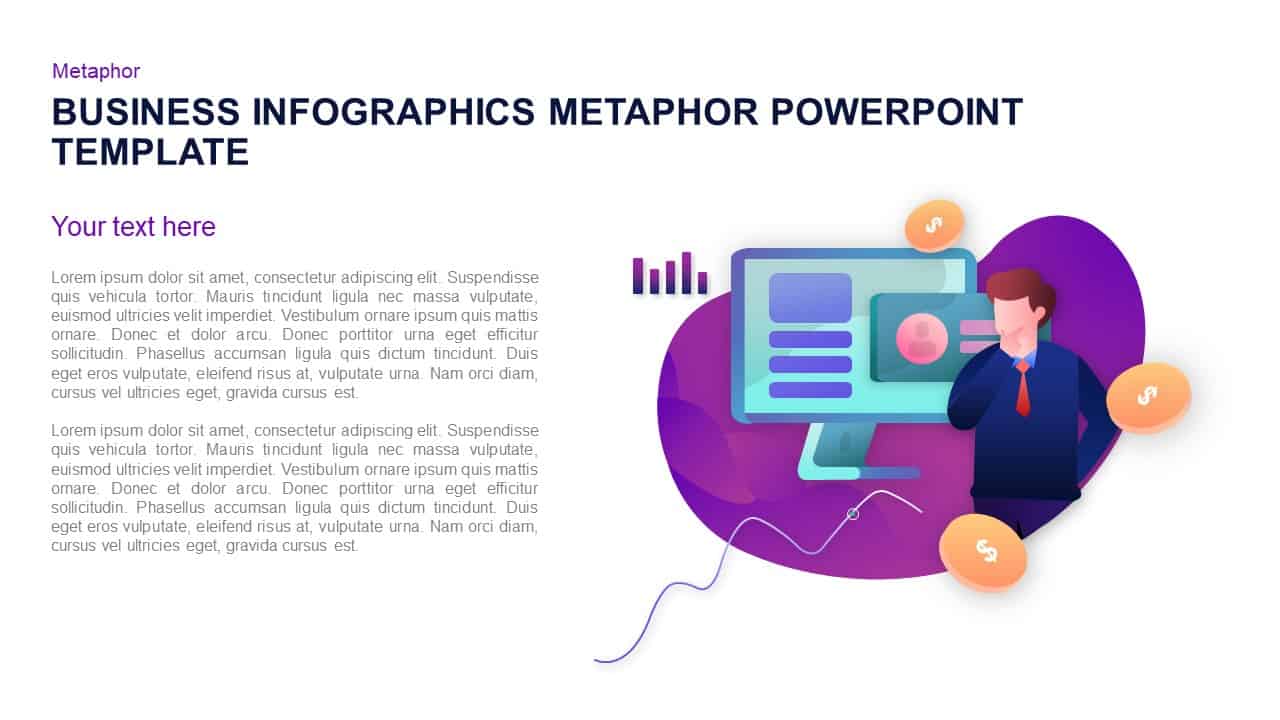
Business Growth Metaphor Chart Template for PowerPoint & Google Slides
Business
Growth Curve Line Chart Visualization Template for PowerPoint & Google Slides
Charts
Annual Growth Trend Analysis Chart template for PowerPoint & Google Slides
Business Report
Sales Growth Comparison Chart & Table Template for PowerPoint & Google Slides
Bar/Column
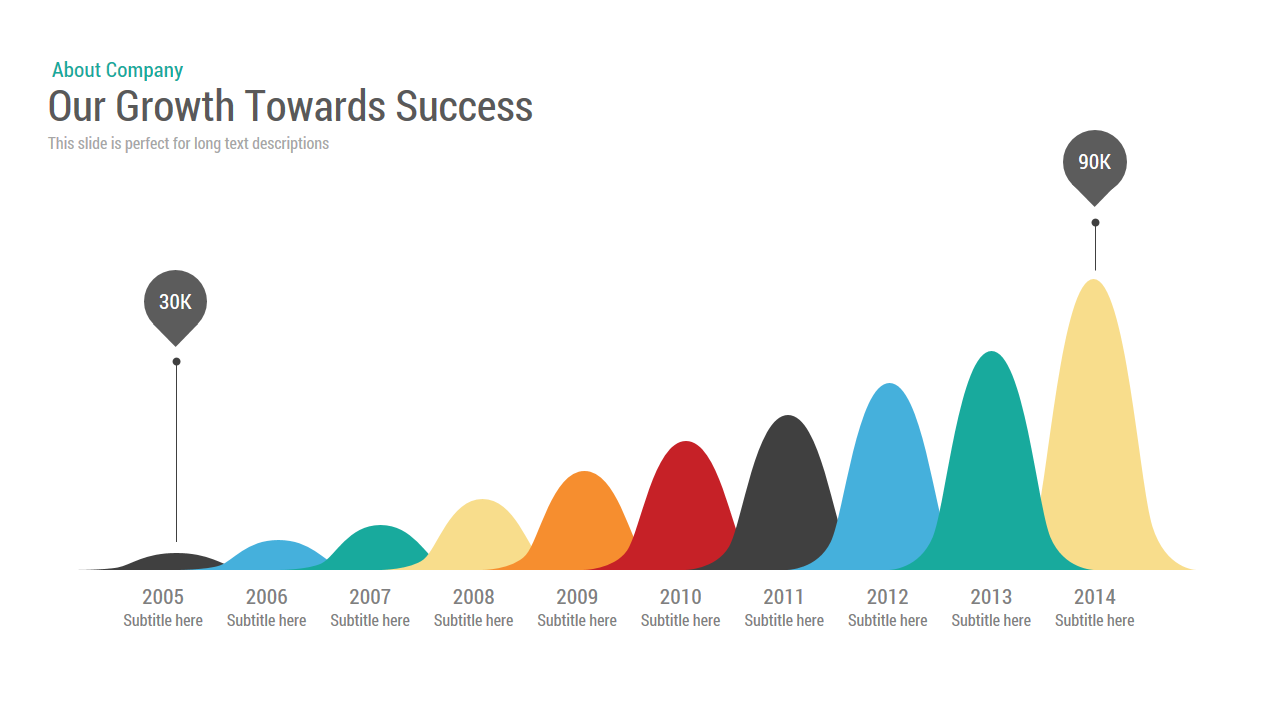
Growth Timeline template for PowerPoint & Google Slides
Timeline
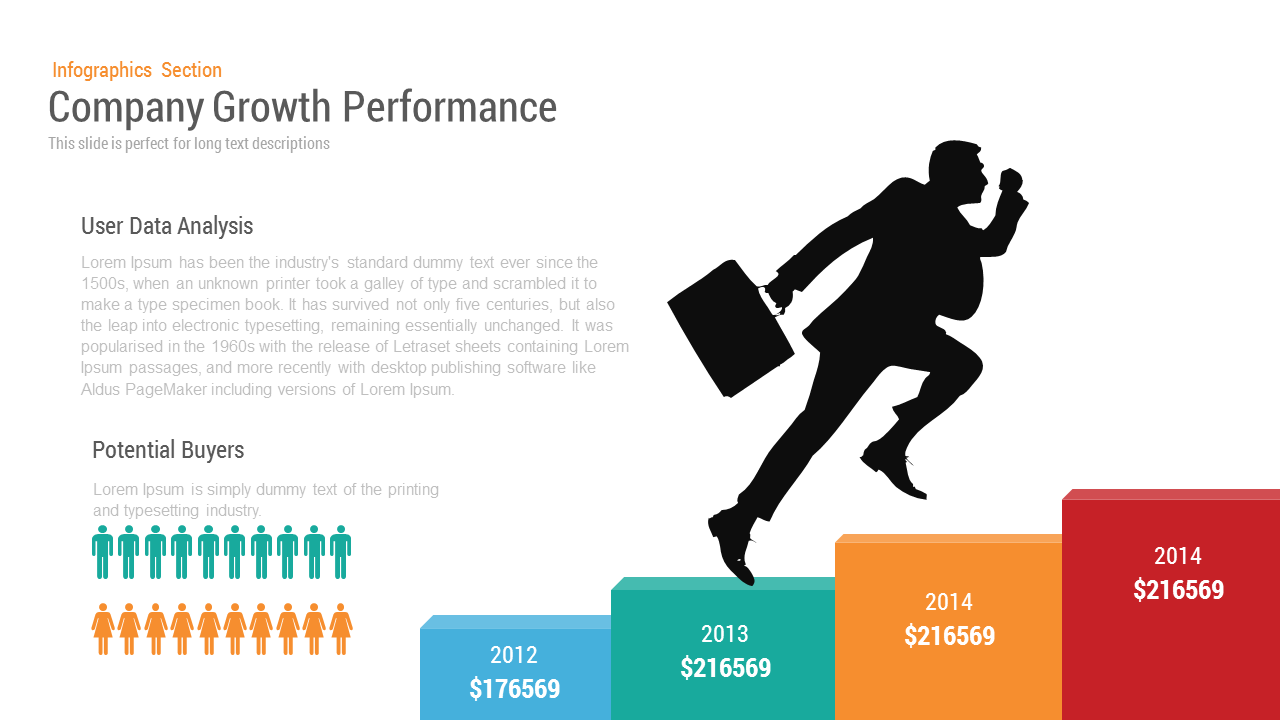
Company Growth template for PowerPoint & Google Slides
Charts
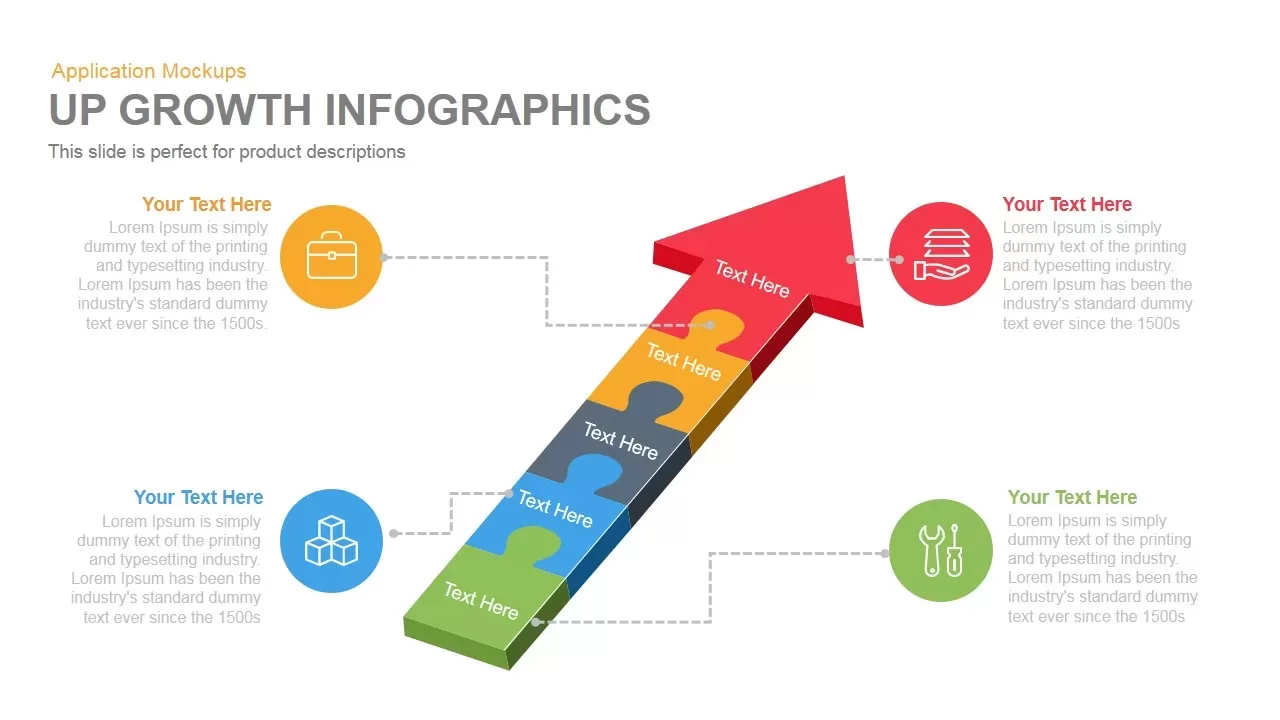
Growth Infographics template for PowerPoint & Google Slides
Arrow
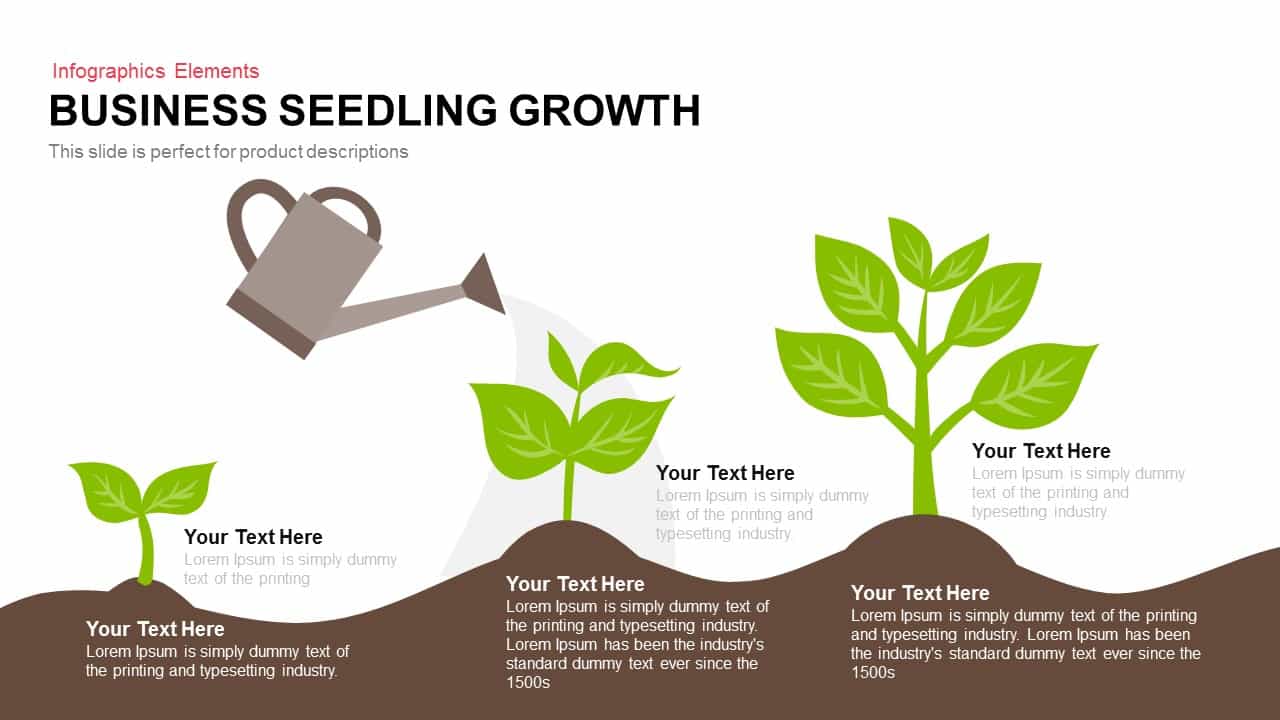
Business Seedling Growth Template for PowerPoint & Google Slides
Infographics
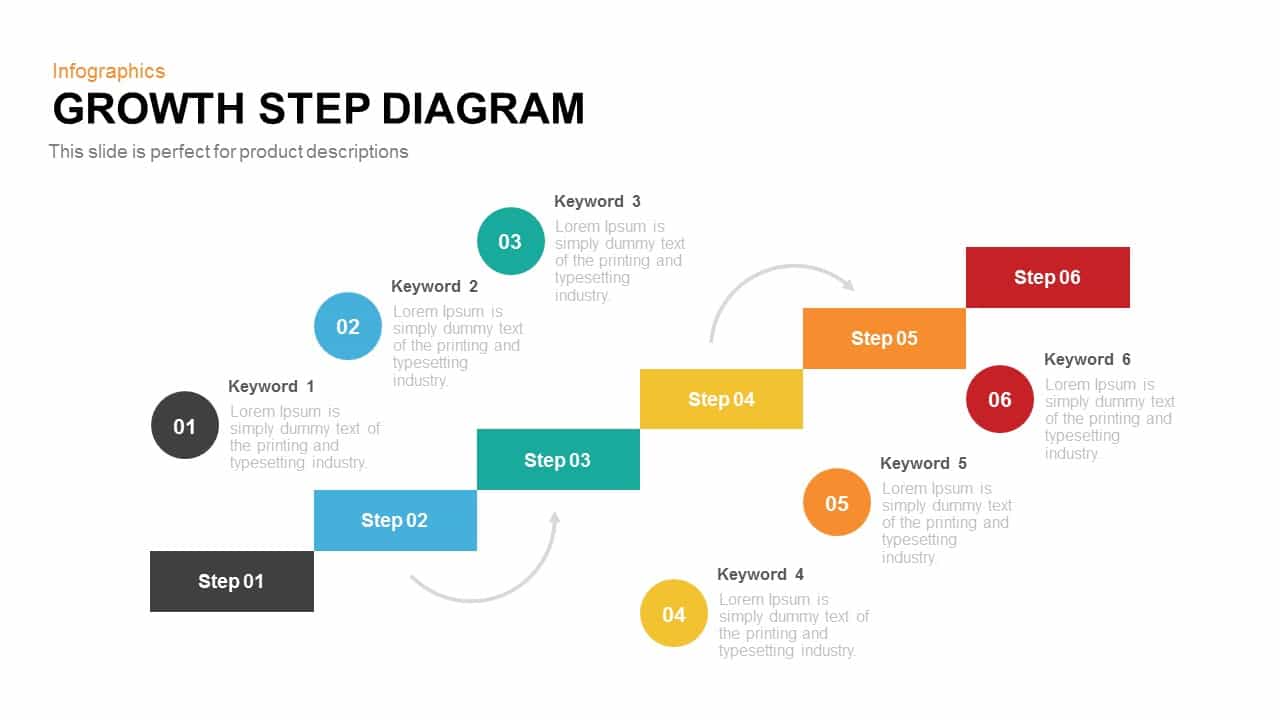
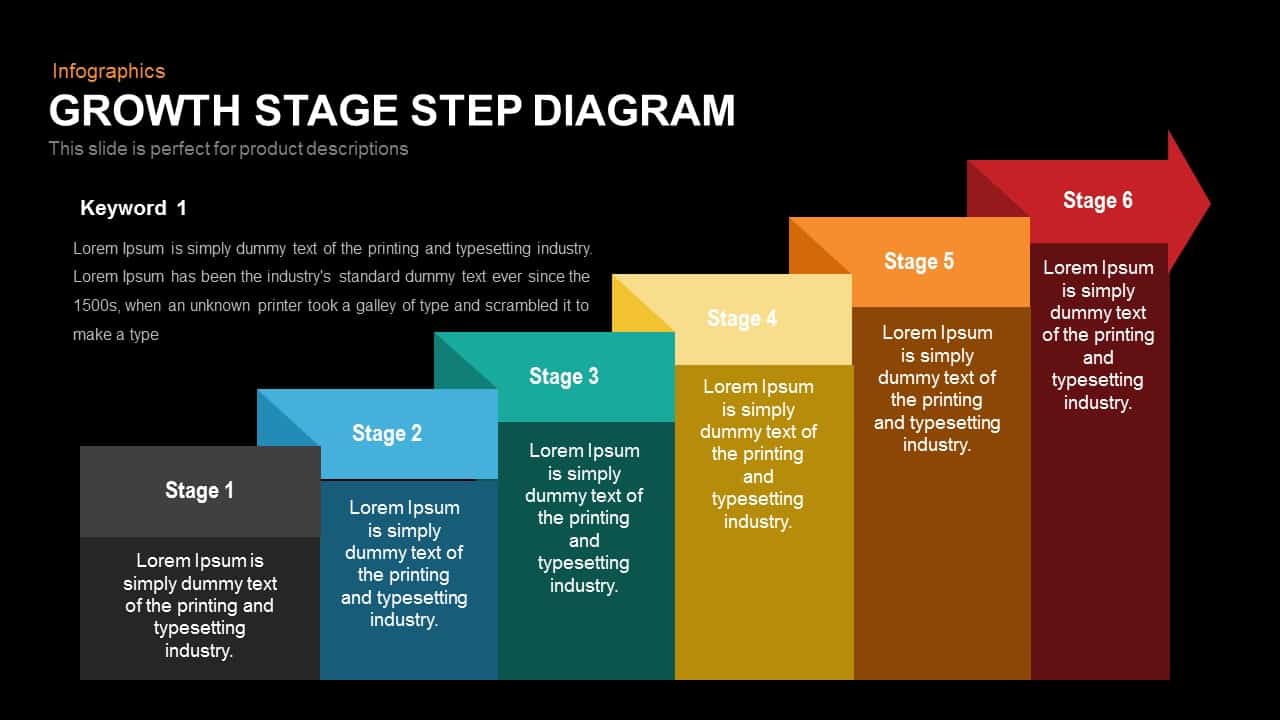
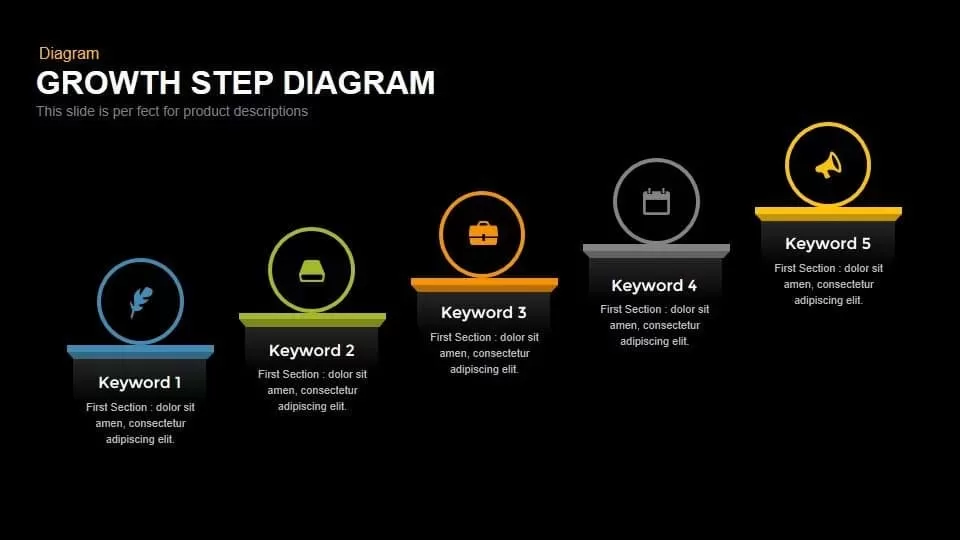
Growth Step Diagram template for PowerPoint & Google Slides
Infographics
Growth Stage Diagram template for PowerPoint & Google Slides
Process
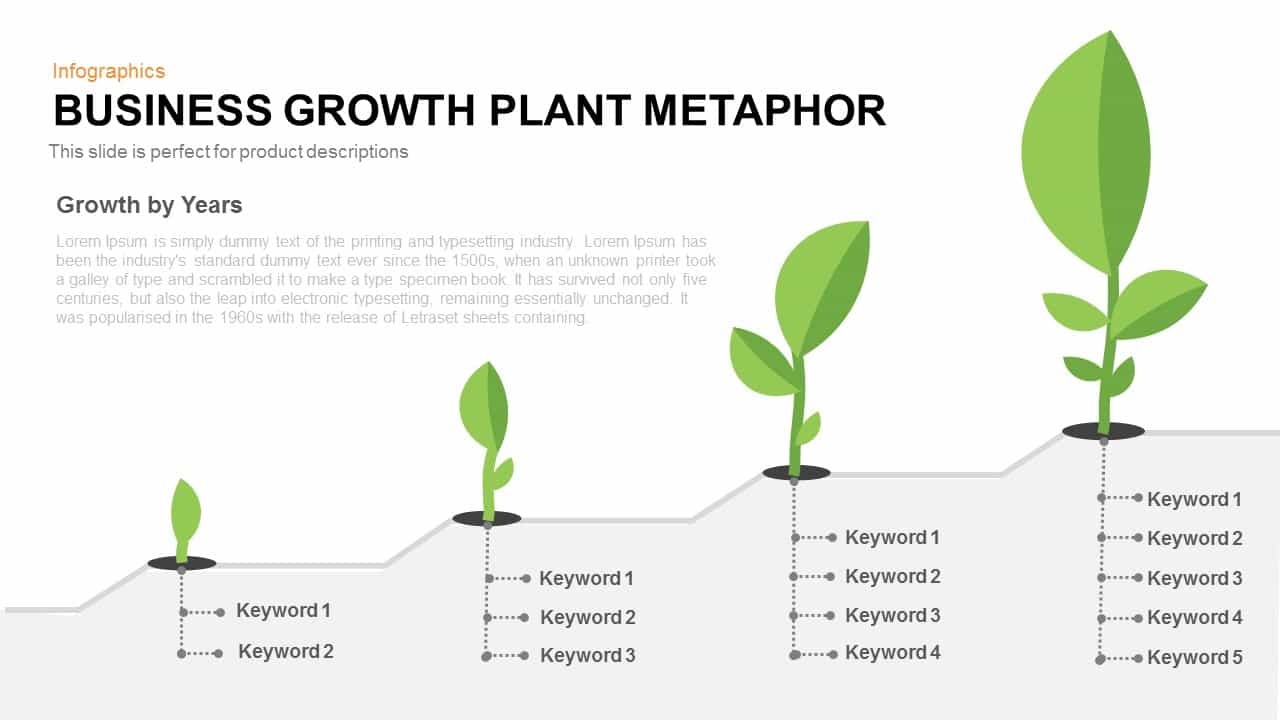
Business Growth Plant Metaphor Timeline Template for PowerPoint & Google Slides
Business Strategy
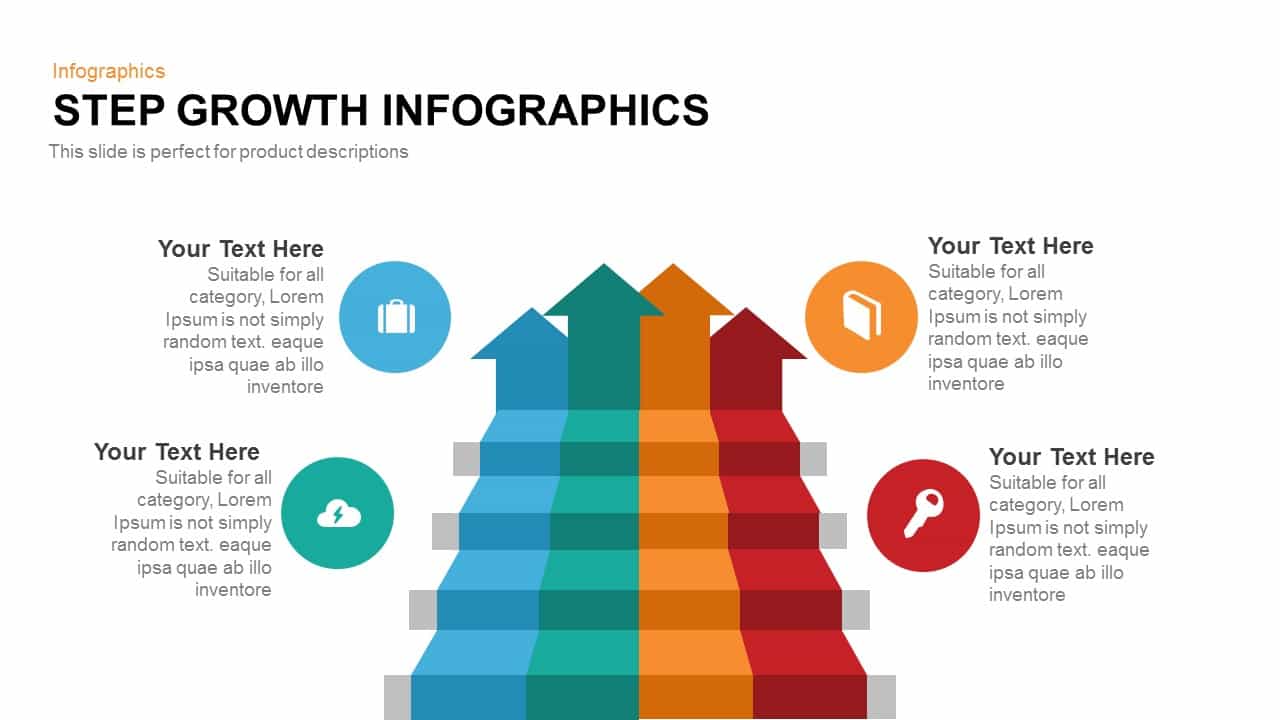
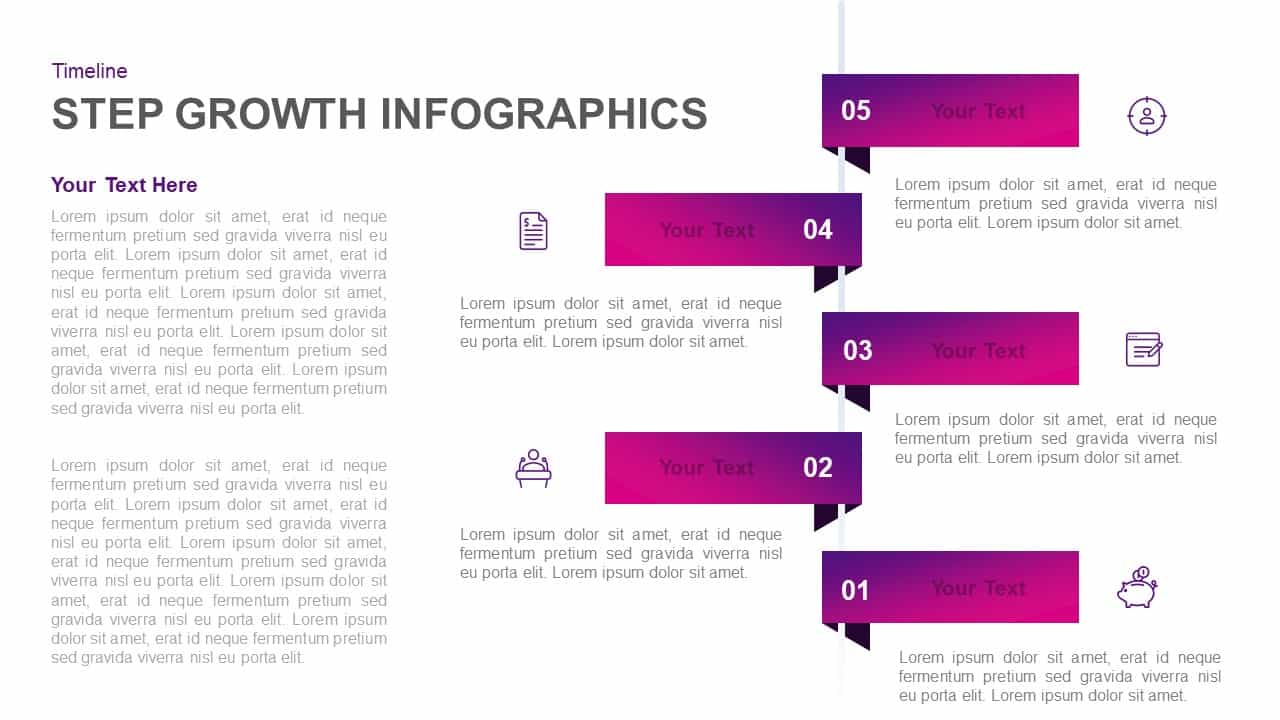
Modern Step Growth Infographics Template for PowerPoint & Google Slides
Process
Five 3D Growth Arrow Infographic Slide Template for PowerPoint & Google Slides
Arrow
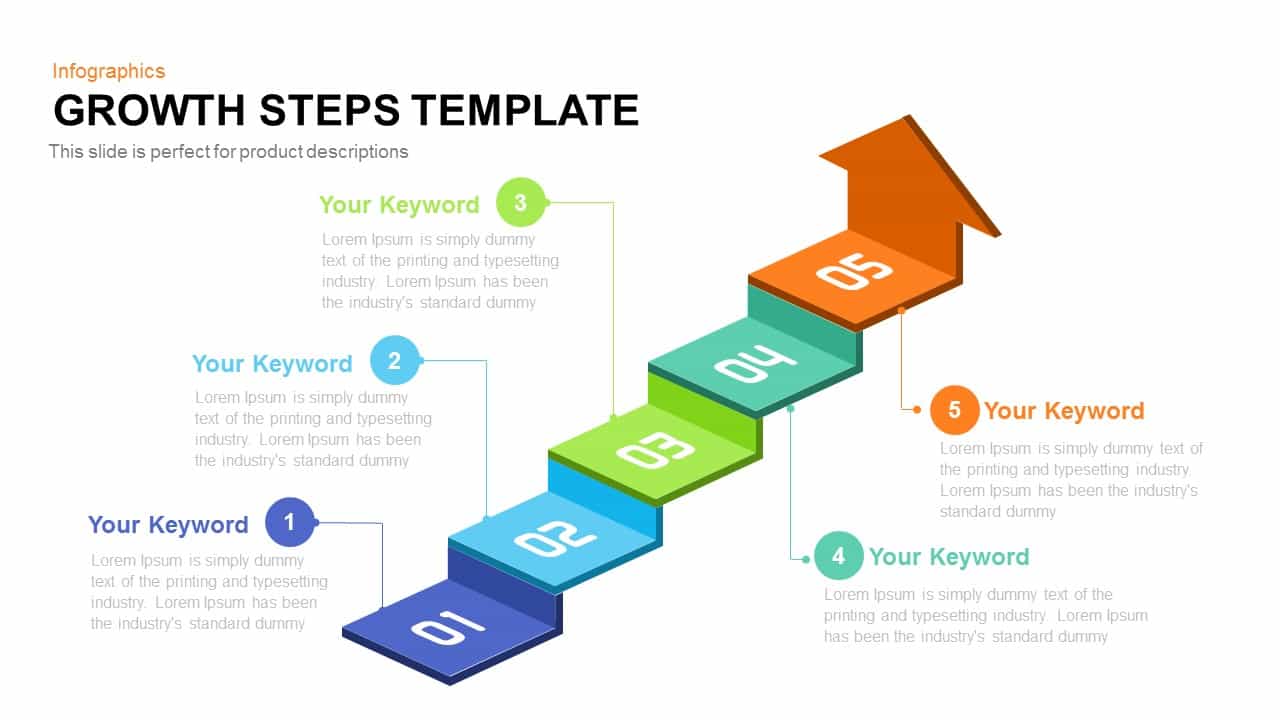
5-Step Growth Staircase Infographic Template for PowerPoint & Google Slides
Process
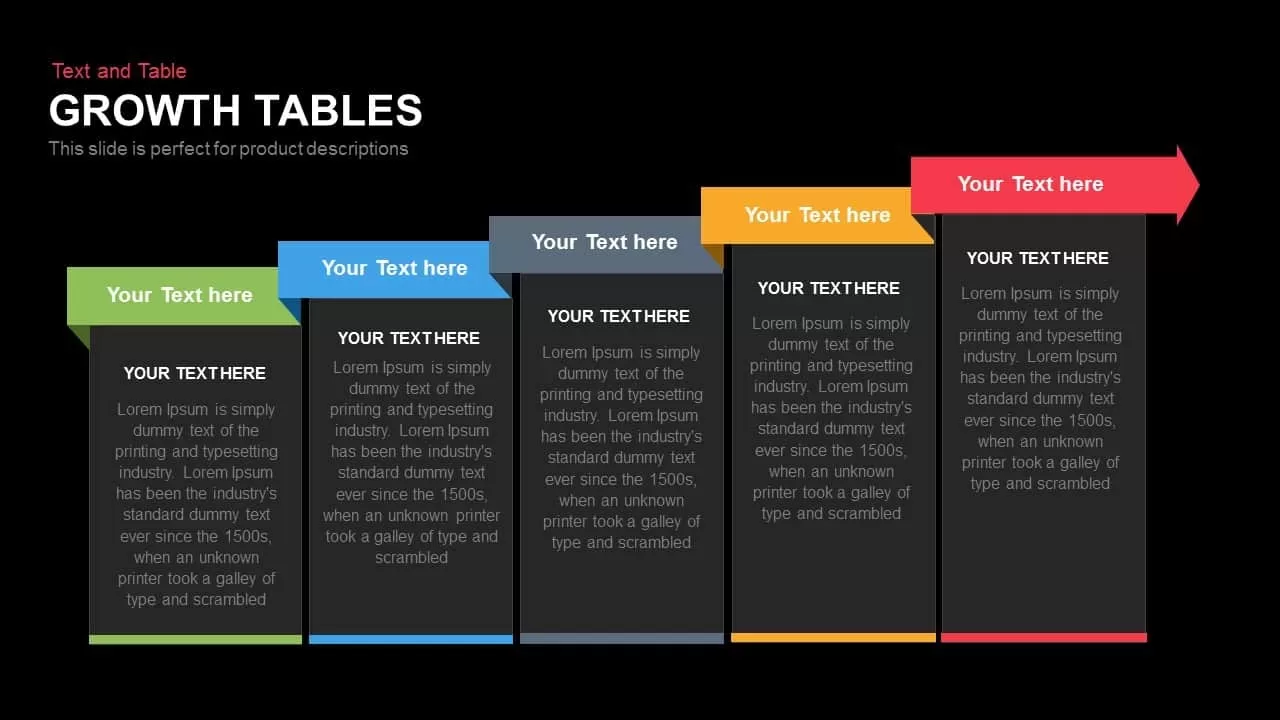
Growth Tables Slide template for PowerPoint & Google Slides
Process

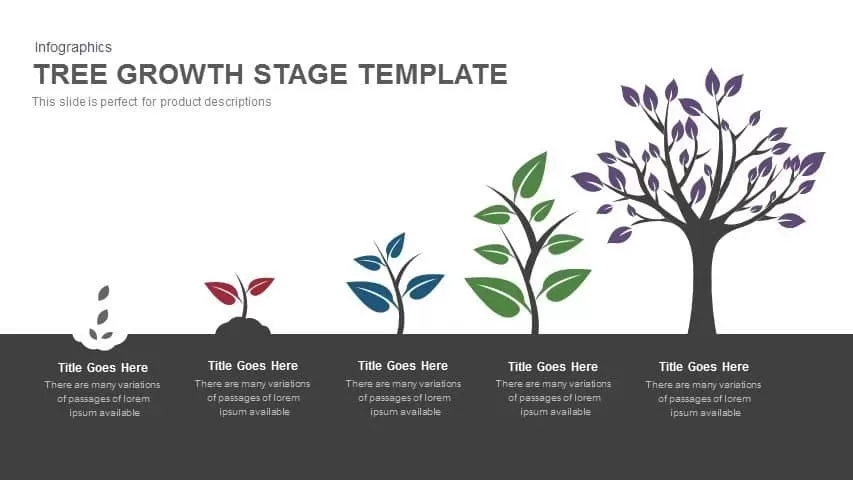
Tree Growth Stage Infographic Template for PowerPoint & Google Slides
Timeline
Five-Step Growth Stage Staircase Diagram Template for PowerPoint & Google Slides
Process

Modern Five-Step Growth Diagram Template for PowerPoint & Google Slides
Process
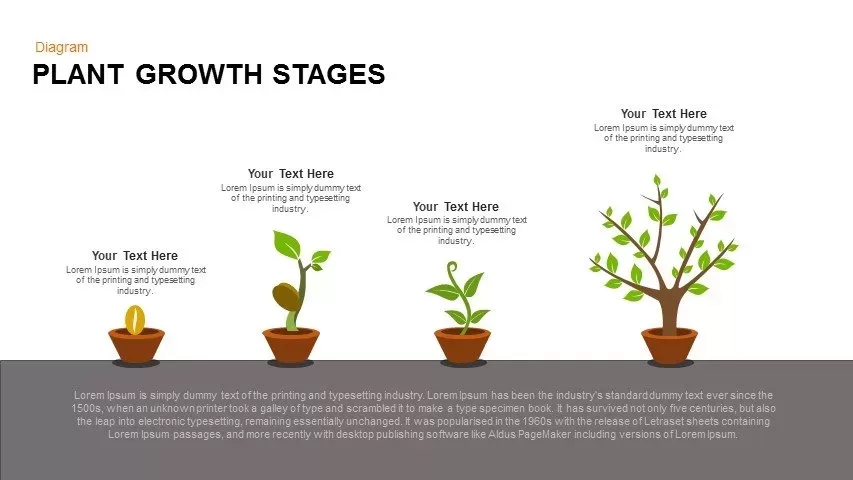
Editable Plant Growth Stages Diagram Template for PowerPoint & Google Slides
Process
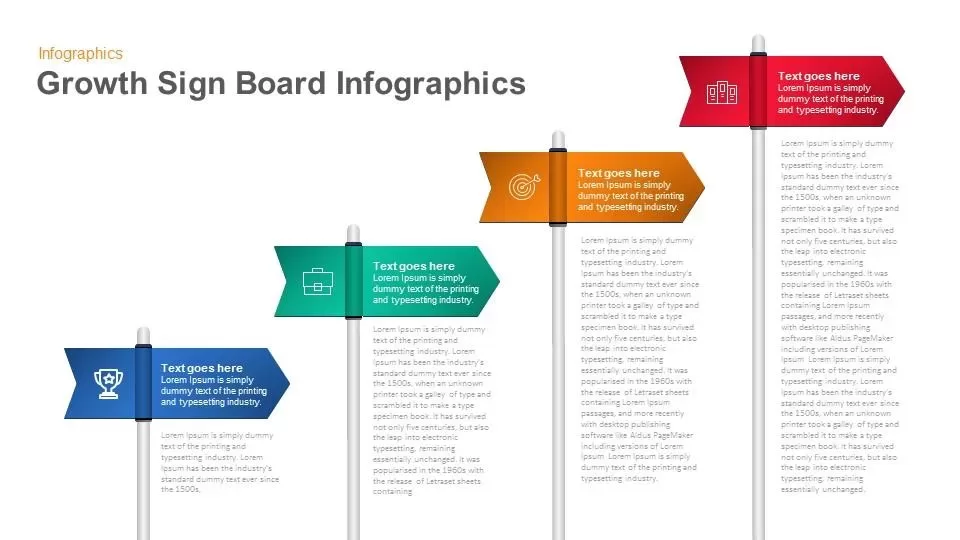
Growth Sign Board Infographics template for PowerPoint & Google Slides
Timeline
Five-Stage Growth Arrow Infographic Template for PowerPoint & Google Slides
Arrow
Ansoff Matrix Growth Strategy Model Template for PowerPoint & Google Slides
BCG
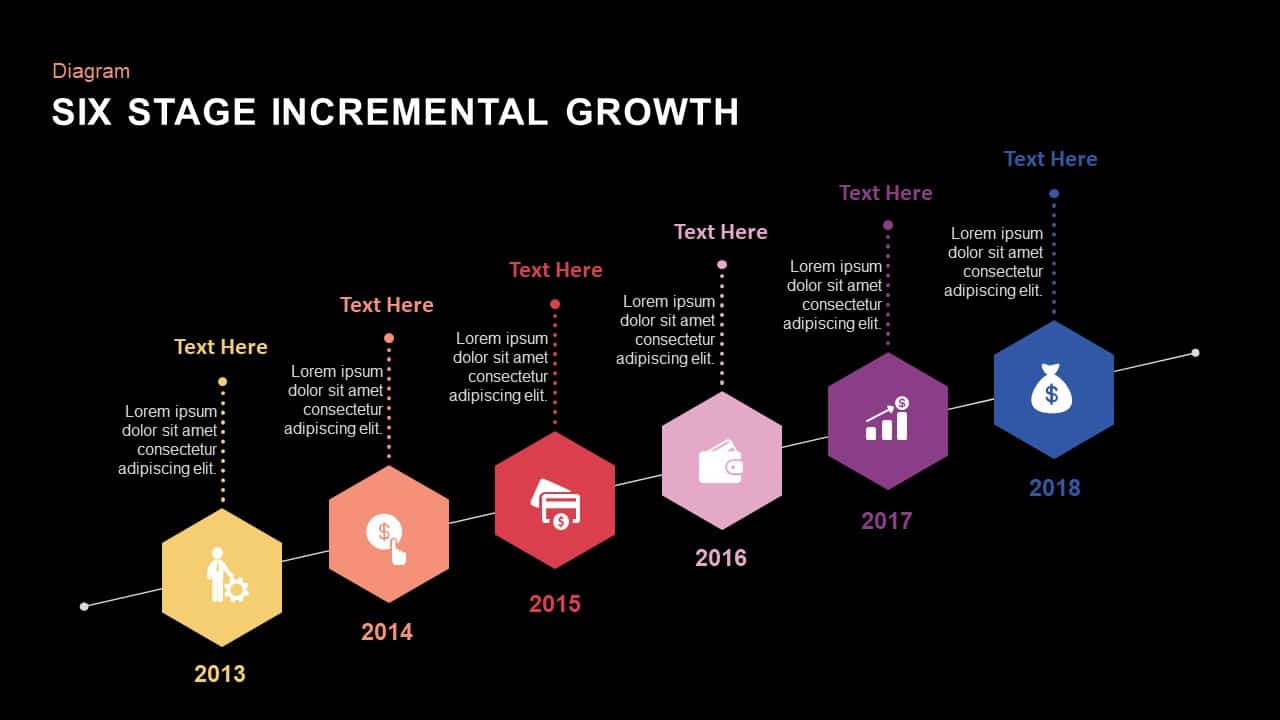
Six Stage Incremental Growth template for PowerPoint & Google Slides
Timeline
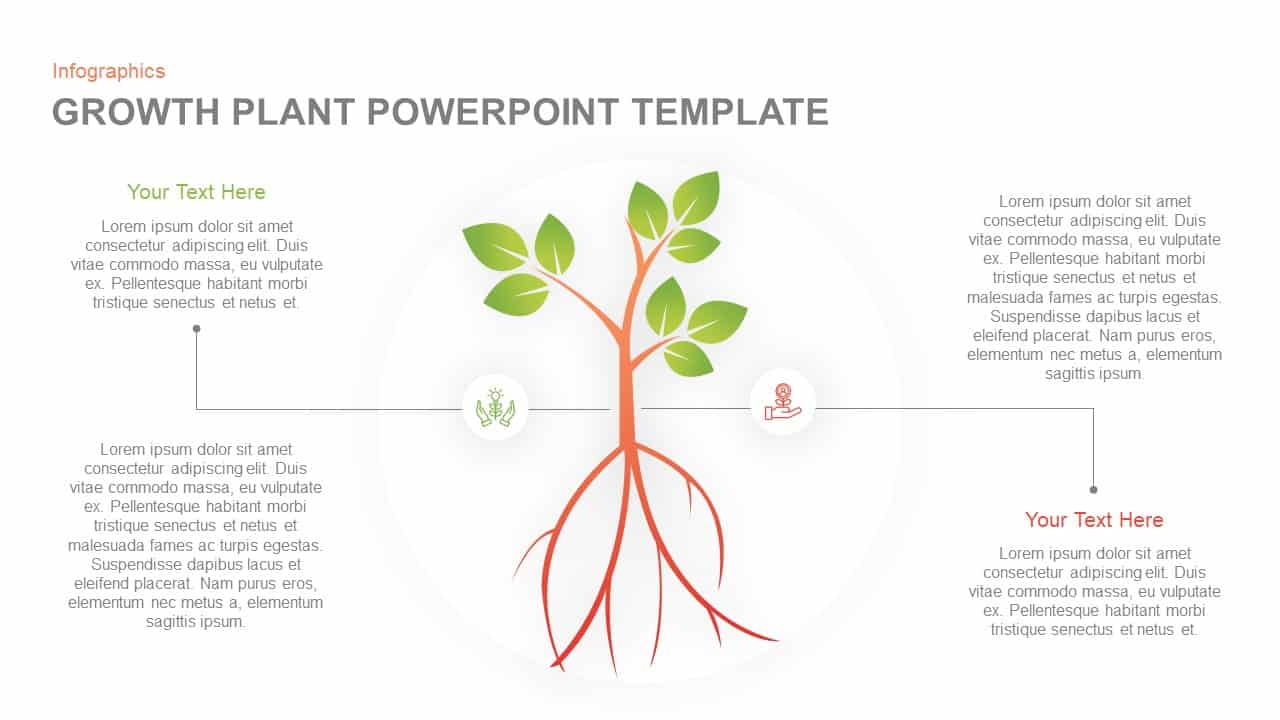
Growth Plant Infographics template for PowerPoint & Google Slides
Process
Business Growth Infographic Metaphor Template for PowerPoint & Google Slides
Revenue
Dynamic Growth Arrow Step Infographic Template for PowerPoint & Google Slides
Process
Plant Growth Lifecycle Infographic Template for PowerPoint & Google Slides
Process
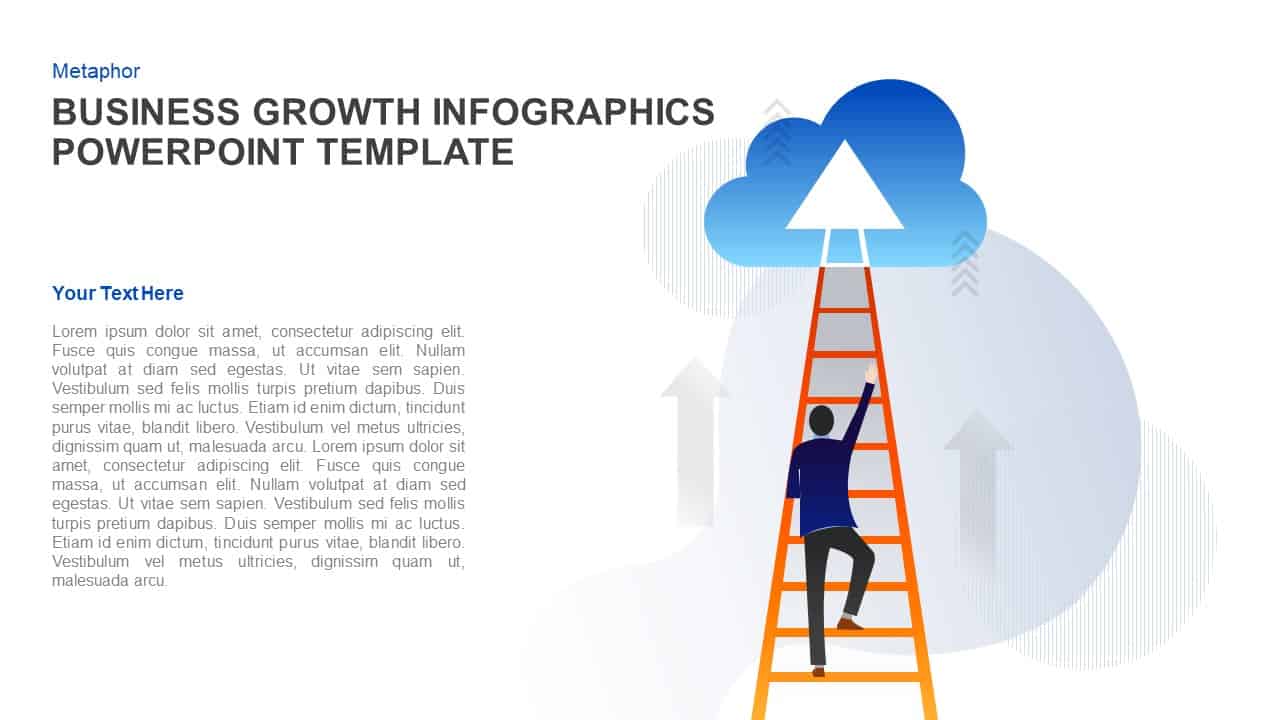
Business Growth Ladder to Cloud Metaphor Template for PowerPoint & Google Slides
Vision and Mission
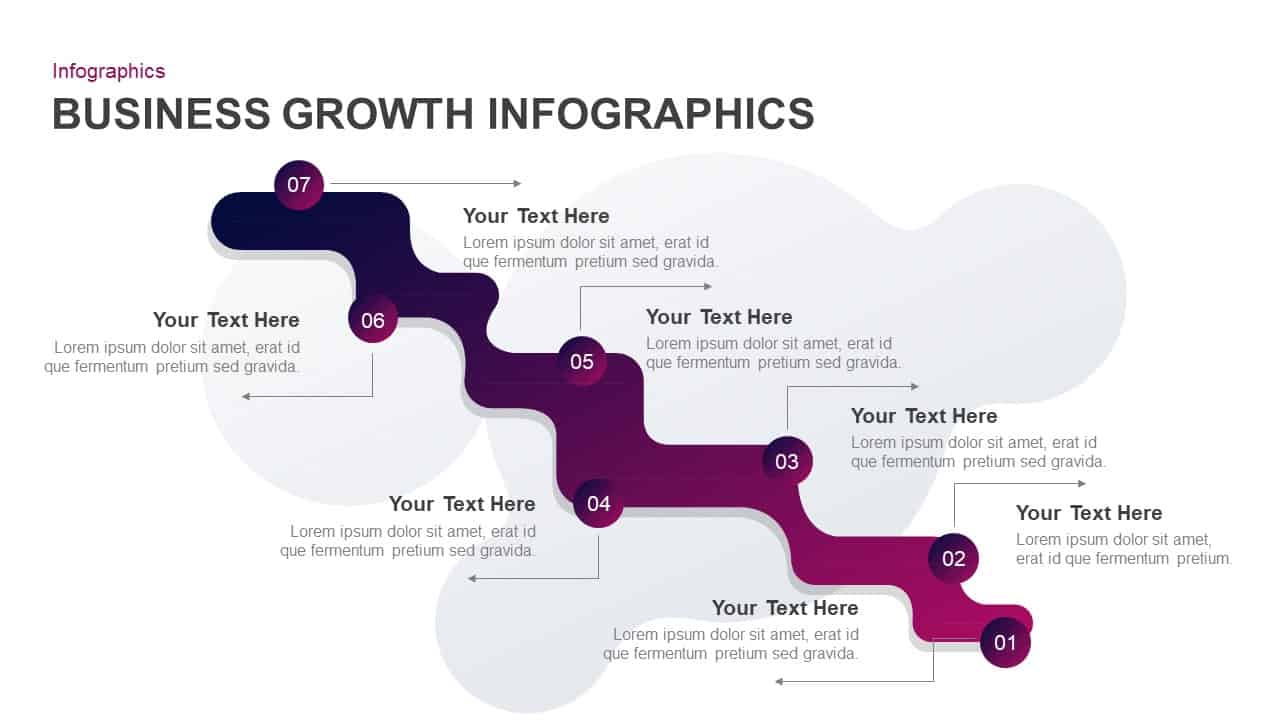
Business Growth Infographics Template for PowerPoint & Google Slides
Roadmap
Five-Step Growth Infographic Slide Template for PowerPoint & Google Slides
Process
Five-Step Growth Timeline Infographic Template for PowerPoint & Google Slides
Timeline
Greiner Growth Model Six-Phase Diagram Template for PowerPoint & Google Slides
Business Models
Sales Growth Dashboard: KPI Gauge & Line Template for PowerPoint & Google Slides
Revenue
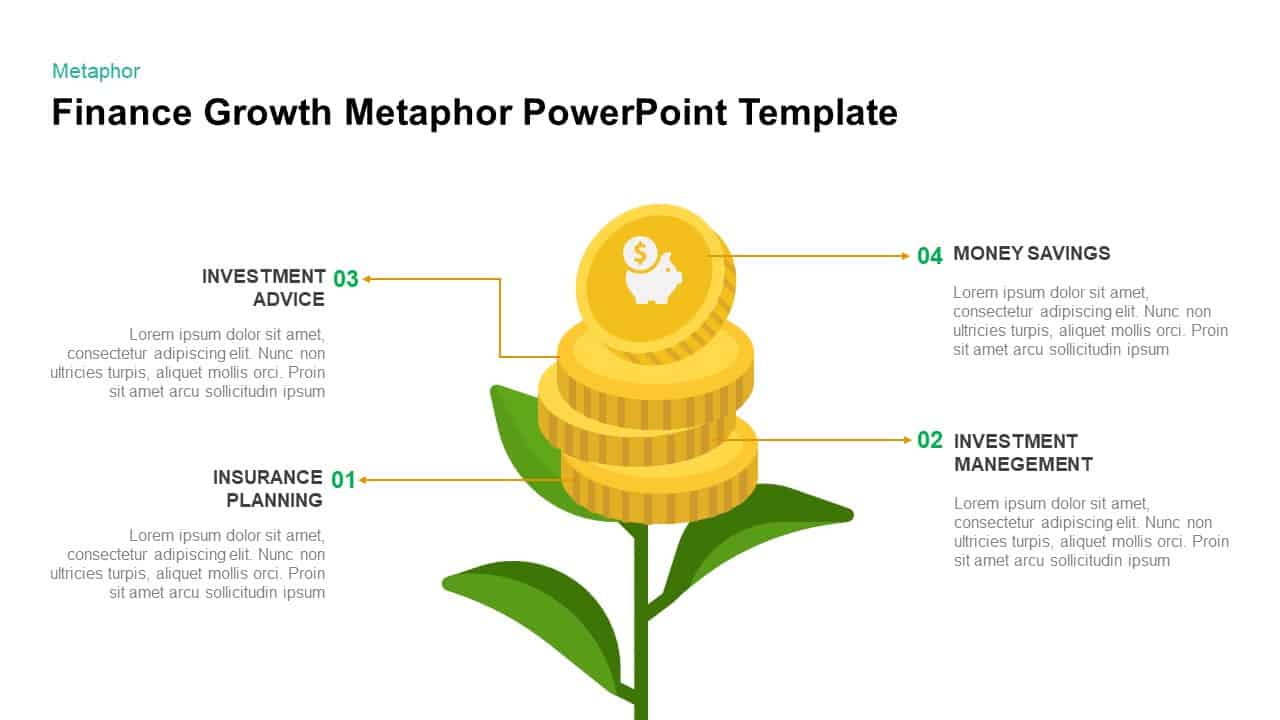
Finance Growth Plant Metaphor Slide Template for PowerPoint & Google Slides
Finance
5-Stage Financial Growth Timeline Template for PowerPoint & Google Slides
Timeline

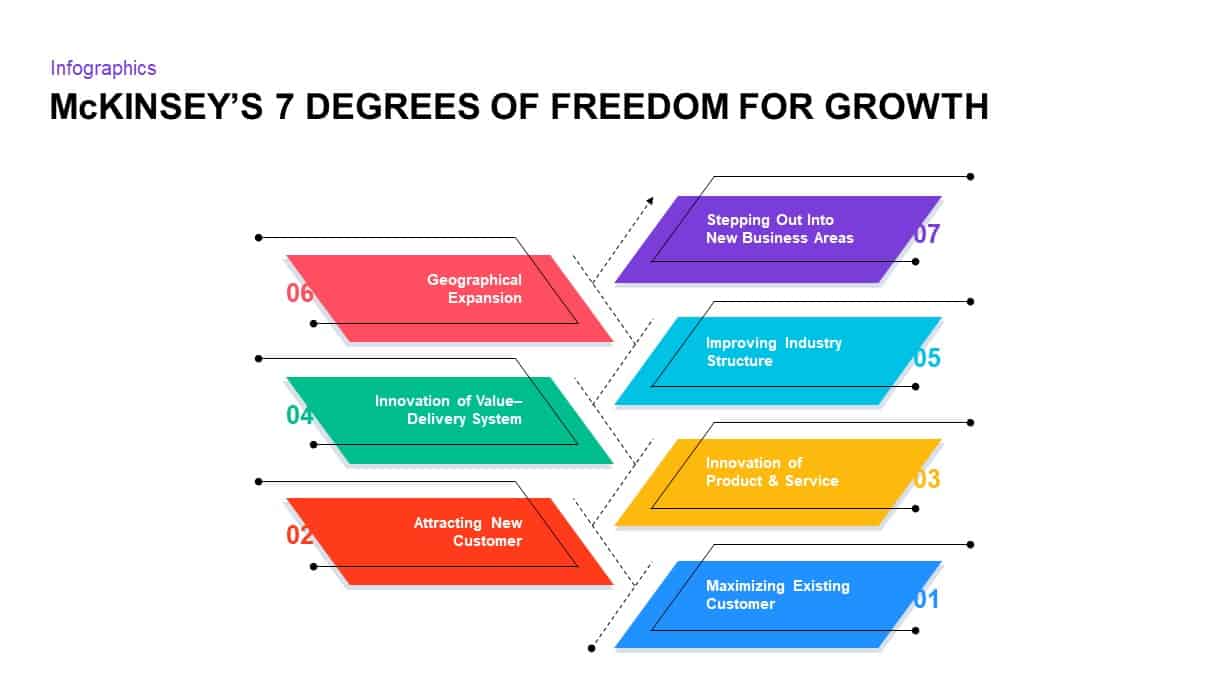
McKinsey’s 7 Degrees of Freedom Growth Template for PowerPoint & Google Slides
Process
Greiner’s Growth Model Curve template for PowerPoint & Google Slides
Infographics
Business Growth Plant Infographics Pack Template for PowerPoint & Google Slides
Process
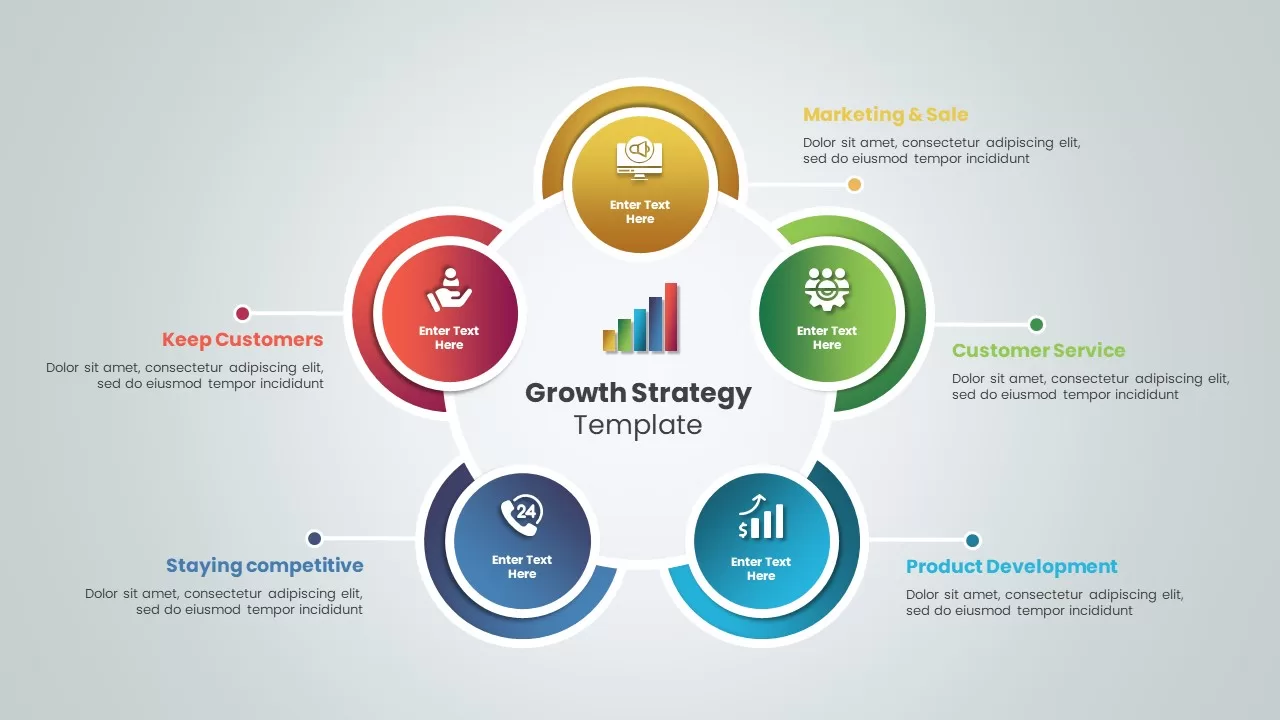
Growth Strategy Circular Diagram Template for PowerPoint & Google Slides
Circular
Data-driven GDP Growth Infographic Pack Template for PowerPoint & Google Slides
Infographics
3D Curved Arrow Growth Process Slide Template for PowerPoint & Google Slides
Process
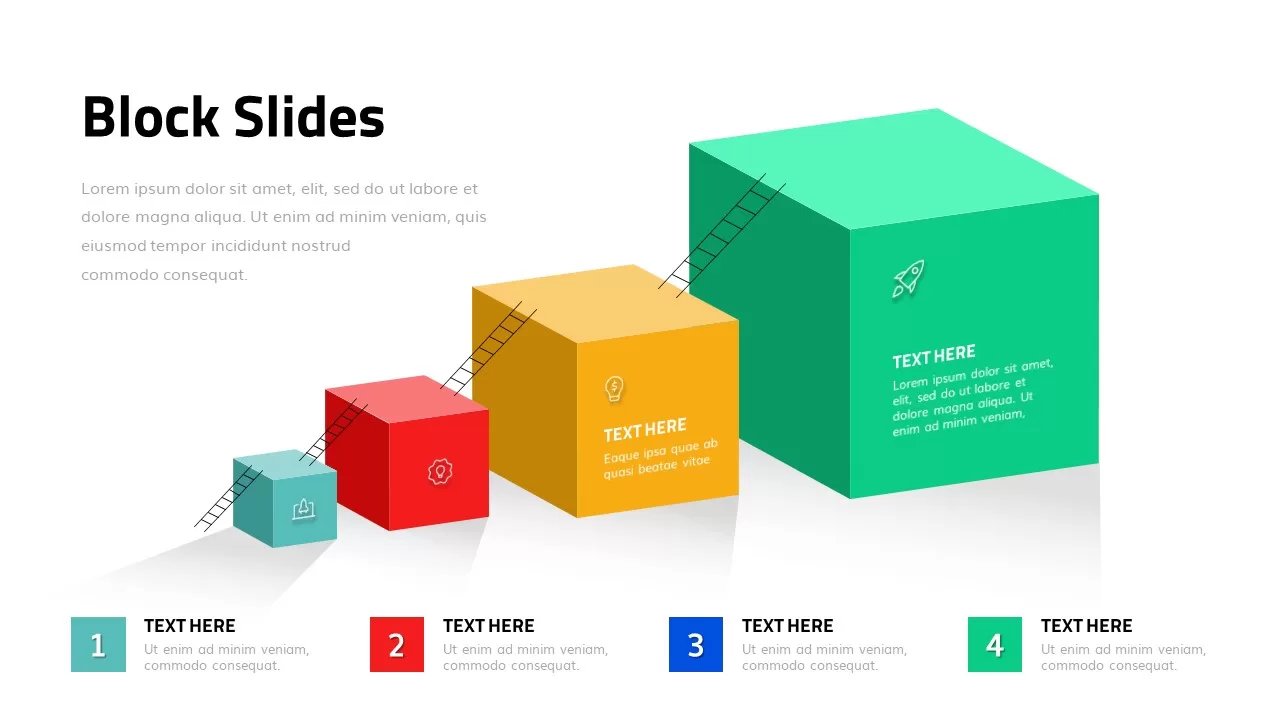
3D Growth Blocks Template for PowerPoint & Google Slides
Process
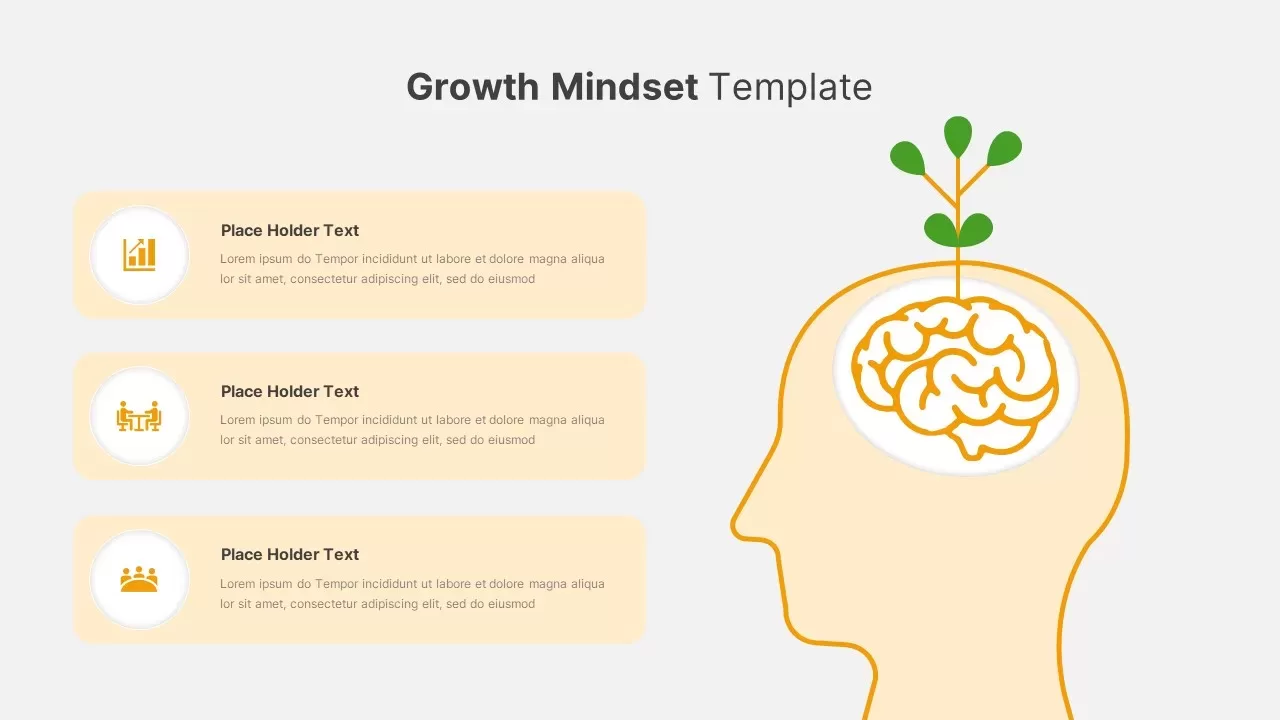
Growth Mindset Illustration Template for PowerPoint & Google Slides
Goals
Abraham Maslow Growth Quote Slide Template for PowerPoint & Google Slides
Vision and Mission
Three-Stage S Curve Growth Diagram Template for PowerPoint & Google Slides
Process
Dynamic Investment & Finance Growth Template for PowerPoint & Google Slides
Finance
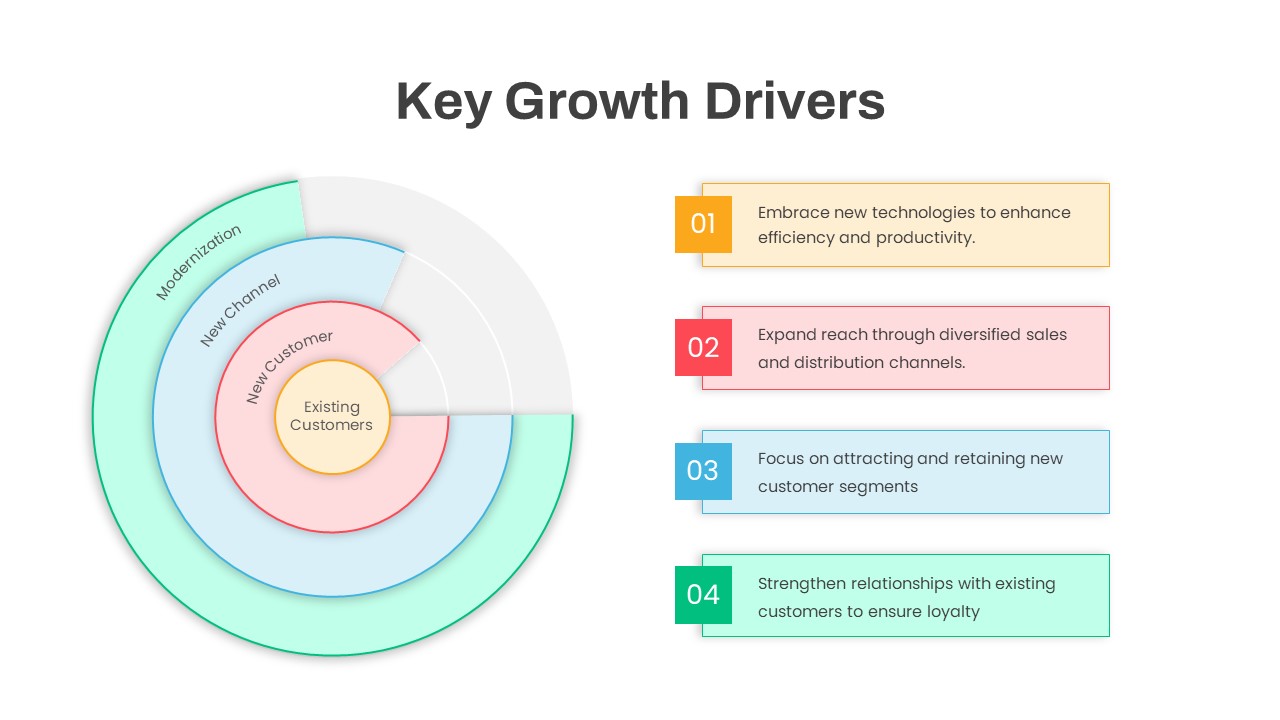
Circular Key Growth Drivers Diagram Template for PowerPoint & Google Slides
Circular
Business Growth Strategies Matrix Template for PowerPoint & Google Slides
Comparison

Growth Plant Nurture Business Development Template for PowerPoint & Google Slides
Decks
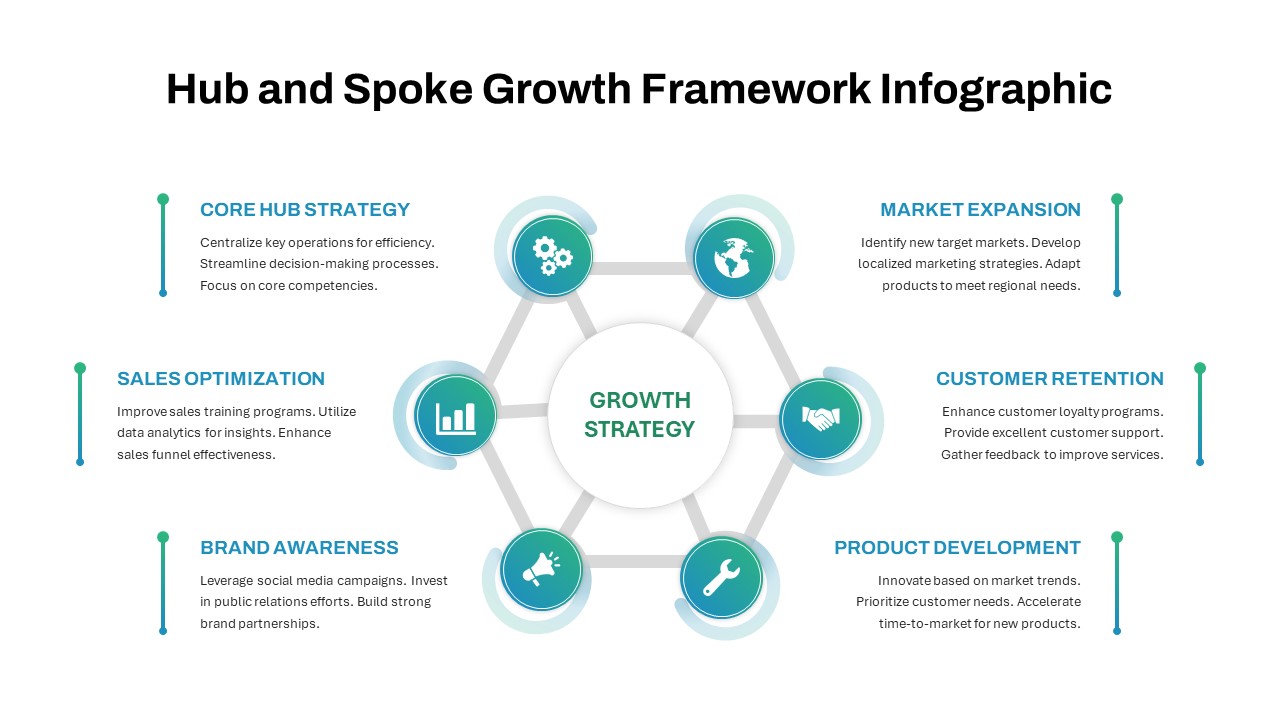
Hub and Spoke Growth Framework Template for PowerPoint & Google Slides
Circular

Quarterly Net Interest Income Growth Template for PowerPoint & Google Slides
Bar/Column
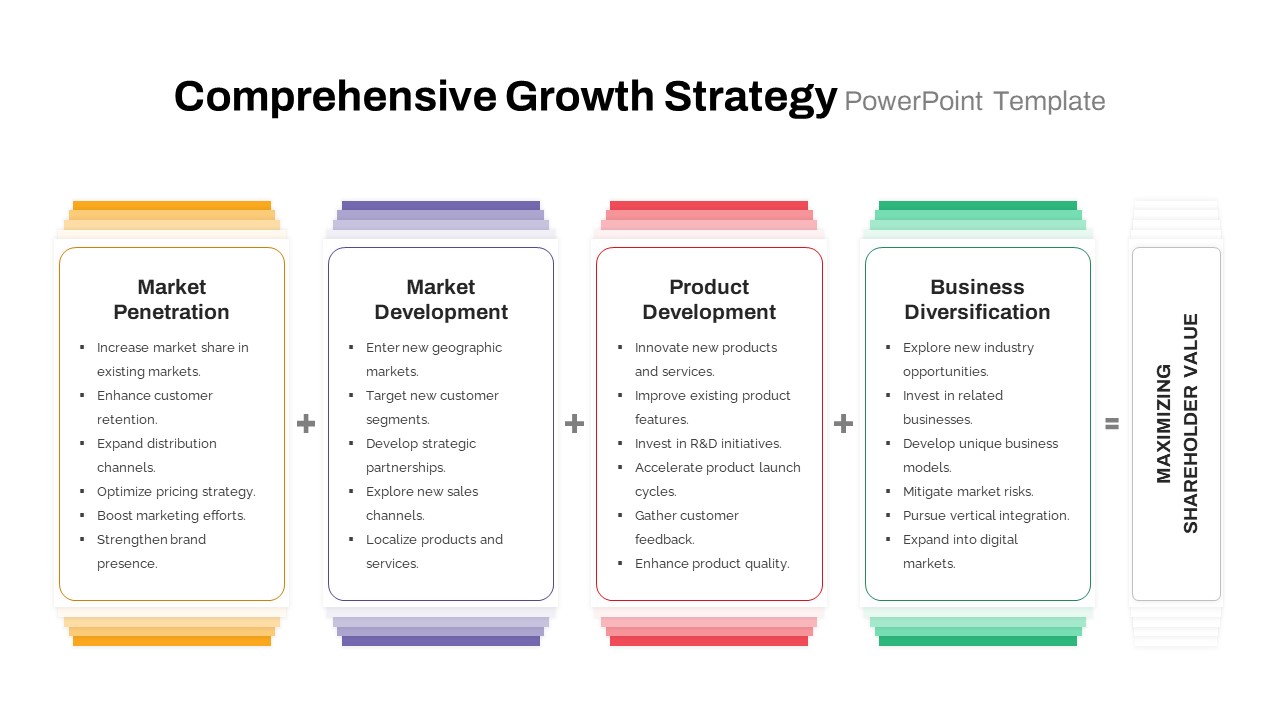
Comprehensive Growth Strategy Cards Template for PowerPoint & Google Slides
Infographics
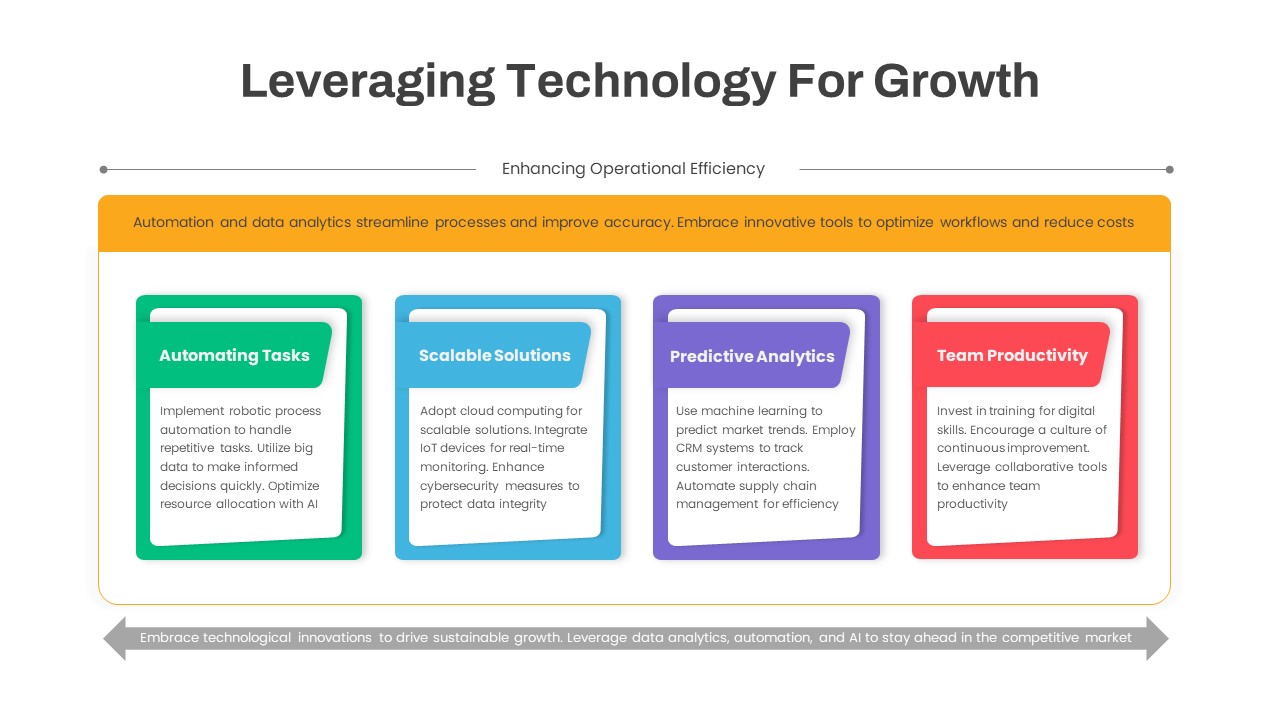
Leveraging Technology for Growth Slide Template for PowerPoint & Google Slides
Information Technology
Ansoff Growth Matrix Professional Template for PowerPoint & Google Slides
Comparison
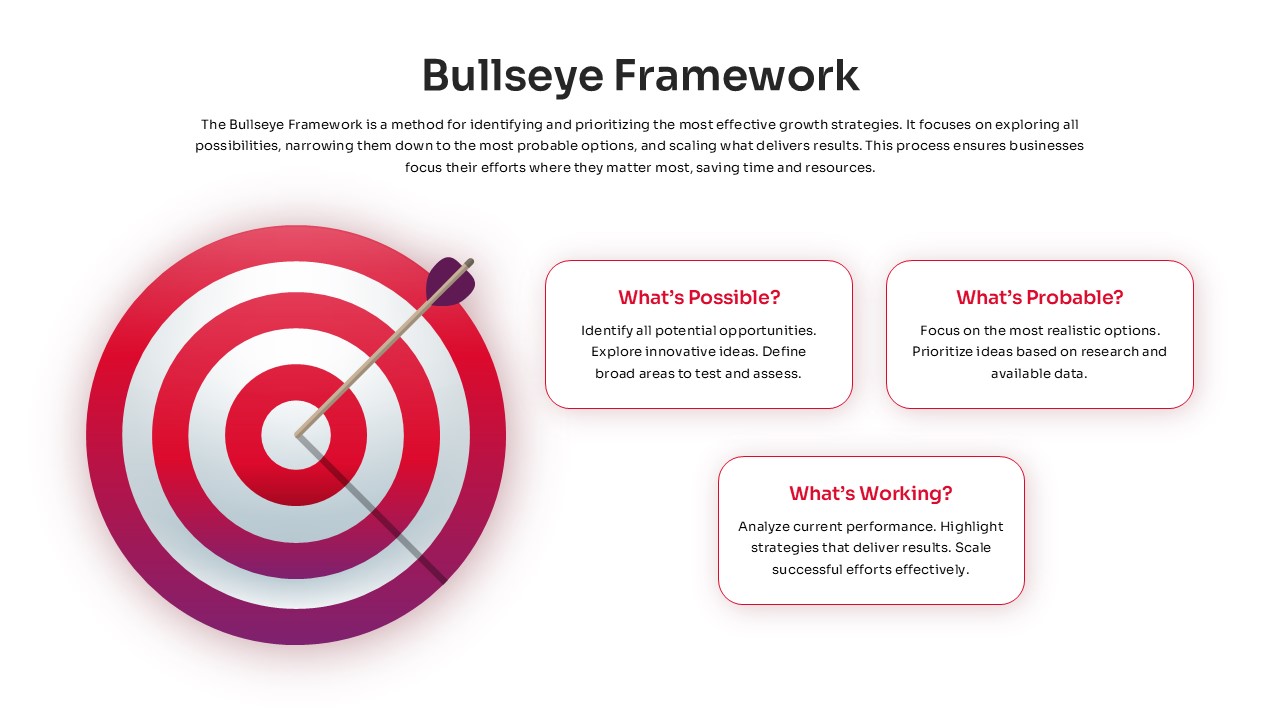
Bullseye Framework Growth Strategy Template for PowerPoint & Google Slides
Business Strategy
Modern Growth Hacking Venn Diagram Template for PowerPoint & Google Slides
Circular
Seeds Growth Cycle Business Model Template for PowerPoint & Google Slides
Process
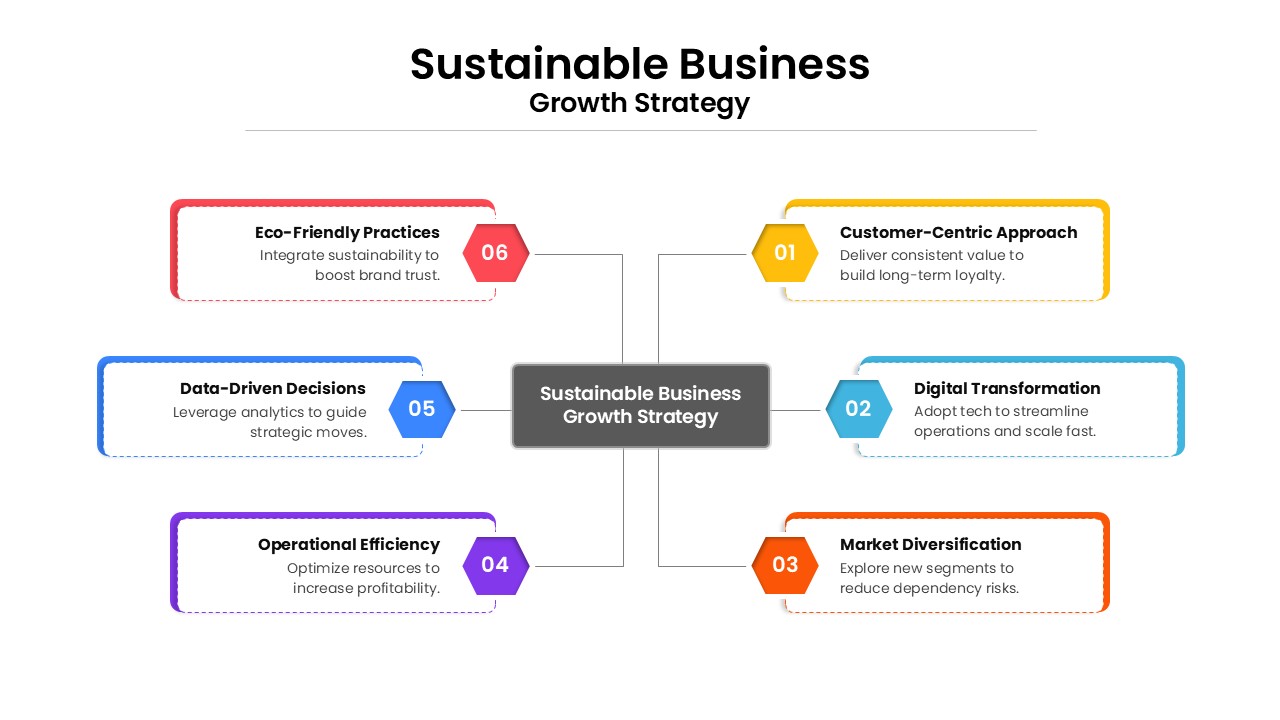
Sustainable Business Growth Strategy Template for PowerPoint & Google Slides
Process
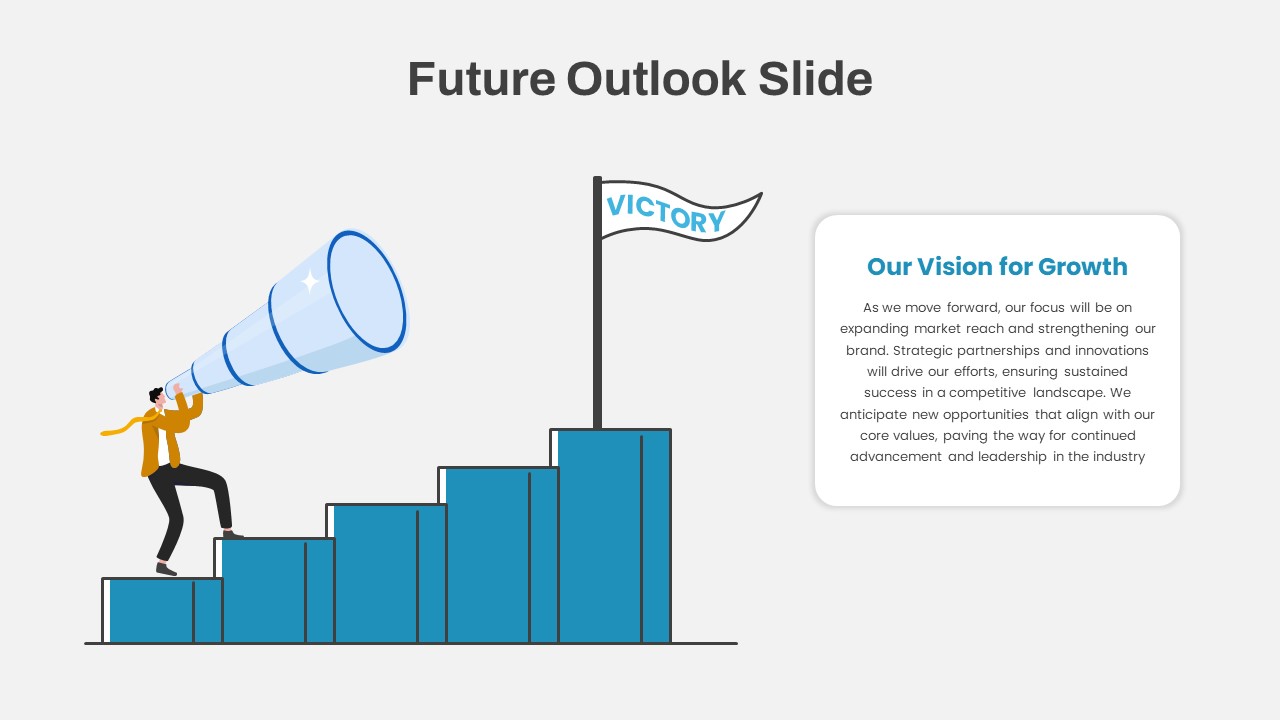
Future Outlook and Growth Strategy Slide Template for PowerPoint & Google Slides
Infographics
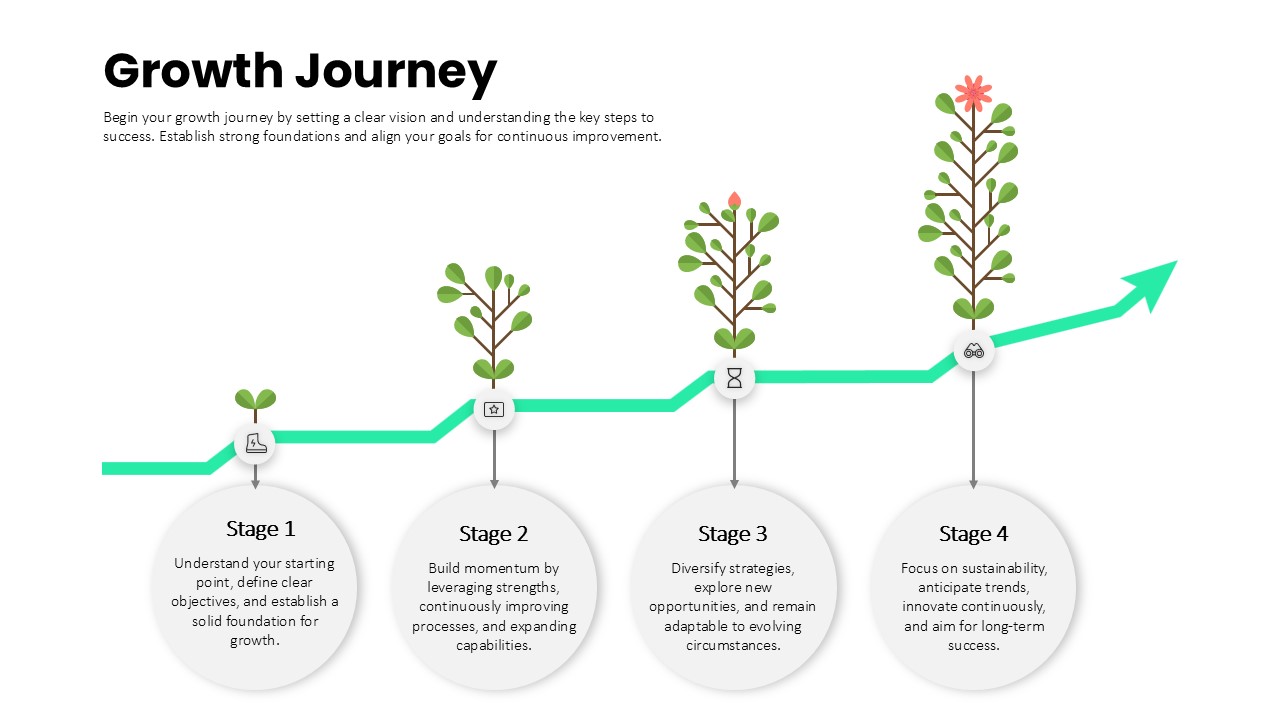
Growth Journey Stages Process template for PowerPoint & Google Slides
Business Strategy
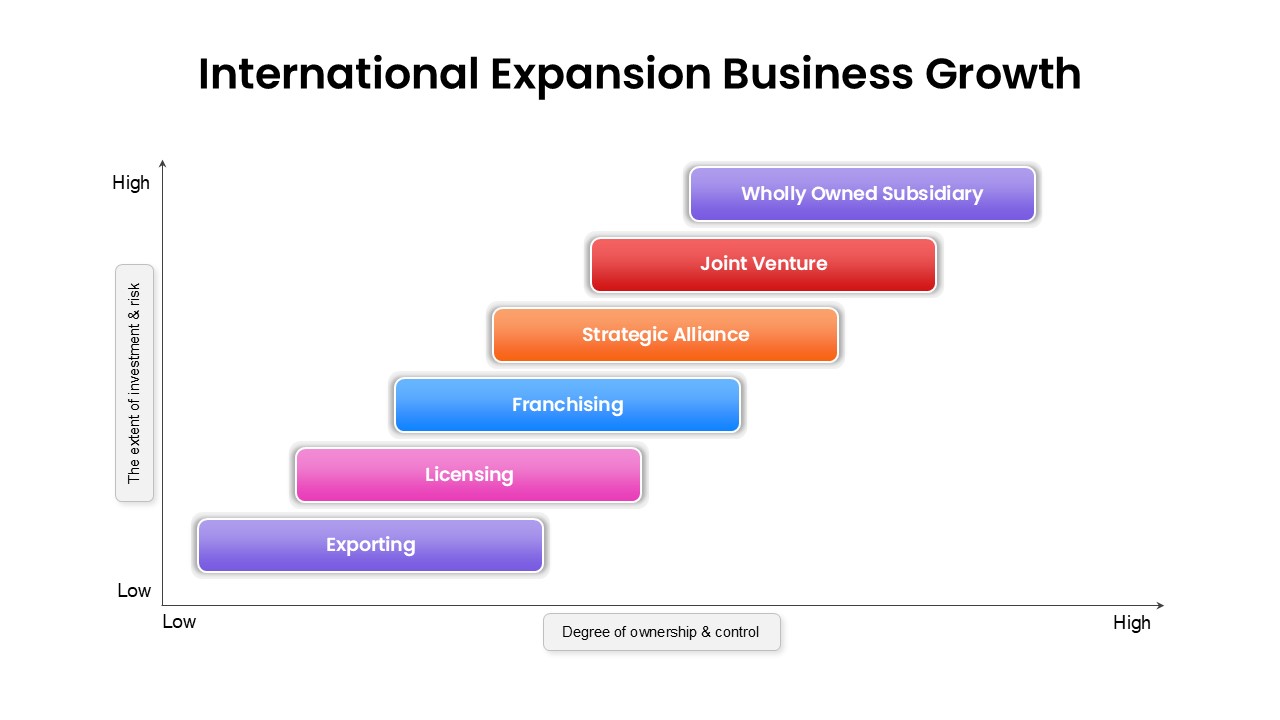
International Expansion Business Growth template for PowerPoint & Google Slides
Business Strategy
Flywheel Growth Cycle Diagram Template for PowerPoint & Google Slides
Circular
Personal Growth Overview Template for PowerPoint & Google Slides
Business
Ansoff Growth Matrix Template for PowerPoint & Google Slides
Business Strategy