Business Relationship Mapping Template


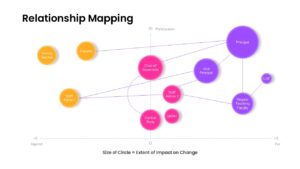
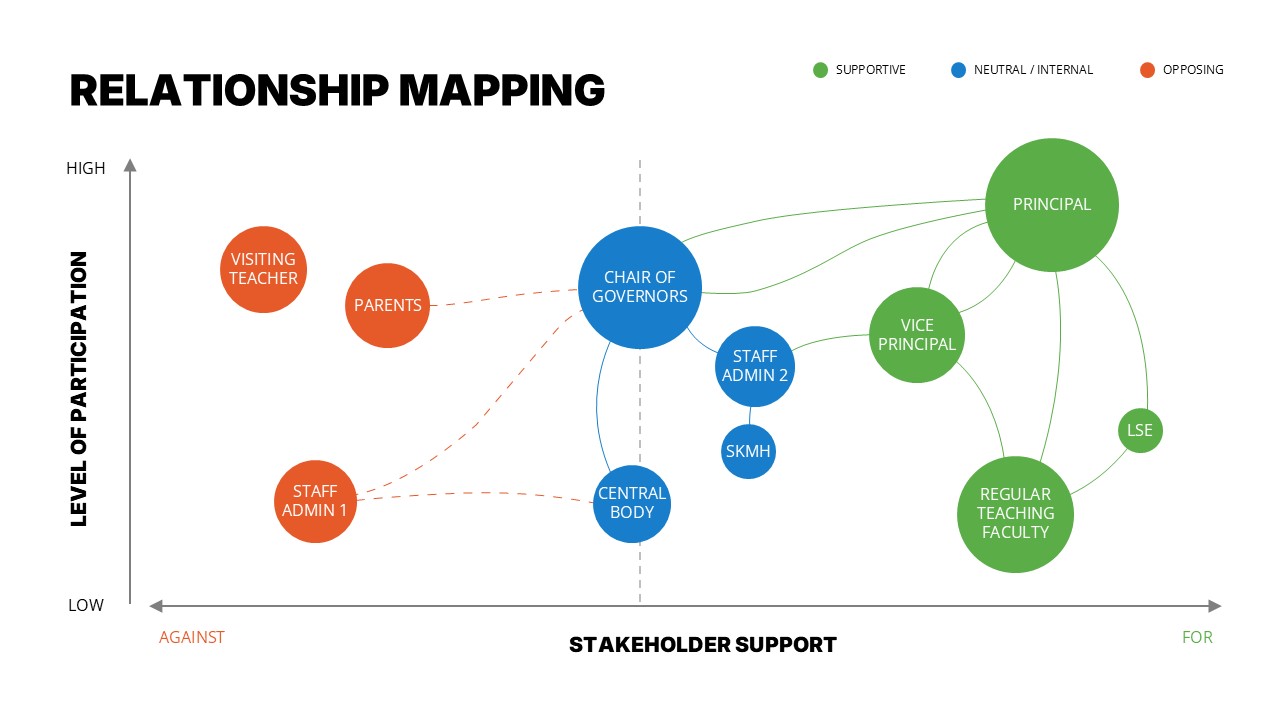
Some of the trickiest conversations in any organization come down to one question: who actually has influence here, and where do they stand? This Relationship Mapping PowerPoint Template was built to answer exactly that, giving HR professionals, school leadership teams, project managers, and consultants a ready-to-use PPT slide for plotting stakeholders by both their position on an issue and their level of involvement.
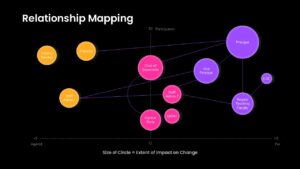
The PowerPoint slide sits on a two-axis grid, one running from opposition to support, the other tracking participation from low to high. Each stakeholder appears as a circle placed according to where they fall on both scales, and the size of each circle reflects how much sway that person or group actually holds over a given outcome within the PPT layout. A few connecting lines tie related roles together, showing reporting structure or influence pathways between figures like a principal, governing body members, and teaching staff, while distinct colors group stakeholders into categories so the whole presentation stays readable rather than cluttered.
What makes this PowerPoint template practical rather than just decorative is how easily it adapts using PowerPoint’s native editing tools. Every circle can be resized, repositioned, recolored, or relabeled, and the connecting lines can be redrawn to match whatever structure you’re actually working with, whether that’s three stakeholders or fifteen, all within the same PPT slide. This template is designed for both Microsoft PowerPoint & Google Slides, so switching between the two tools won’t cause any formatting headaches in your PowerPoint presentation. Outside of stakeholder mapping, people have repurposed this same bubble-grid PPT format for influence-interest matrices, organizational network diagrams, change readiness assessments, and partnership evaluation slides.
Frequently Asked Questions
Can I add or remove stakeholder bubbles in this template?
What does the size of each circle represent?
Login to download this file

Item ID
SB05963Designed By
Naseeba Sithara
Related Templates

Relationship Mapping Template For PowerPoint
Business Strategy
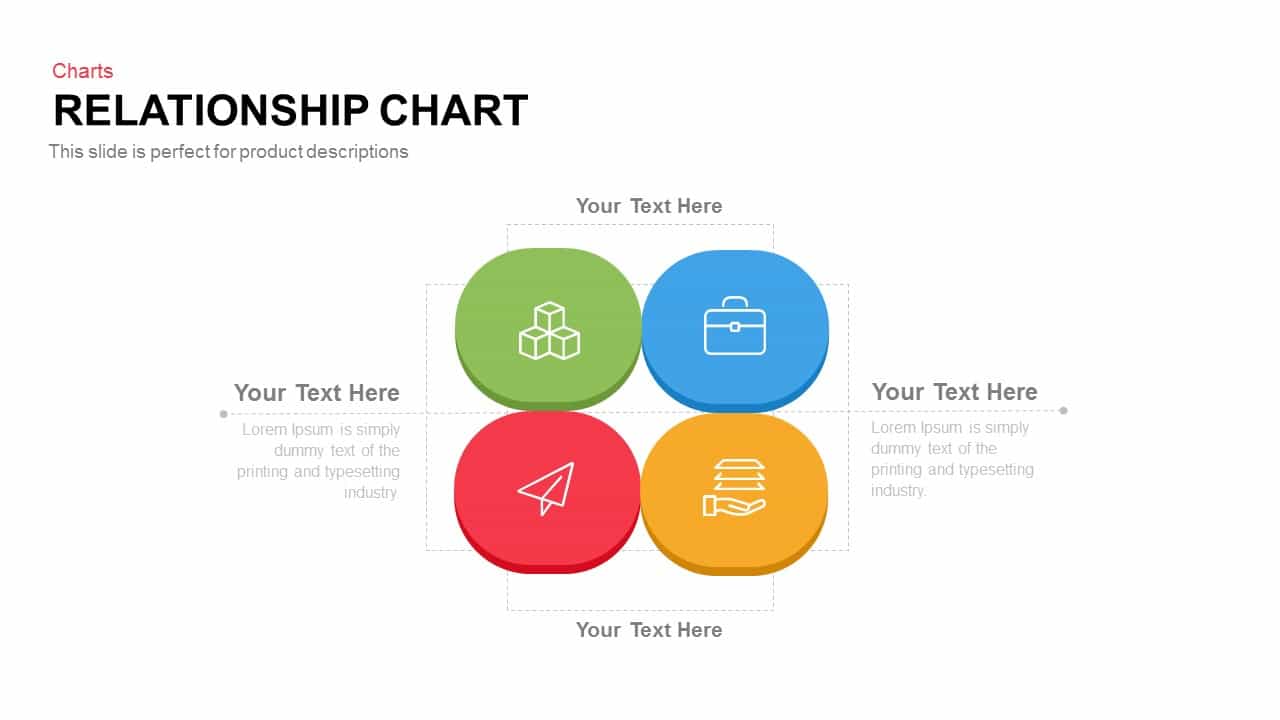
Relationship Chart template for PowerPoint & Google Slides
Flow Charts

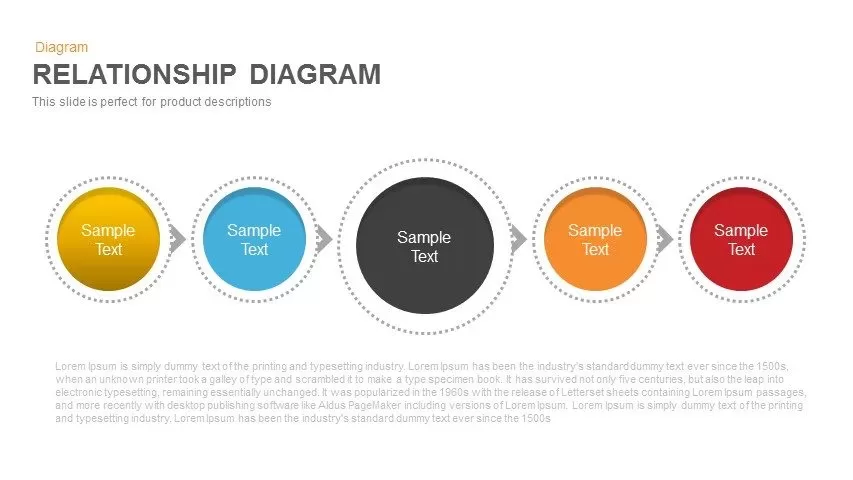
Colorful Five-Stage Relationship Diagram Template for PowerPoint & Google Slides
Process

Customer Relationship Management (CRM) Presentation Template for PowerPoint
Decks
Modern Work Relationship Cover Slide Template for PowerPoint & Google Slides
HR
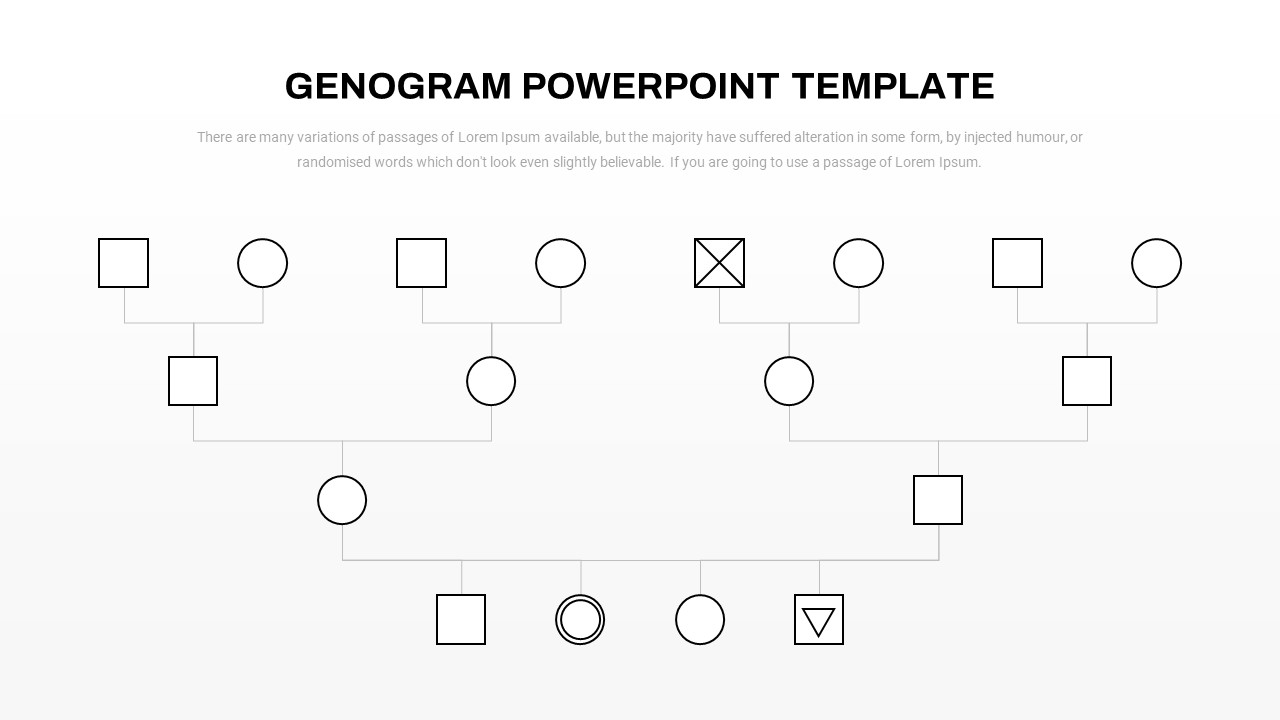
Genogram Family Relationship Diagram Template for PowerPoint & Google Slides
Org Chart
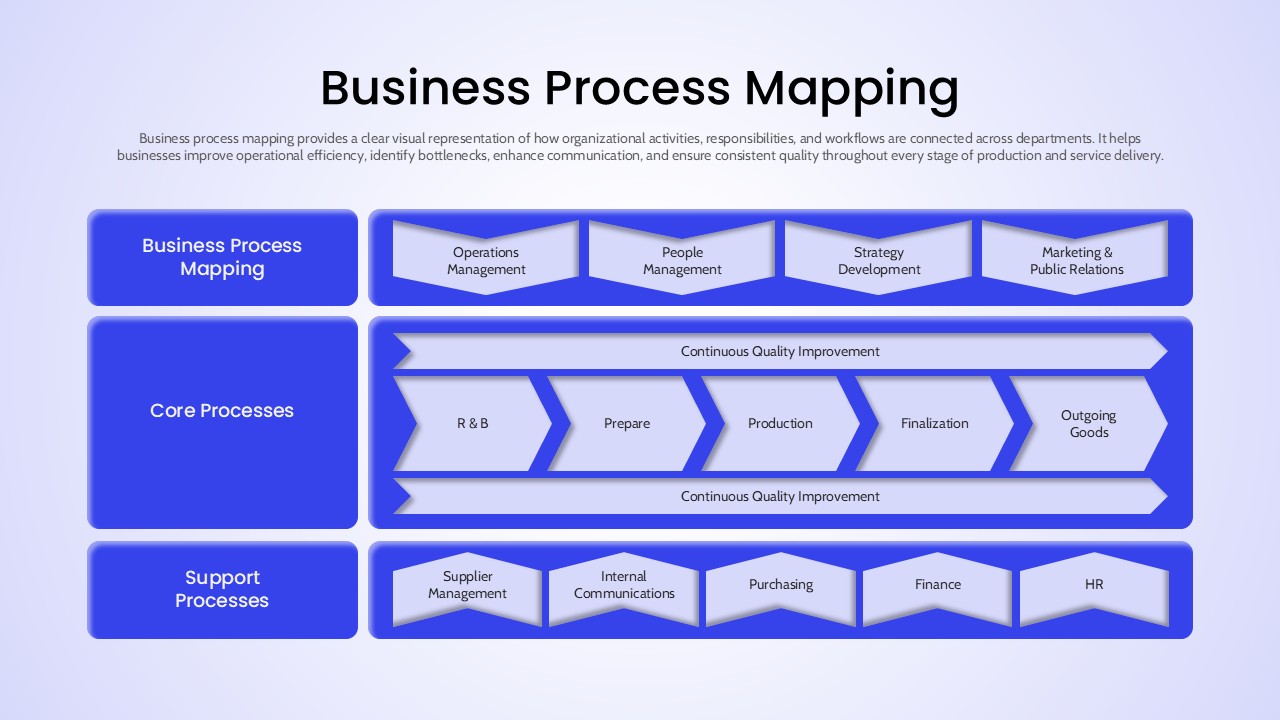
Business Process Mapping Template for Workflow Analysis and Operational Planning
Process
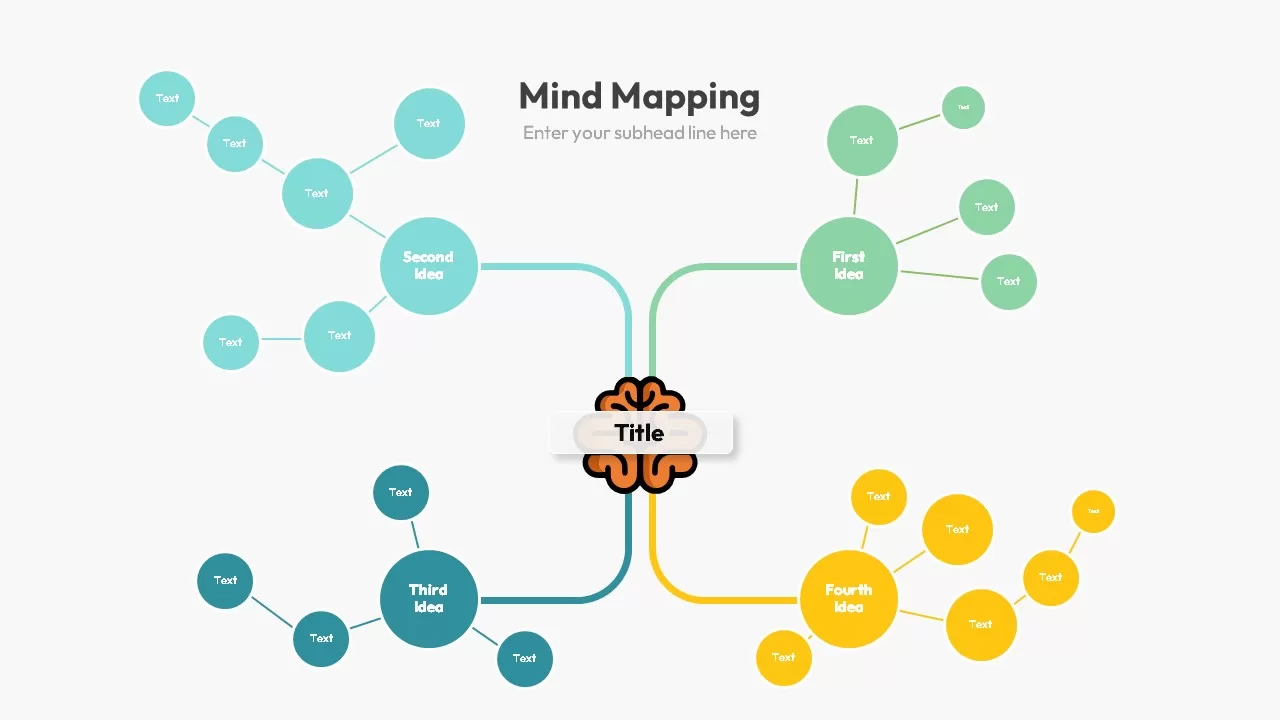
Five-Branch Mind Mapping Diagram template for PowerPoint & Google Slides
Mind Maps
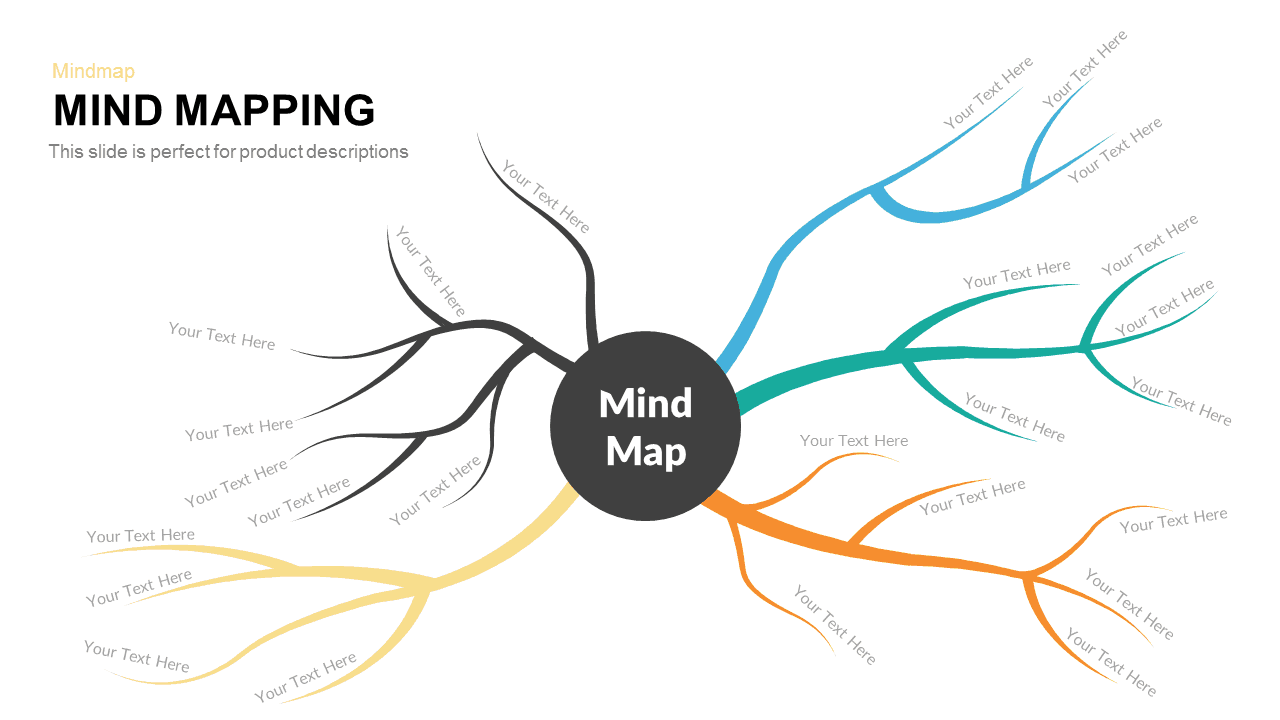
Mind Mapping Hub and Spoke Diagram Template for PowerPoint & Google Slides
Mind Maps
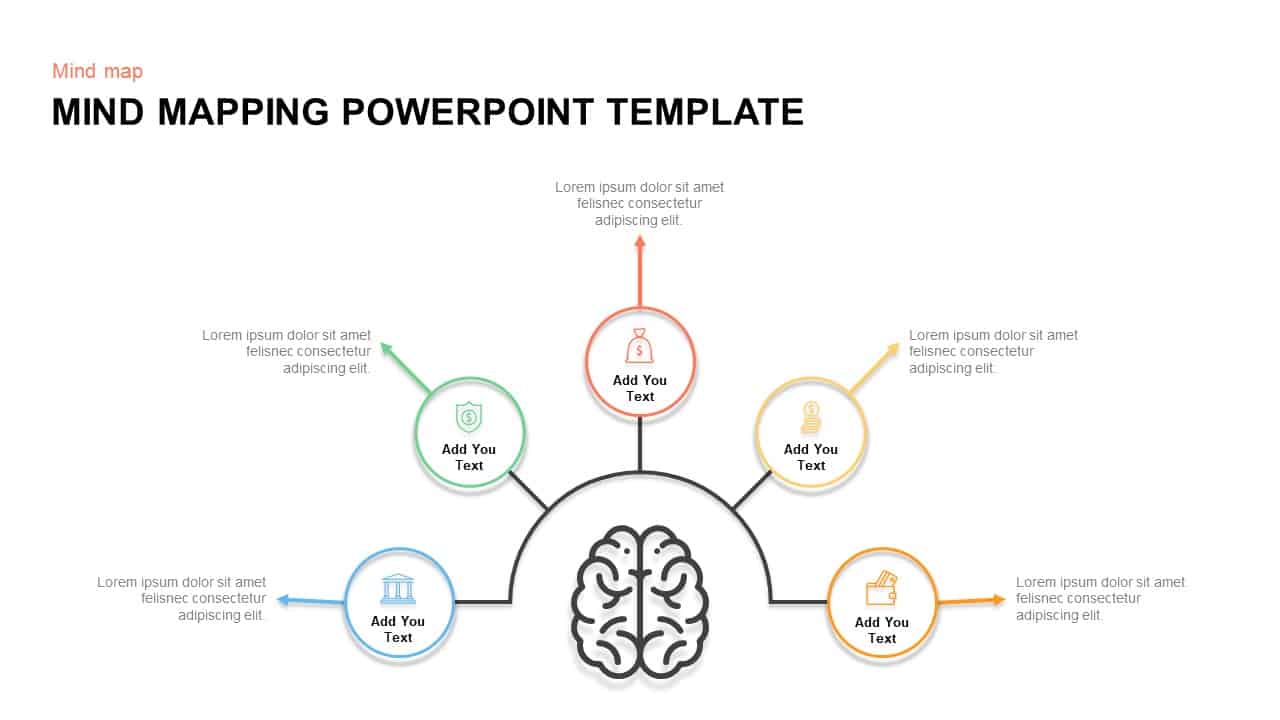
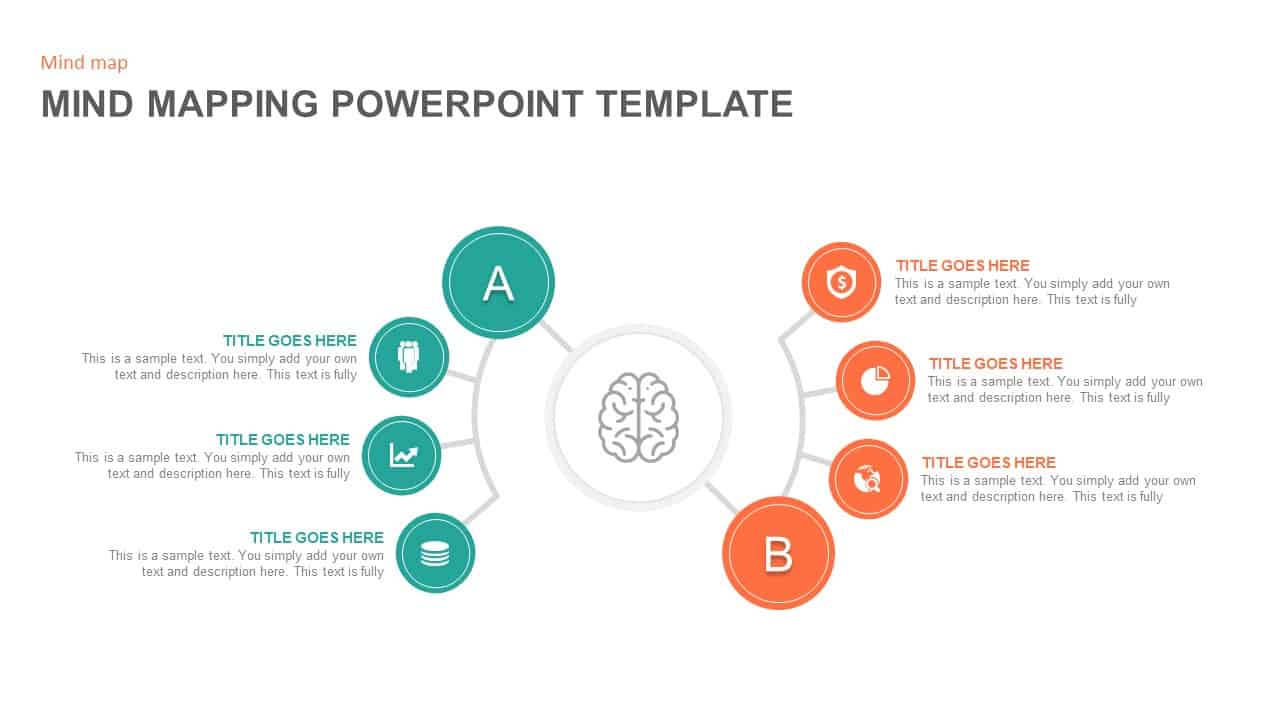
Creative Mind Mapping Diagram with Icons Template for PowerPoint & Google Slides
Mind Maps
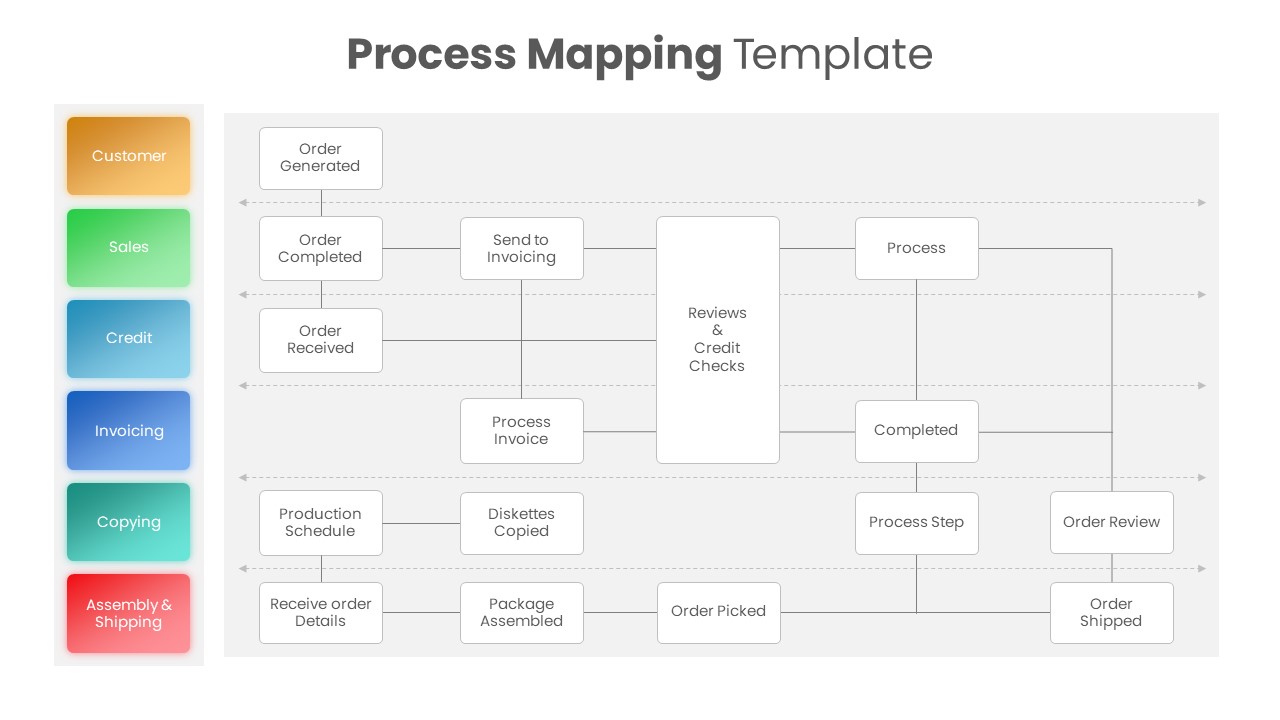
Process Mapping Overview template for PowerPoint & Google Slides
Business Plan
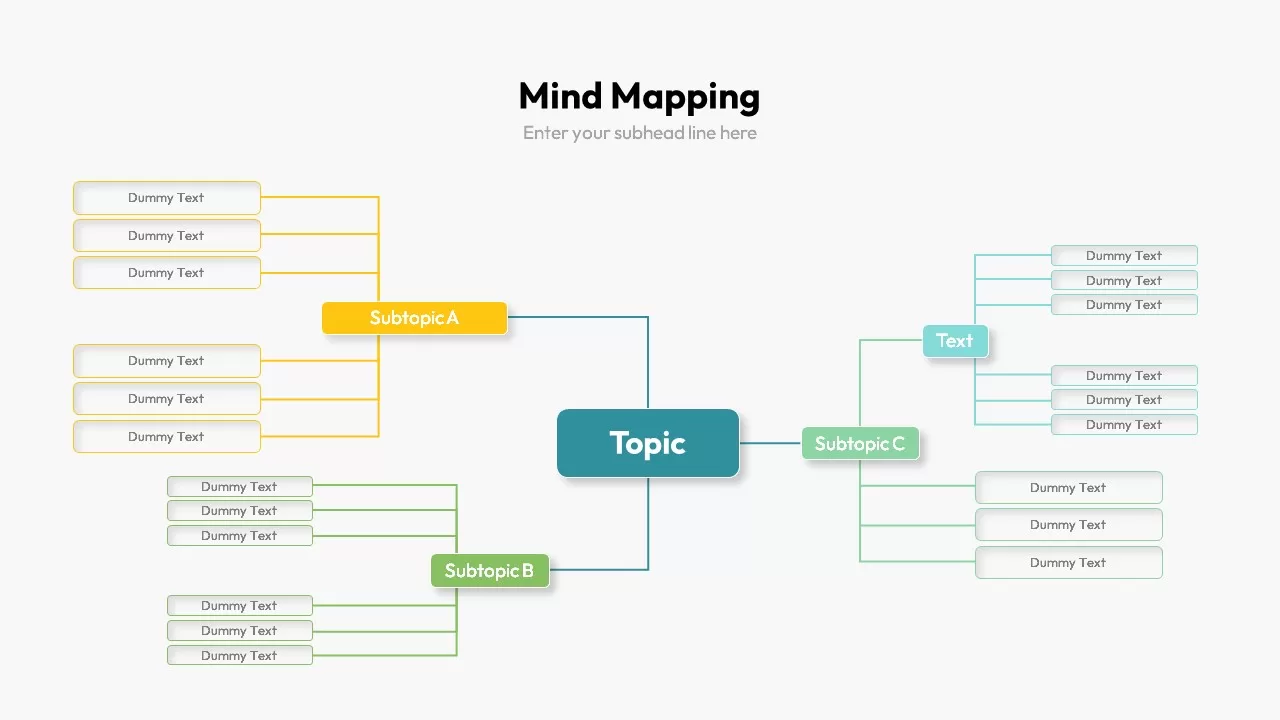
Mind Mapping Template for PowerPoint & Google Slides
Mind Maps
Mind Mapping Template for PowerPoint & Google Slides
Mind Maps
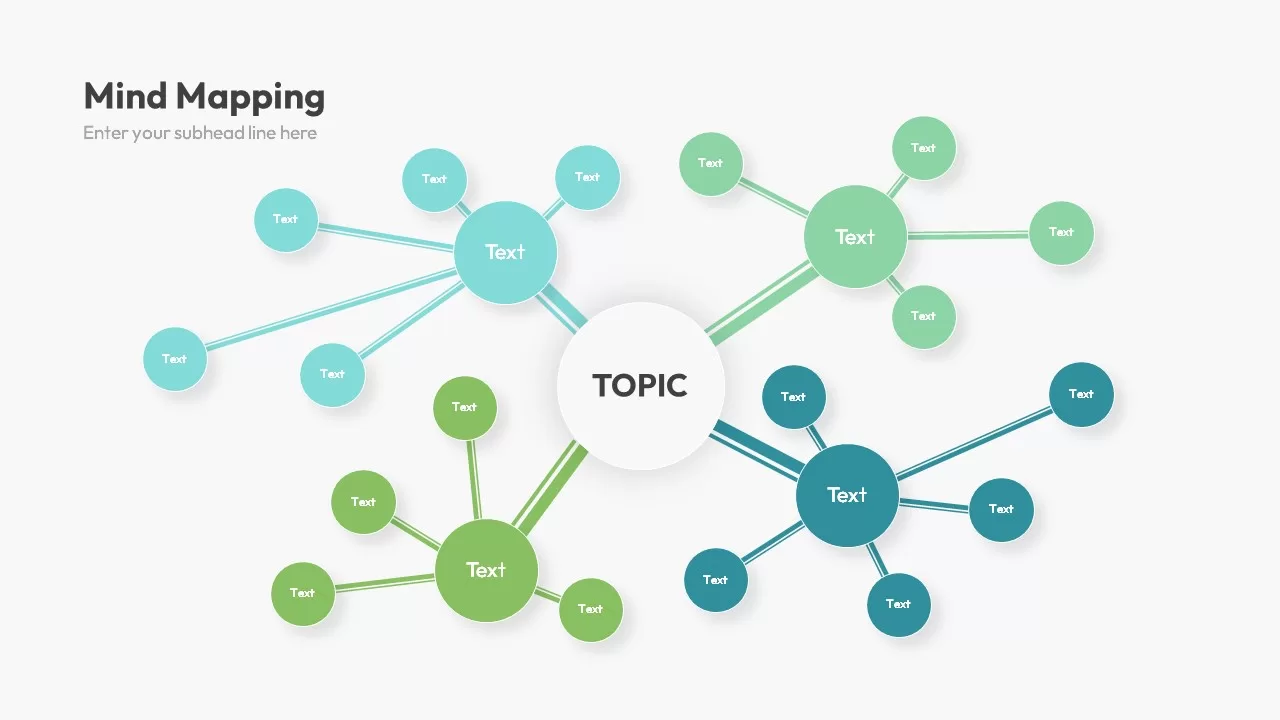
Creative Mind Mapping Template for PowerPoint & Google Slides
Mind Maps
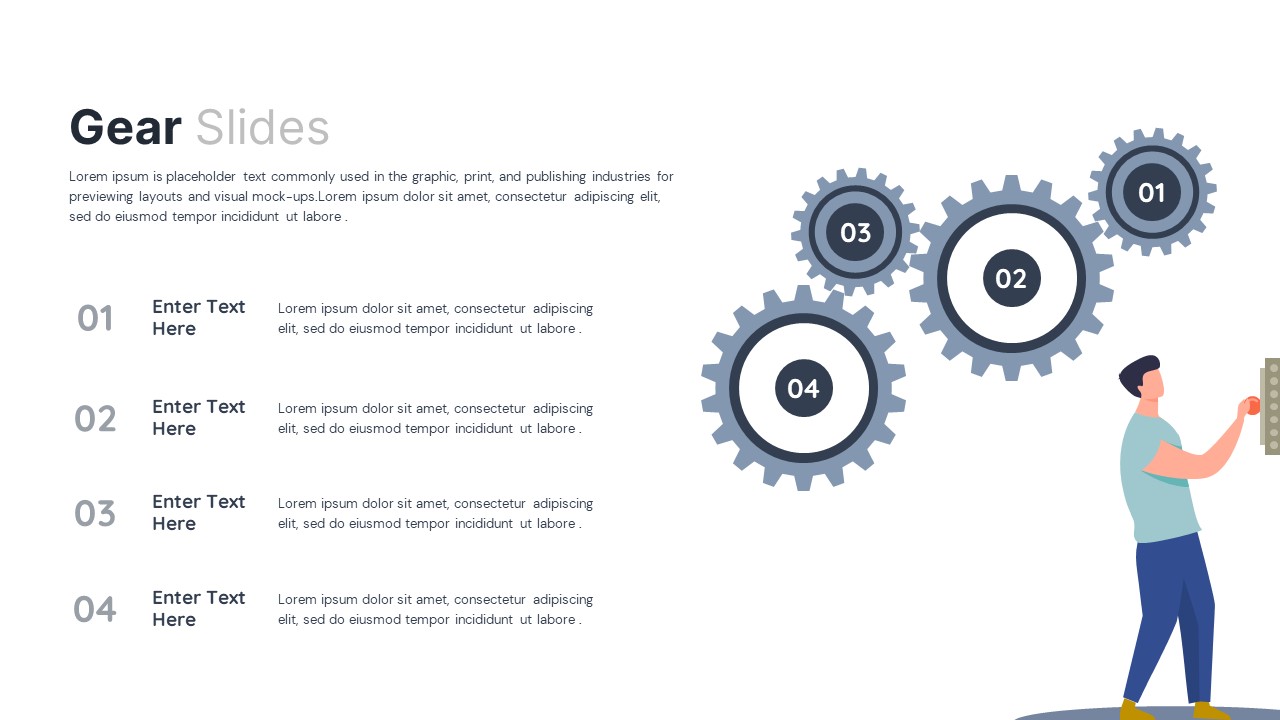
Animated Gear Slide for Process Mapping Template for PowerPoint & Google Slides
Process
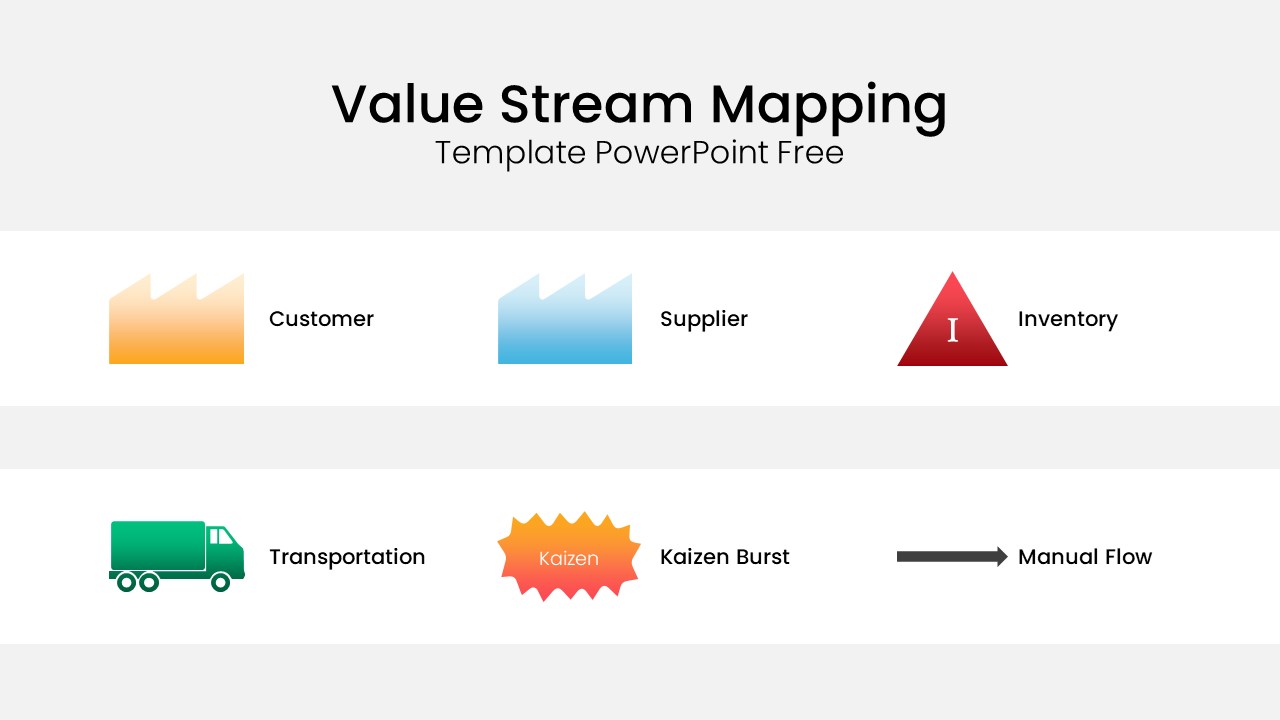
Value Stream Mapping Symbol Legend Template for PowerPoint & Google Slides
Charts
Free
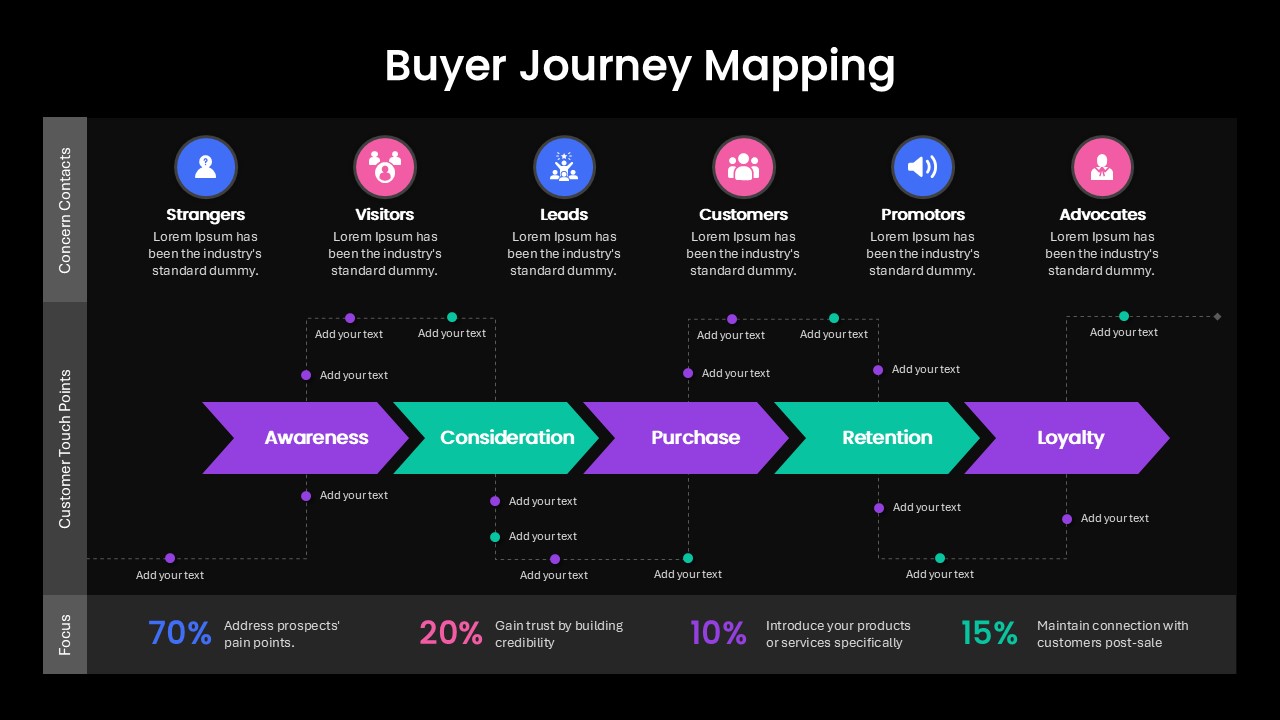
Buyer Journey Mapping Process Diagram Template for PowerPoint & Google Slides
Process
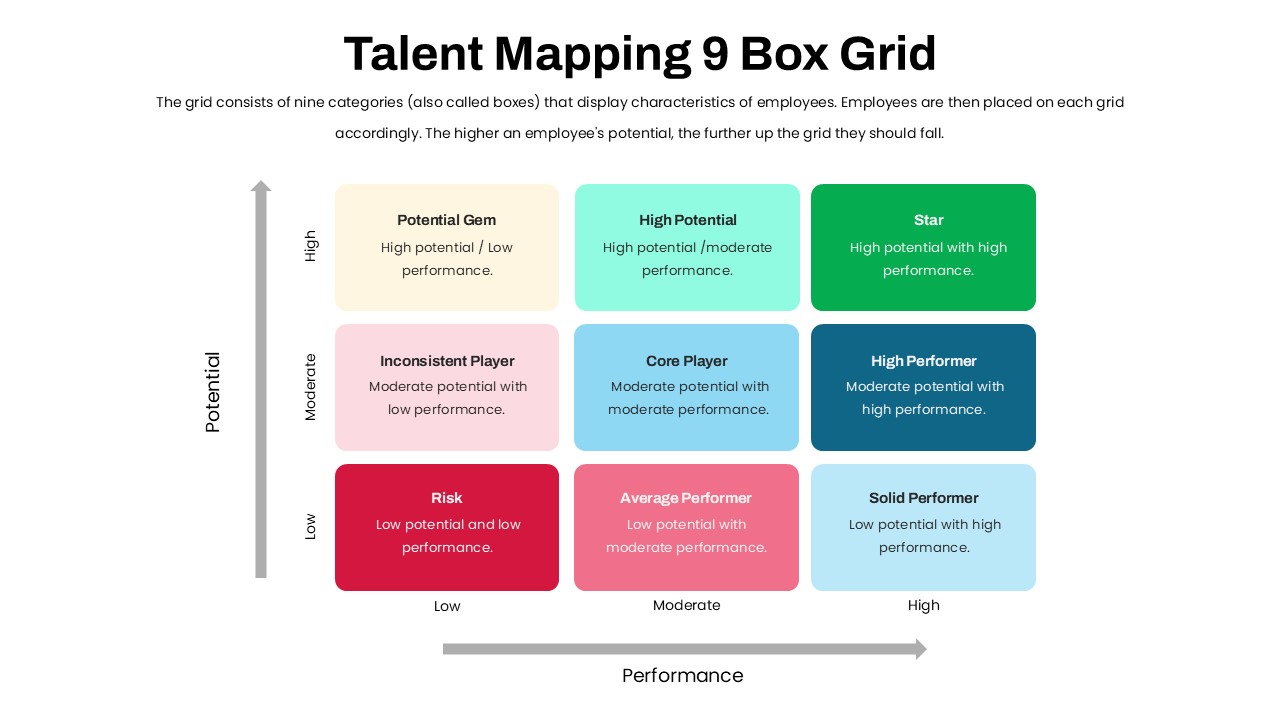
Talent Mapping 9-Box Grid Template for PowerPoint & Google Slides
Employee Performance
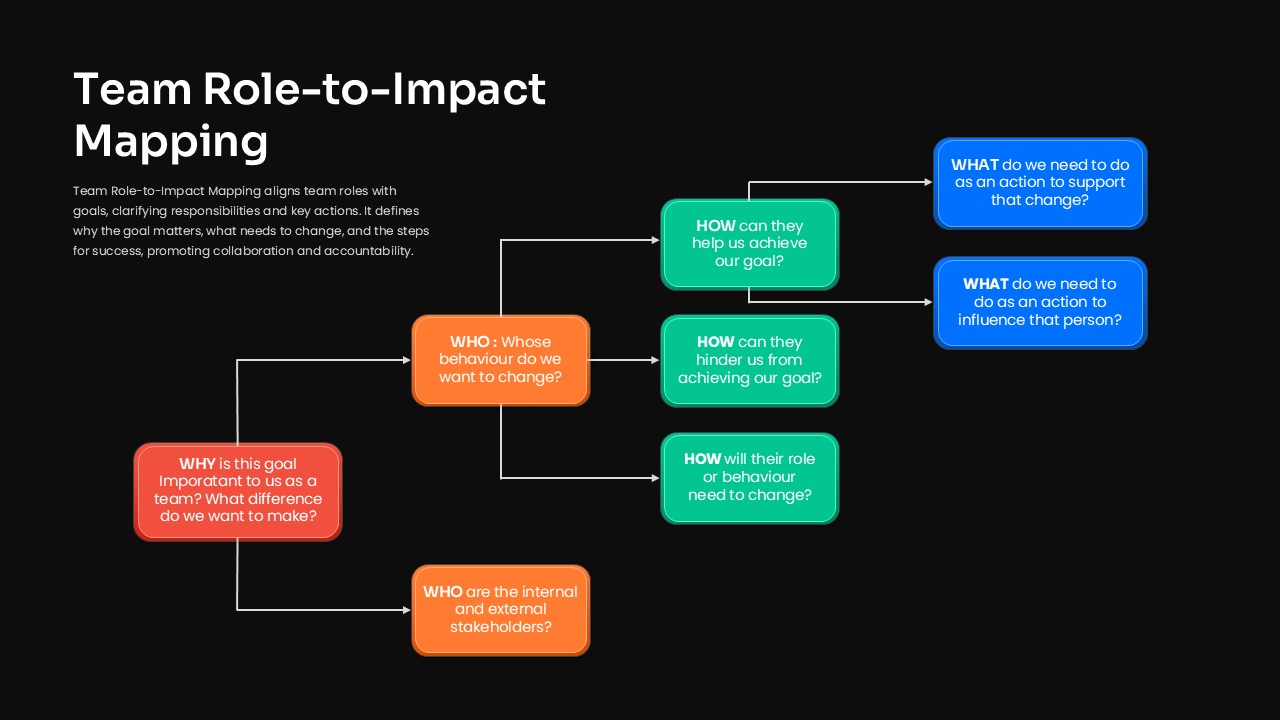
Team Role-to-Impact Mapping Flowchart Template for PowerPoint & Google Slides
Process
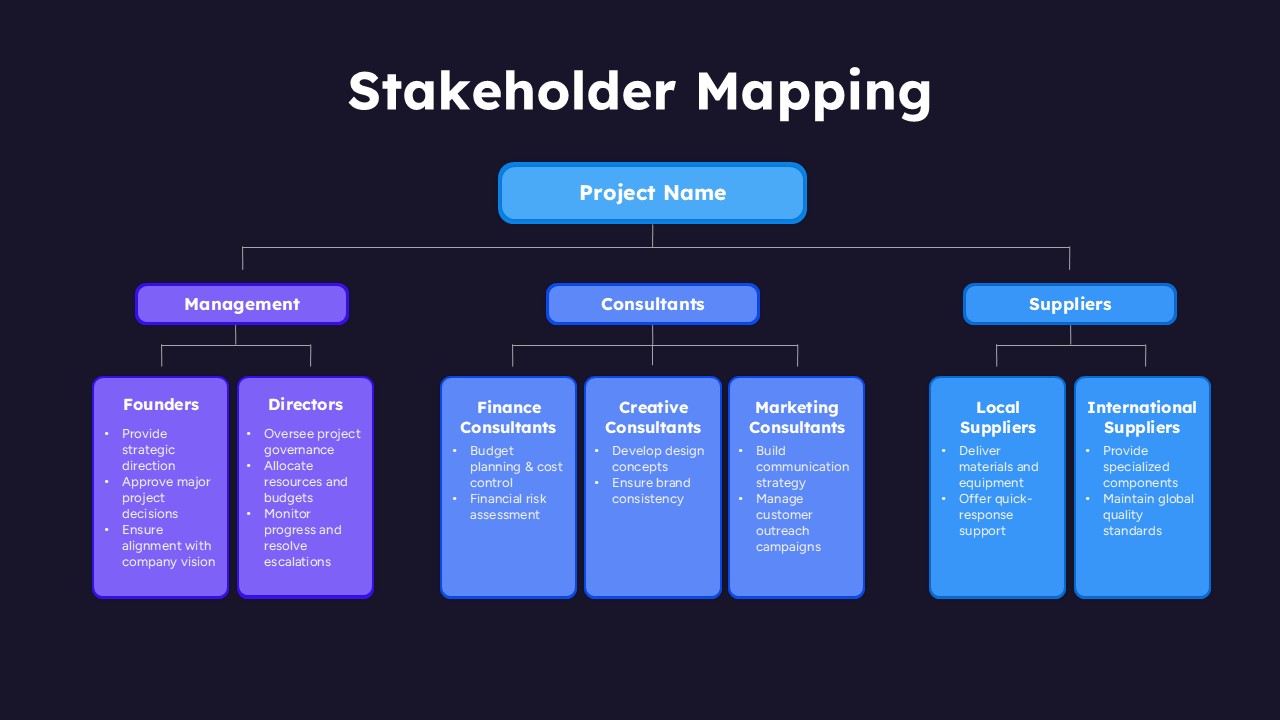
Stakeholder Mapping Organizational Chart Template for PowerPoint & Google Slides
Org Chart