Regression in Supervised Learning Overview template for PowerPoint & Google Slides
Description
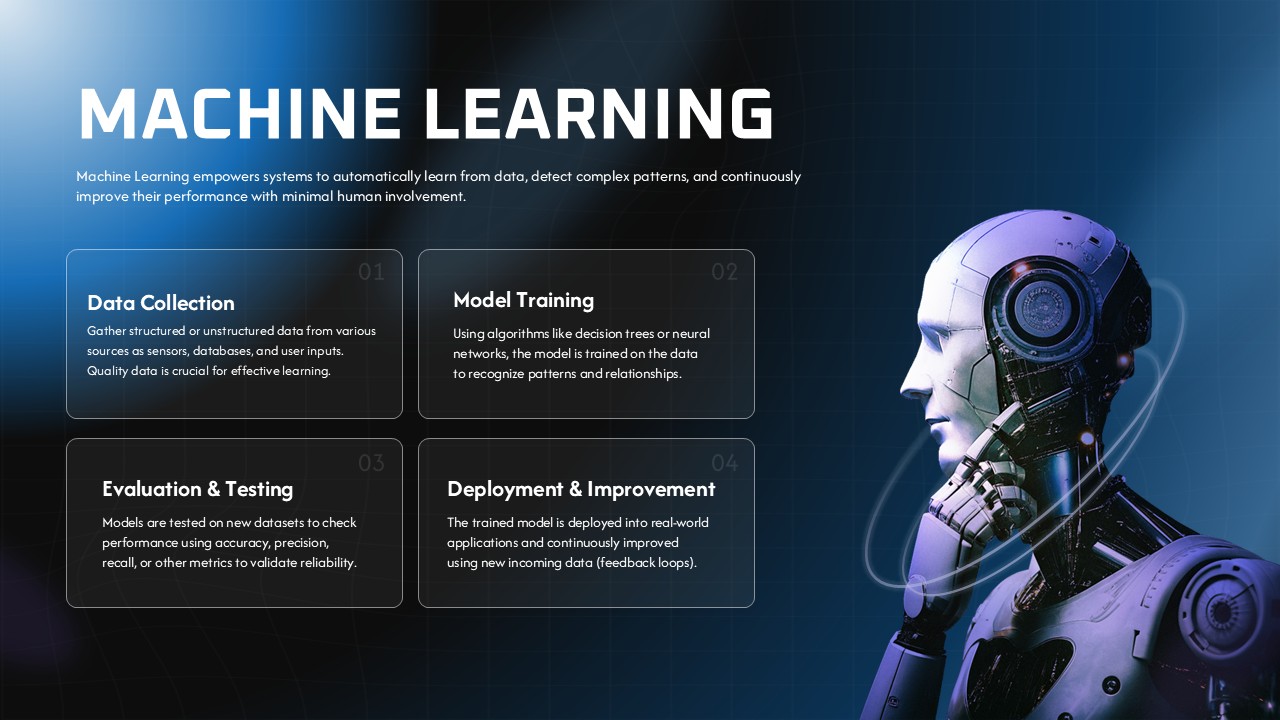
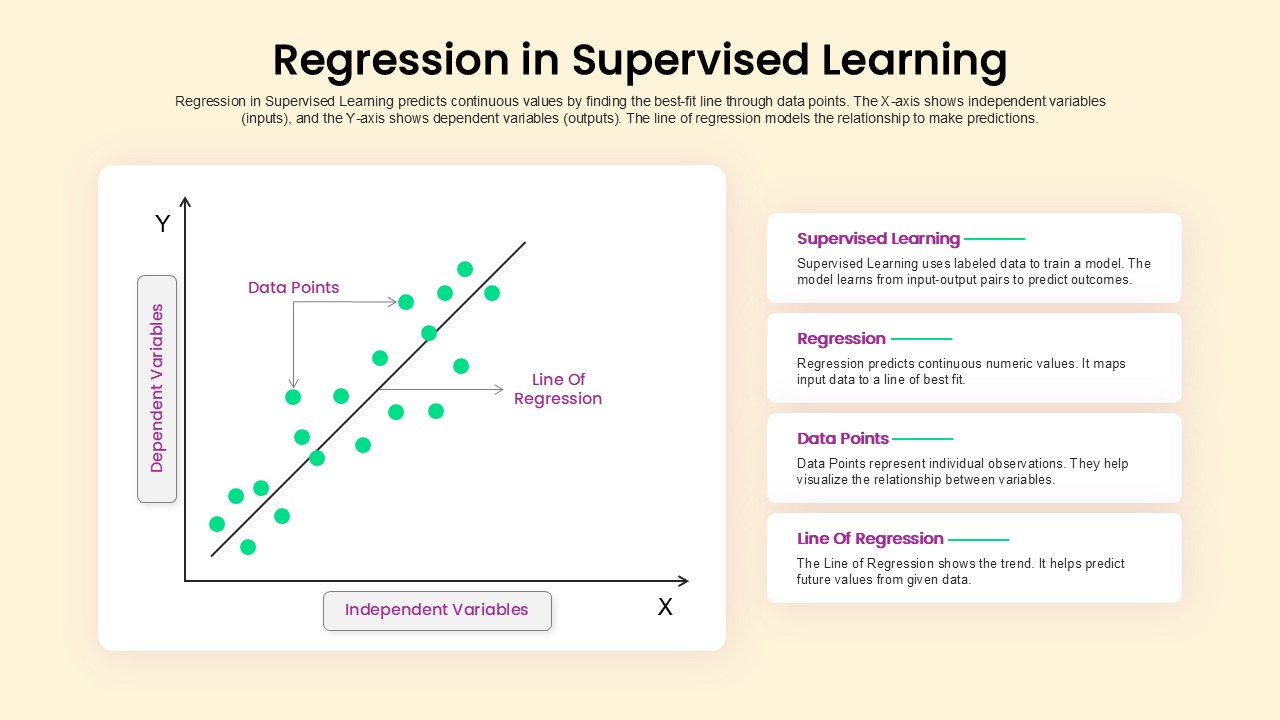
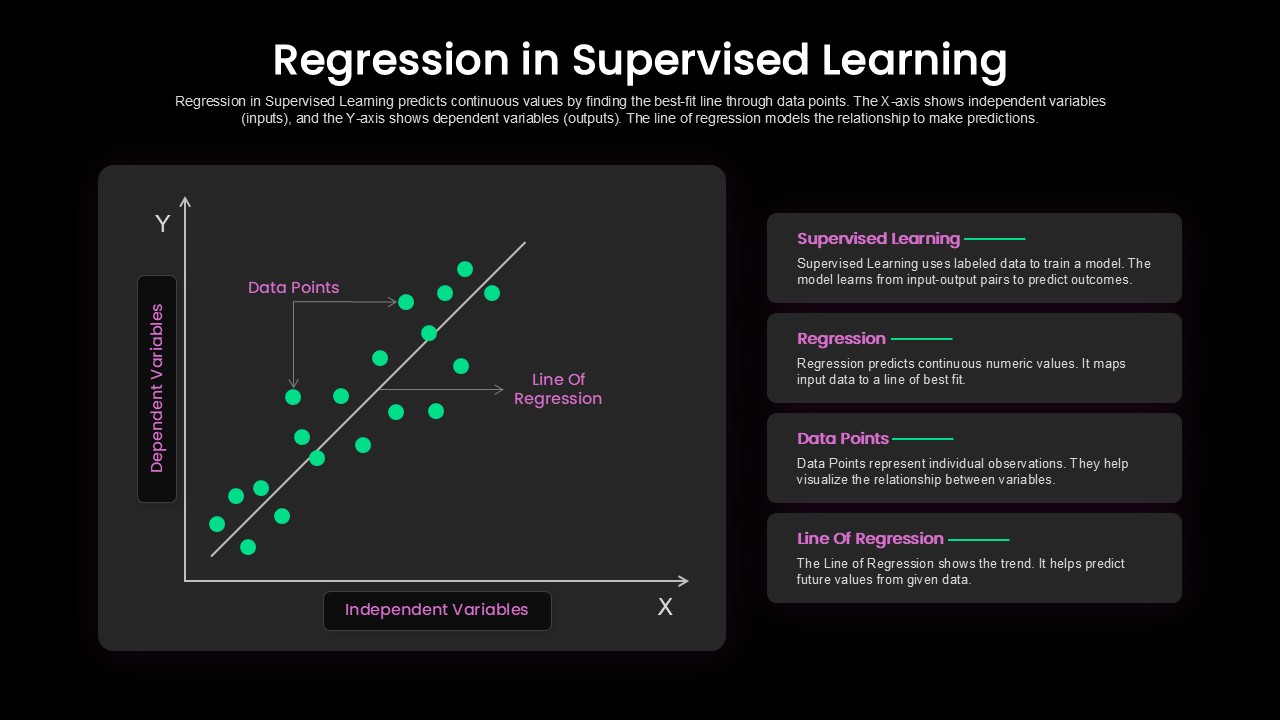
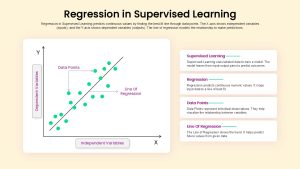
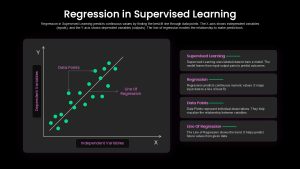
This slide explains the concept of regression within the context of supervised learning, a fundamental machine learning technique. It illustrates how regression predicts continuous values by drawing the best-fit line through data points, with the X-axis representing independent variables and the Y-axis representing dependent variables. The line of regression models the relationship between these variables, helping make predictions about future data.
The slide includes key elements such as “Supervised Learning,” “Regression,” “Data Points,” and the “Line of Regression,” each clearly defined in the four boxes on the right side. This helps provide a succinct yet informative overview of the process. With its simple yet effective design and accompanying labels, this slide is perfect for explaining regression concepts in data science, machine learning, and statistics.
Who is it for
This slide is ideal for data scientists, machine learning engineers, statisticians, and educators explaining supervised learning concepts. It is also valuable for students, business analysts, and professionals looking to understand or present regression analysis in the context of machine learning.
Other Uses
Adapt this slide to explain other machine learning techniques, such as classification models or clustering. It can also be used in workshops or training sessions on data analysis, statistical modeling, or predictive analytics.
Login to download this file

Item ID
SB05184
Related Templates

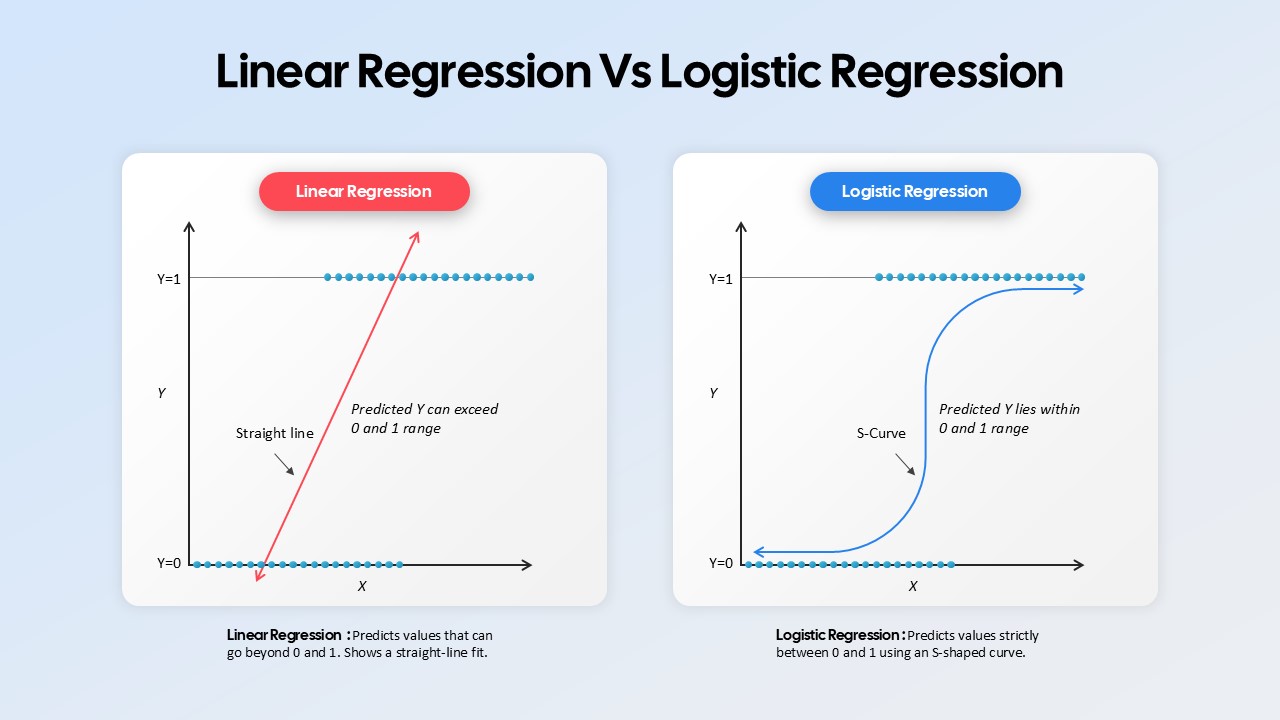
Linear Regression vs Logistic Regression Comparison template for PowerPoint & Google Slides
Comparison
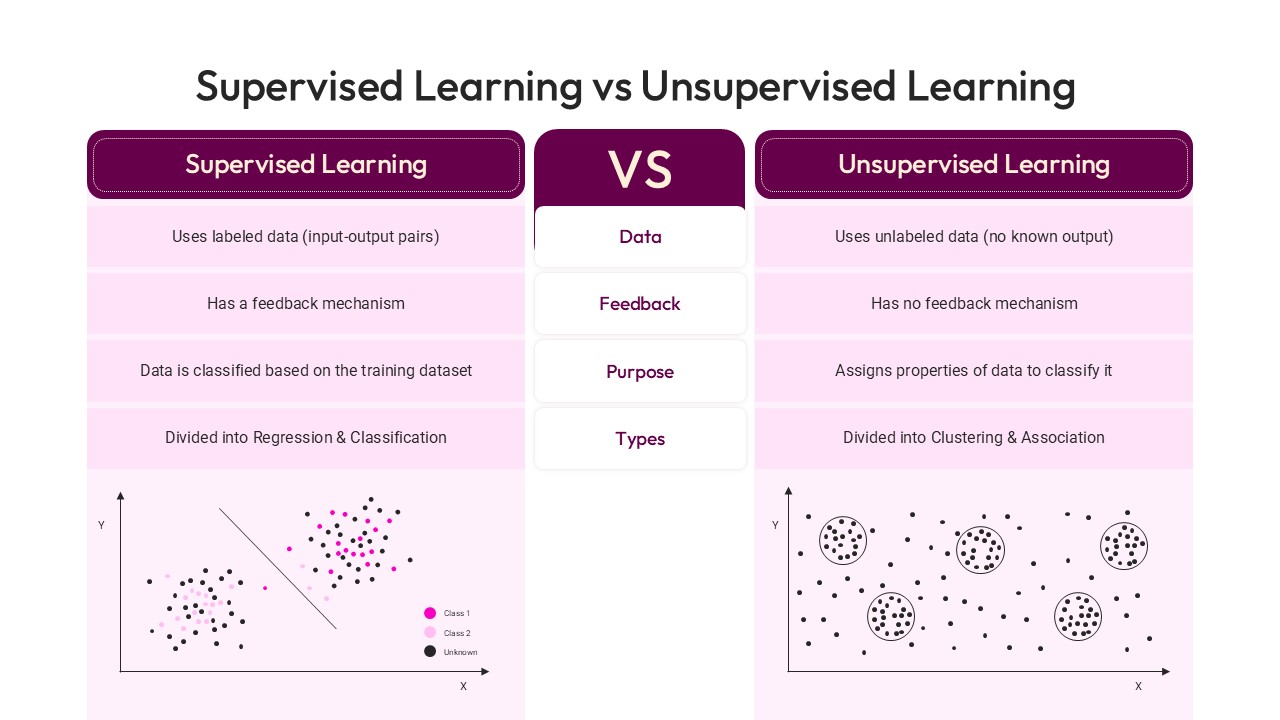
Supervised Learning vs Unsupervised Learning template for PowerPoint & Google Slides
Technology
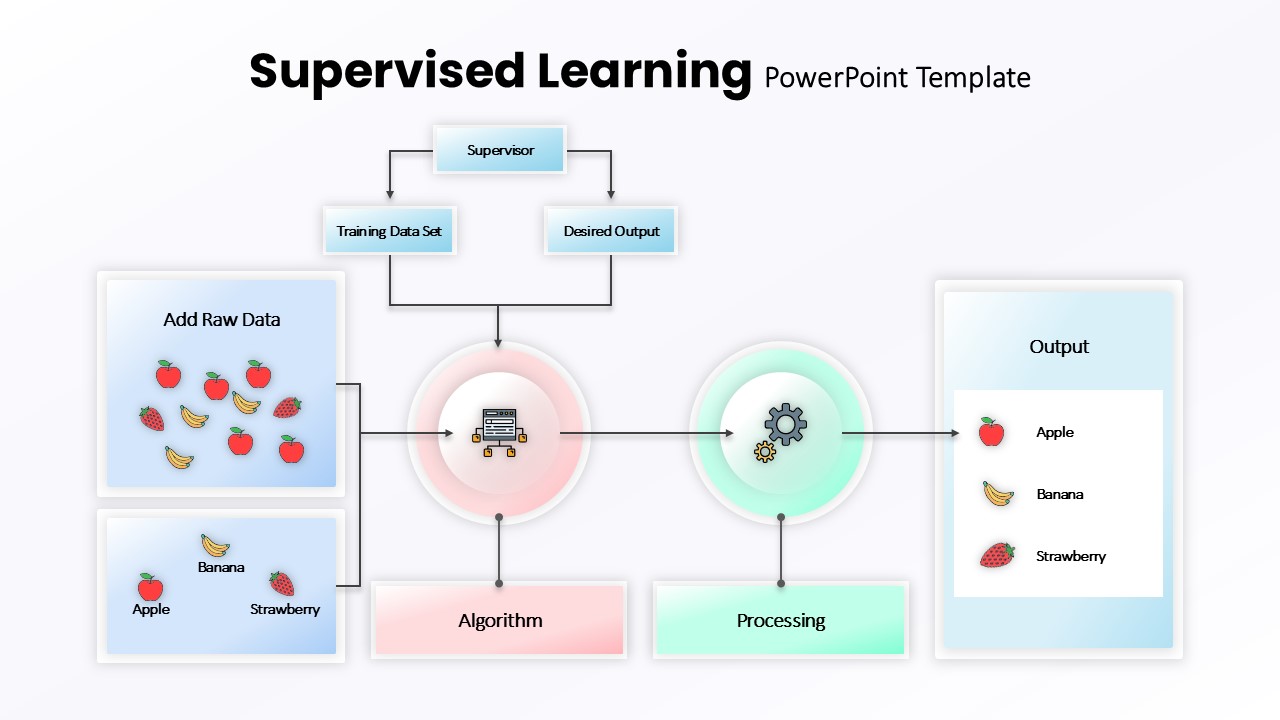
Supervised Learning Overview template for PowerPoint & Google Slides
Technology
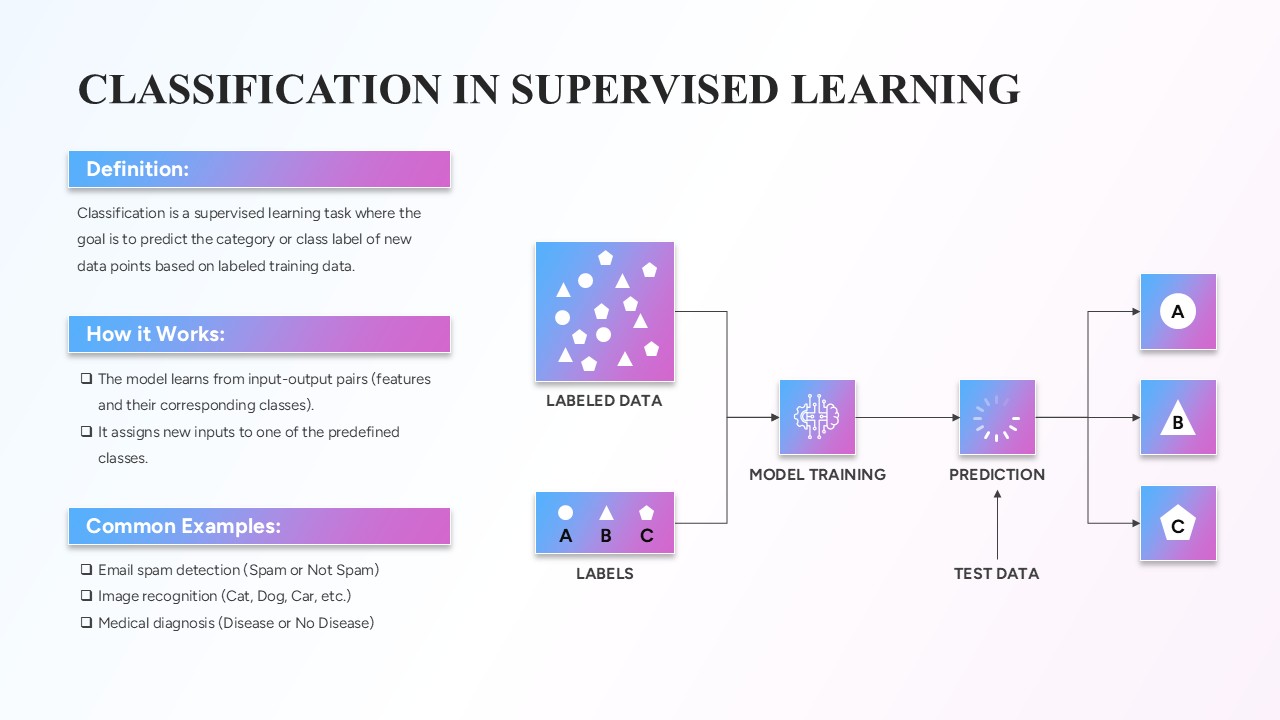
Classification in Supervised Learning template for PowerPoint & Google Slides
Infographics
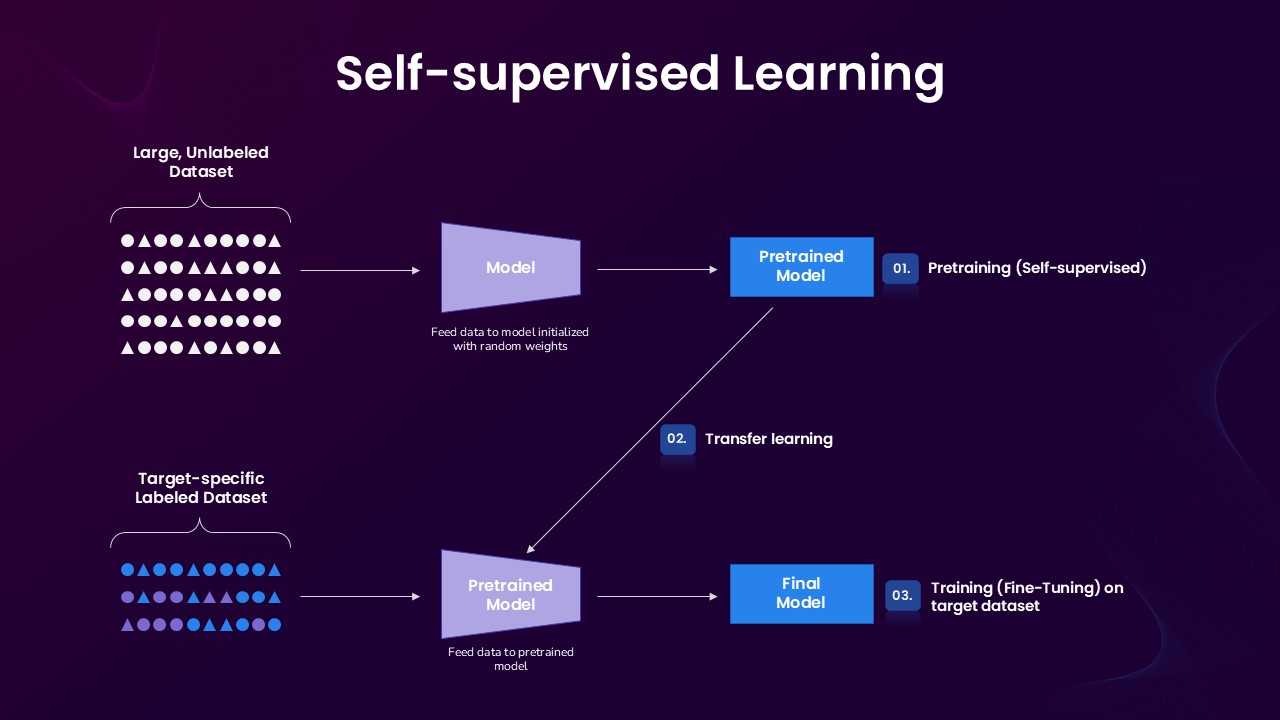
Self-supervised Learning Process template for PowerPoint & Google Slides
Technology
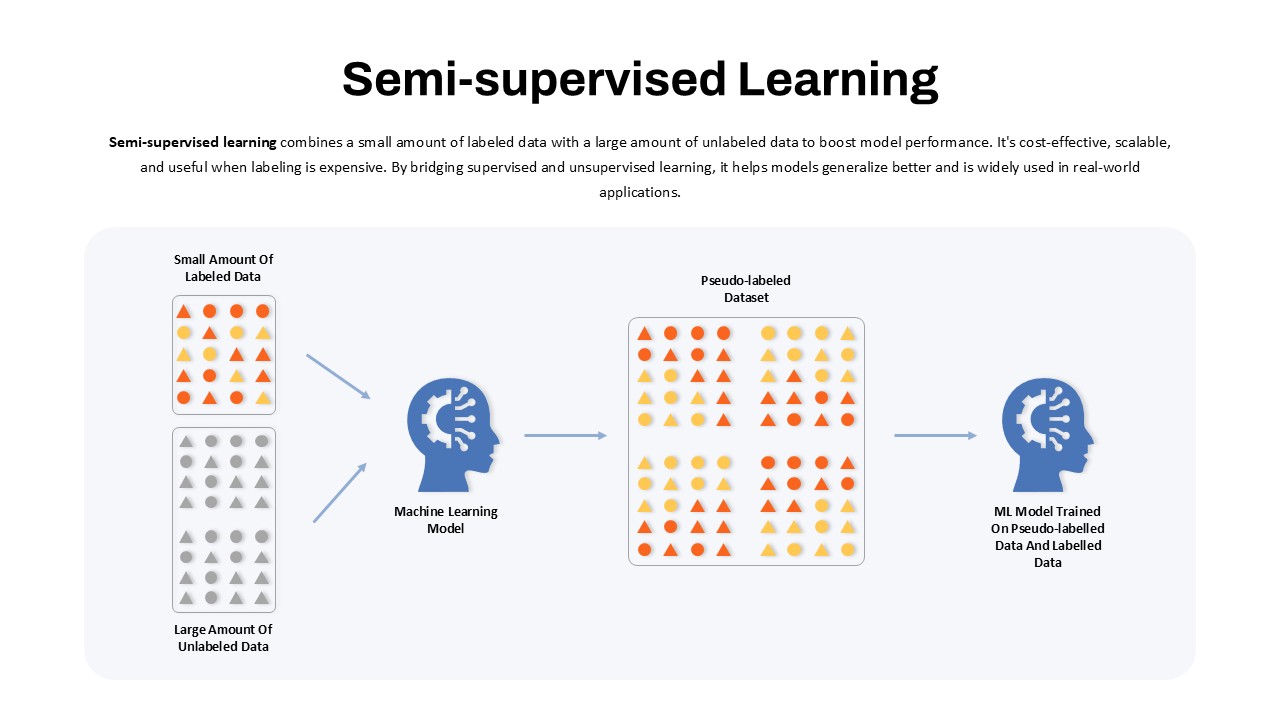
Semi-Supervised Learning Flow Diagram Template for PowerPoint & Google Slides
Machine Learning
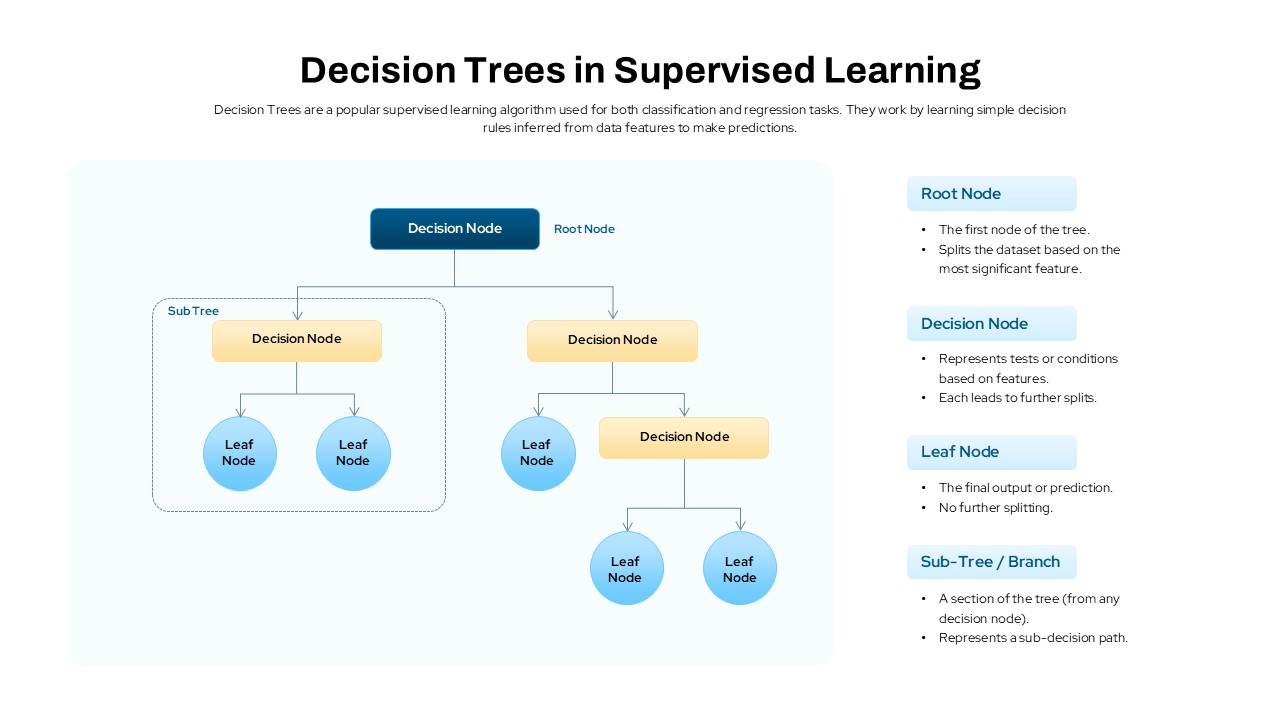
Decision Trees in Supervised Learning Template for PowerPoint & Google Slides
Machine Learning
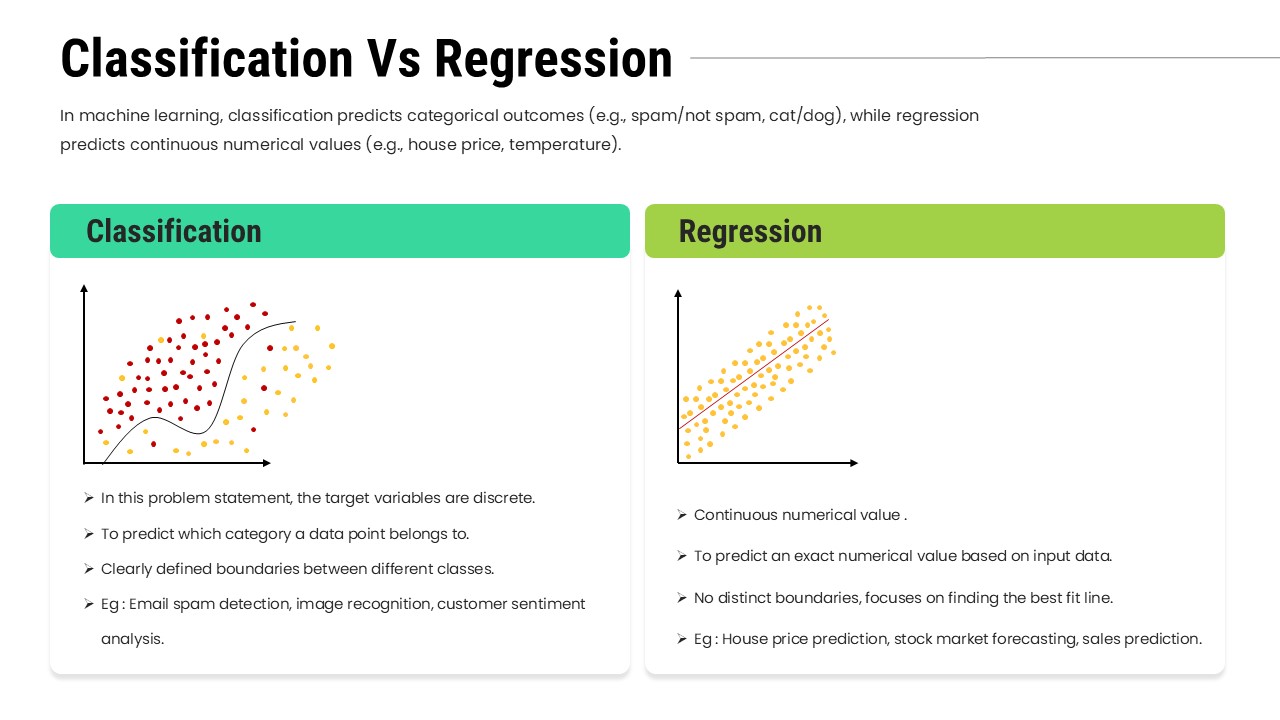
Classification Vs Regression Diagram Template for PowerPoint & Google Slides
Machine Learning
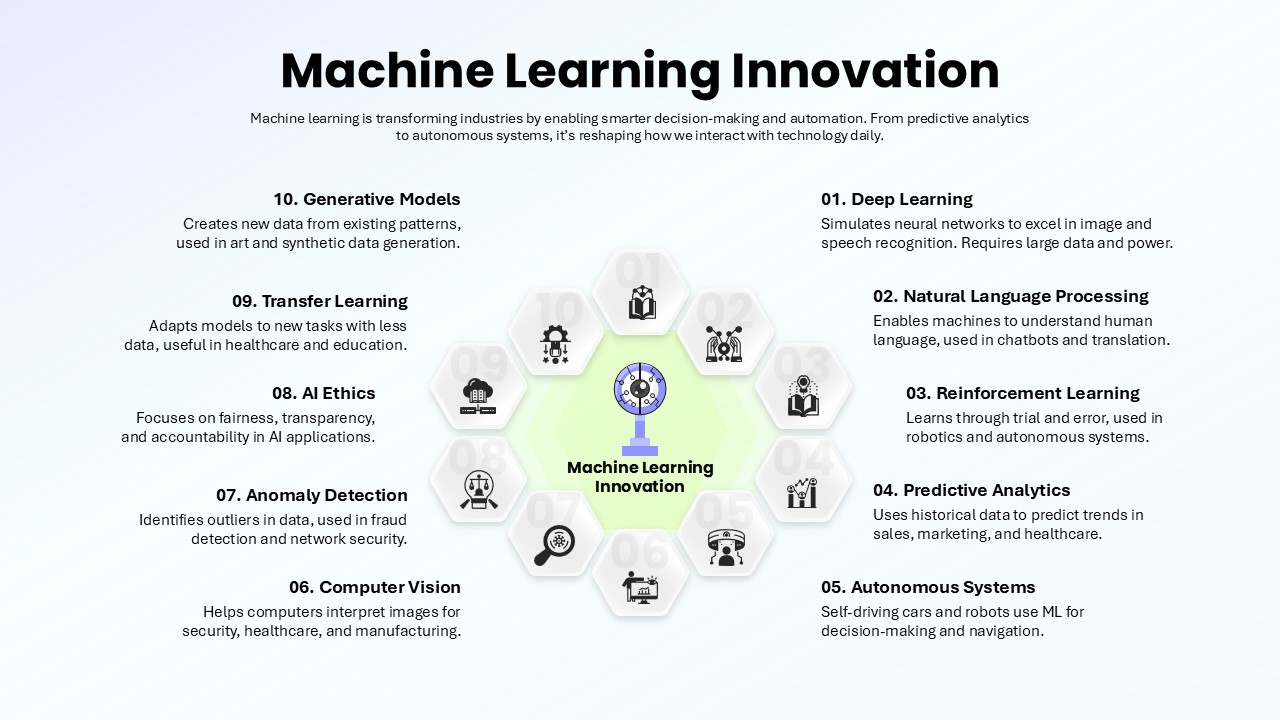
Machine Learning Innovation Overview template for PowerPoint & Google Slides
AI
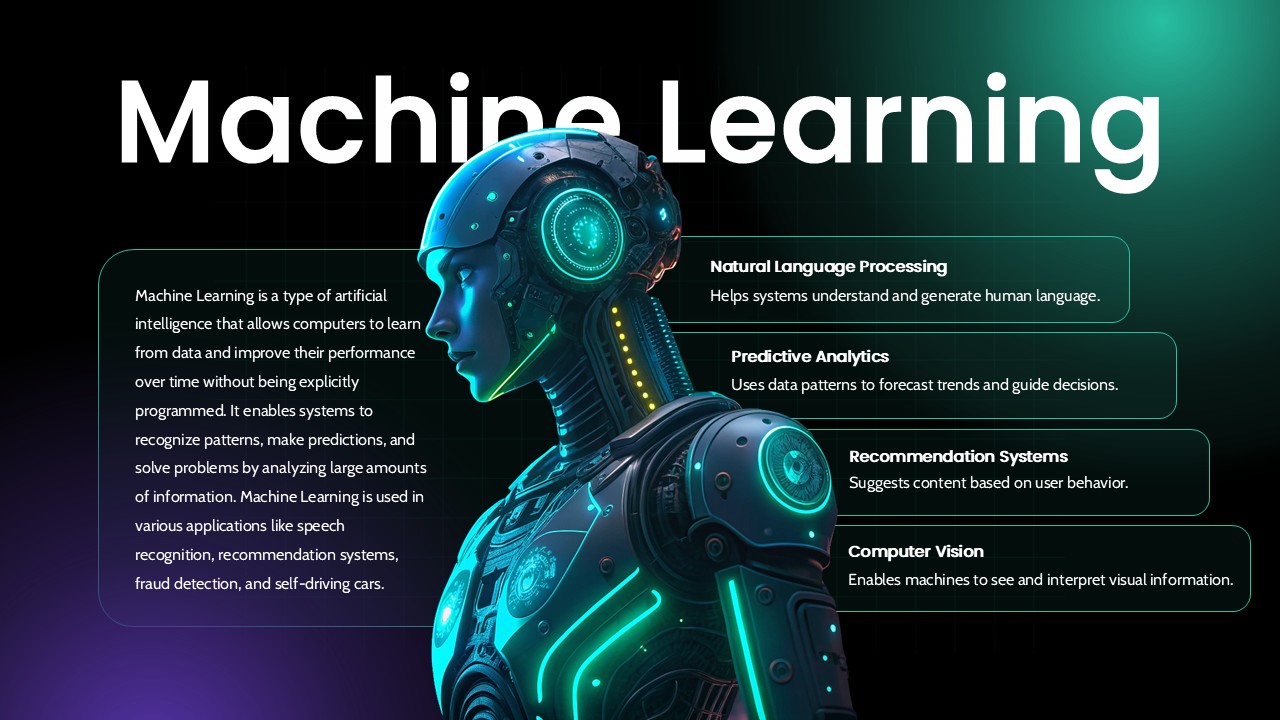
Machine Learning Overview Slide Template for PowerPoint & Google Slides
Machine Learning
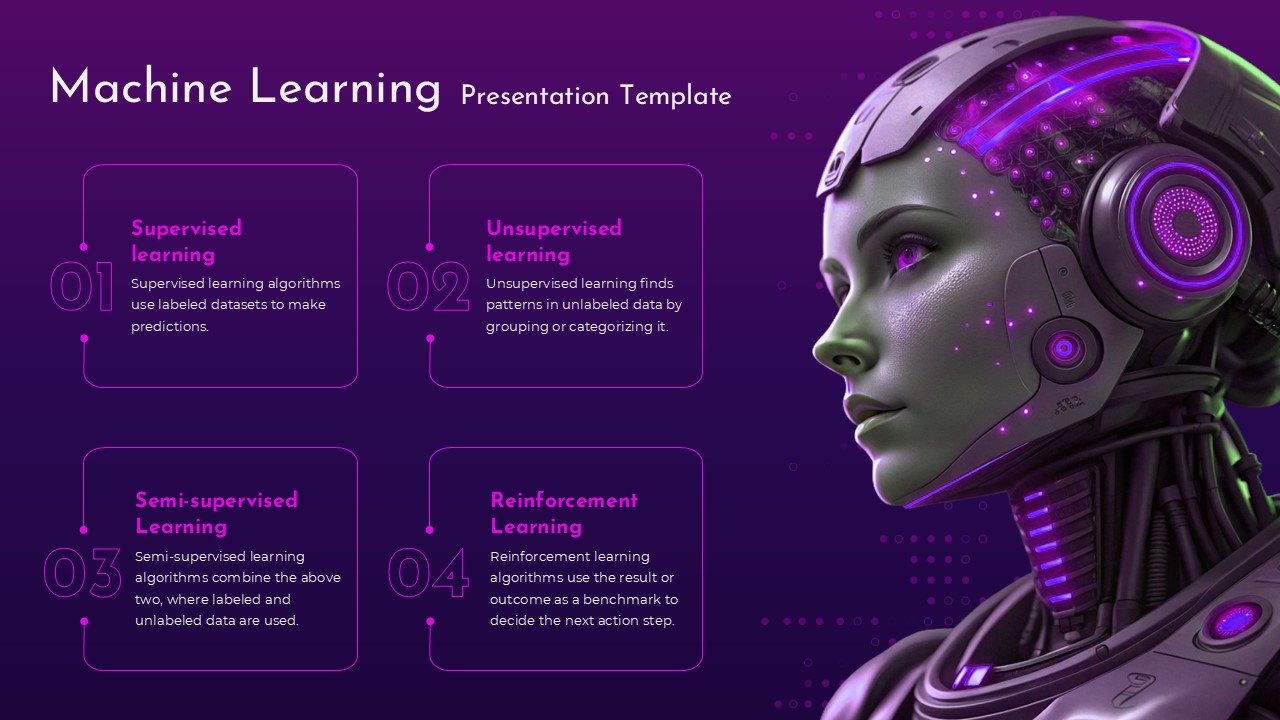
Futuristic Machine Learning Types Overview Template for PowerPoint & Google Slides
AI
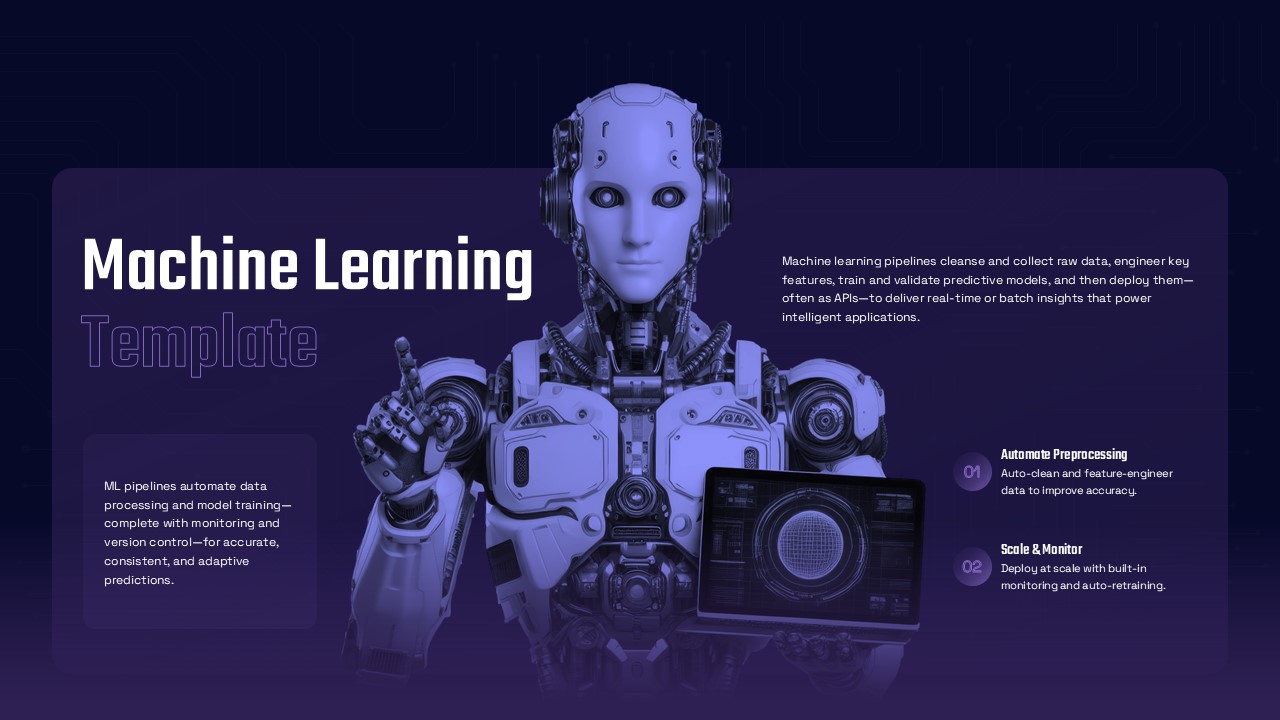
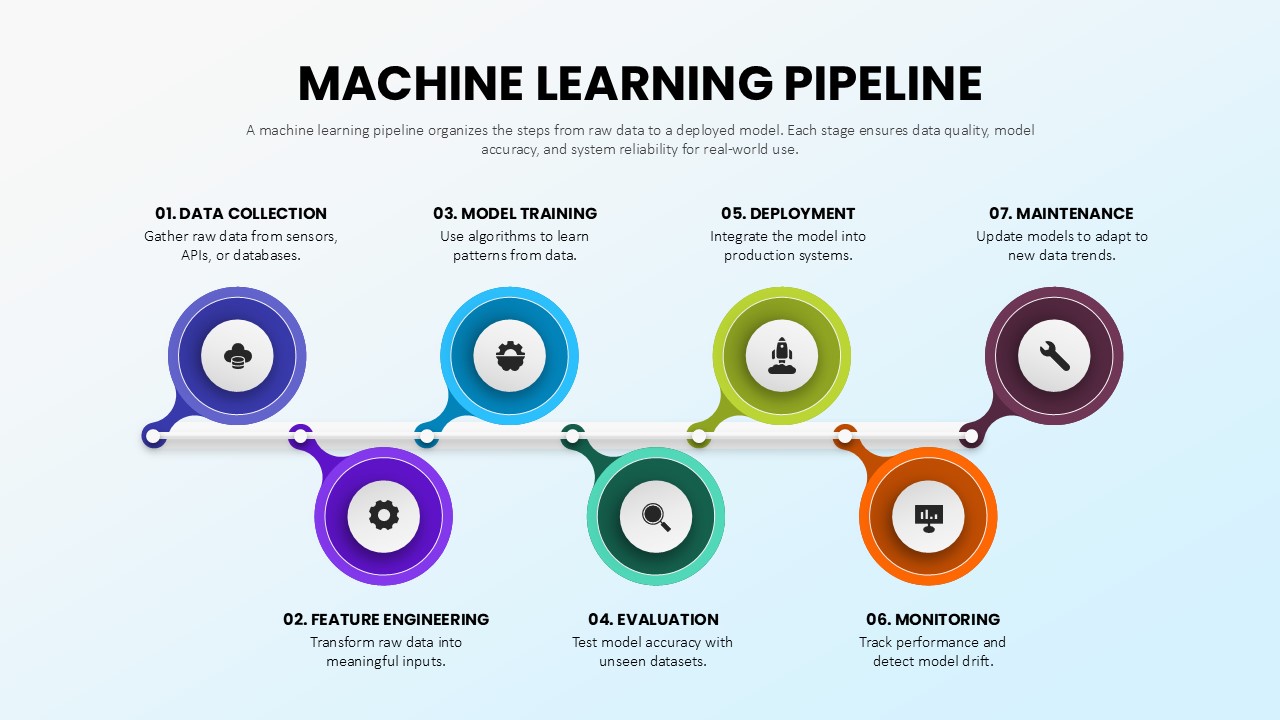
Machine Learning Pipeline Overview Template for PowerPoint & Google Slides
Machine Learning
Online Learning PowerPoint Template for PowerPoint & Google Slides
Customer Journey
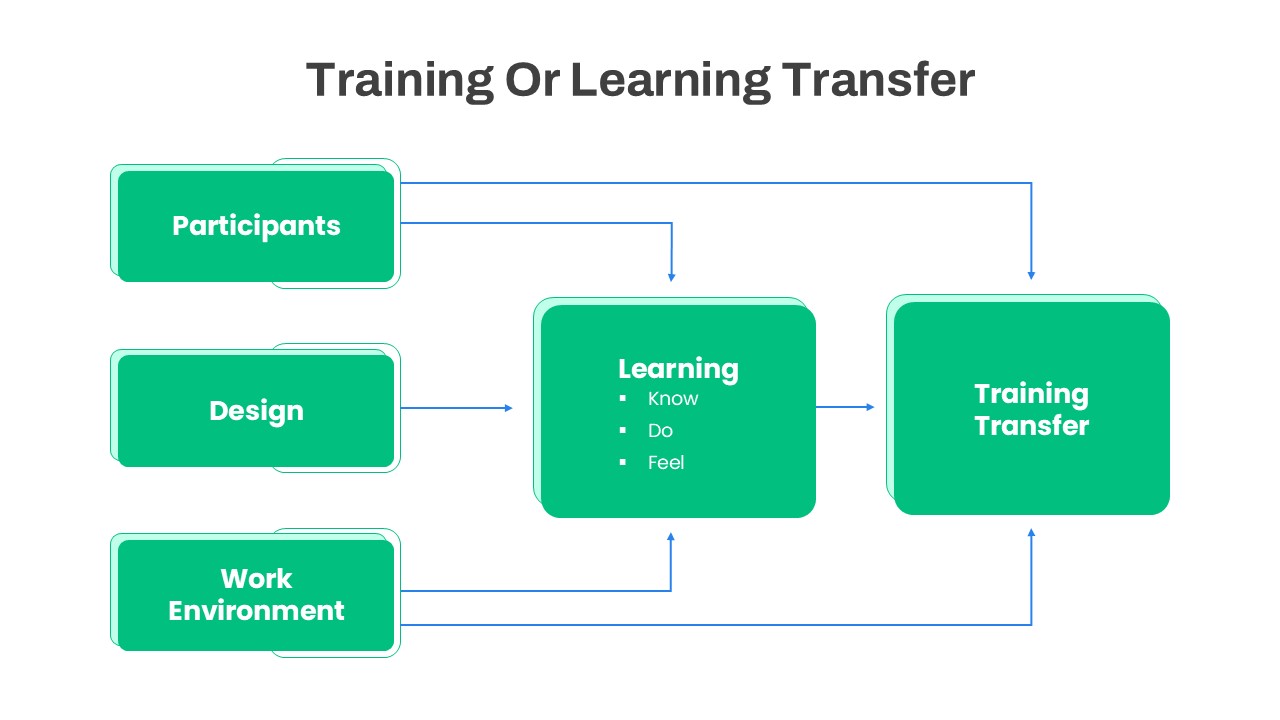
Training or Learning Transfer PowerPoint Template for PowerPoint & Google Slides
Business Proposal
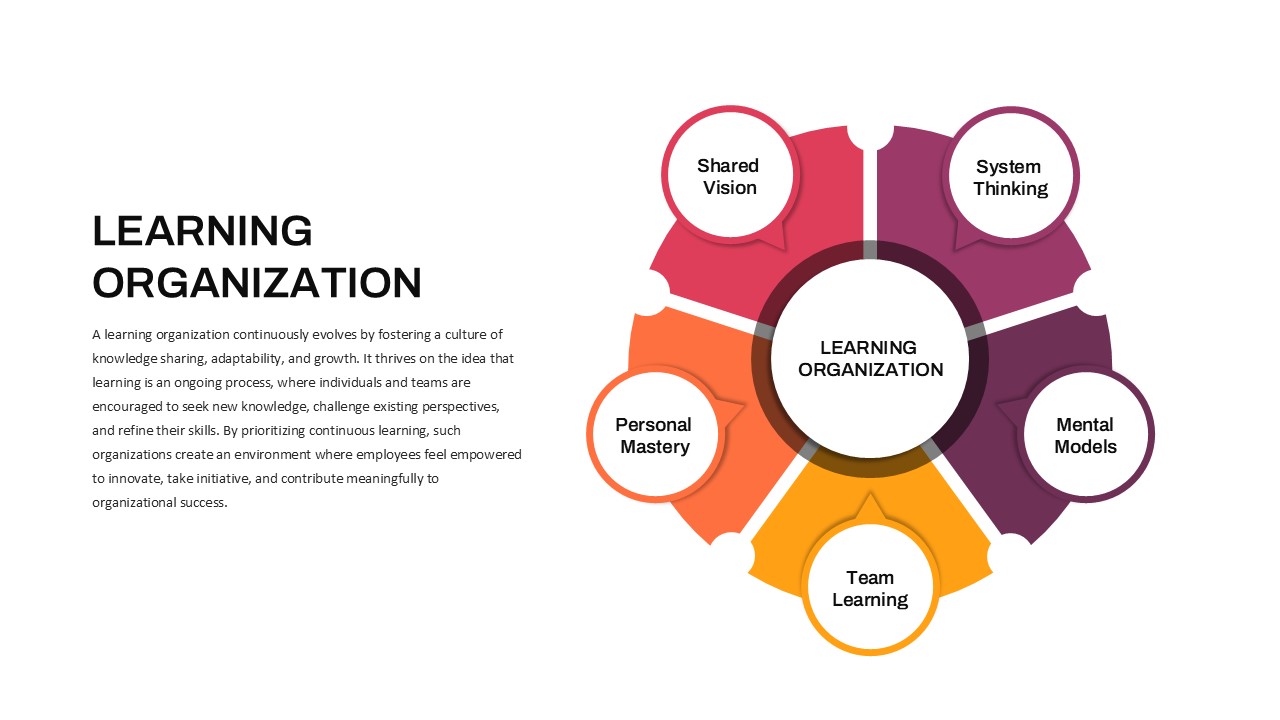
Learning Organization PowerPoint Template for PowerPoint & Google Slides
Business Strategy
E-Learning Report Analysis Template for PowerPoint & Google Slides
Infographics
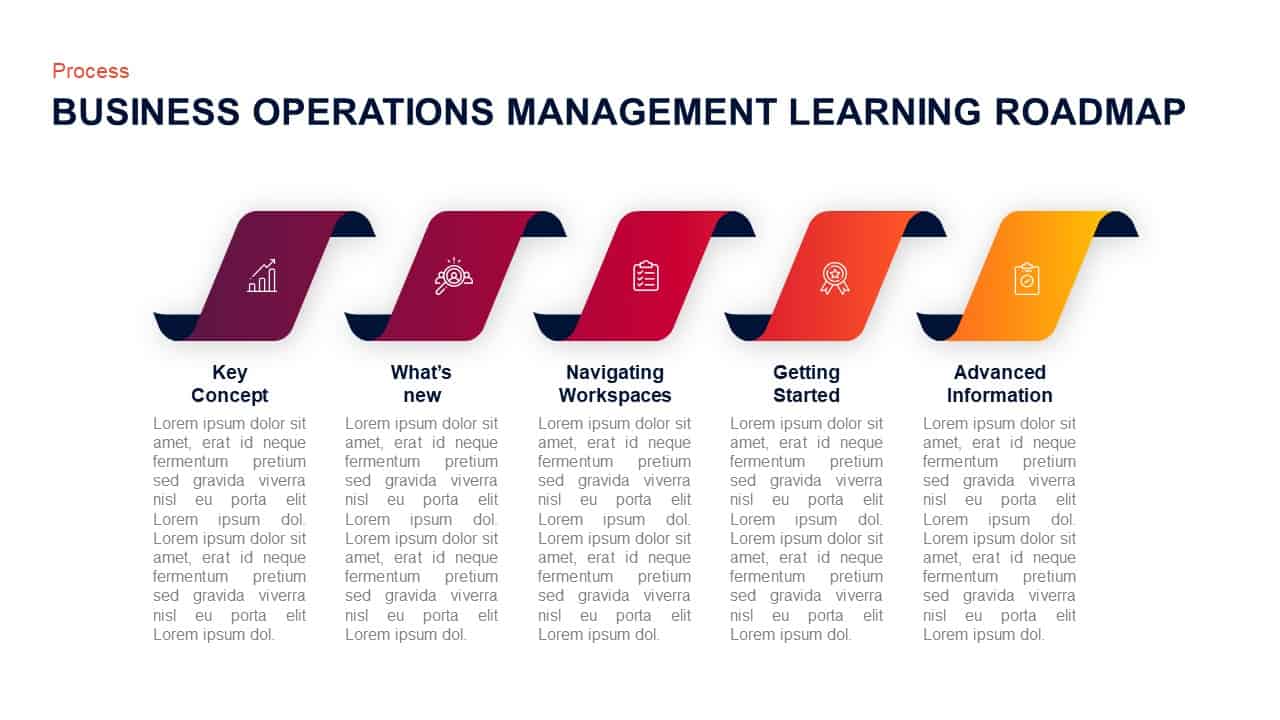
Operations Management Learning Roadmap Template for PowerPoint & Google Slides
Roadmap
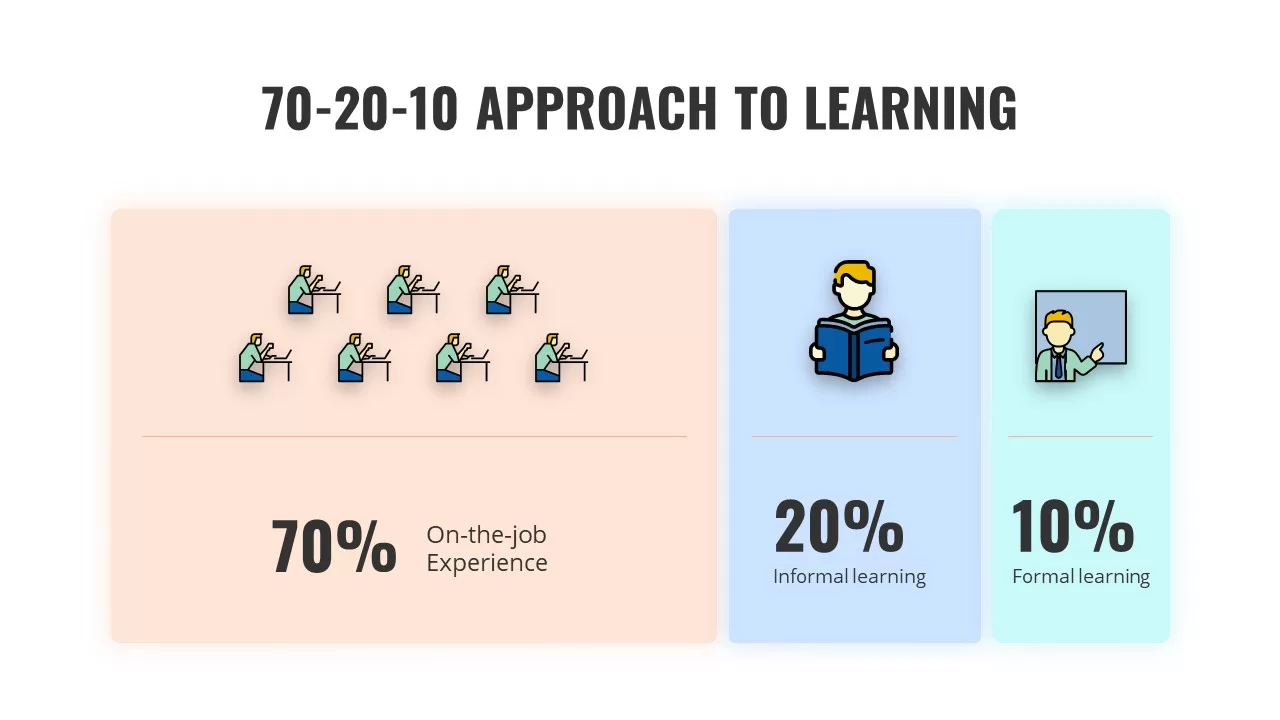
70-20-10 Learning Approach Infographic Template for PowerPoint & Google Slides
Process

4MAT Learning Cycle Circular Diagram Template for PowerPoint & Google Slides
Circular
Free Stylish E-Learning Presentation Template for PowerPoint & Google Slides
Pitch Deck
Free
E-Learning Education Presentation Deck Template for PowerPoint & Google Slides
Decks
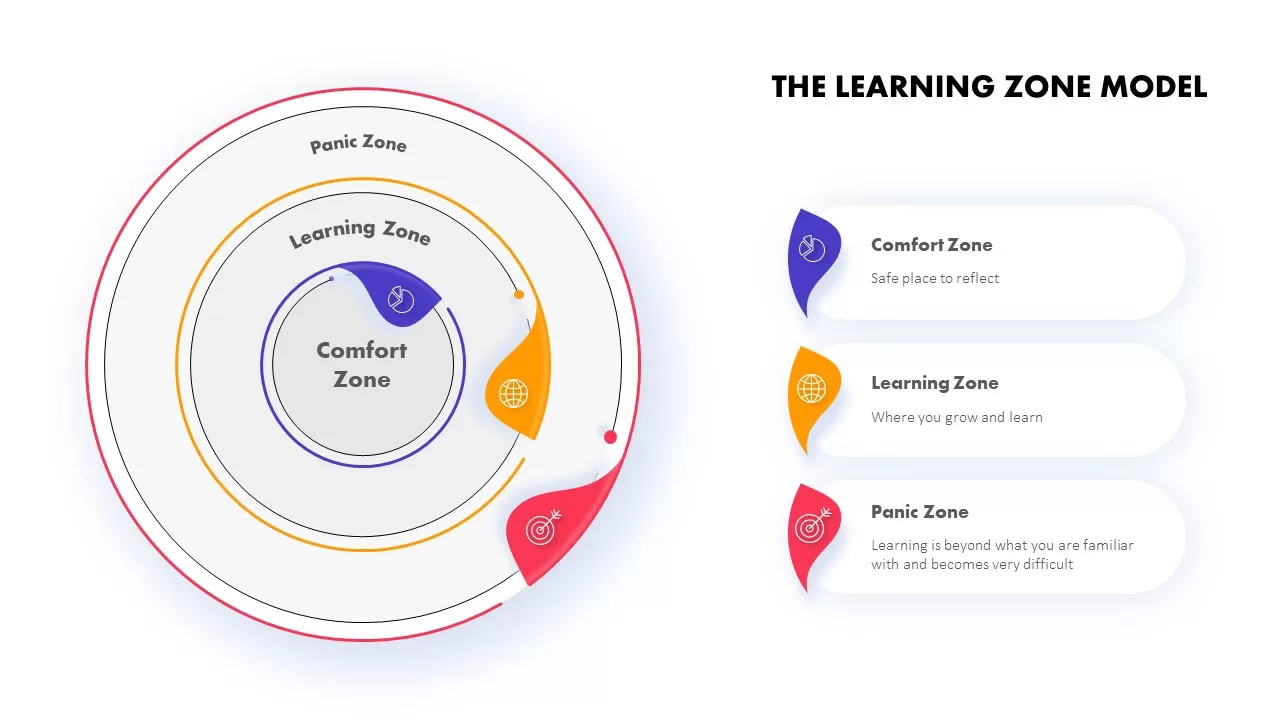
The Learning Zone Model Template for PowerPoint & Google Slides
Process
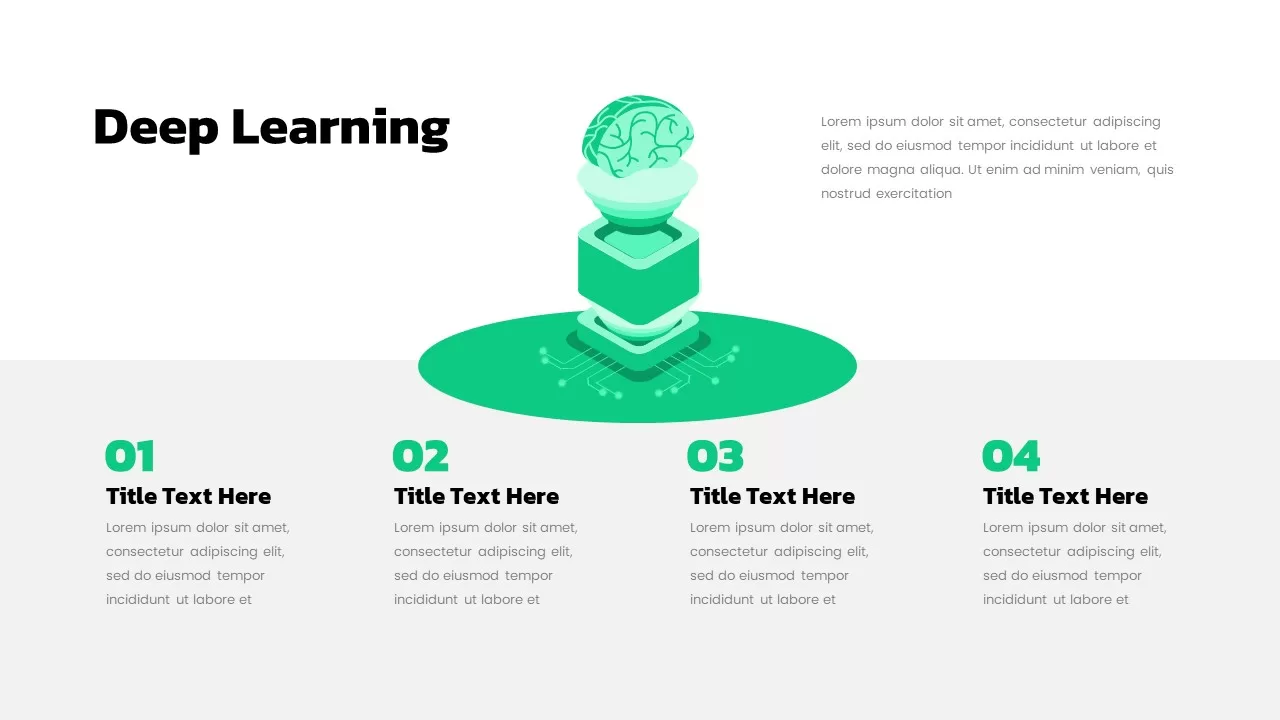
Deep Learning Concept Illustration Template for PowerPoint & Google Slides
Machine Learning
Machine Learning Diagram Template for PowerPoint & Google Slides
Process
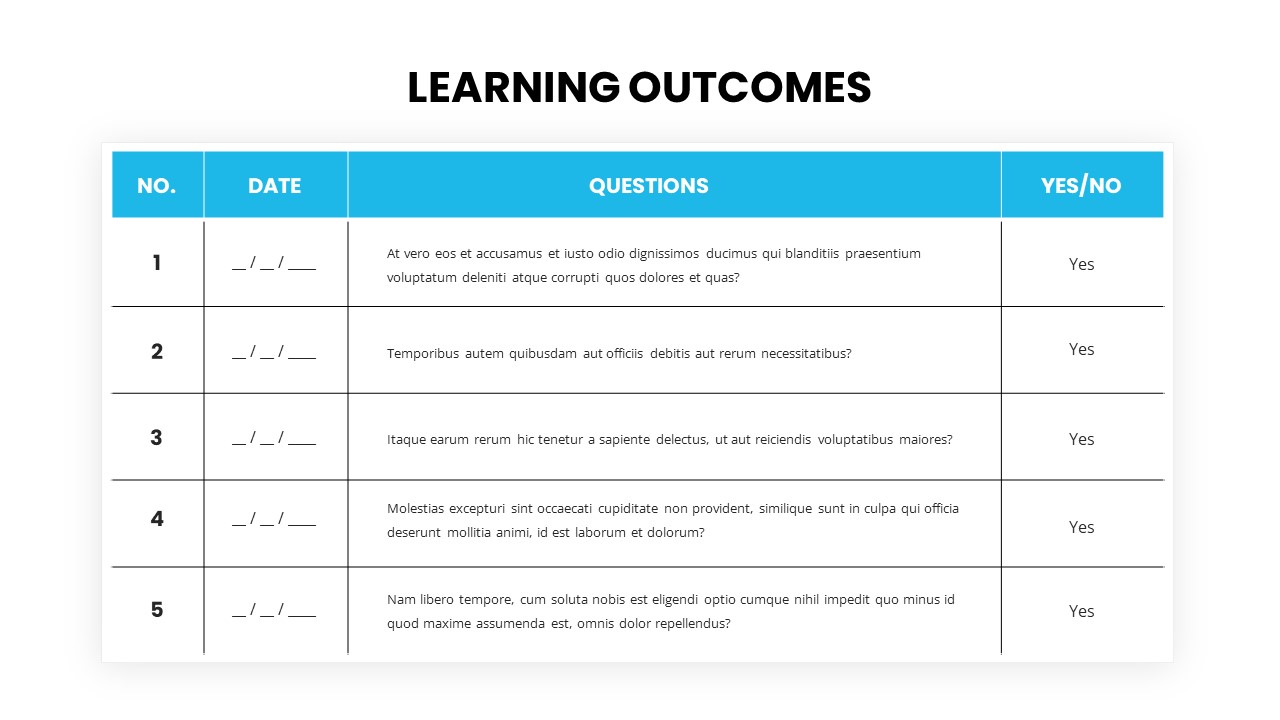
Learning Outcomes table template for PowerPoint & Google Slides
Charts

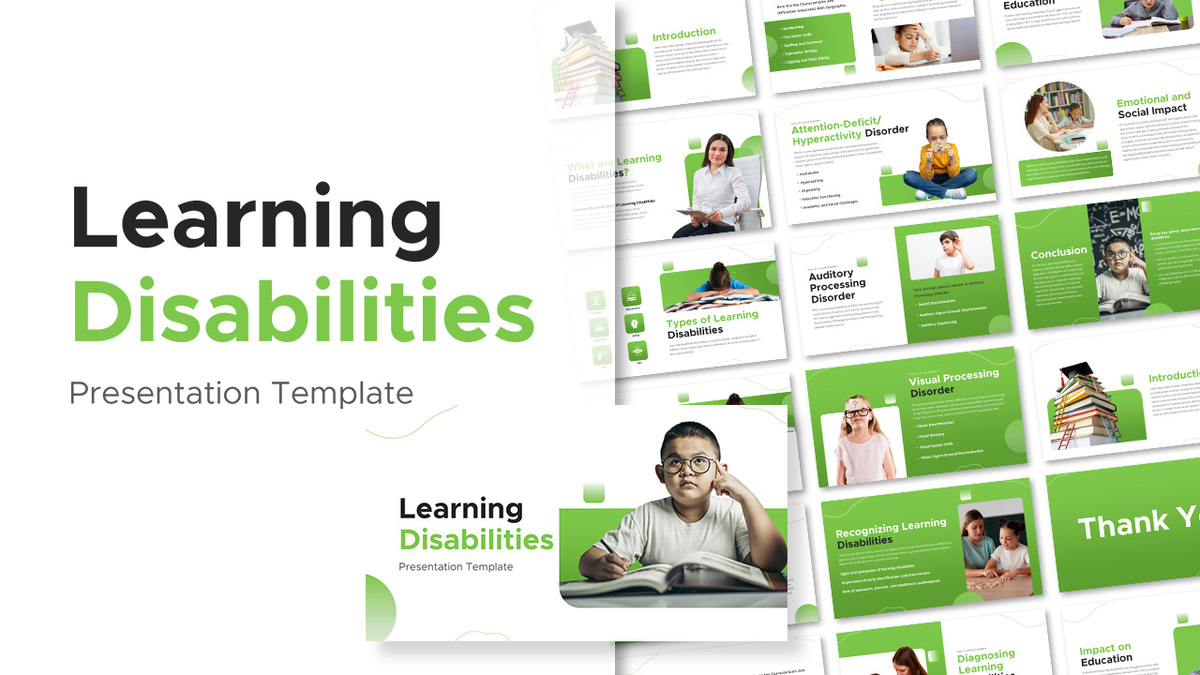
Learning Disabilities Presentation Template for PowerPoint & Google Slides
Company Profile
Free Learning Retention Pyramid Chart Template for PowerPoint & Google Slides
Pyramid
Free
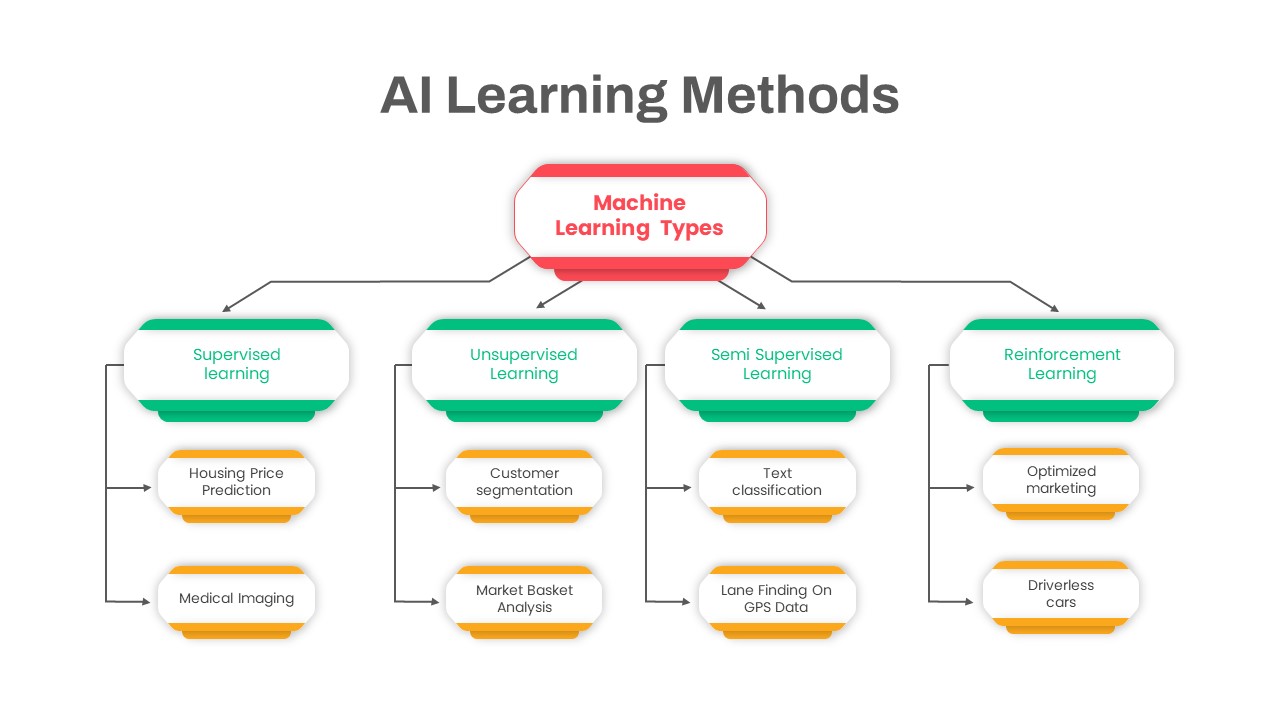
AI Learning Methods Flowchart Diagram Template for PowerPoint & Google Slides
Flow Charts
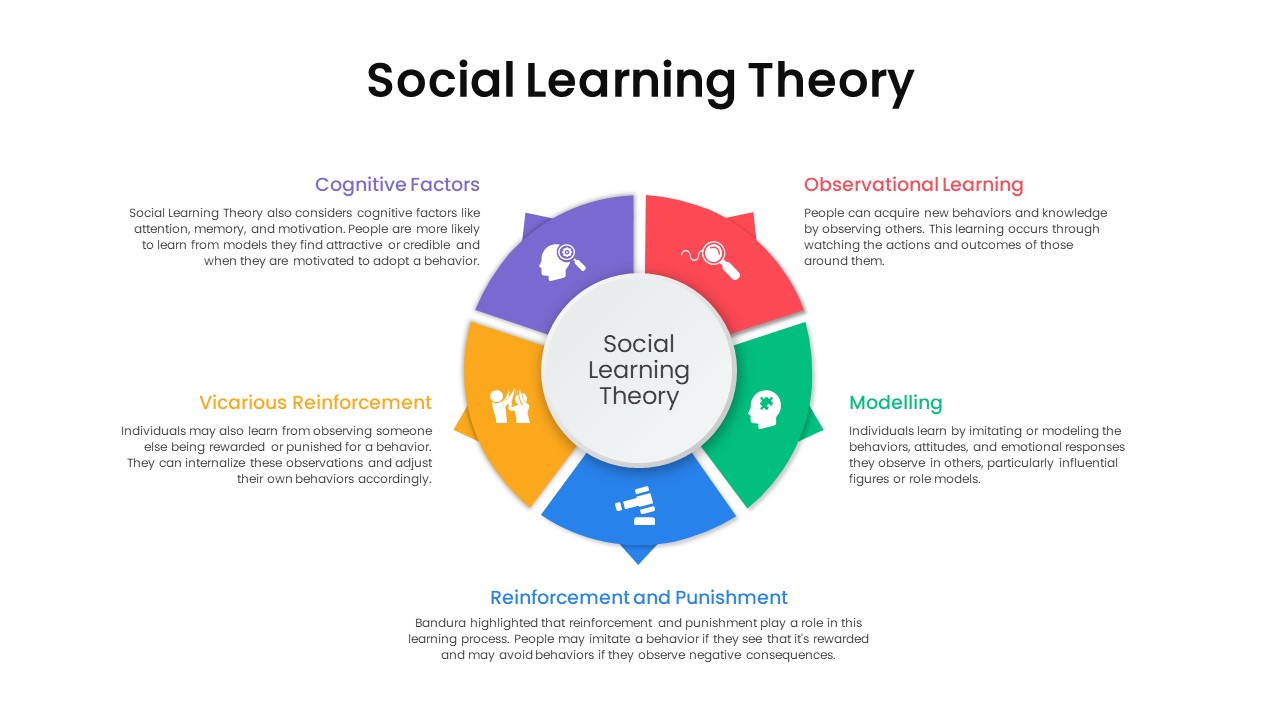
Social Learning Theory Infographic Template for PowerPoint & Google Slides
Circular
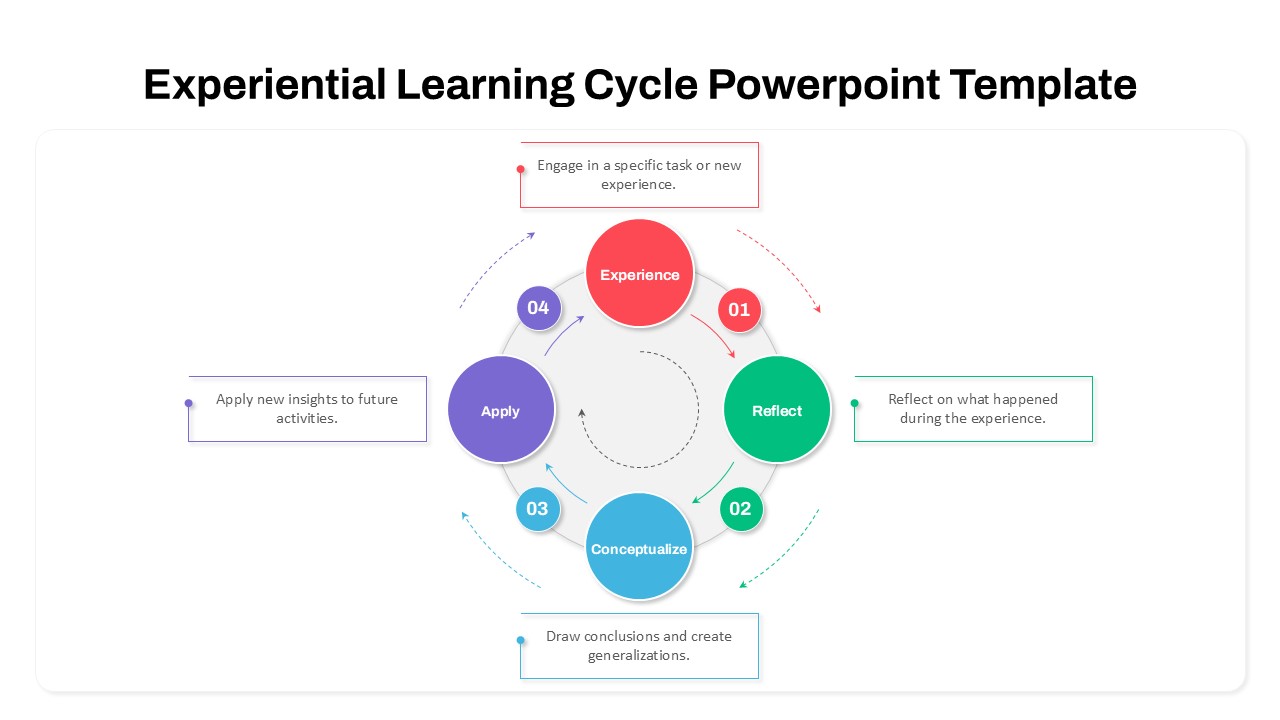
Experiential Learning Cycle Diagram Template for PowerPoint & Google Slides
Circular
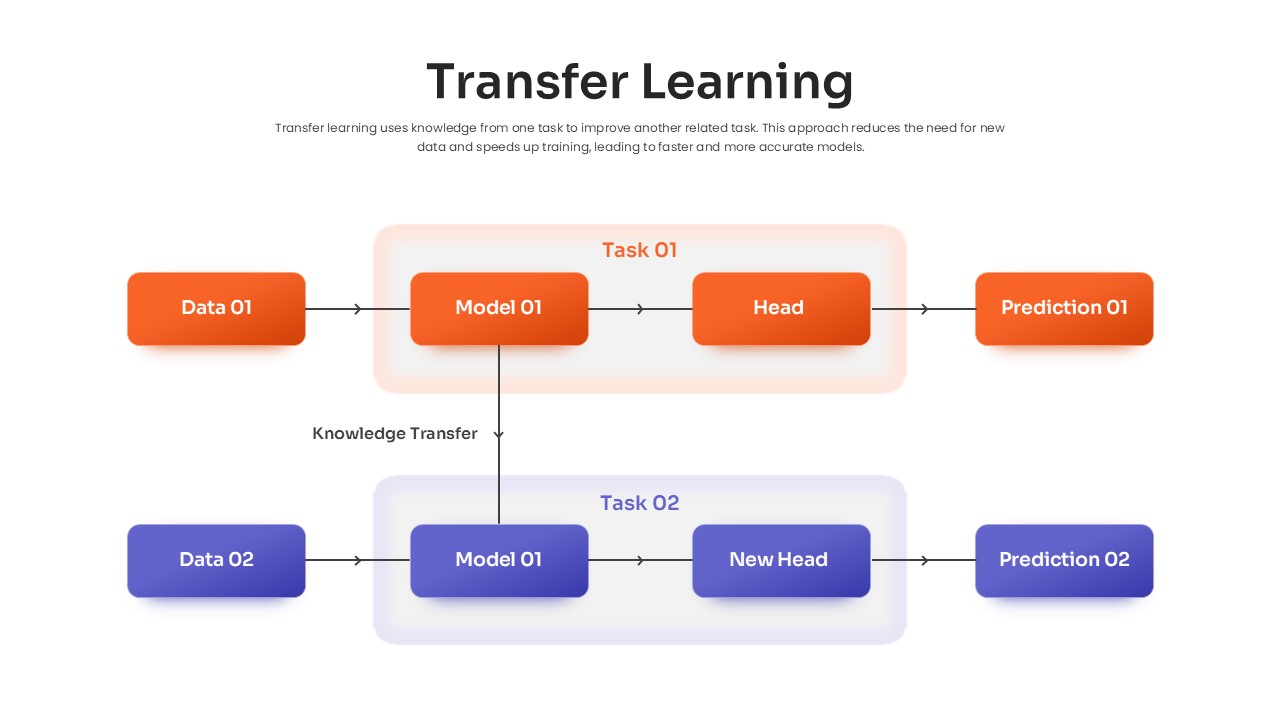
Transfer Learning Process template for PowerPoint & Google Slides
Technology
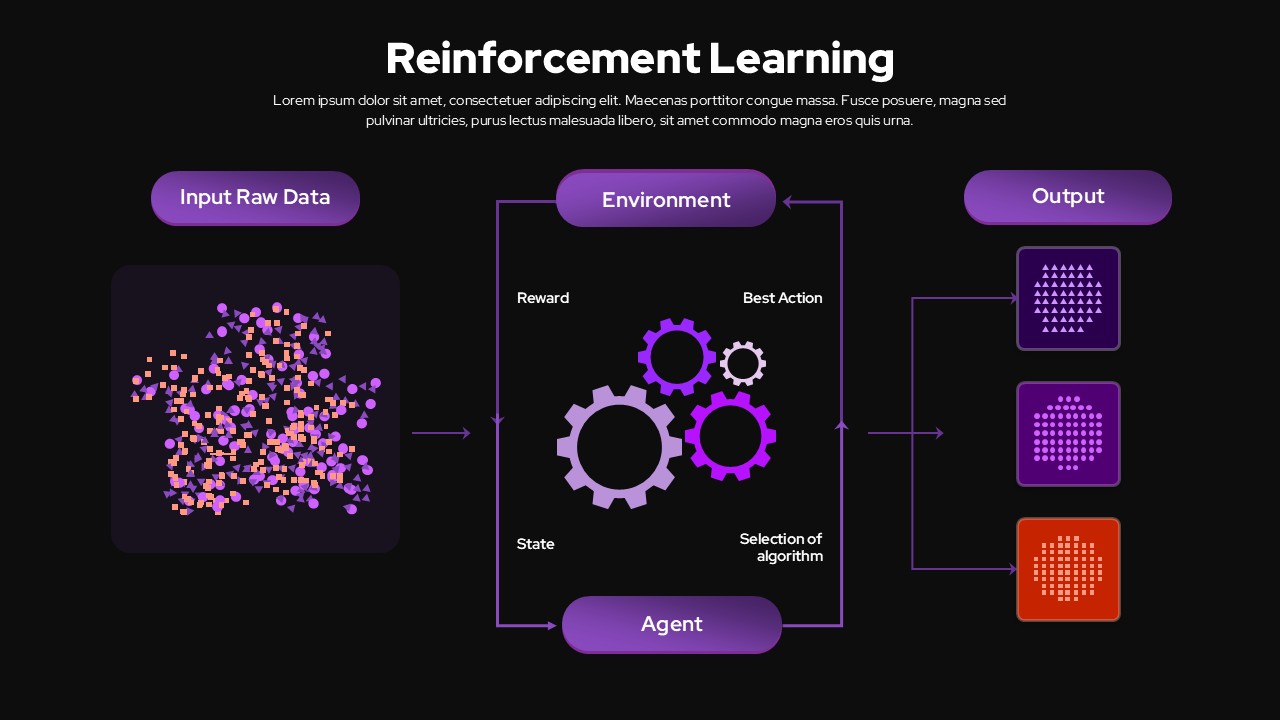
Reinforcement Learning Diagram Dark Template for PowerPoint & Google Slides
Machine Learning
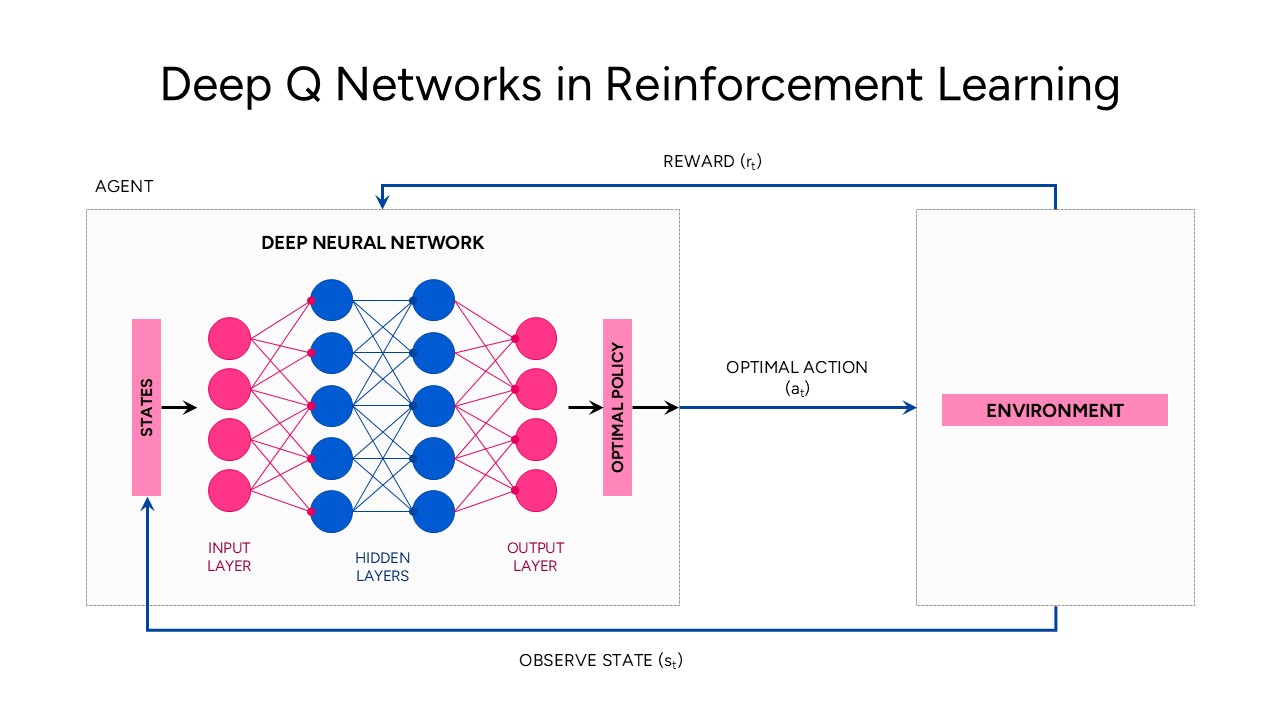
Deep Q Networks in Reinforcement Learning template for PowerPoint & Google Slides
Technology
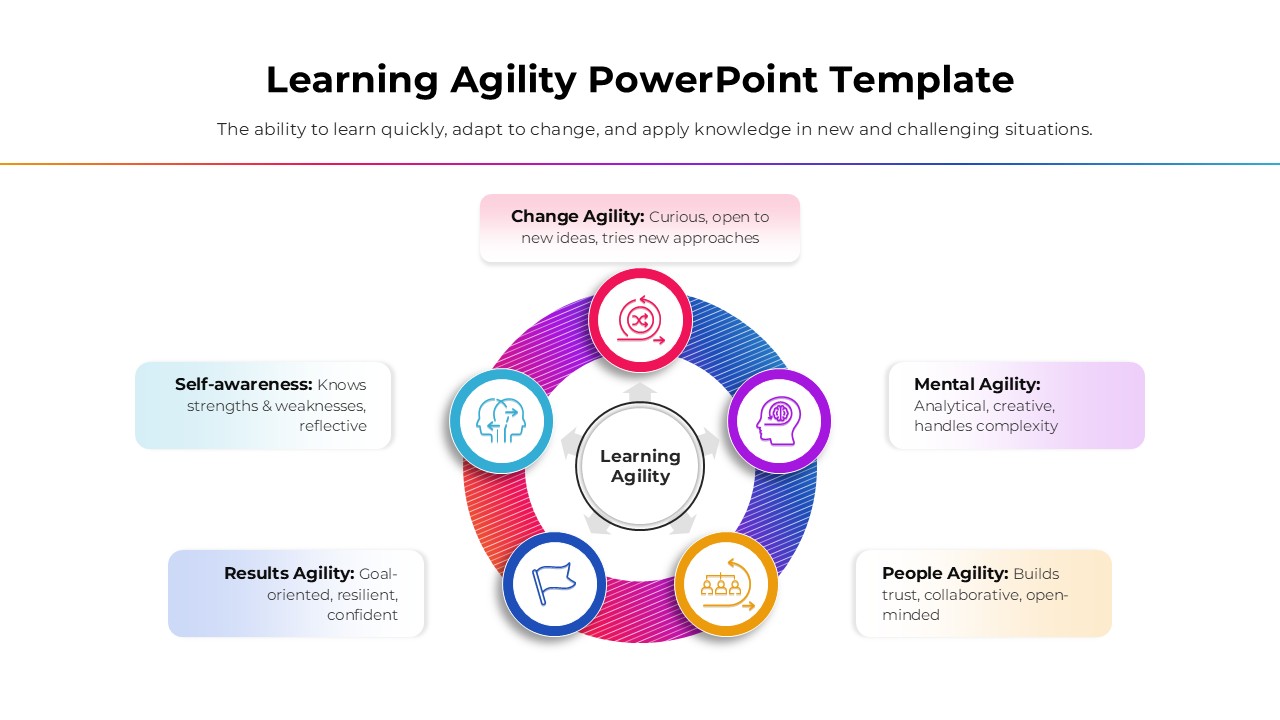
Learning Agility template for PowerPoint & Google Slides
Business
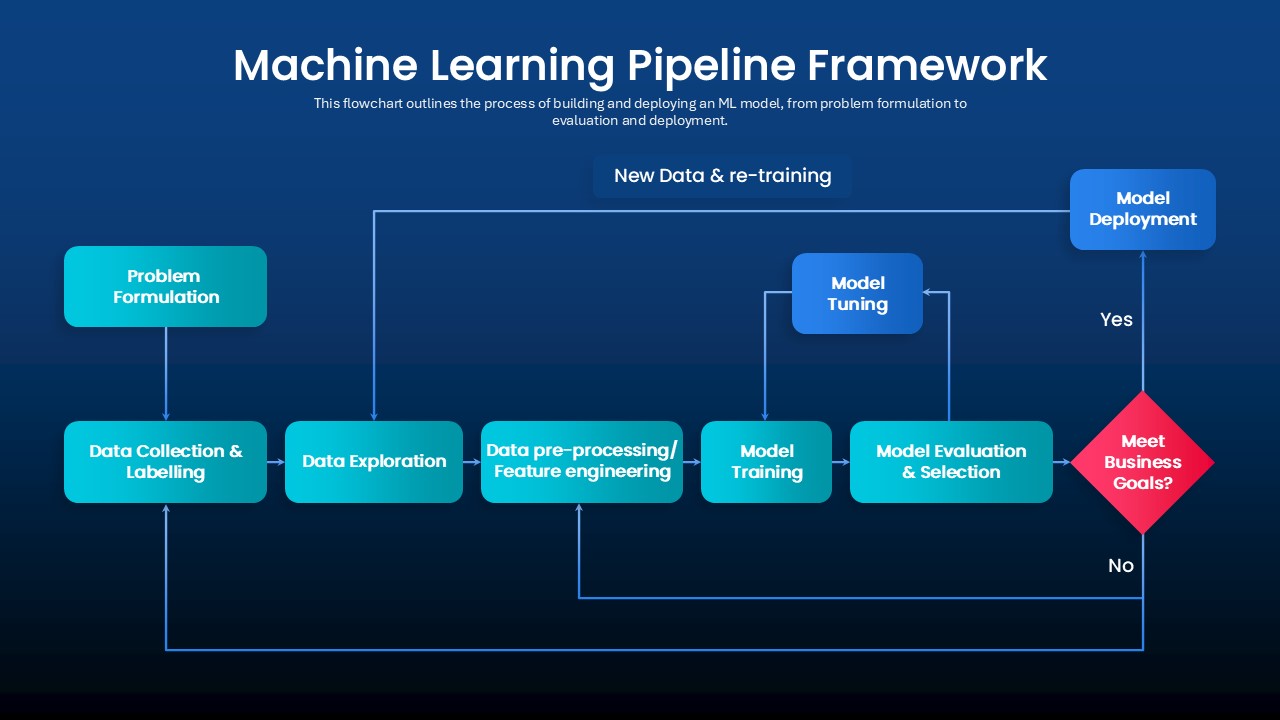
Machine Learning Pipeline Framework Template for PowerPoint & Google Slides
Charts
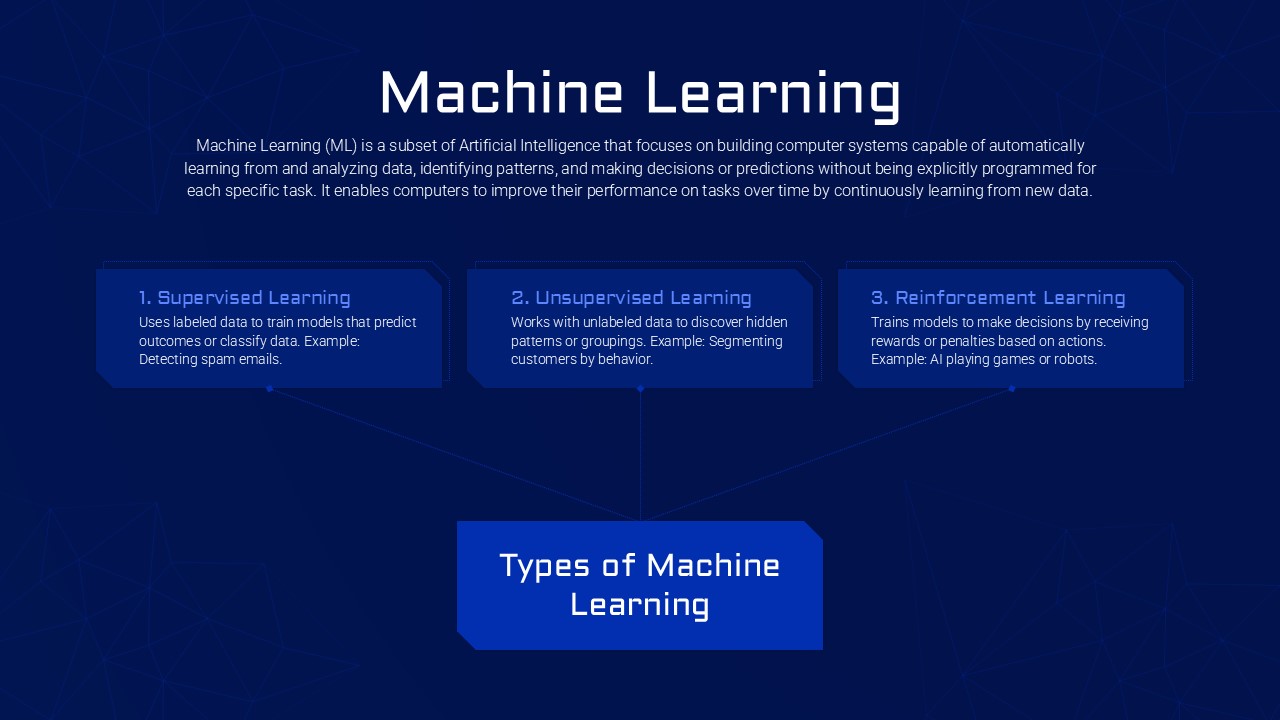
Machine Learning Types template for PowerPoint & Google Slides
Technology
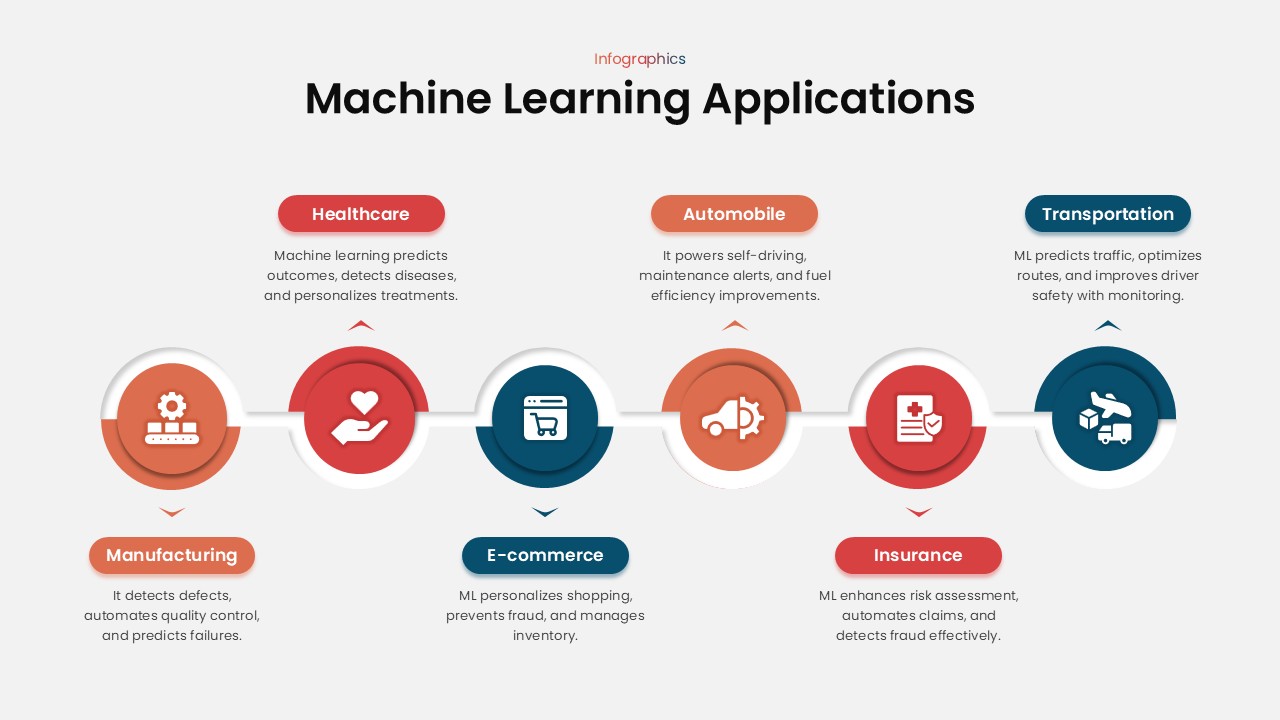
Machine Learning Applications template for PowerPoint & Google Slides
Technology
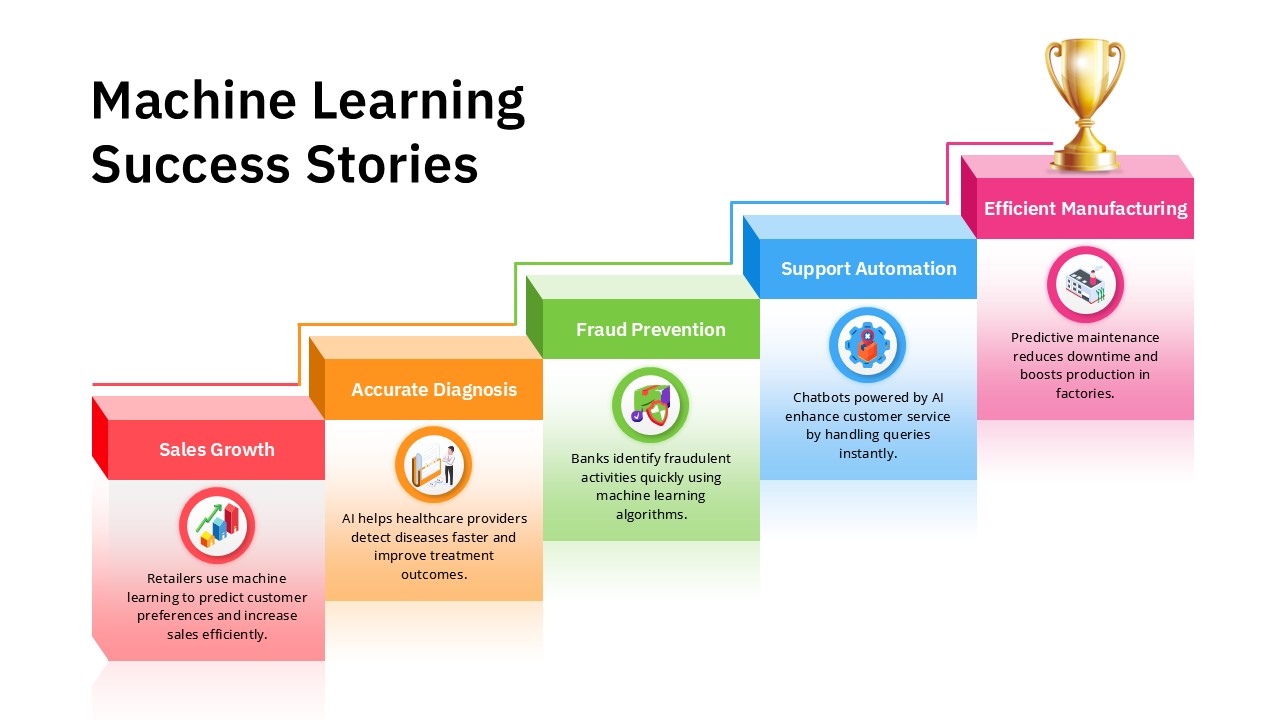
Machine Learning Success Stories Infographic Template for PowerPoint & Google Slides
Process
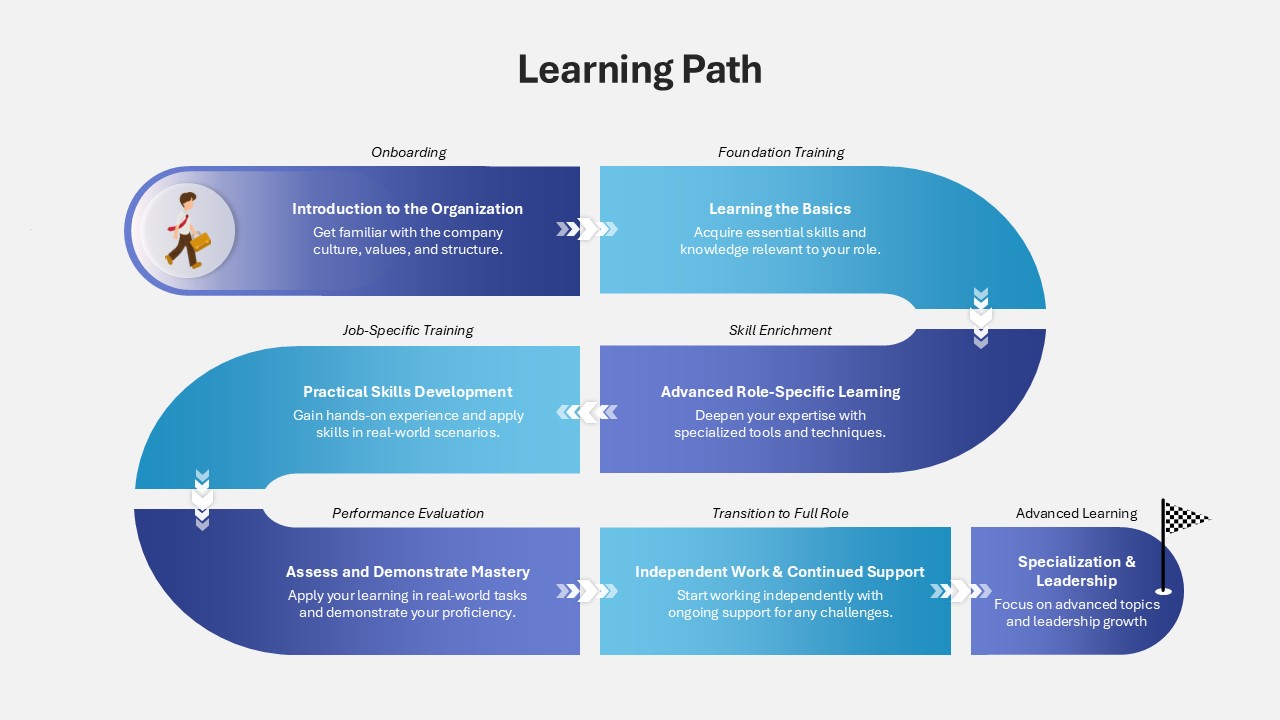
Learning Path Infographic Template for PowerPoint & Google Slides
Process
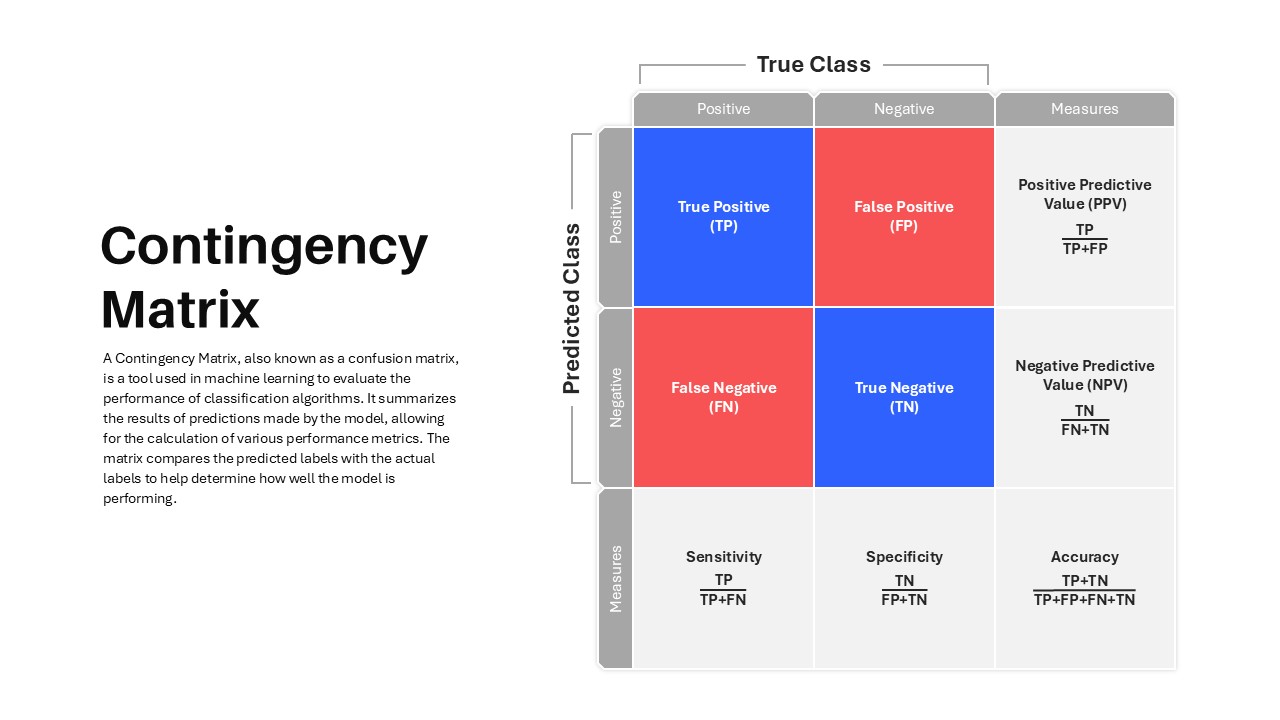
Contingency Matrix in Machine Learning template for PowerPoint & Google Slides
Technology
Q-Learning Process Flow Diagram Template for PowerPoint & Google Slides
Process
Machine Learning Four-Step Process Template for PowerPoint & Google Slides
Machine Learning
Machine Learning Three-Step Process Template for PowerPoint & Google Slides
Machine Learning
Free Machine Learning Concept Slide Template for PowerPoint & Google Slides
Machine Learning
Free
Futuristic Machine Learning Workflow Template for PowerPoint & Google Slides
Machine Learning
Machine Learning Presentation Use Cases Template for PowerPoint & Google Slides
Machine Learning
Machine Learning 4-Step Workflow Template for PowerPoint & Google Slides
Machine Learning
Machine Learning Model Management Template for PowerPoint & Google Slides
Machine Learning
Machine Learning Pipeline & MLOps Flow Template for PowerPoint & Google Slides
Machine Learning
Machine Learning Process Template for PowerPoint & Google Slides
Machine Learning
Seven Stage Machine Learning Pipeline Template for PowerPoint & Google Slides
Machine Learning
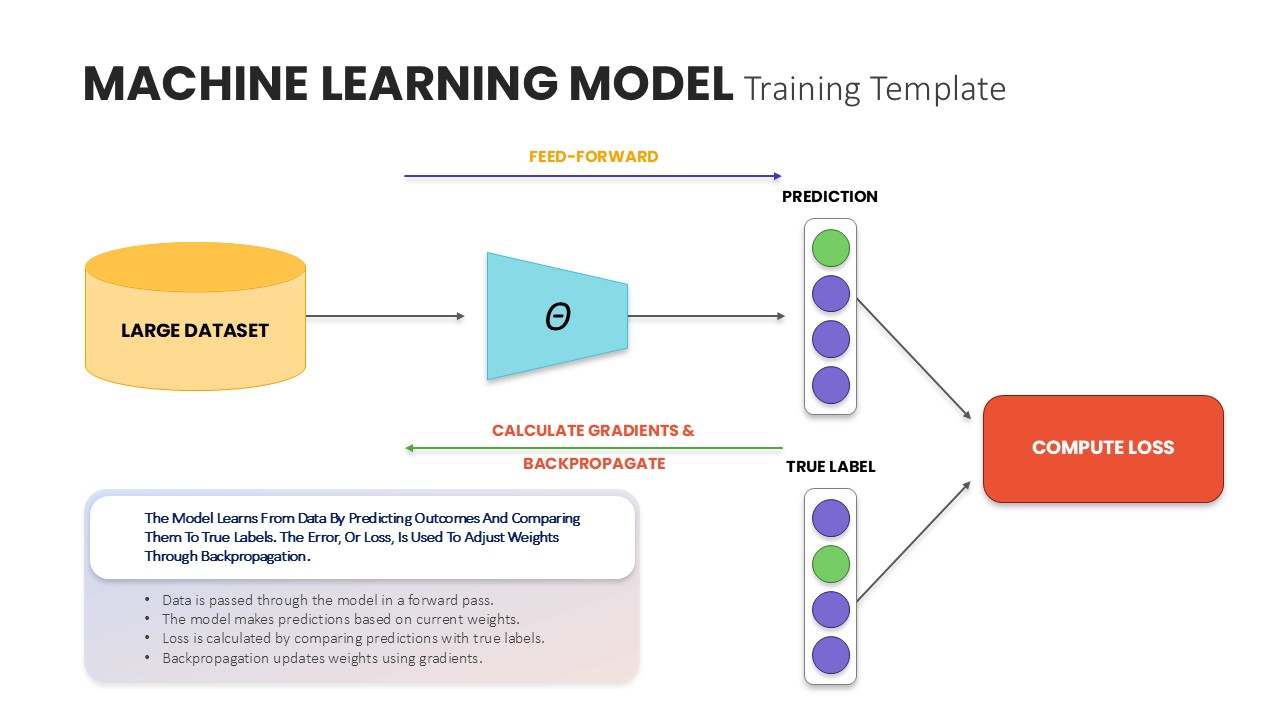
Machine Learning Model Training Template for PowerPoint & Google Slides
Machine Learning
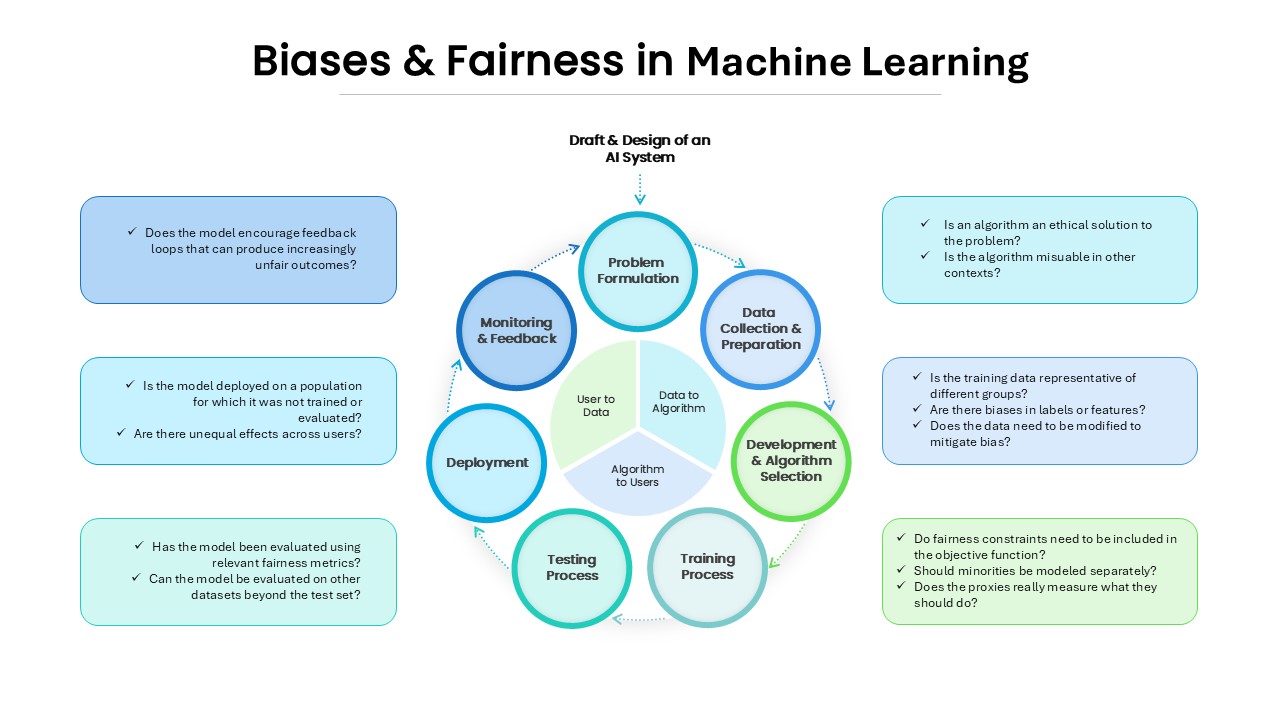
Biases and Fairness in Machine Learning for PowerPoint & Google Slides
Information Technology
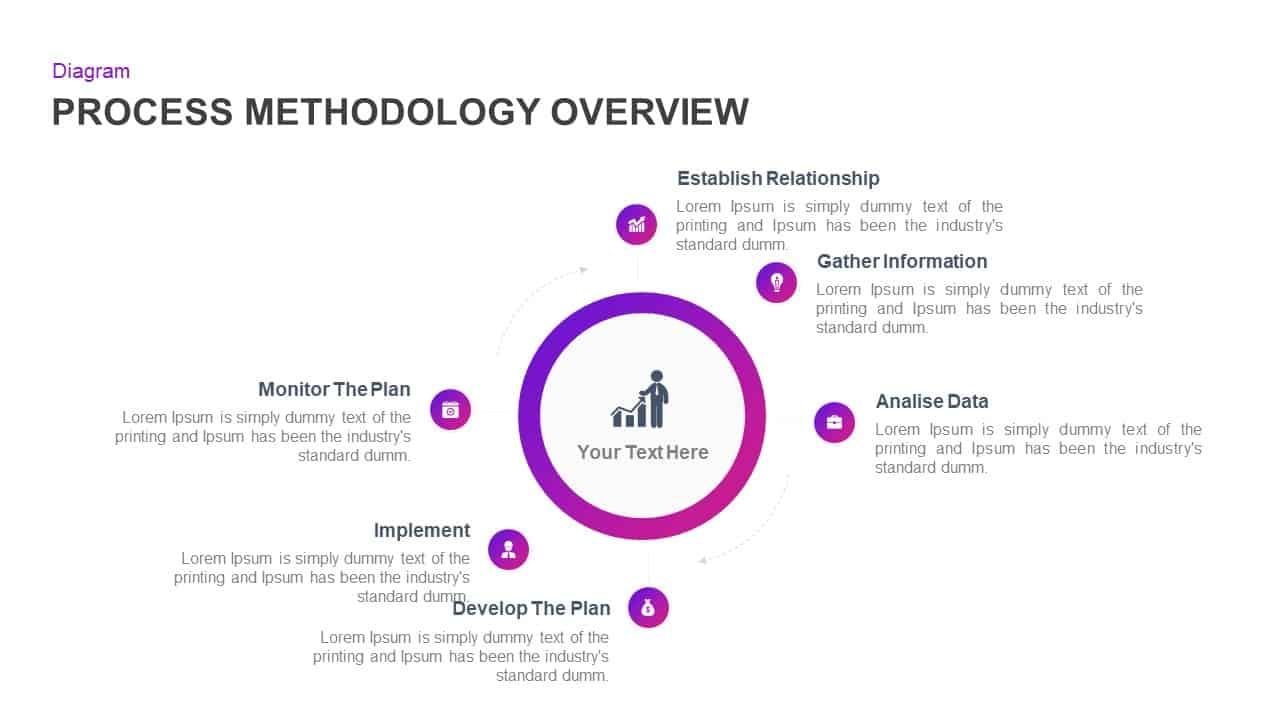
Process Methodology Overview Diagram Template for PowerPoint & Google Slides
Process
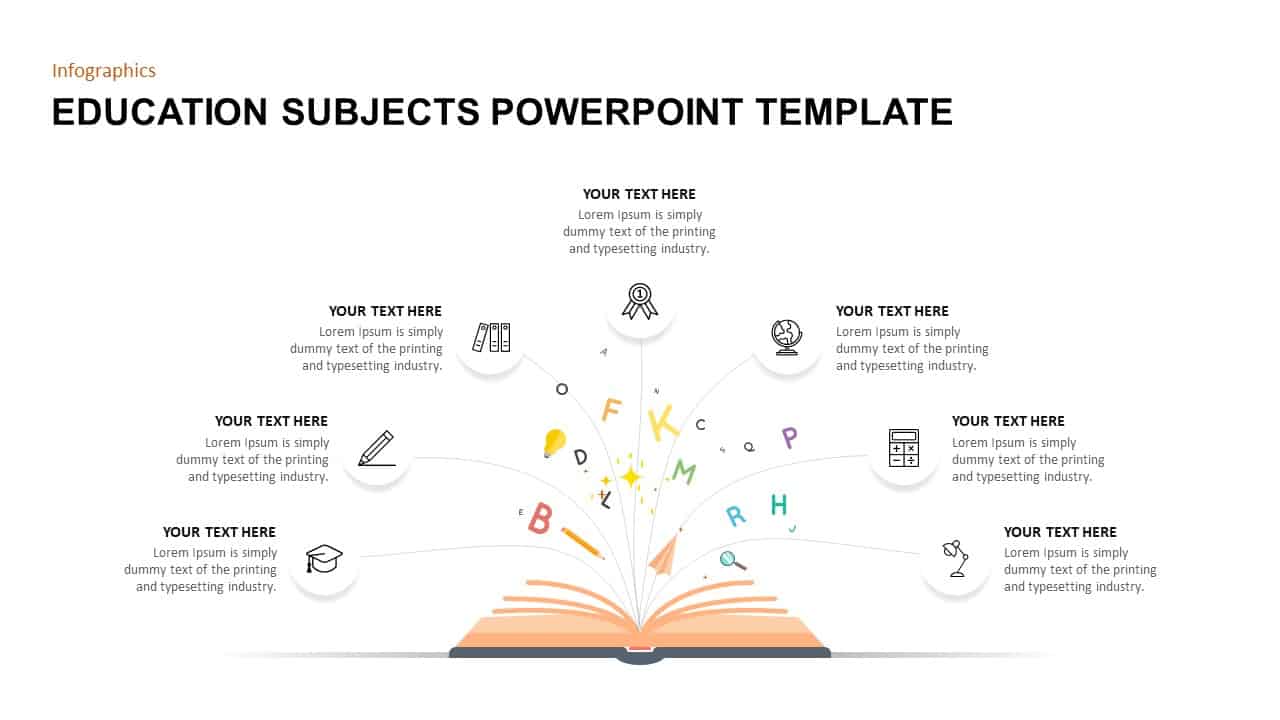
Education Subjects Overview template for PowerPoint & Google Slides
Agenda
Voice of Customer Overview template for PowerPoint & Google Slides
Customer Journey
Company Profile Overview template for PowerPoint & Google Slides
Company Profile
Business Proposal Overview template for PowerPoint & Google Slides
Business Proposal
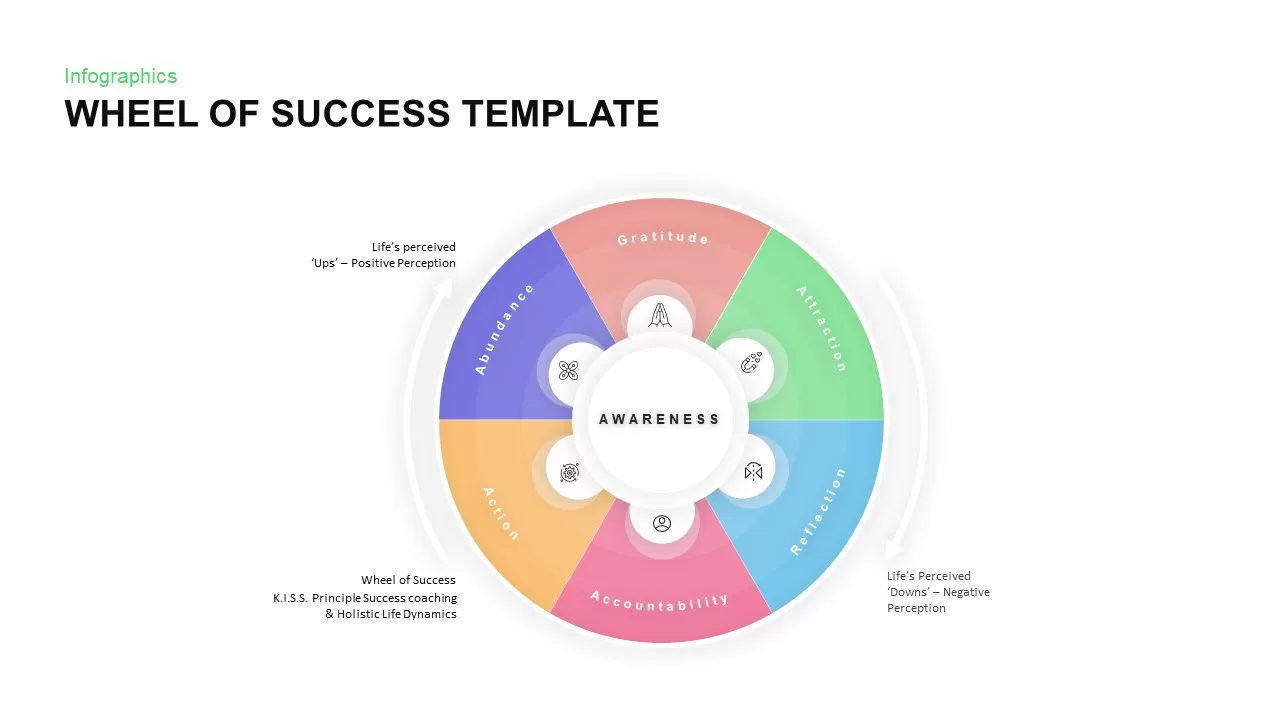
Wheel of Success Overview template for PowerPoint & Google Slides
Business Strategy
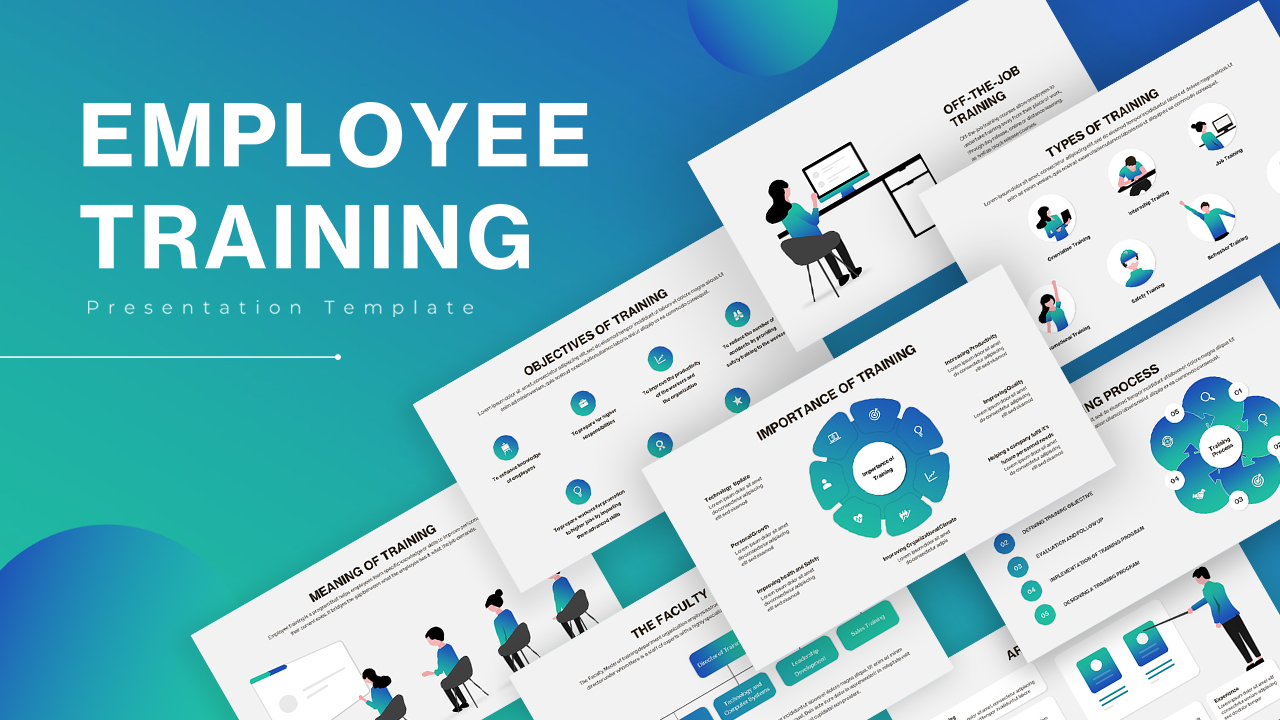
Employee Training Overview template for PowerPoint & Google Slides
Recruitment
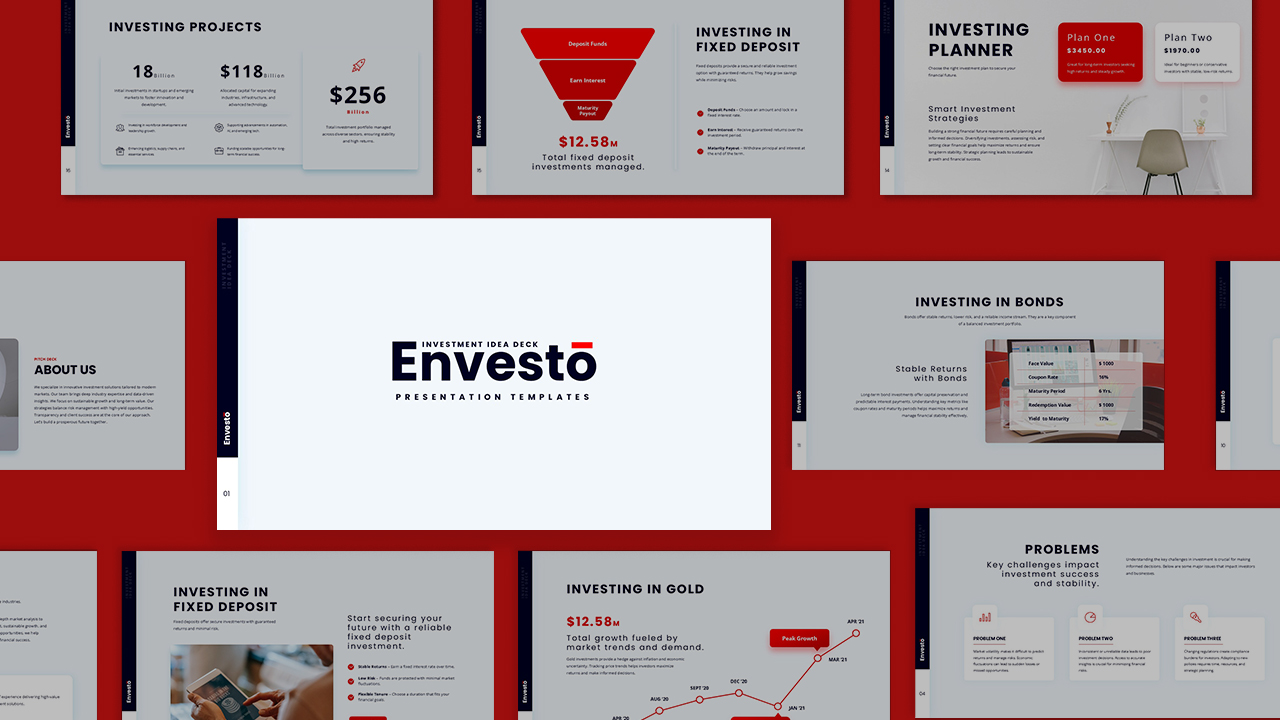
Investment Idea Deck Overview Template for PowerPoint & Google Slides
Decks
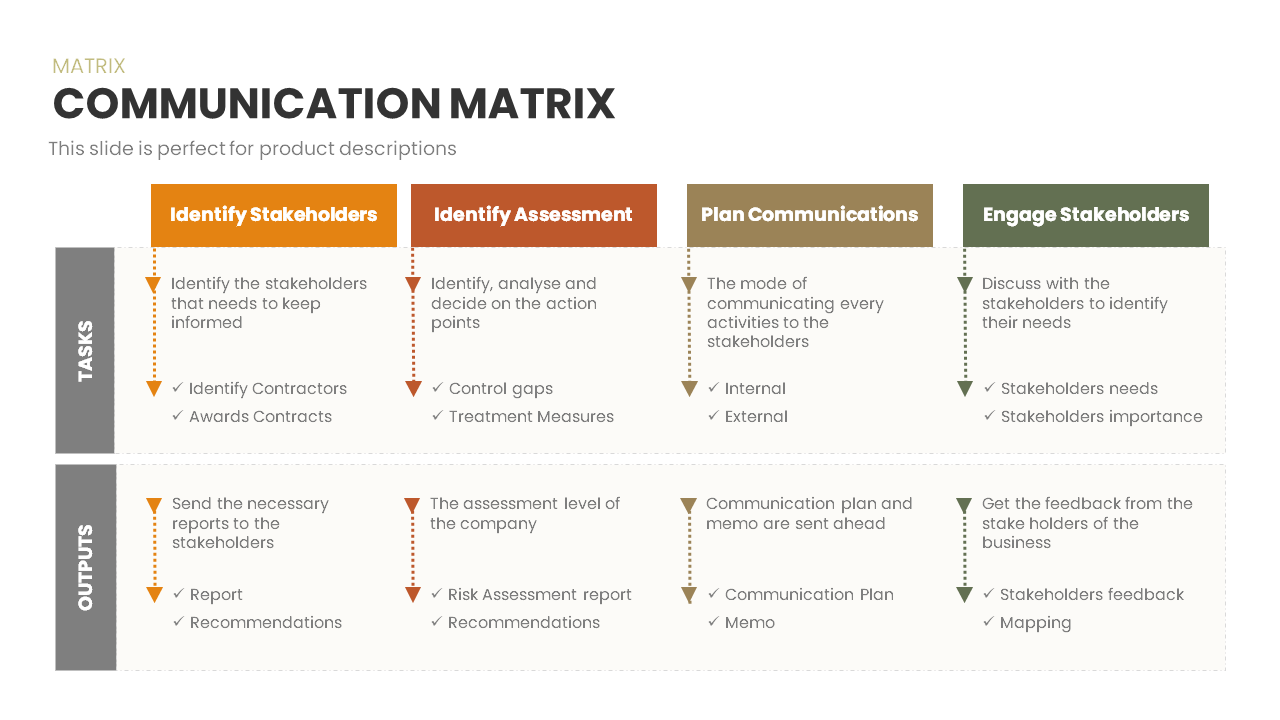
Communication Matrix Overview Template for PowerPoint & Google Slides
Business
FreeBlack History Month Celebration Overview Template for PowerPoint & Google Slides
Pitch Deck
Free
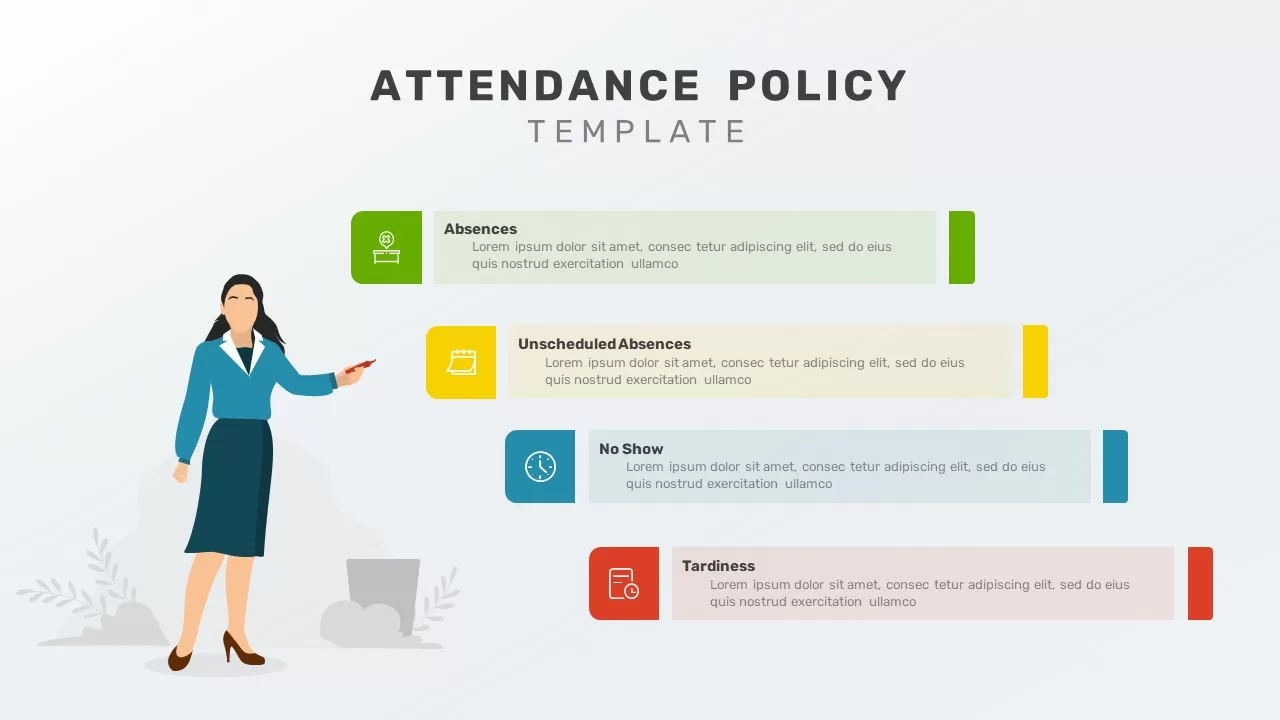
Comprehensive Attendance Policy Overview Template for PowerPoint & Google Slides
Process
SWOT Analysis Visual Overview template for PowerPoint & Google Slides
Business Strategy
Team Charter Overview template for PowerPoint & Google Slides
Business Plan
Free Stock Market Performance Overview template for PowerPoint & Google Slides
Finance
Free
5 Stage Process Flow Overview template for PowerPoint & Google Slides
Process

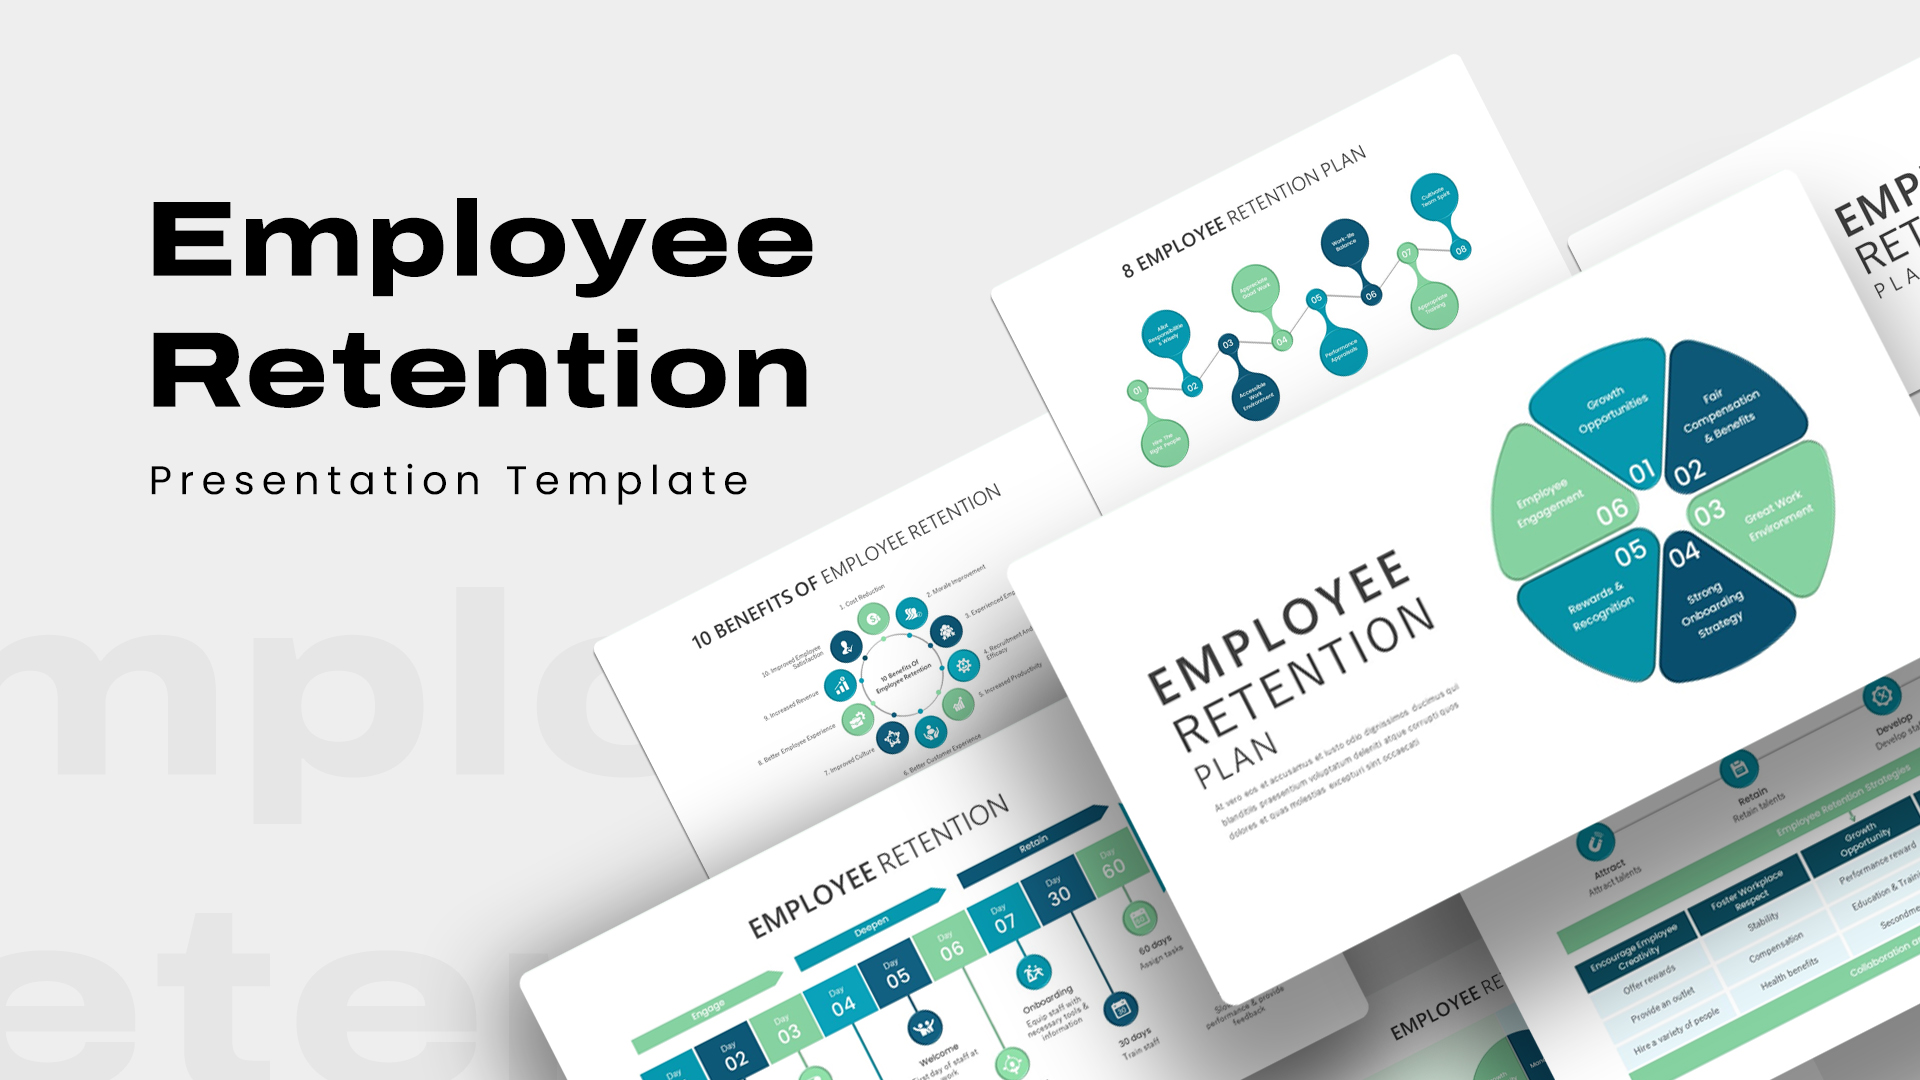
Employee Retention Plan Overview template for PowerPoint & Google Slides
Company Profile
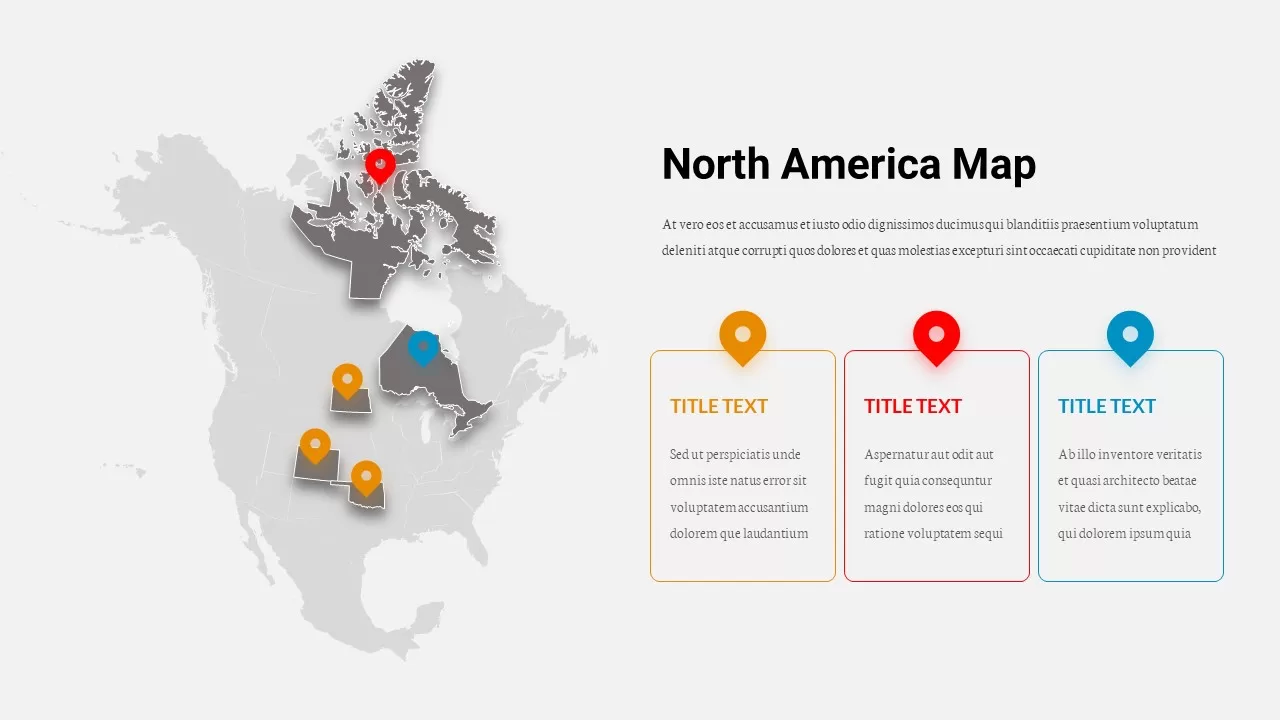
North America Location Pin Map Overview Template for PowerPoint & Google Slides
World Maps
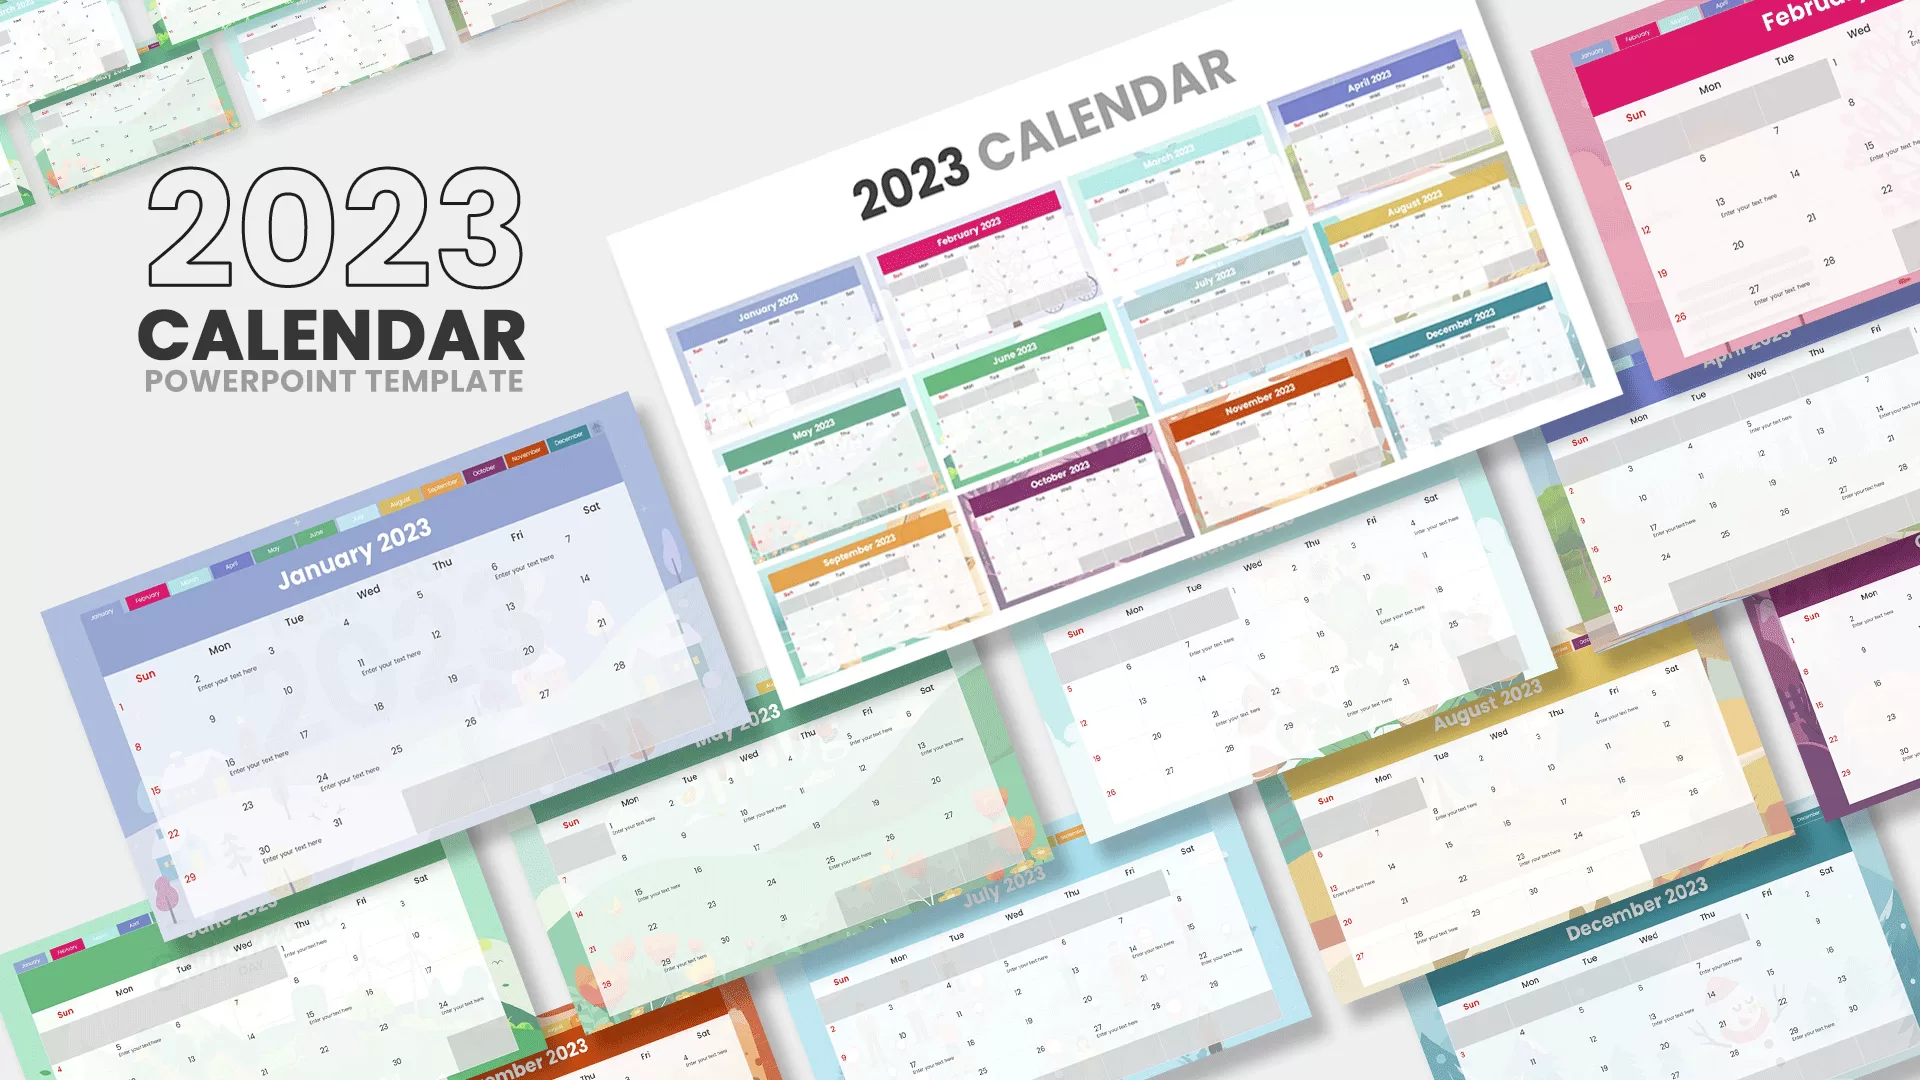
2023 Calendar Monthly Overview template for PowerPoint & Google Slides
Business
Graduation Celebration Overview template for PowerPoint & Google Slides
Pitch Deck
Streaming Service Overview template for PowerPoint & Google Slides
Business Proposal
KPI Dashboard Overview template for PowerPoint & Google Slides
Finance
Comprehensive Income Statement Overview Template for PowerPoint & Google Slides
Business Report
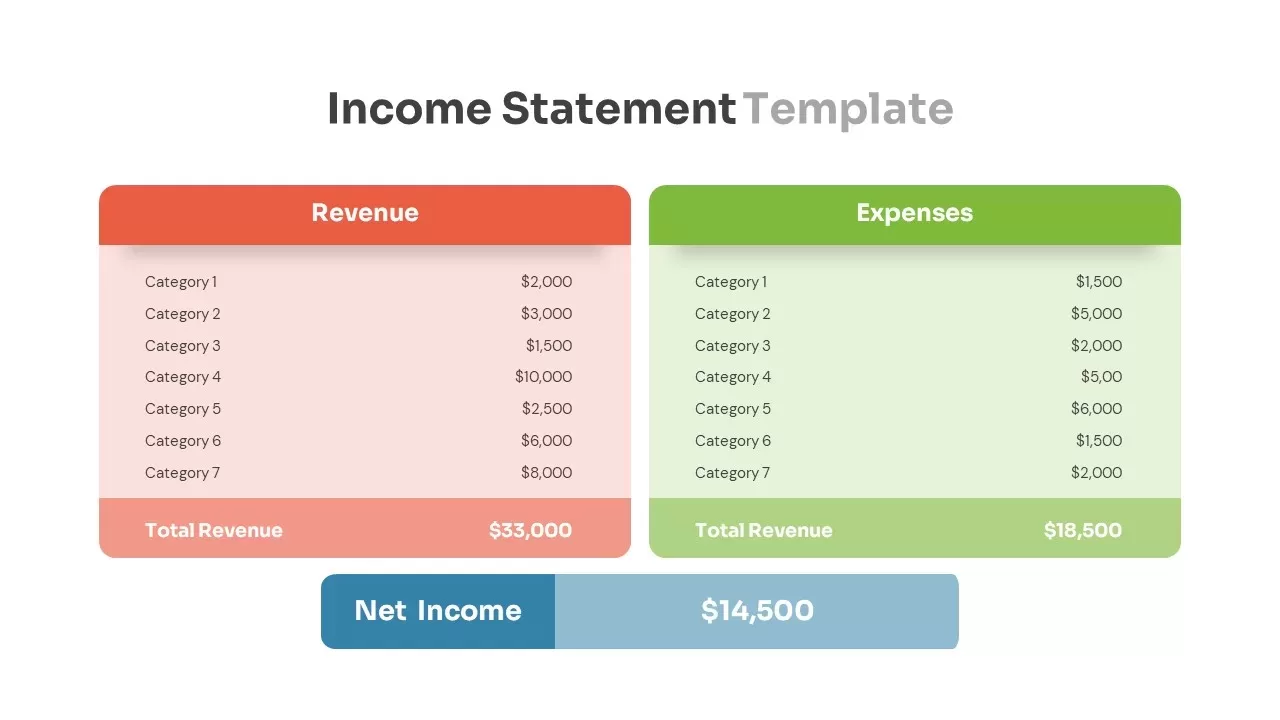
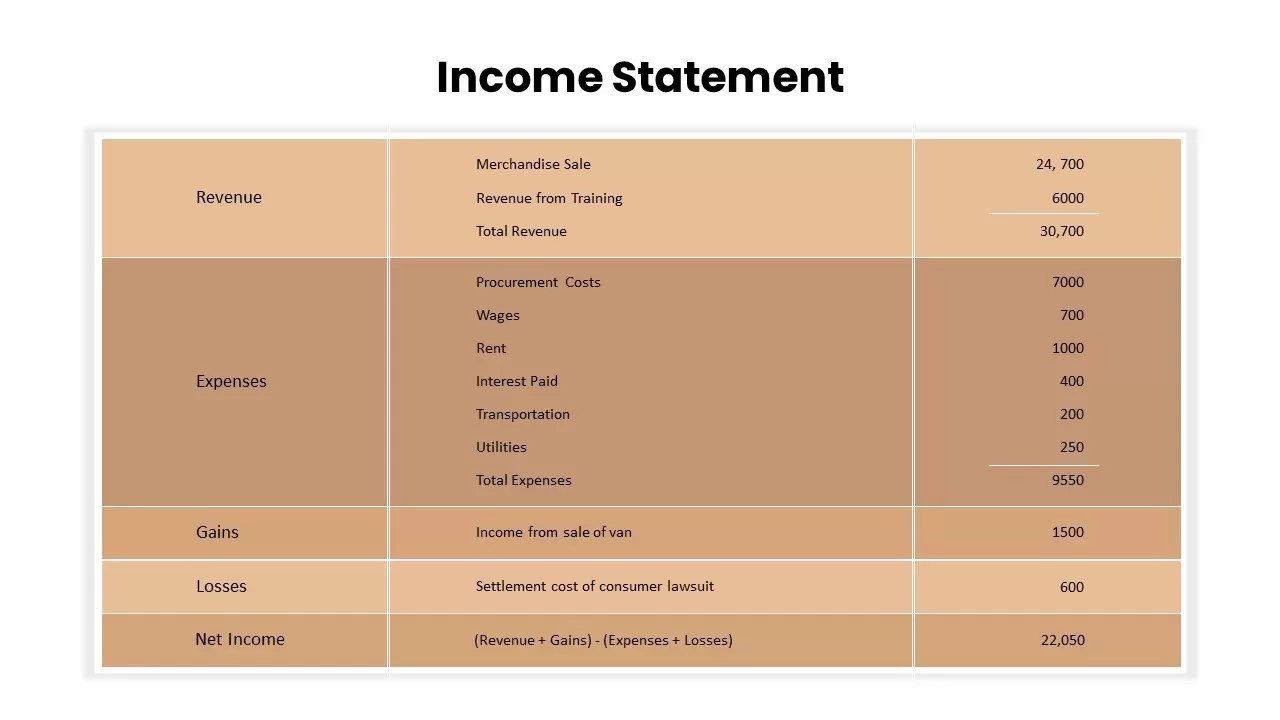
Income Statement Overview Table Template for PowerPoint & Google Slides
Finance
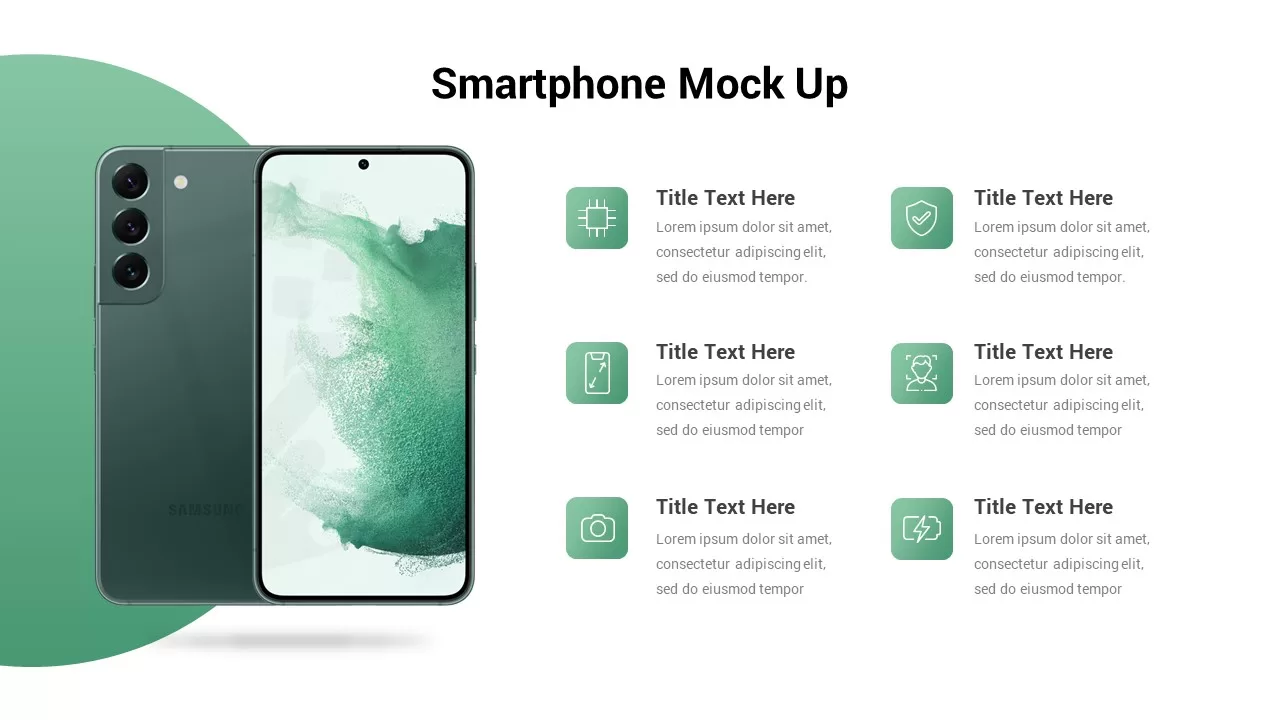
Smartphone Mockup Feature Overview Template for PowerPoint & Google Slides
Graphics
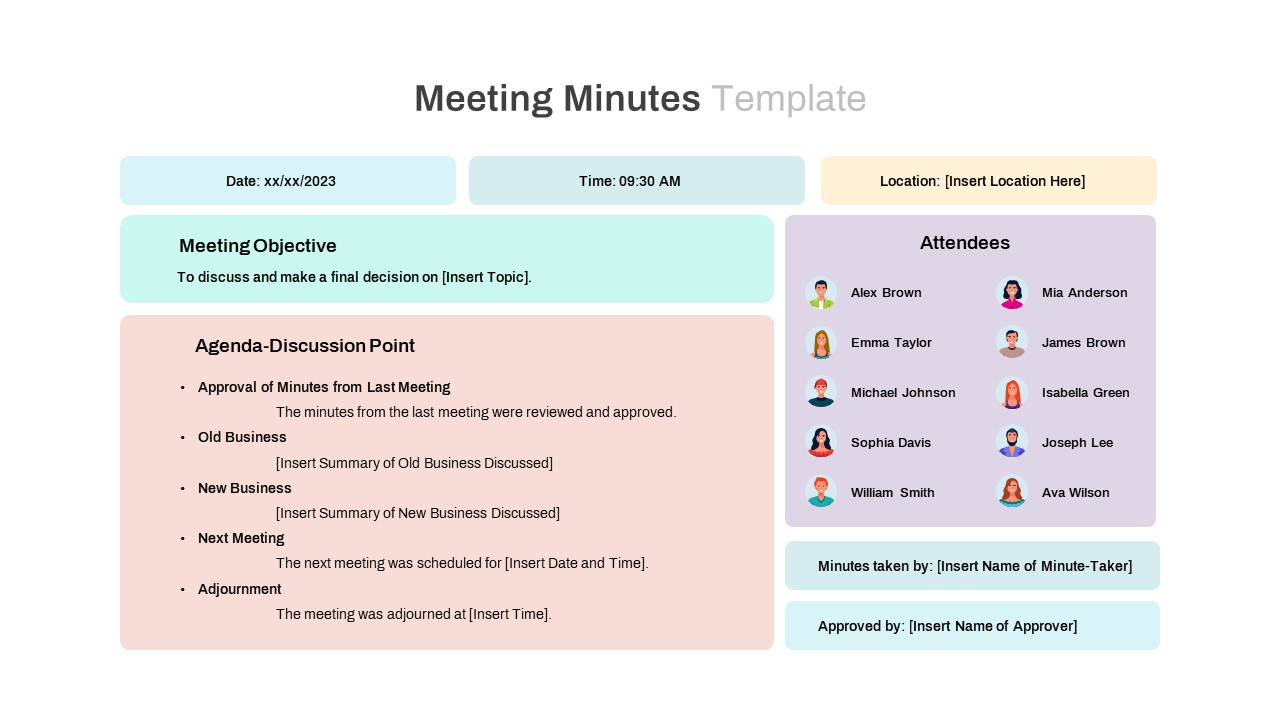
Meeting Minutes and Attendees Overview Template for PowerPoint & Google Slides
Business Report
Free TikTok Marketing Analytics Overview Template for PowerPoint & Google Slides
Company Profile
Free
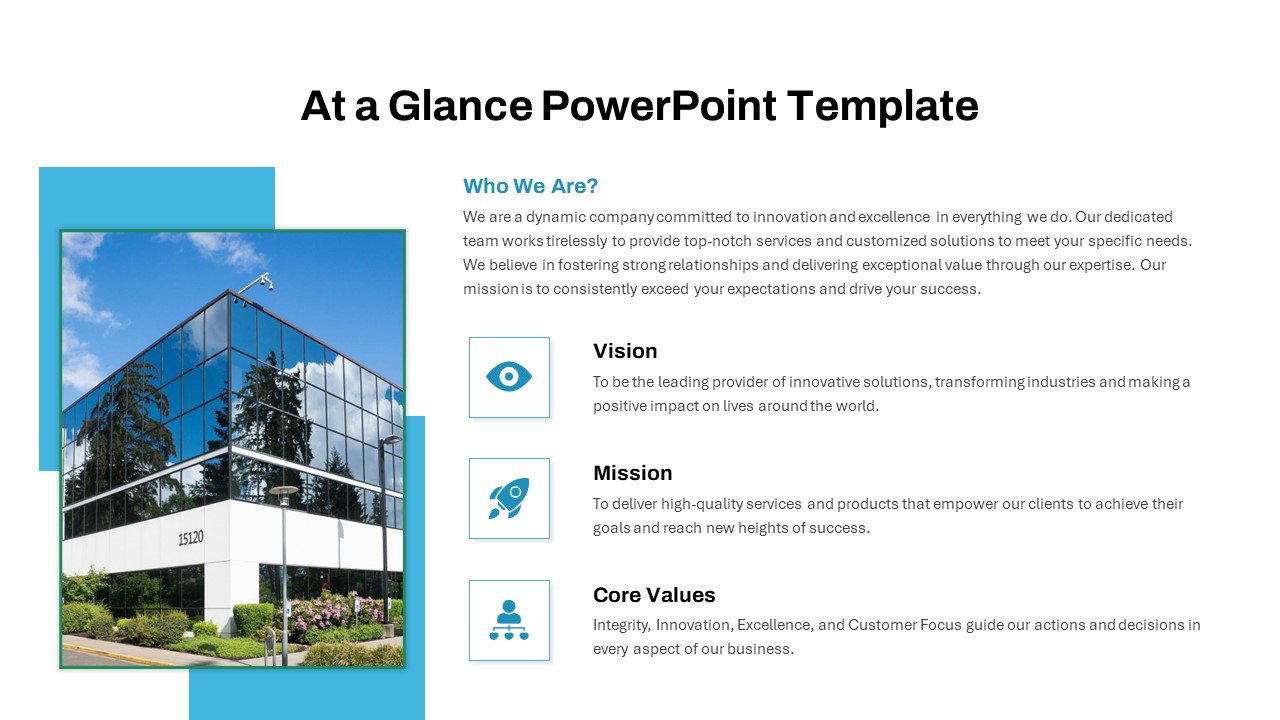
At a Glance Company Profile Overview Template for PowerPoint & Google Slides
Company Profile
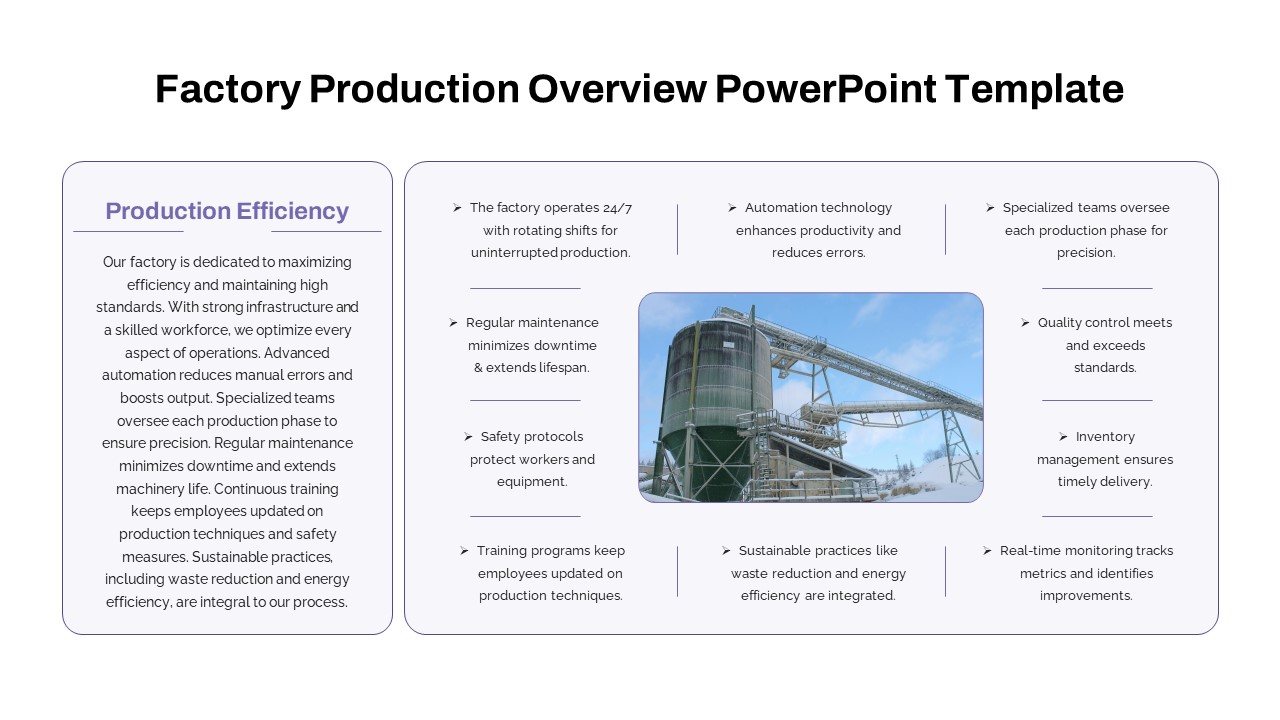
Factory Production Overview Template for PowerPoint & Google Slides
Business Report
Financial Snapshot & Metrics Overview Template for PowerPoint & Google Slides
Finance
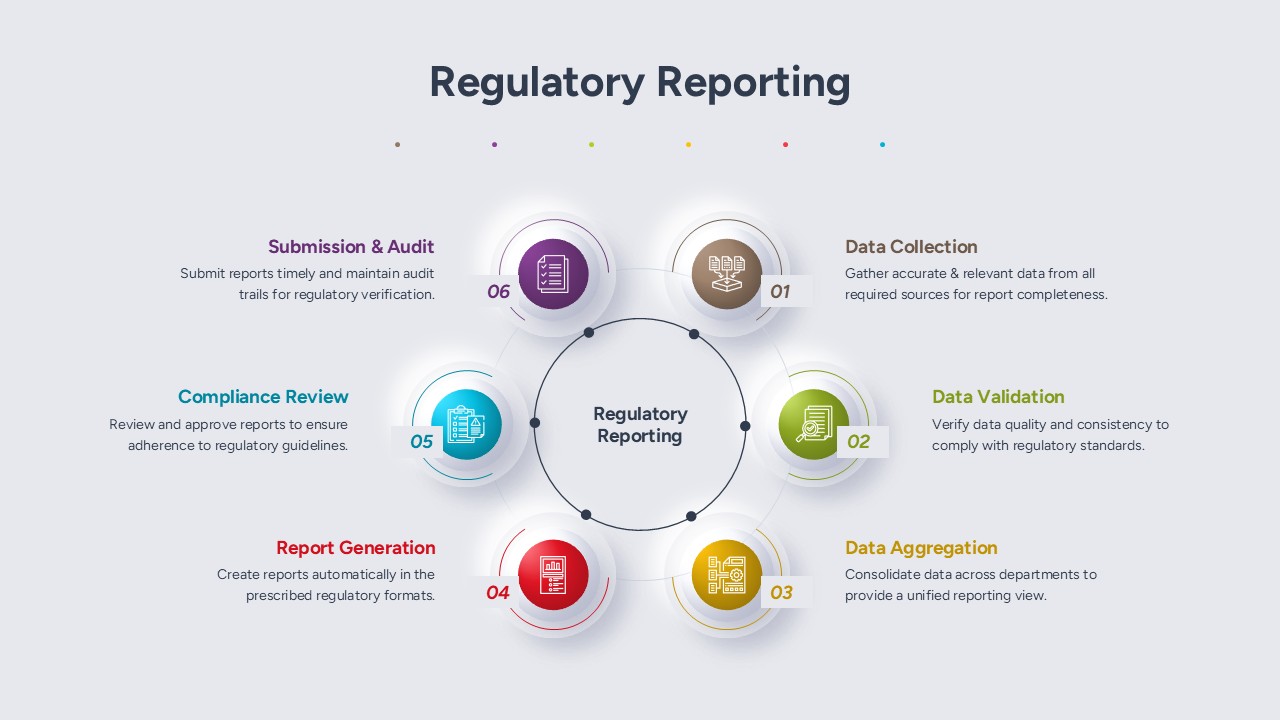
Regulatory Reporting Process Overview template for PowerPoint & Google Slides
Business
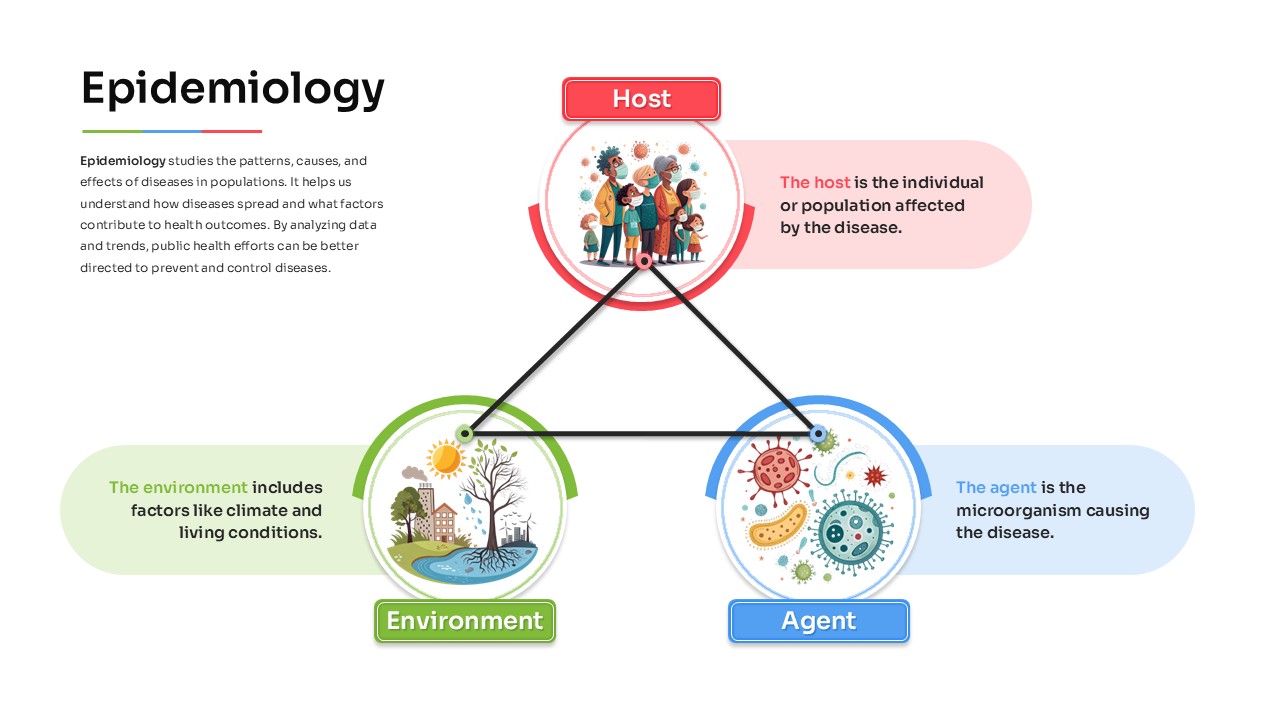
Epidemiology Overview template for PowerPoint & Google Slides
Health
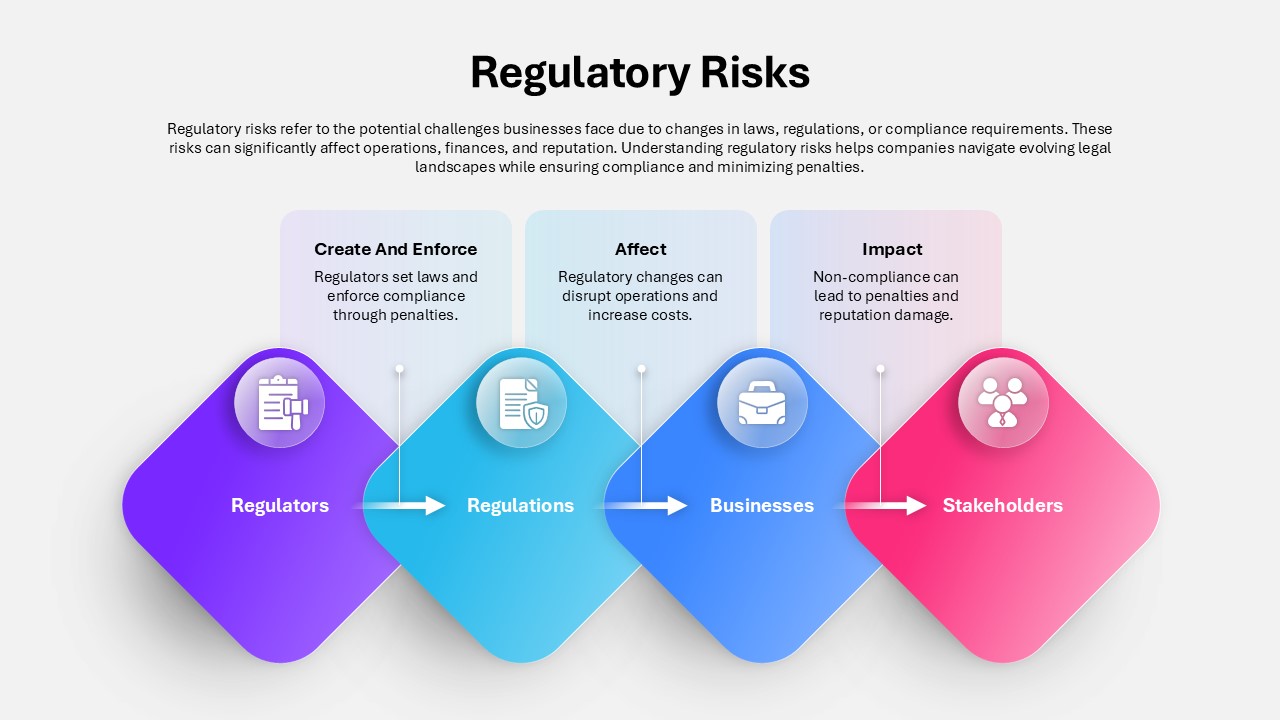
Regulatory Risks Overview template for PowerPoint & Google Slides
Process
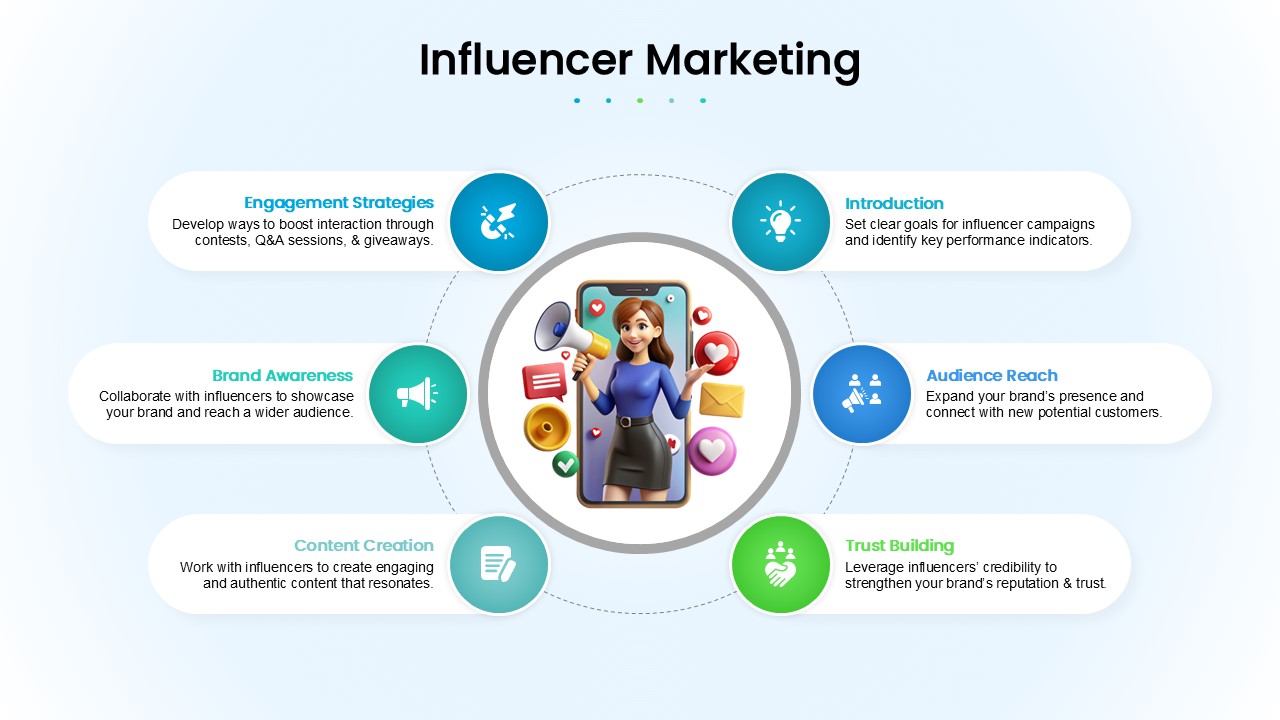
Influencer Marketing Overview template for PowerPoint & Google Slides
Business
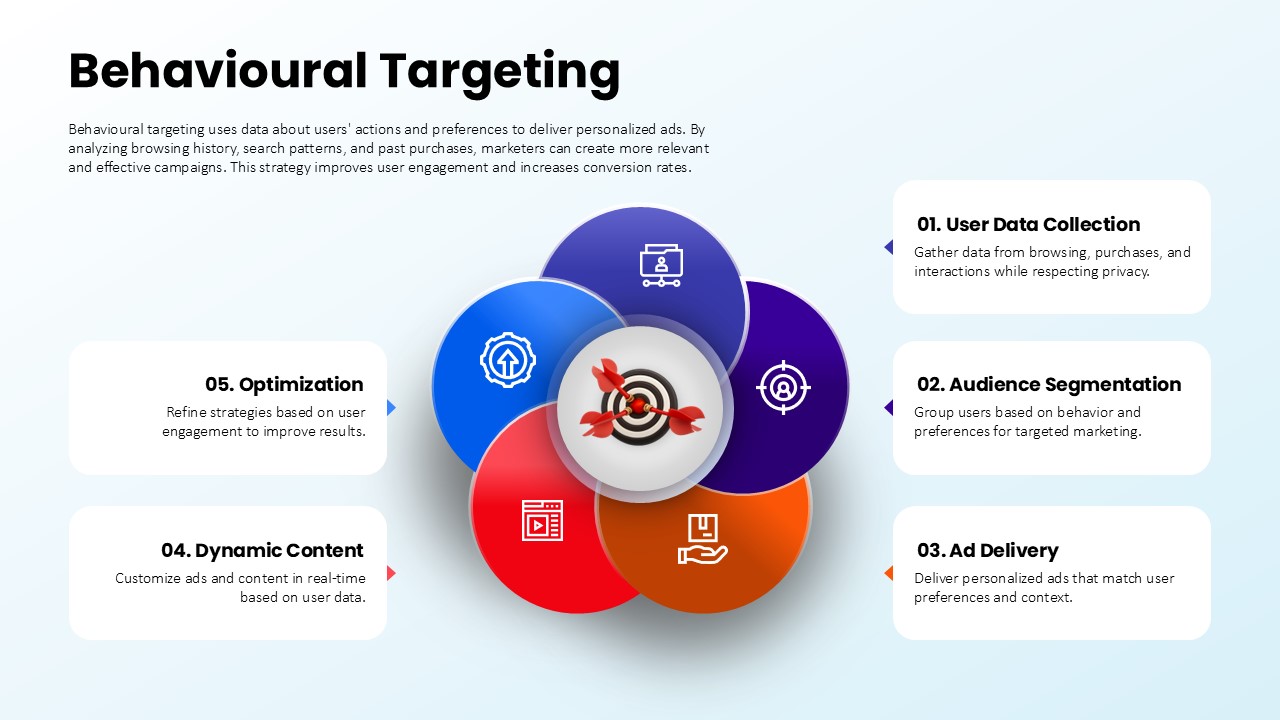
Behavioural Targeting Strategy Overview template for PowerPoint & Google Slides
Process
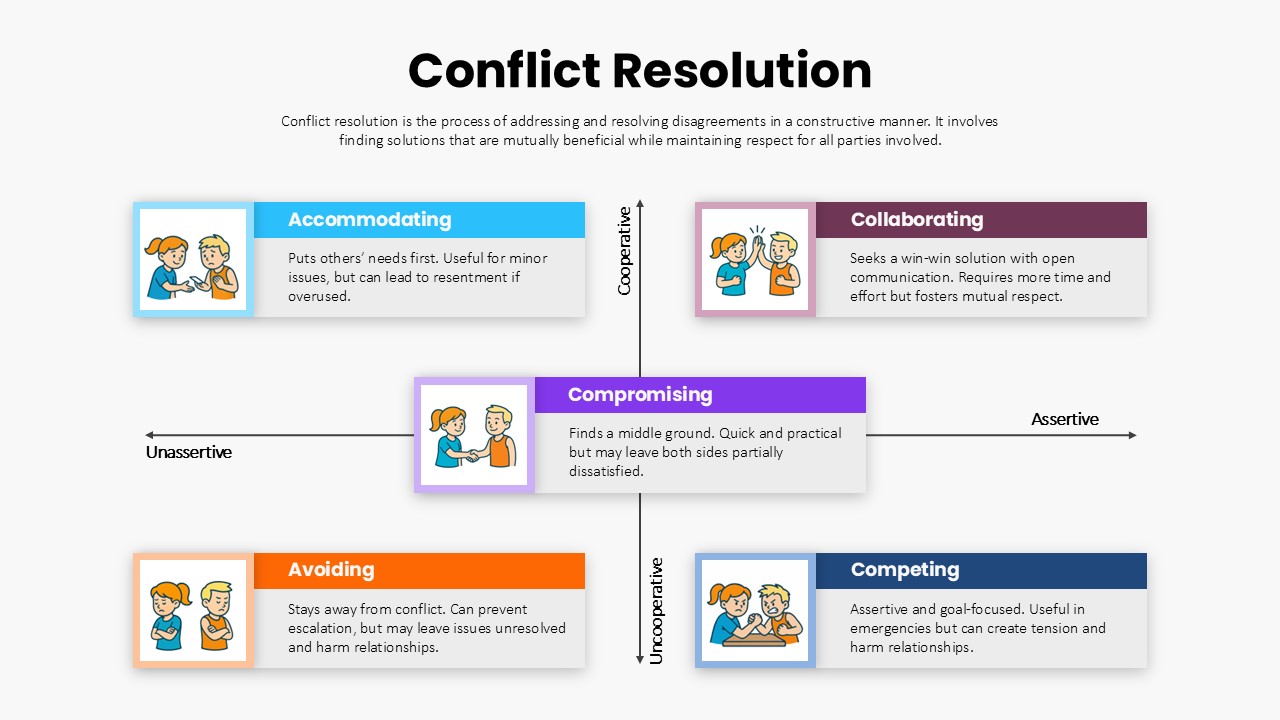
Conflict Resolution Strategies Overview template for PowerPoint & Google Slides
Process
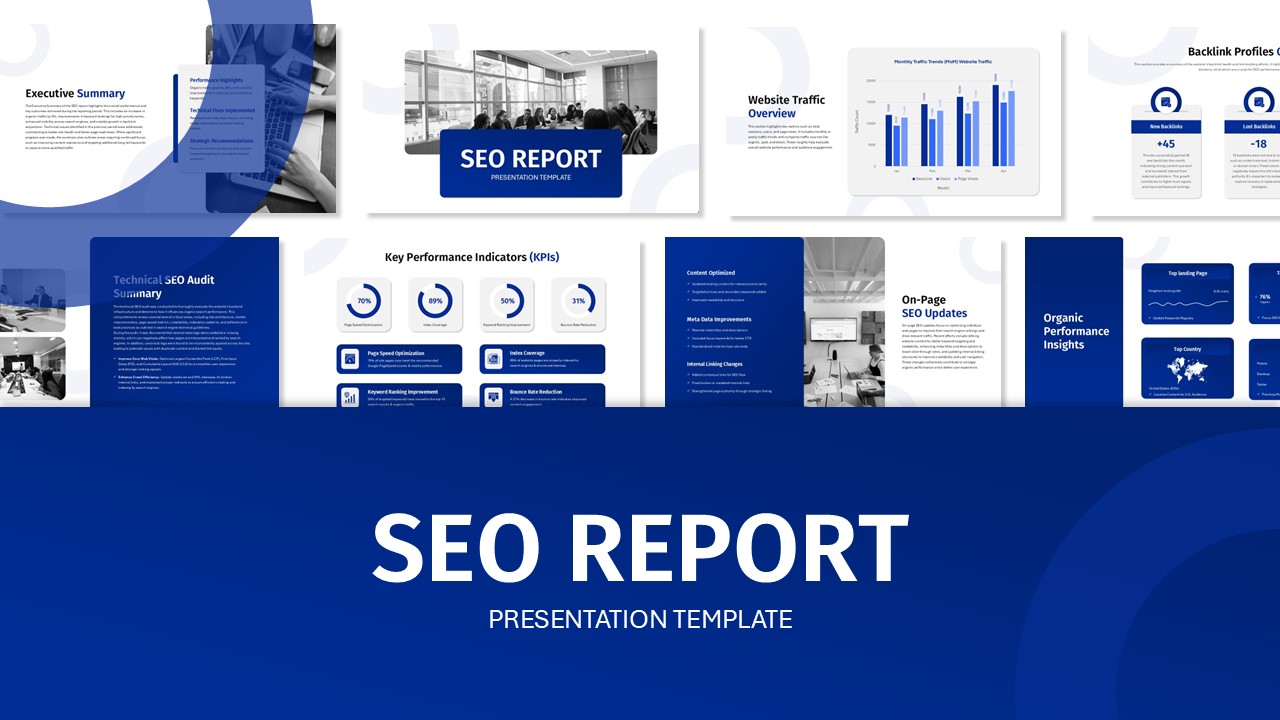
SEO Performance Report Overview template for PowerPoint & Google Slides
Digital Marketing
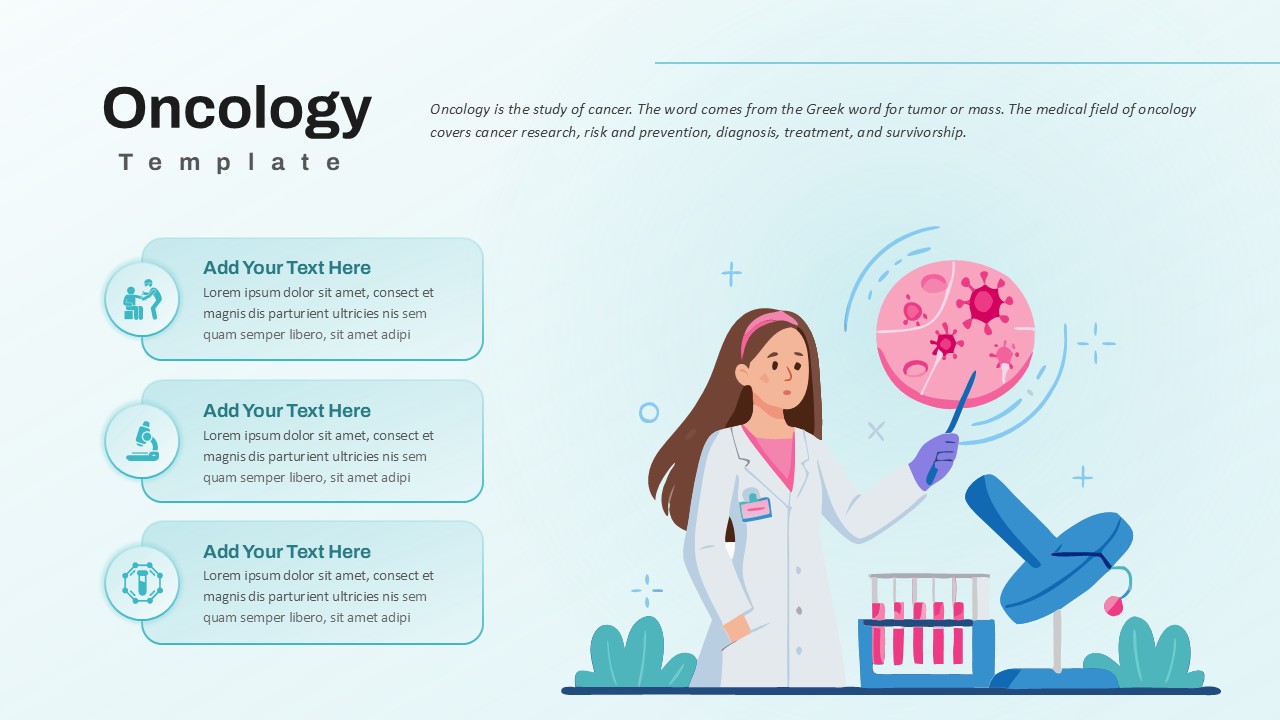
Oncology Overview template for PowerPoint & Google Slides
Health
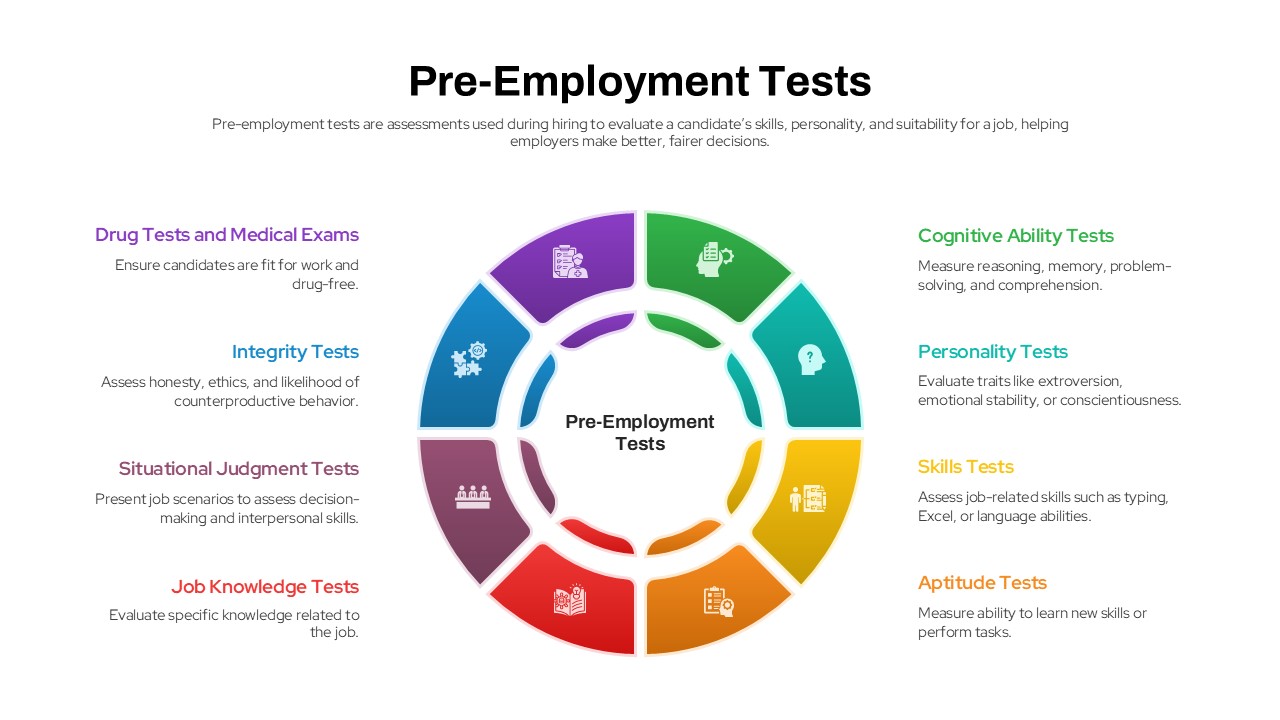
Pre-Employment Tests overview template for PowerPoint & Google Slides
Business
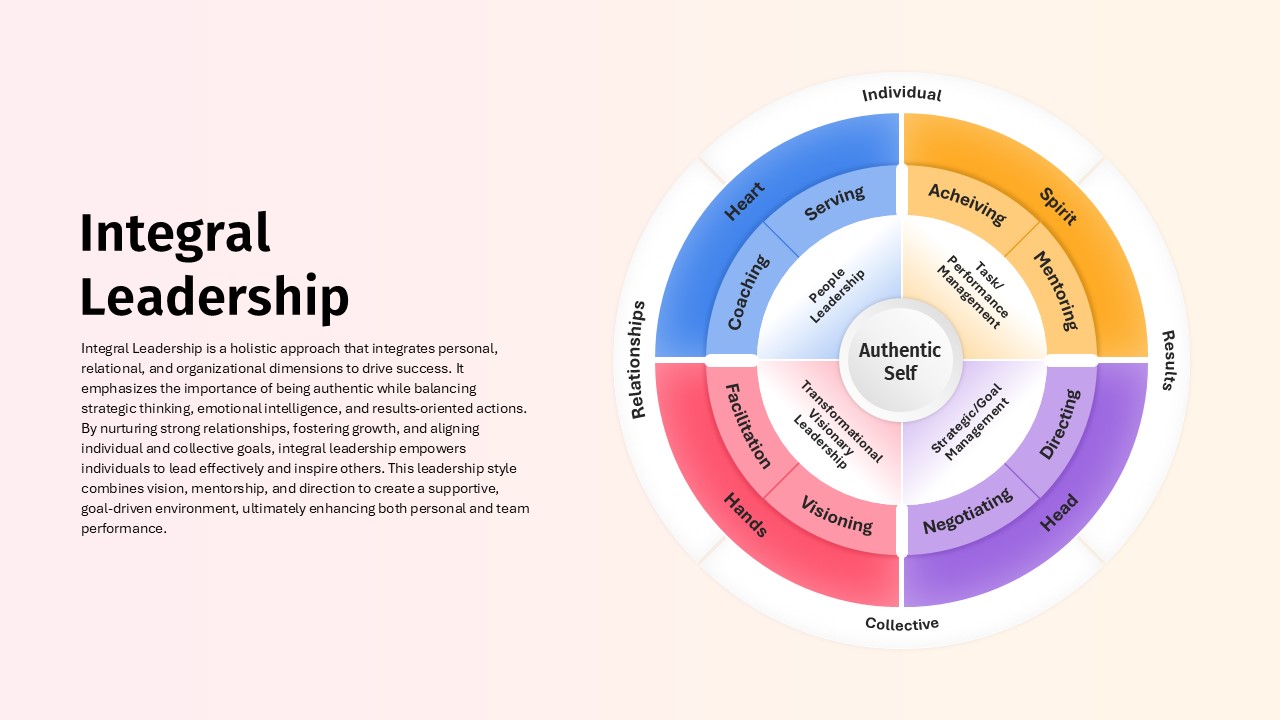
Integral Leadership Model Overview template for PowerPoint & Google Slides
Leadership
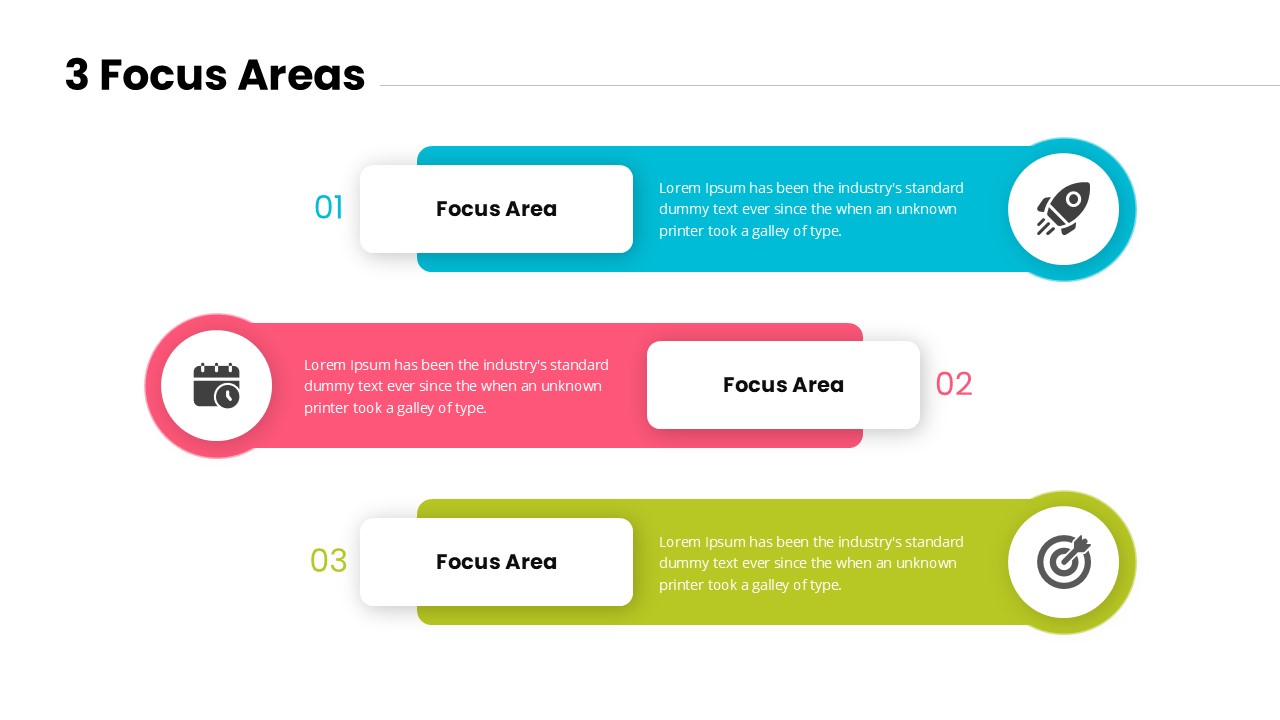
3 Focus Areas Overview Template for PowerPoint & Google Slides
Process
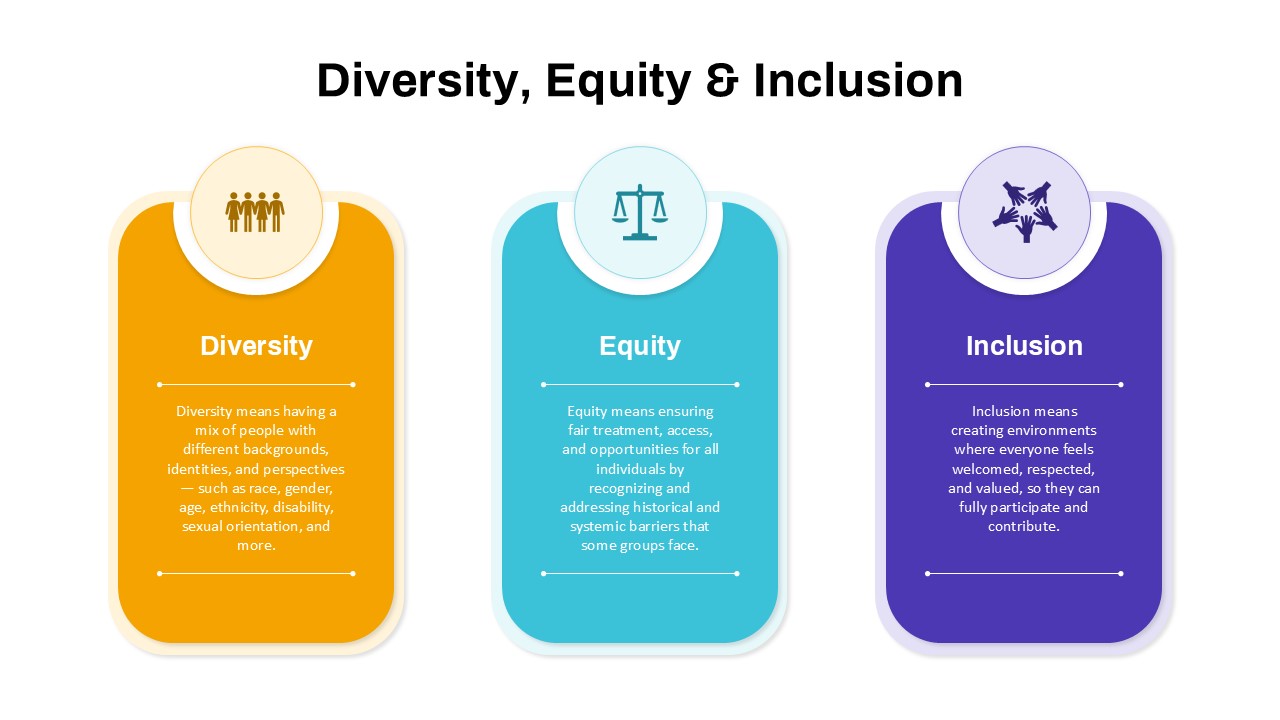
Diversity, Equity & Inclusion Overview template for PowerPoint & Google Slides
Employee Performance
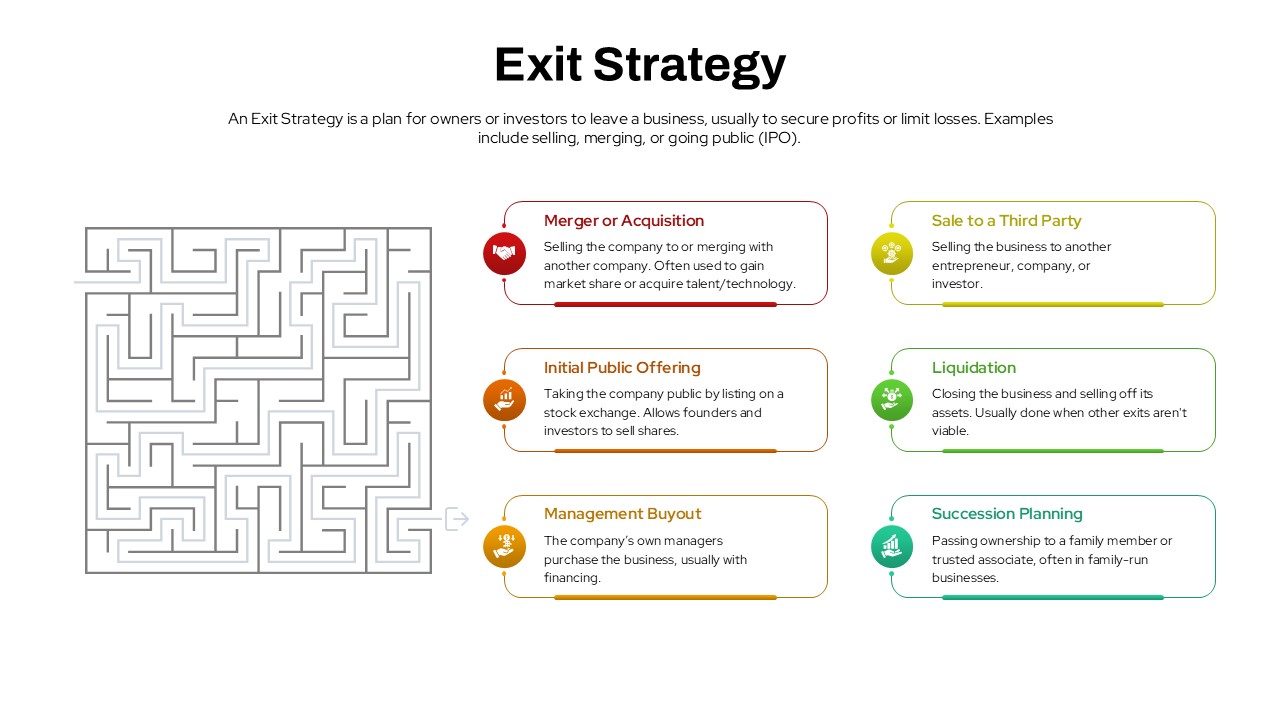
Exit Strategy Options Overview Template for PowerPoint & Google Slides
Business Plan
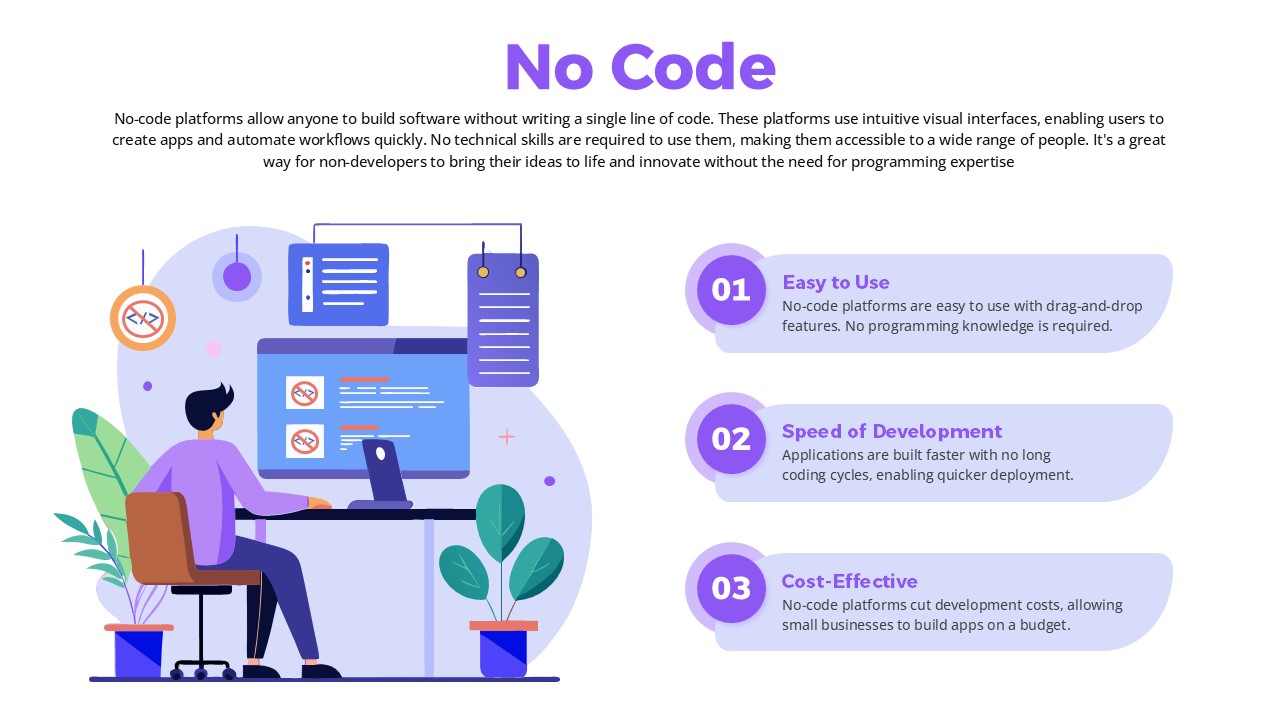
No-Code Overview with 3 Key Benefits Template for PowerPoint & Google Slides
Software Development
Personal Growth Overview Template for PowerPoint & Google Slides
Business
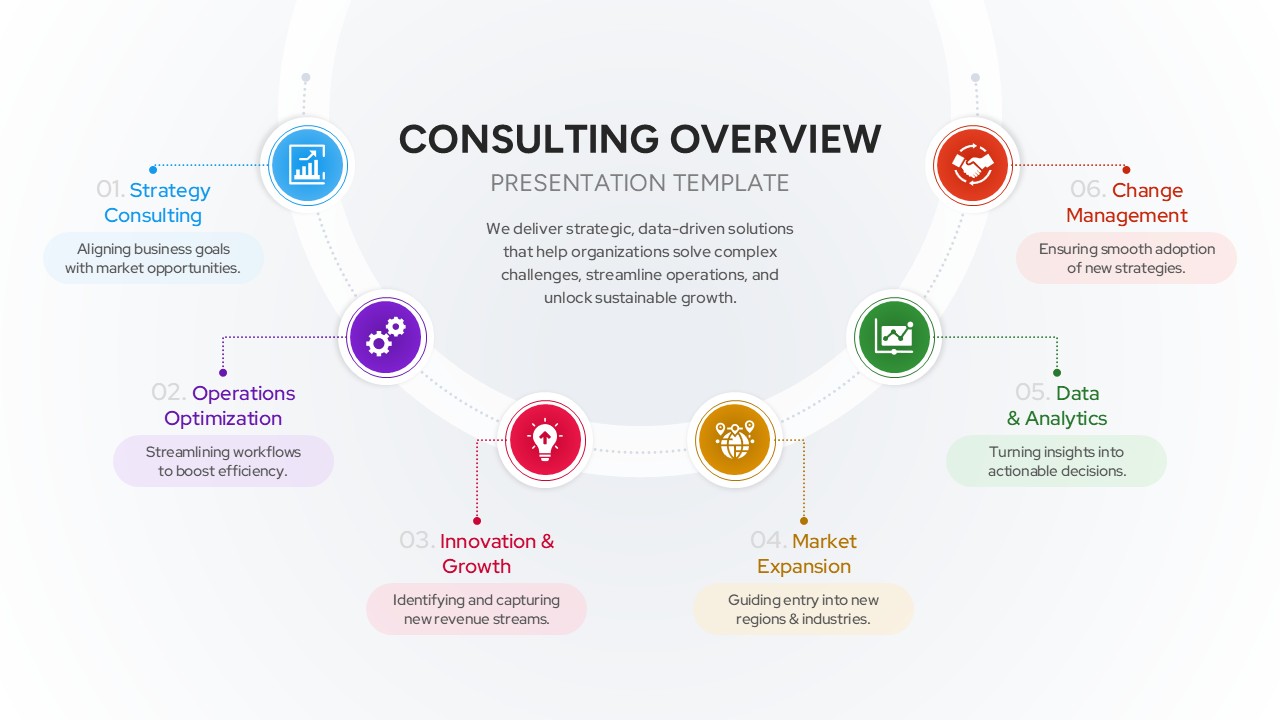
Consulting Overview & Capabilities Template for PowerPoint & Google Slides
Consulting
Civil Engineering Project Overview Deck Template for PowerPoint & Google Slides
Decks
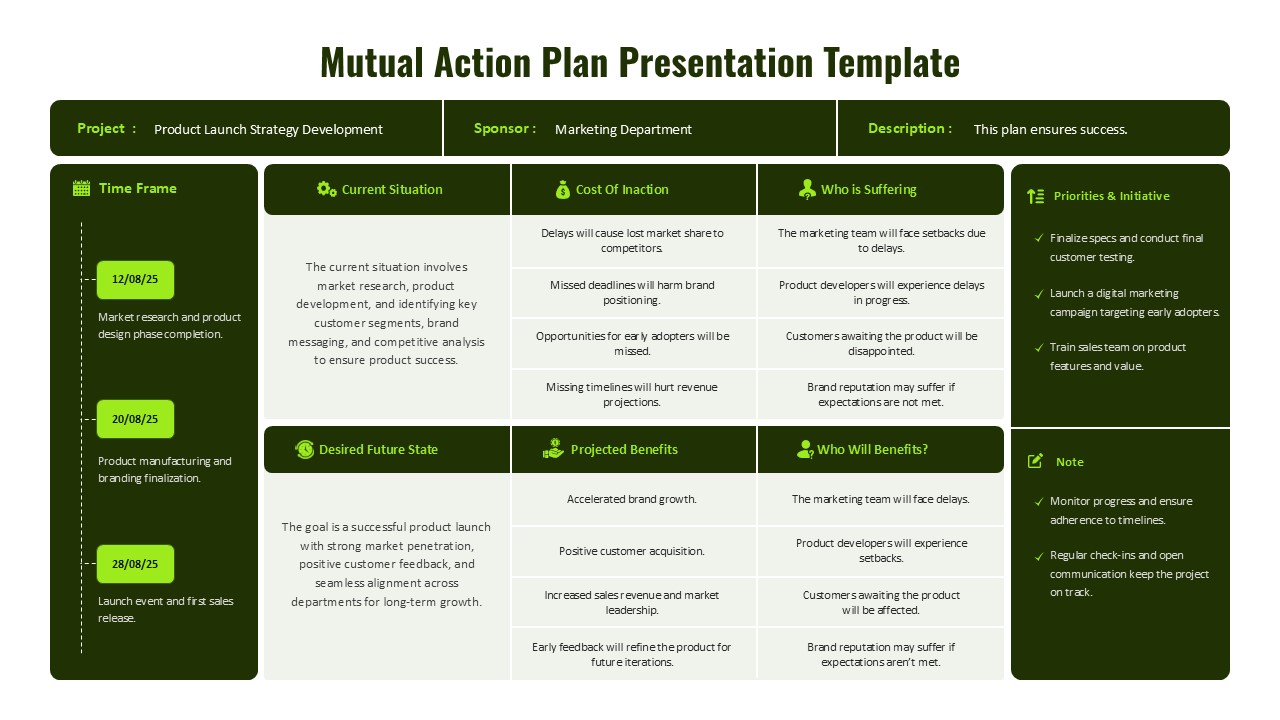
Mutual Action Plan Framework Overview Template for PowerPoint & Google Slides
Project