Productivity Metaphor Clock Icon Template for PowerPoint & Google Slides
Description
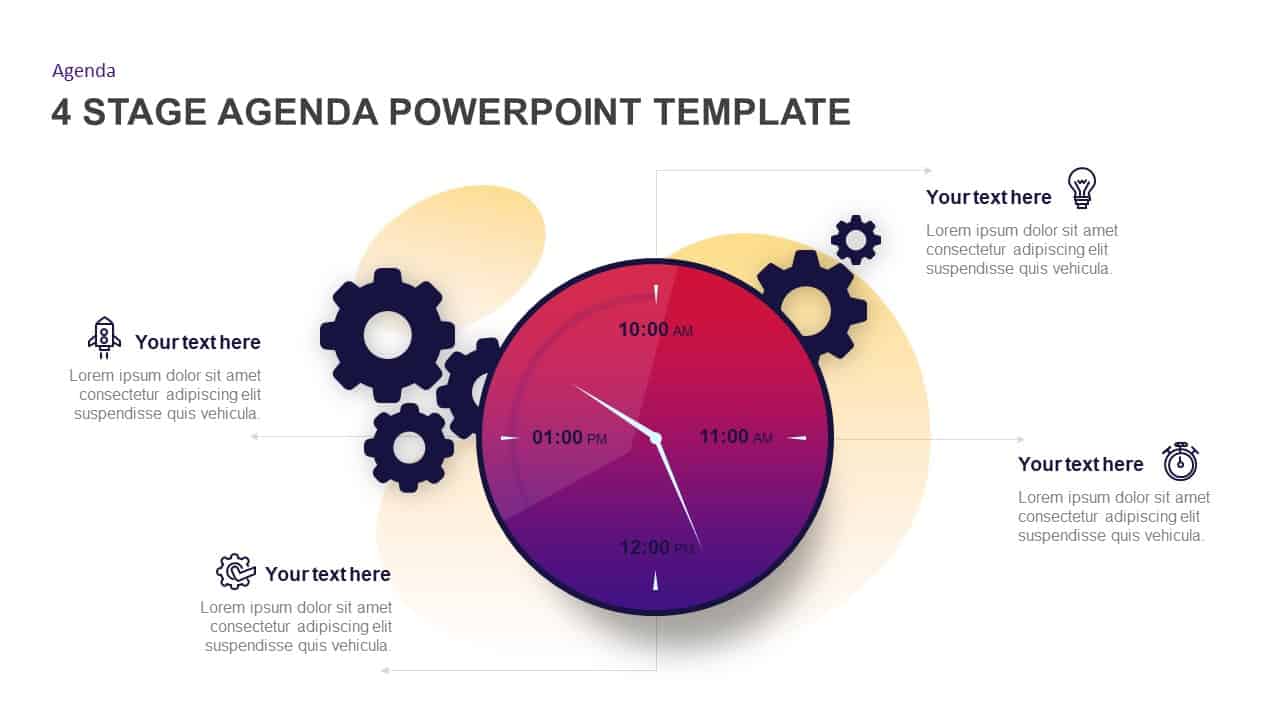
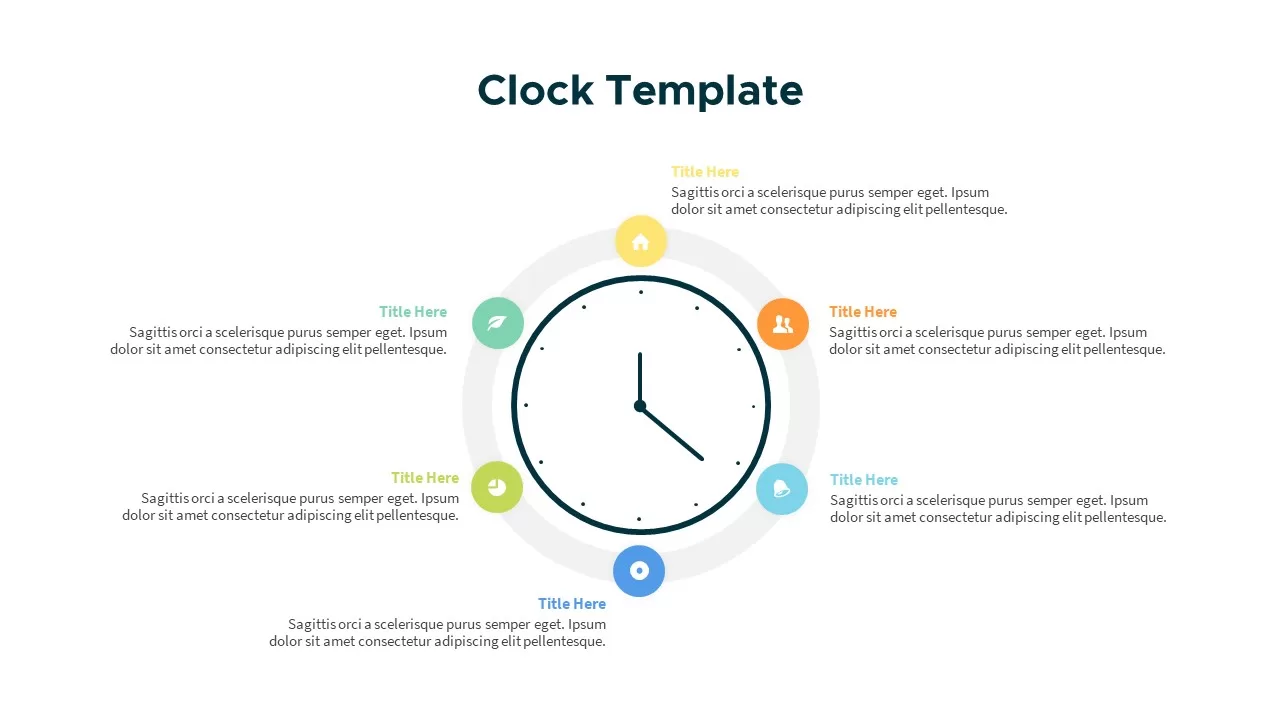
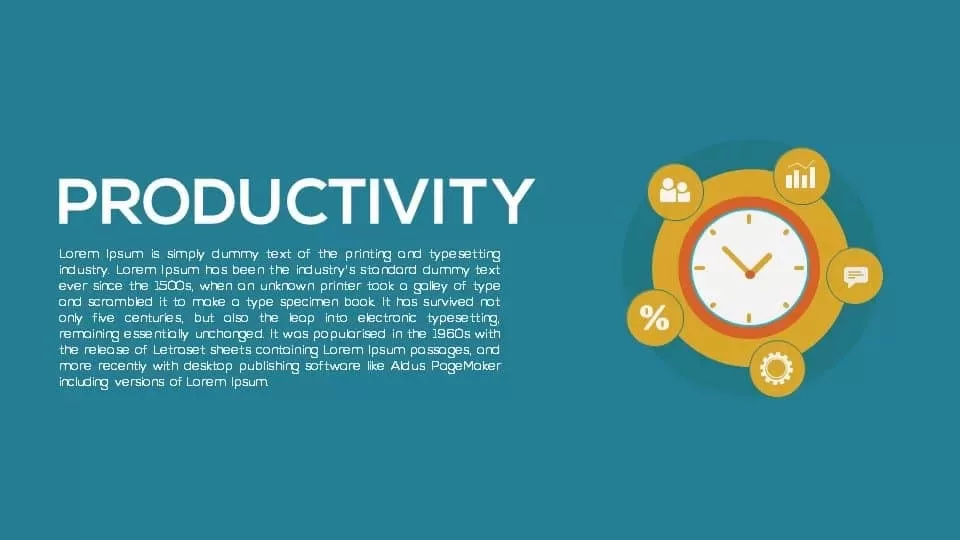
Leverage this productivity metaphor slide featuring a high-resolution analog clock at its center, symbolizing time management and efficiency, set against a soft light-blue backdrop that evokes calm focus. Surrounding the clock, five colorful infographic icons—a bar graph, speech bubble, gear, percentage symbol, and group silhouette—are nestled in circular nodes with subtle drop shadows, while dashed connector lines link each node to the clock face. Semi-transparent gradient arrows frame the slide margins, hinting at a guided, carousel-style narrative flow and reinforcing the concept of continuous improvement and workflow alignment.
Built on fully editable master slides, this template offers complete customization without compromising design integrity. All elements—including the clock hands, icon nodes, connector lines, and background—are vector-based, enabling you to resize, recolor, or swap graphics to match your brand palette. Text placeholders adjacent to each icon let you annotate critical productivity drivers, team objectives, process steps, or data points with crisp typography. Adjust clock settings to reflect realistic schedules, update icon styles for thematic consistency, and leverage built-in layout guides for pixel-perfect alignment in both PowerPoint and Google Slides.
Ideal for executive briefings, team workshops, or time management training sessions, this productivity infographic empowers you to illustrate targets, departmental KPIs, resource allocation, and milestone achievements in a single cohesive slide. Duplicate and modify slides to compare current performance against goals, forecast future productivity trends, or brainstorm efficiency initiatives. The minimalist yet creative design maintains audience focus on core insights, while seamless cross-platform compatibility accelerates slide creation and ensures consistent messaging across presentations.
Who is it for
Project managers, operations leaders, corporate trainers, and team leads will benefit from this infographic when presenting time management strategies, performance reviews, or workflow optimizations in executive briefings, staff workshops, or training sessions.
Other Uses
Beyond time management, repurpose this slide to illustrate resource allocation models, process improvement plans, sales performance analyses, or brainstorming outcomes. Replace icons to map departmental objectives, customer response workflows, or software development sprints, adapting the template for any data-driven narrative.
Login to download this file

Item ID
SB00499
Related Templates

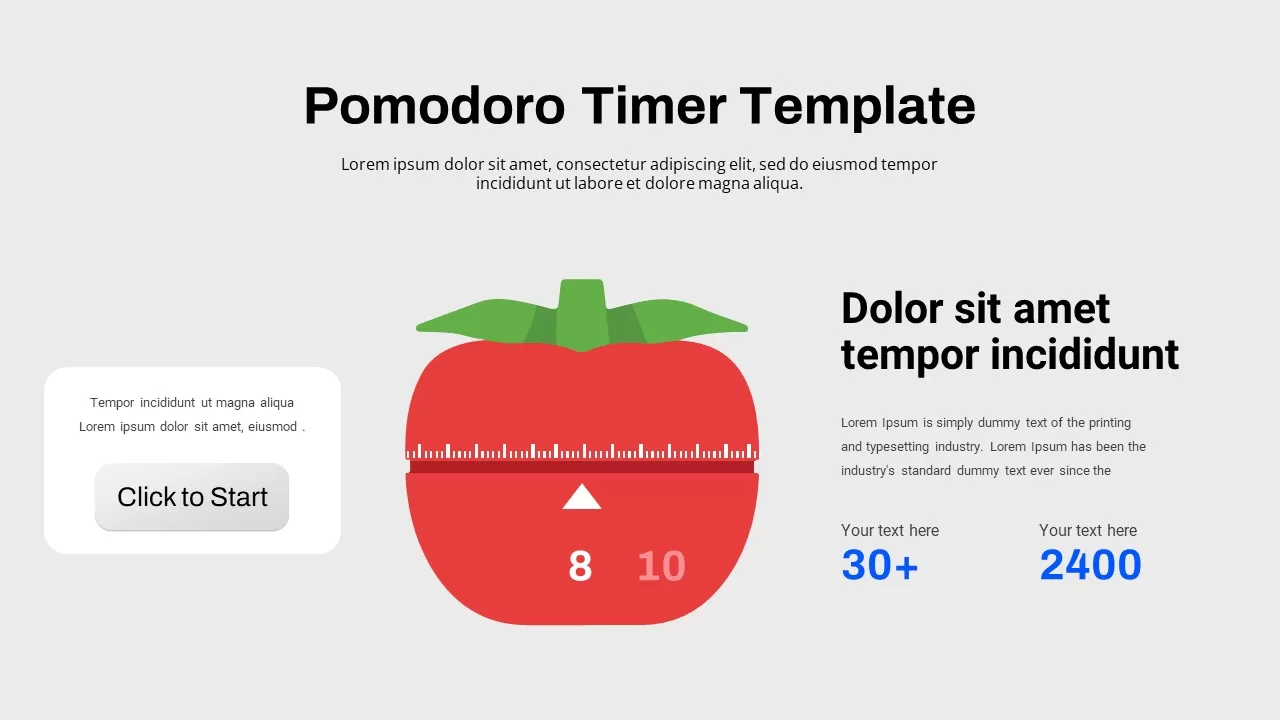
Animated Pomodoro Timer Productivity Template for PowerPoint & Google Slides
Infographics
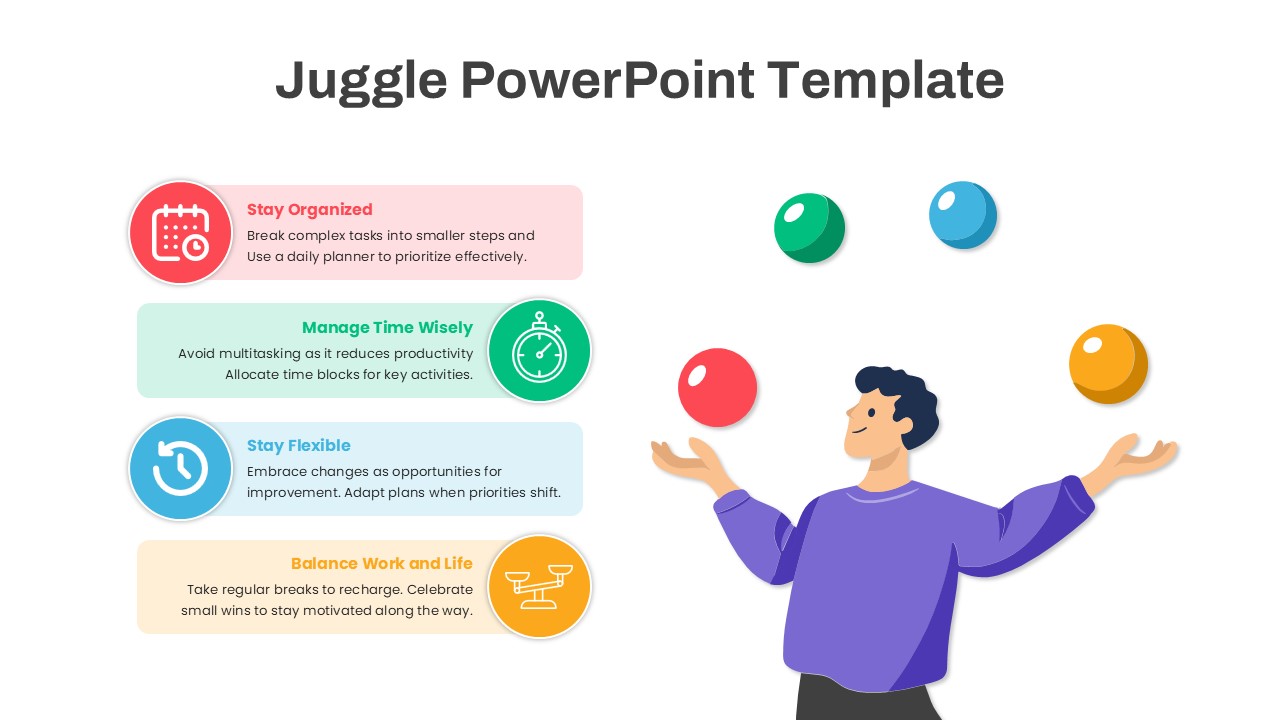
Task Juggling Productivity Tips Template for PowerPoint & Google Slides
Opportunities Challenges
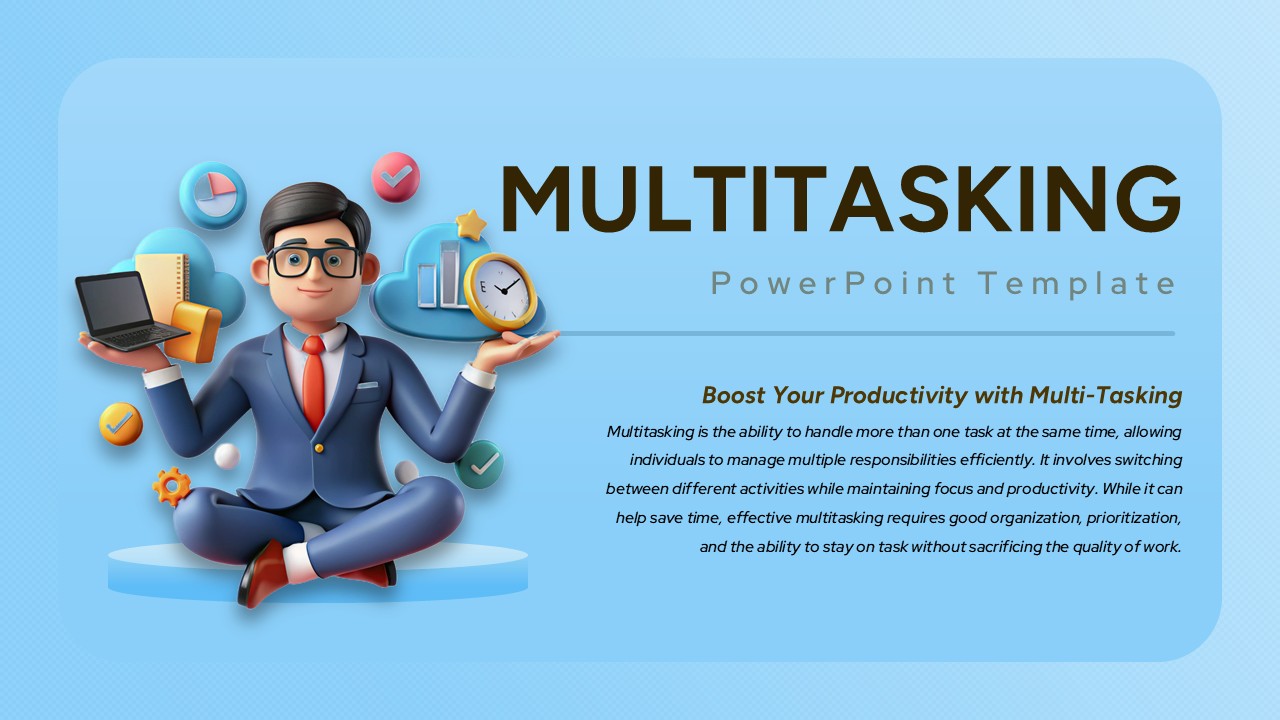
Multitasking Productivity Illustration Template for PowerPoint & Google Slides
Graphics
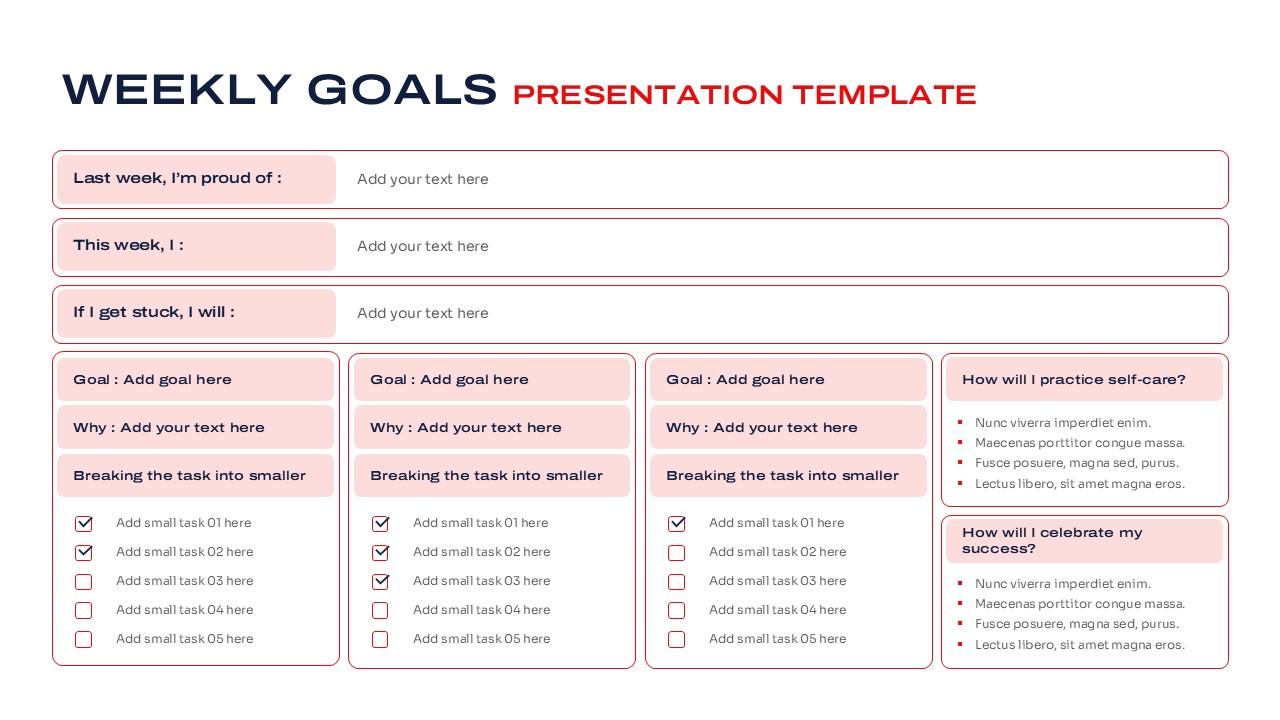
Weekly Goals Planning and Productivity Overview Template for PowerPoint & Google Slides
Goals
Signature Icon Slide template for PowerPoint & Google Slides
Infographics
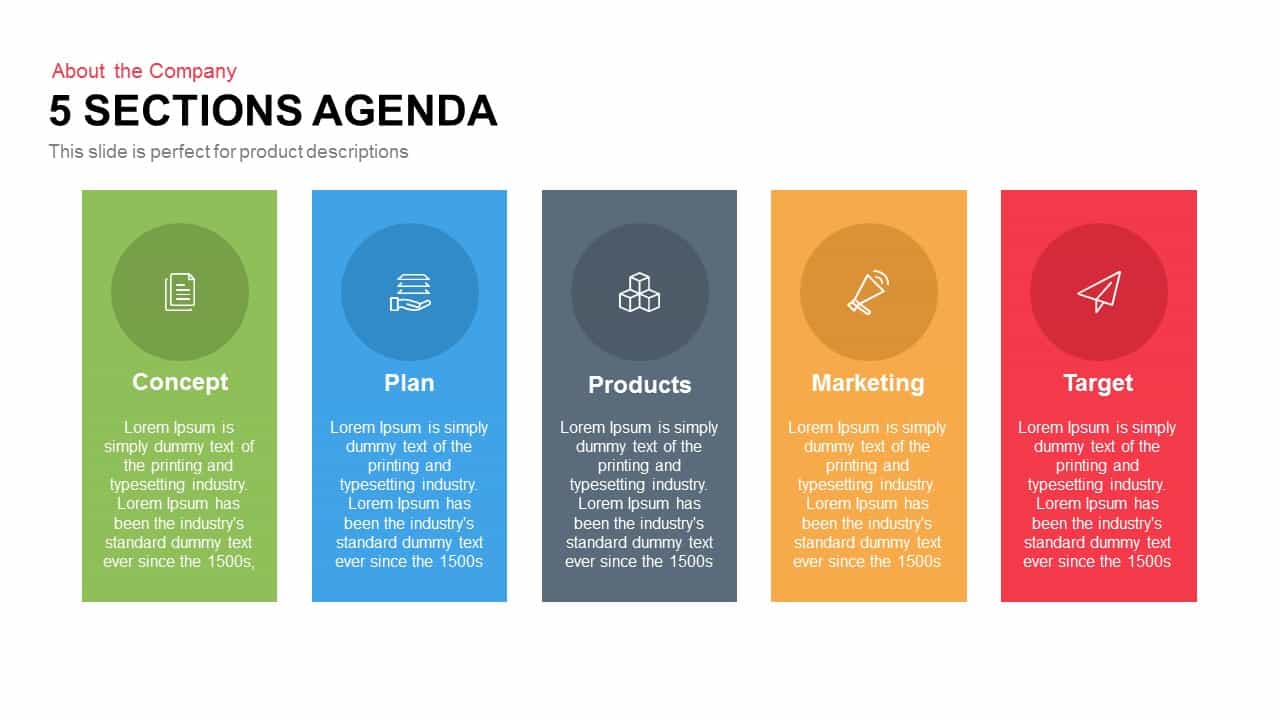
5 Sections Agenda with Icon Cards Template for PowerPoint & Google Slides
Agenda
Icon Section Flow template for PowerPoint & Google Slides
Process

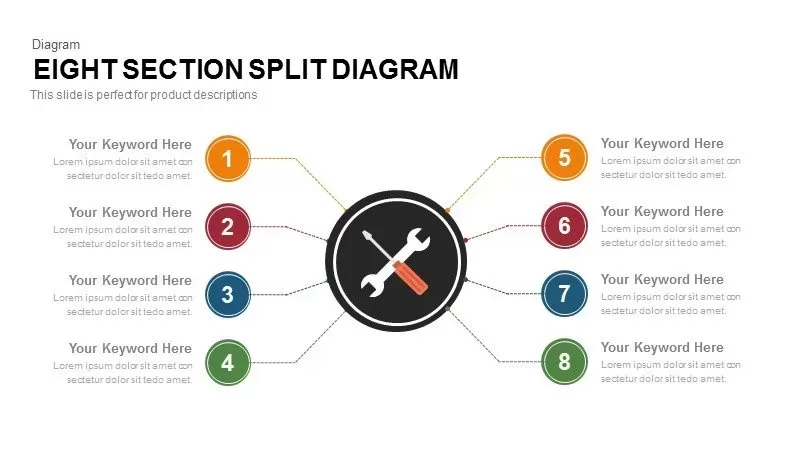
8-Section Split Diagram with Hub Icon template for PowerPoint & Google Slides
Circular
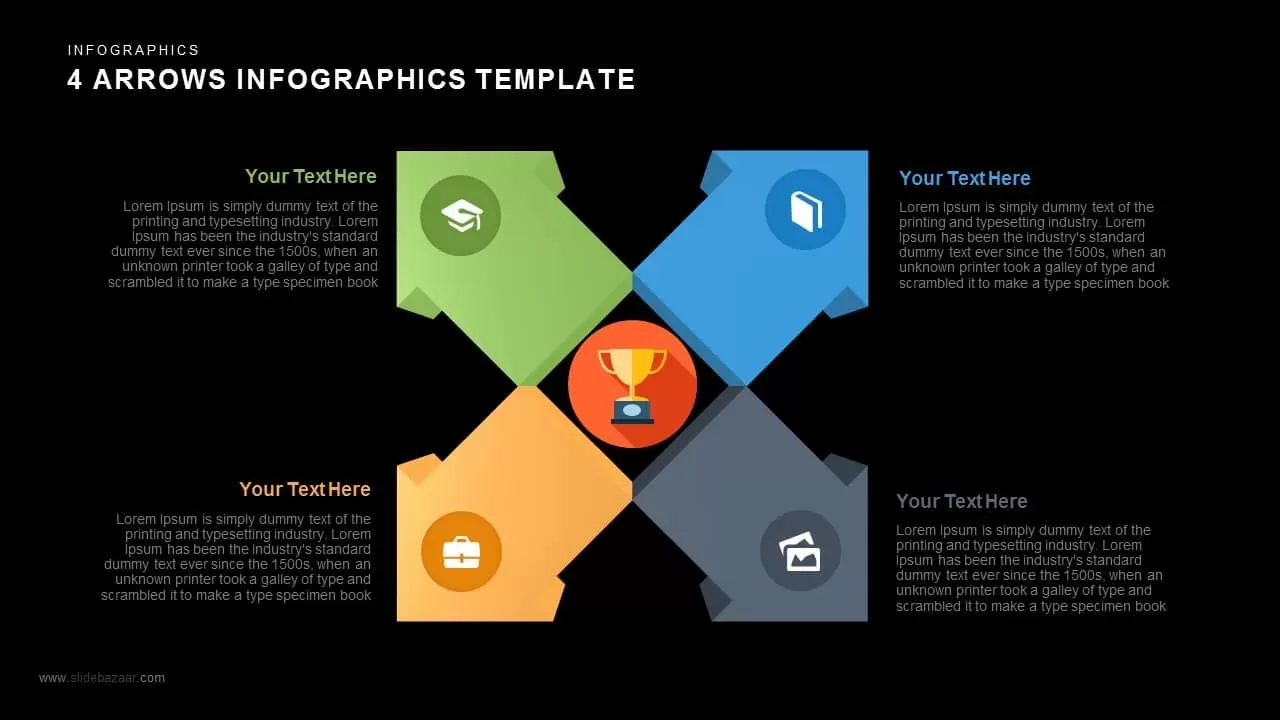
Four Arrows Layout Infographic with Icon Template for PowerPoint & Google Slides
Arrow
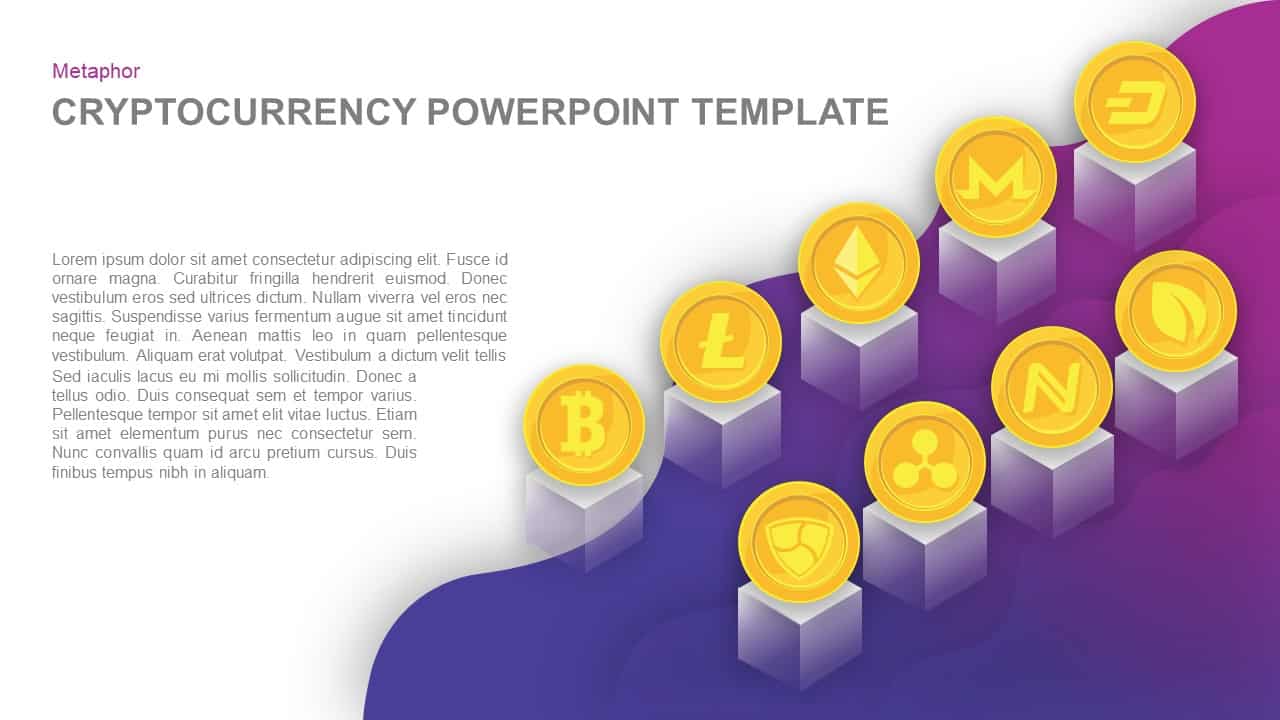
Cryptocurrency Icon Collection Template for PowerPoint & Google Slides
Finance
Free Editable Check Box Icon Set Presentation Template for PowerPoint & Google Slides
Infographics
Free
About Us Slide with Icon Highlights Template for PowerPoint & Google Slides
Business
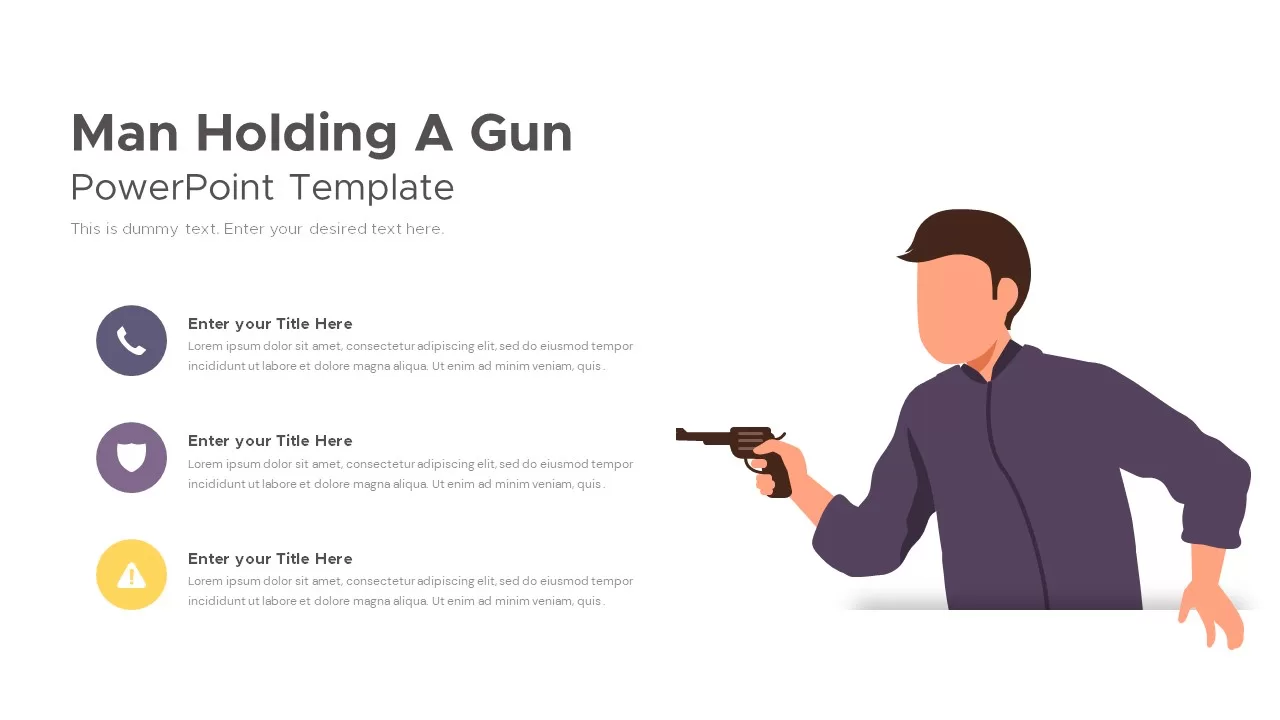
Man Holding Gun with Icon List Template for PowerPoint & Google Slides
Infographics
Business Icon Pack Template for PowerPoint & Google Slides
Graphics
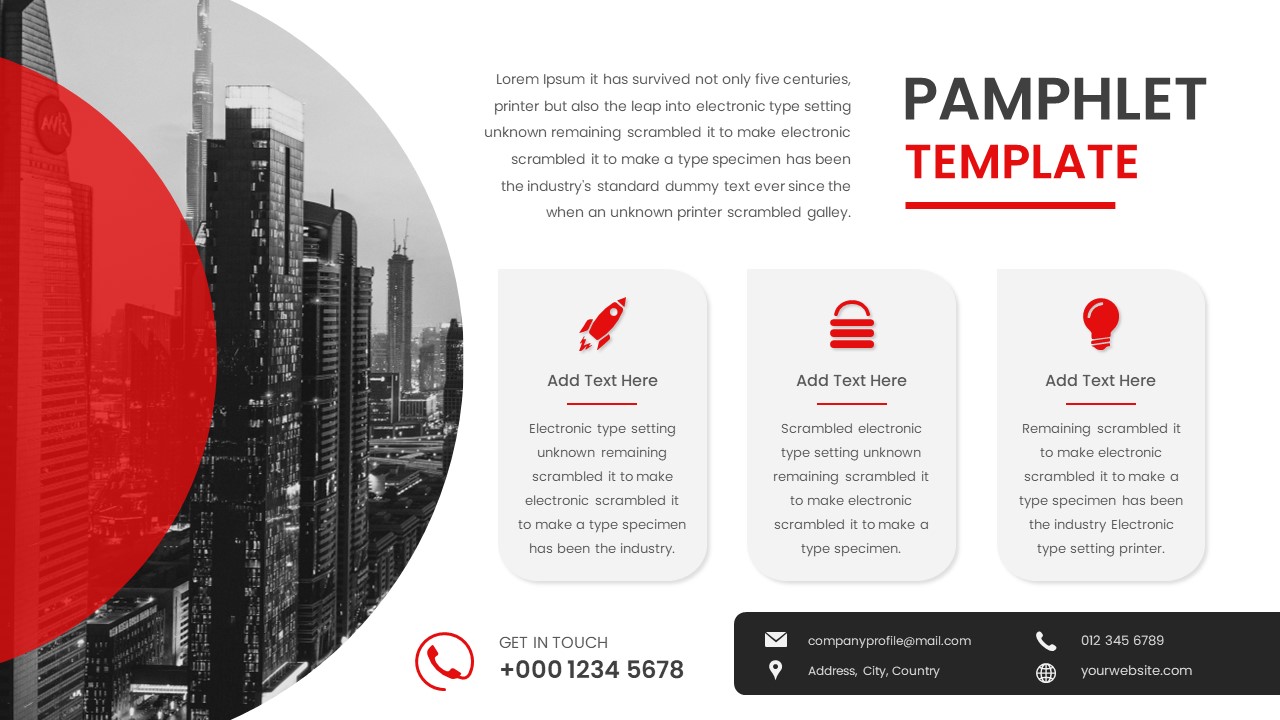
Corporate Pamphlet with Icon Features Template for PowerPoint & Google Slides
Graphics
Free Stick Figure Icon Pack Slide Template for PowerPoint & Google Slides
Graphics
Free
Dynamic Carousel Icon Hub Diagram Template for PowerPoint & Google Slides
Circular
Free Check Mark Icon Slide for PowerPoint & Google Slides
Infographics
Free
American Flag Icon Set Slide for PowerPoint & Google Slides
Graphics
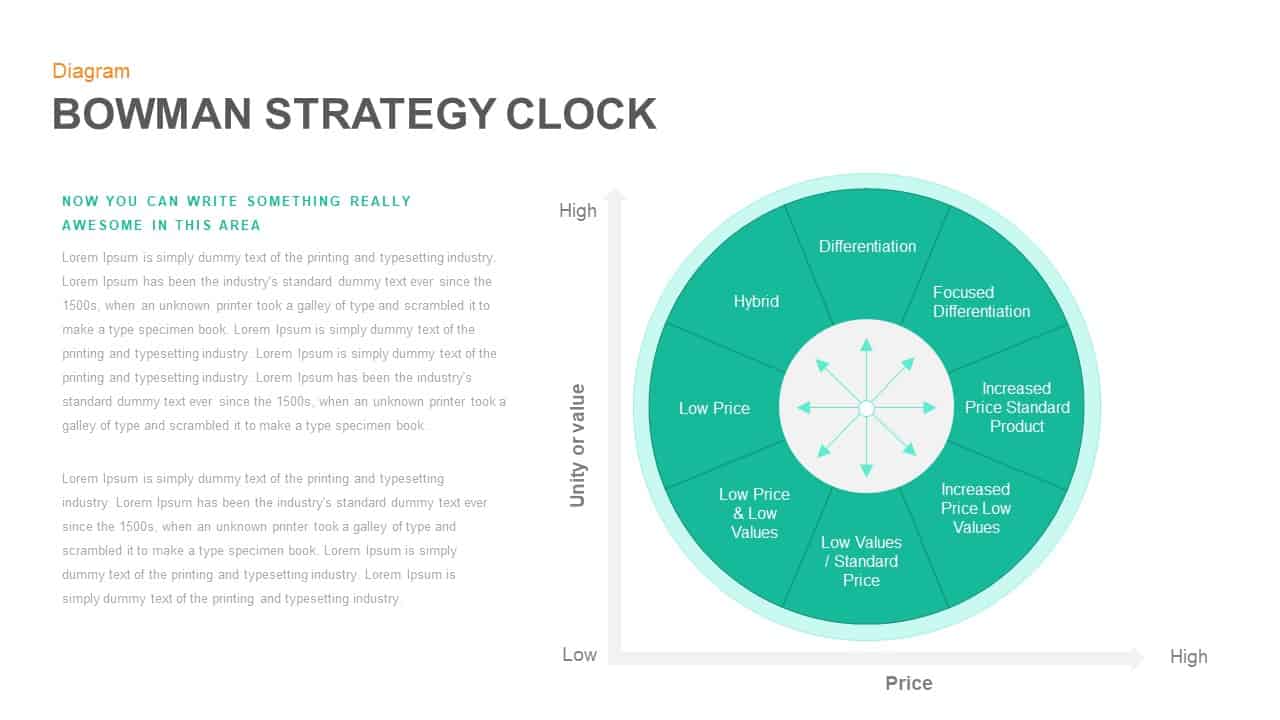
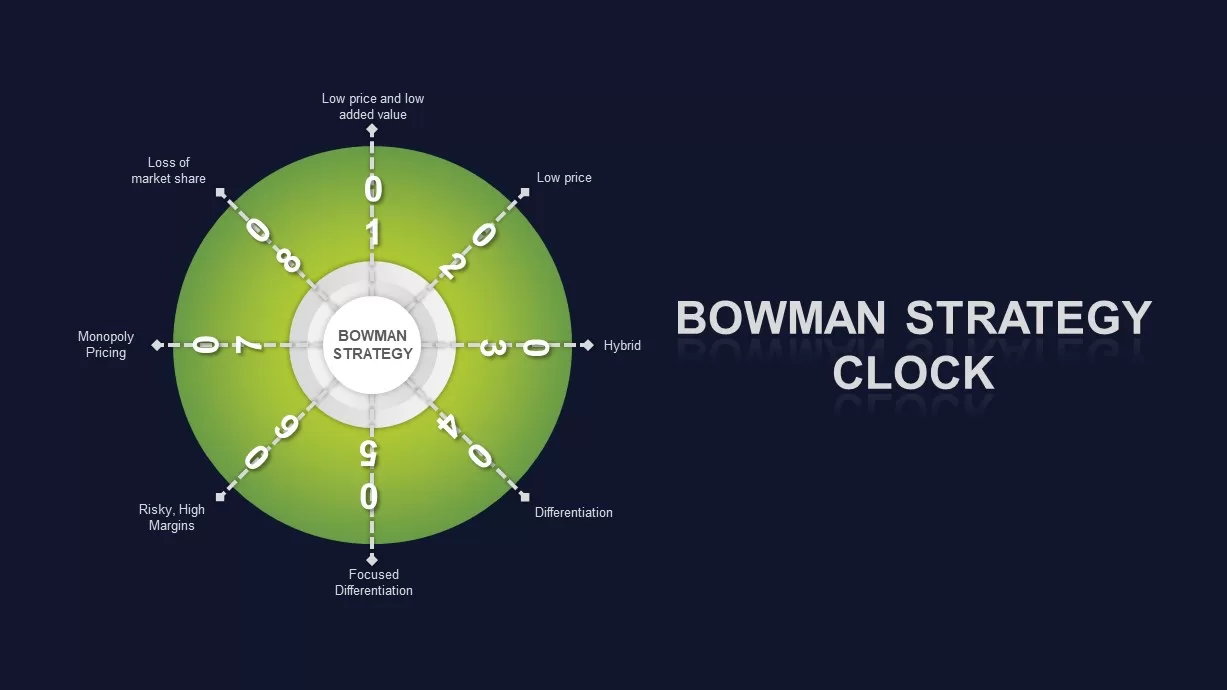
Modern Bowman Strategy Clock Diagram Slide Template for PowerPoint & Google Slides
Competitor Analysis
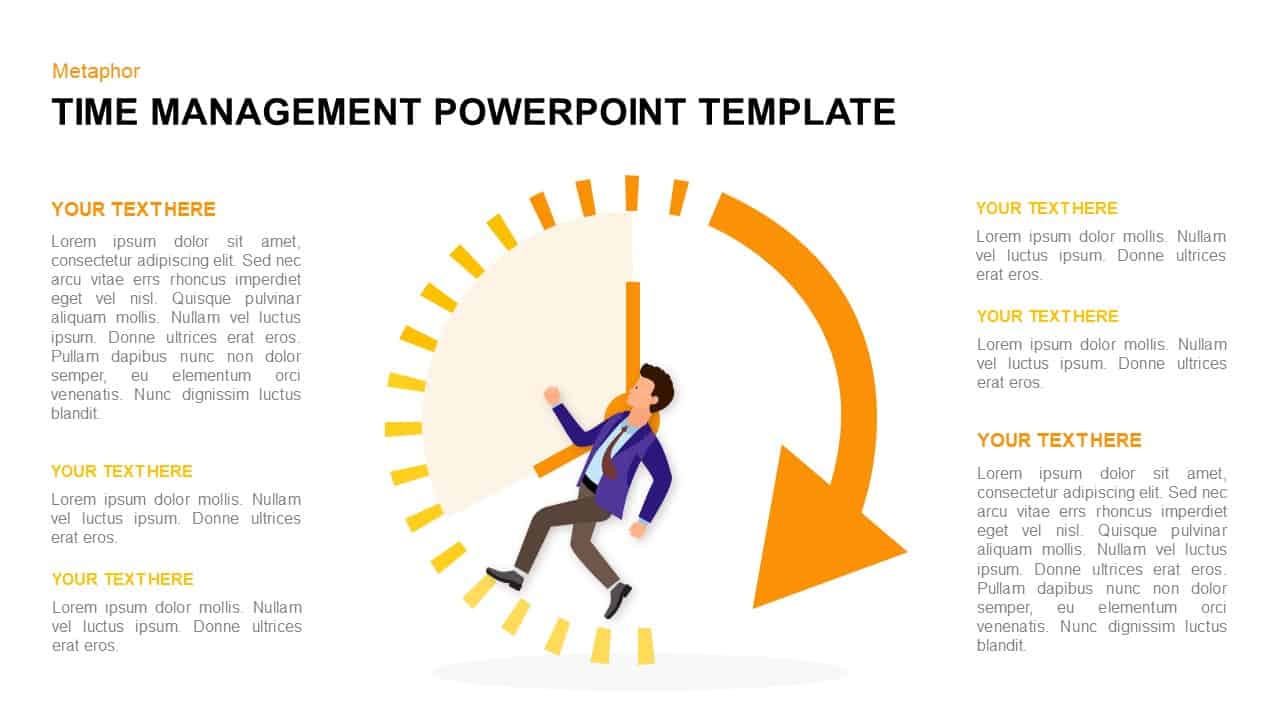
Time Management Clock Infographic Template for PowerPoint & Google Slides
Circular
Gradient Clock Agenda Timeline Diagram Template for PowerPoint & Google Slides
Agenda
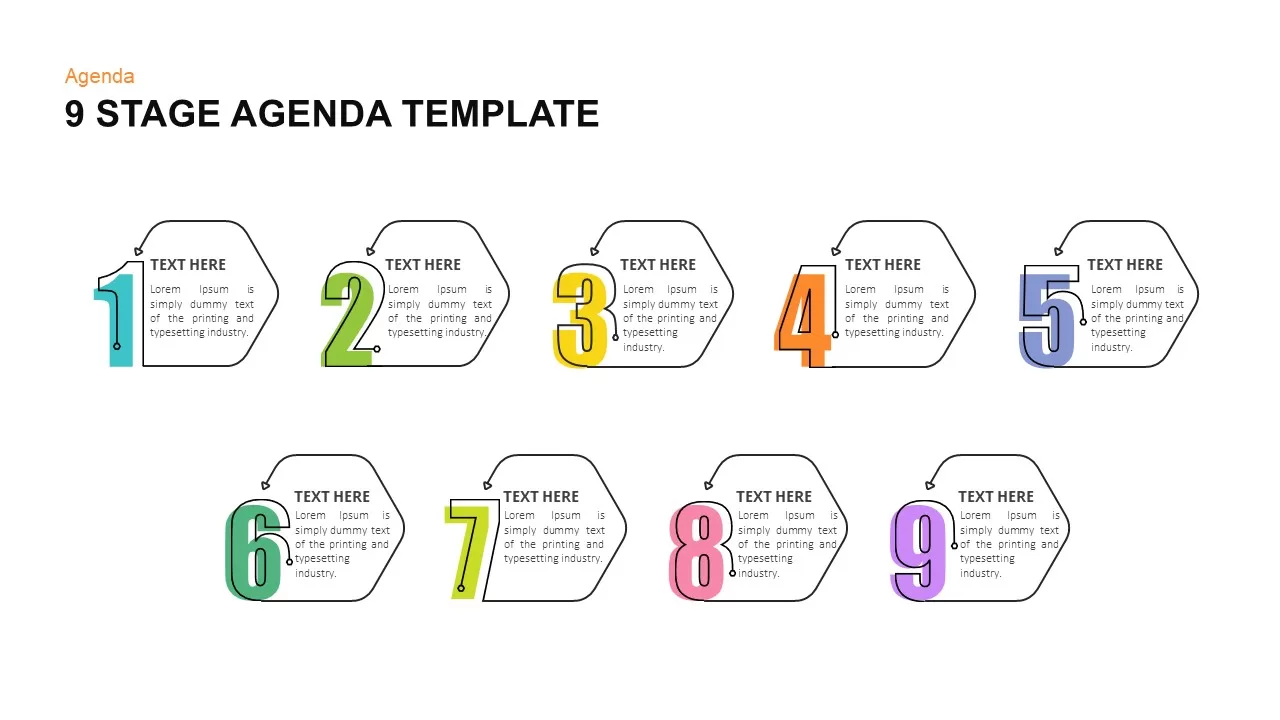
Clock-Timeline Nine-Stage Agenda Template for PowerPoint & Google Slides
Agenda
Clock Diagram for Time Management Template for PowerPoint & Google Slides
Circular
Multi-Style Clock Chart Diagram Template for PowerPoint & Google Slides
Circular
Free Time Management Clock Cycle Diagram Template for PowerPoint & Google Slides
Process
Free

Bowman’s Strategy Clock Diagram for PowerPoint & Google Slides
Infographics
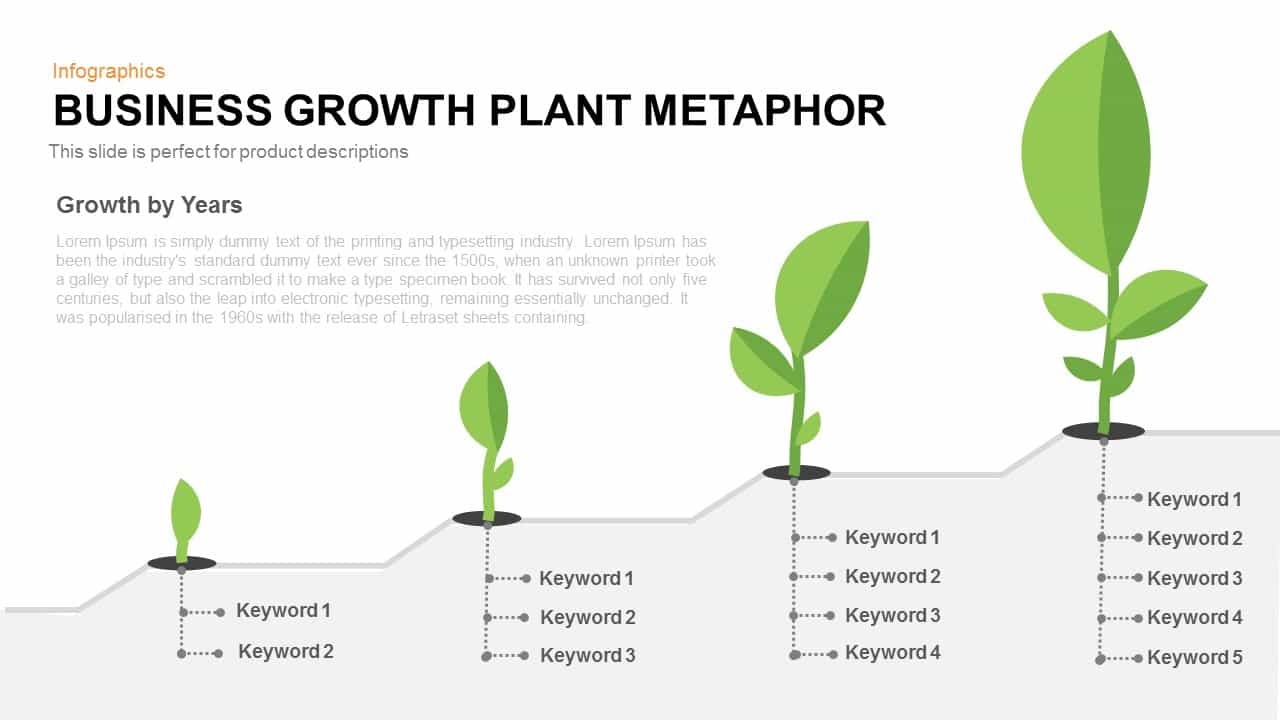
Business Growth Plant Metaphor Timeline Template for PowerPoint & Google Slides
Business Strategy

Discover Metaphor Concept Slide Template for PowerPoint & Google Slides
Infographics

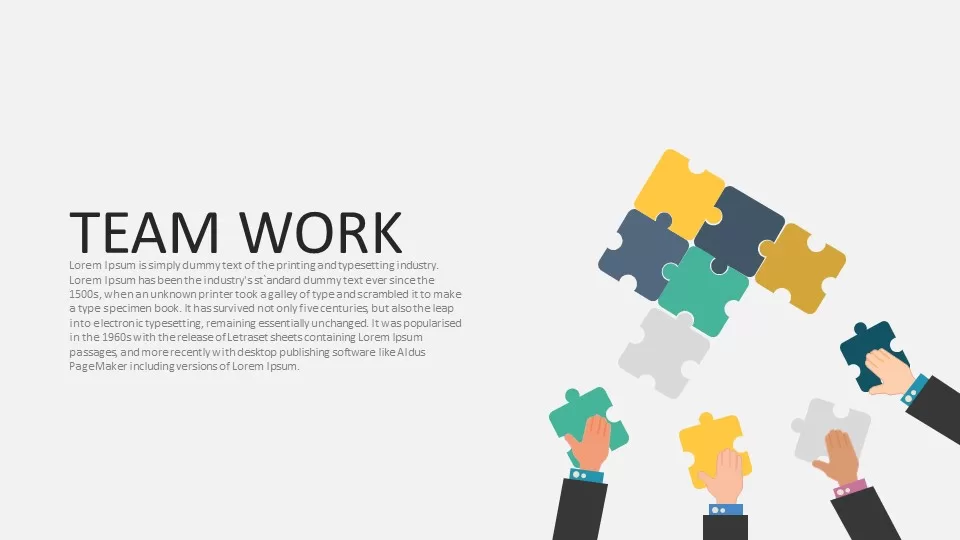
Teamwork Puzzle Metaphor Slide Template for PowerPoint & Google Slides
Our Team
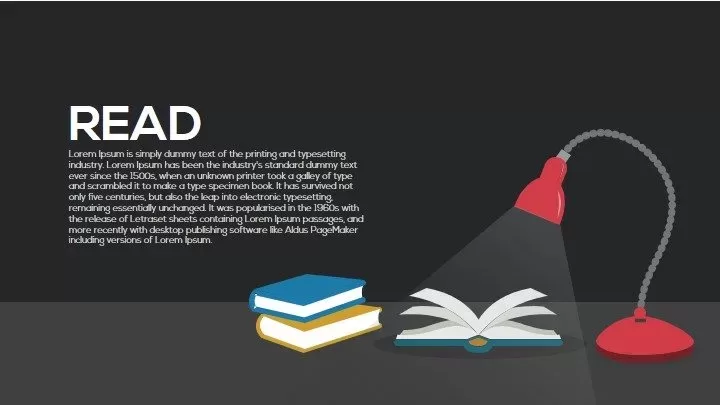
Read Metaphor Concept Illustration Slide Template for PowerPoint & Google Slides
Infographics
Metaphor Light Bulb Idea Concept Template for PowerPoint & Google Slides
Infographics
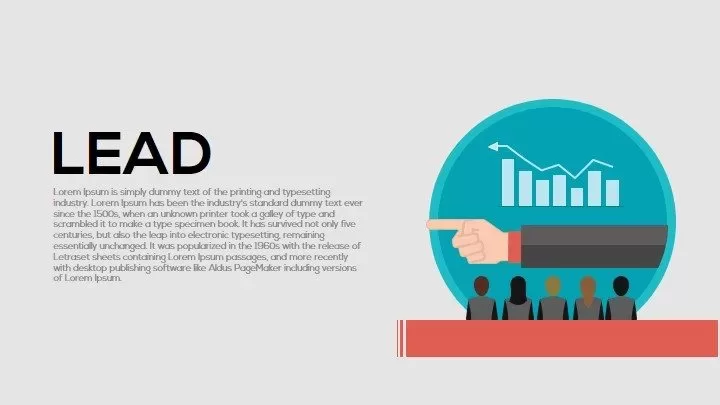
Leadership Metaphor Presentation Slide Template for PowerPoint & Google Slides
Leadership
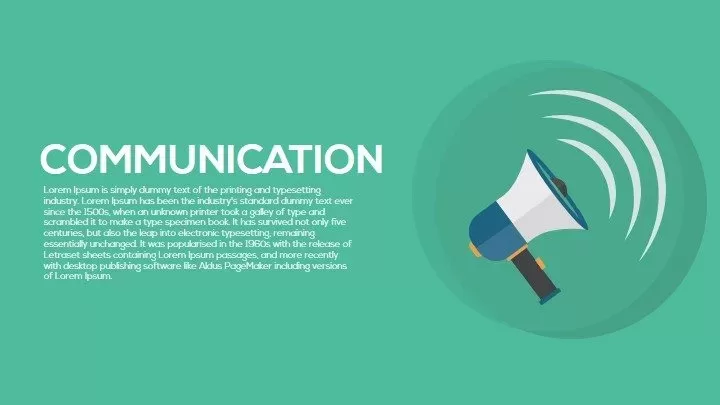
Megaphone Communication Metaphor Template for PowerPoint & Google Slides
Advertising
Metaphor Multitasking Illustration Template for PowerPoint & Google Slides
Business
Metaphor Knowledge Illustration Slide Template for PowerPoint & Google Slides
Infographics
Strength Metaphor Dumbbell Diagram Template for PowerPoint & Google Slides
Accomplishment
Rebuild Brick Wall Metaphor Slide Template for PowerPoint & Google Slides
Infographics
Efficiency KPI Dashboard Metaphor Template for PowerPoint & Google Slides
Infographics
Destination Roadmap Pin Metaphor Template for PowerPoint & Google Slides
Roadmap
Metaphor Speed Template for PowerPoint & Google Slides
Process
Scale Metaphor Metrics Comparison Template for PowerPoint & Google Slides
Charts
Key Metaphor Infographic Slide Template for PowerPoint & Google Slides
Process
Mustard and Navy Balance Scale Metaphor Template for PowerPoint & Google Slides
Comparison
Shield Metaphor Security and Protection Template for PowerPoint & Google Slides
Risk Management
Magnifying Glass Research Metaphor Template for PowerPoint & Google Slides
Process
Business Opportunity Metaphor Slide Template for PowerPoint & Google Slides
Opportunities Challenges
Explore Binoculars Metaphor Slide Template for PowerPoint & Google Slides
Process
Guide Metaphor Navigation Infographic Template for PowerPoint & Google Slides
Process
Office Workspace Metaphor Slide Template for PowerPoint & Google Slides
Business Proposal
Operation Process Metaphor Diagram Template for PowerPoint & Google Slides
Process
Professional Security Metaphor Diagram Template for PowerPoint & Google Slides
Information Technology
Navigation Compass Metaphor Slide Template for PowerPoint & Google Slides
Vision and Mission
Deadline Metaphor Timeline & Hourglass Template for PowerPoint & Google Slides
Project
Planning Metaphor Flowchart Slide Template for PowerPoint & Google Slides
Process
Product Shipping Metaphor Diagram Template for PowerPoint & Google Slides
Process
Competition Metaphor Podium Diagram Template for PowerPoint & Google Slides
Business
News Metaphor Media Communication Slide Template for PowerPoint & Google Slides
Business Report
Improvement Growth Arrow Metaphor Template for PowerPoint & Google Slides
Bar/Column
Process Improvement Metaphor Diagram Template for PowerPoint & Google Slides
Process
Money Metaphor Financial Overview Template for PowerPoint & Google Slides
Finance
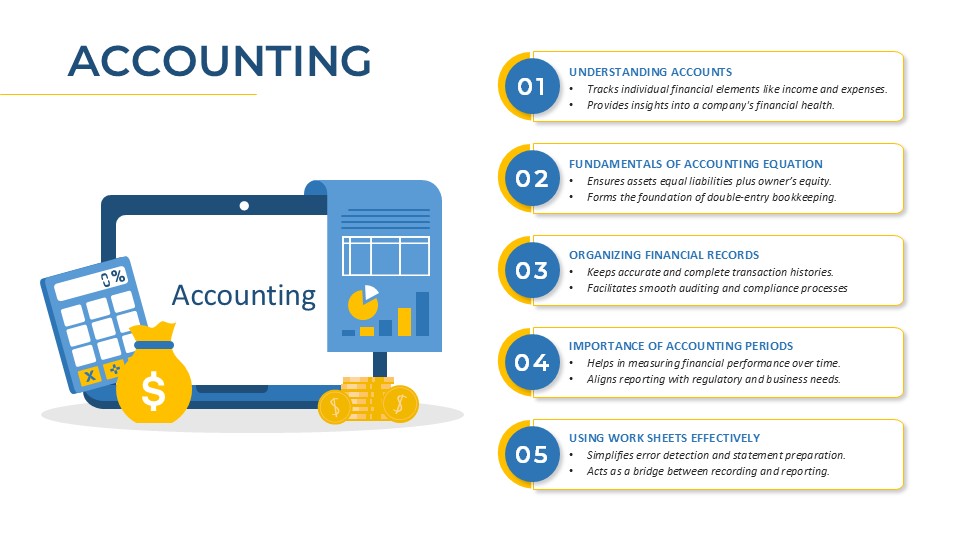
Accounting Process Metaphor Diagram Template for PowerPoint & Google Slides
Accounting
Dual Percentage Comparison Metaphor Template for PowerPoint & Google Slides
Comparison

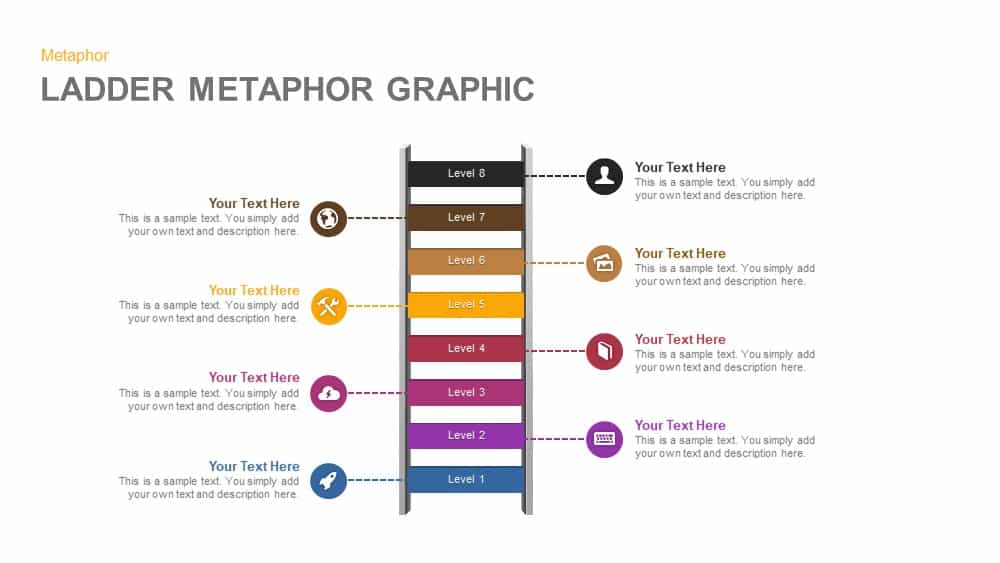
Eight-Level Ladder Metaphor Graphic Template for PowerPoint & Google Slides
Process
Business Decision-Making Metaphor Template for PowerPoint & Google Slides
Leadership
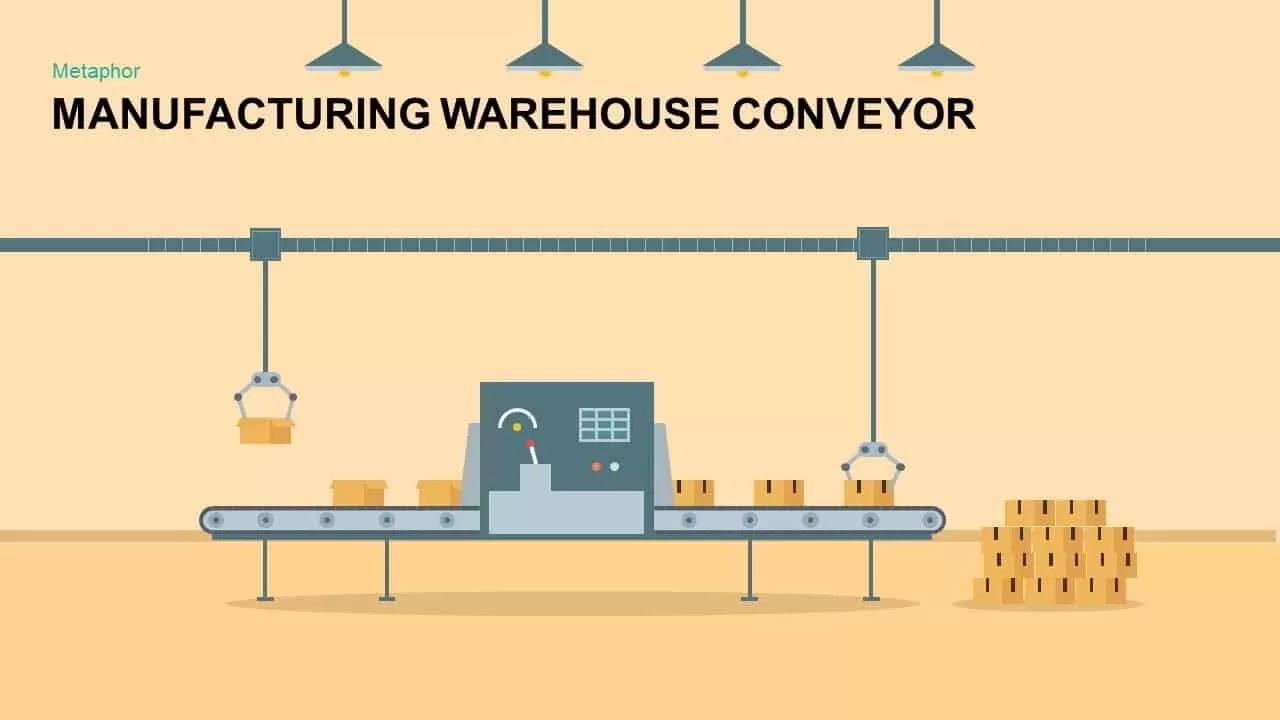
Warehouse Conveyor Process Metaphor Template for PowerPoint & Google Slides
Process
Cyber Security Metaphor Diagram Template for PowerPoint & Google Slides
Risk Management
Developer Icons Metaphor Slide Template for PowerPoint & Google Slides
Software Development
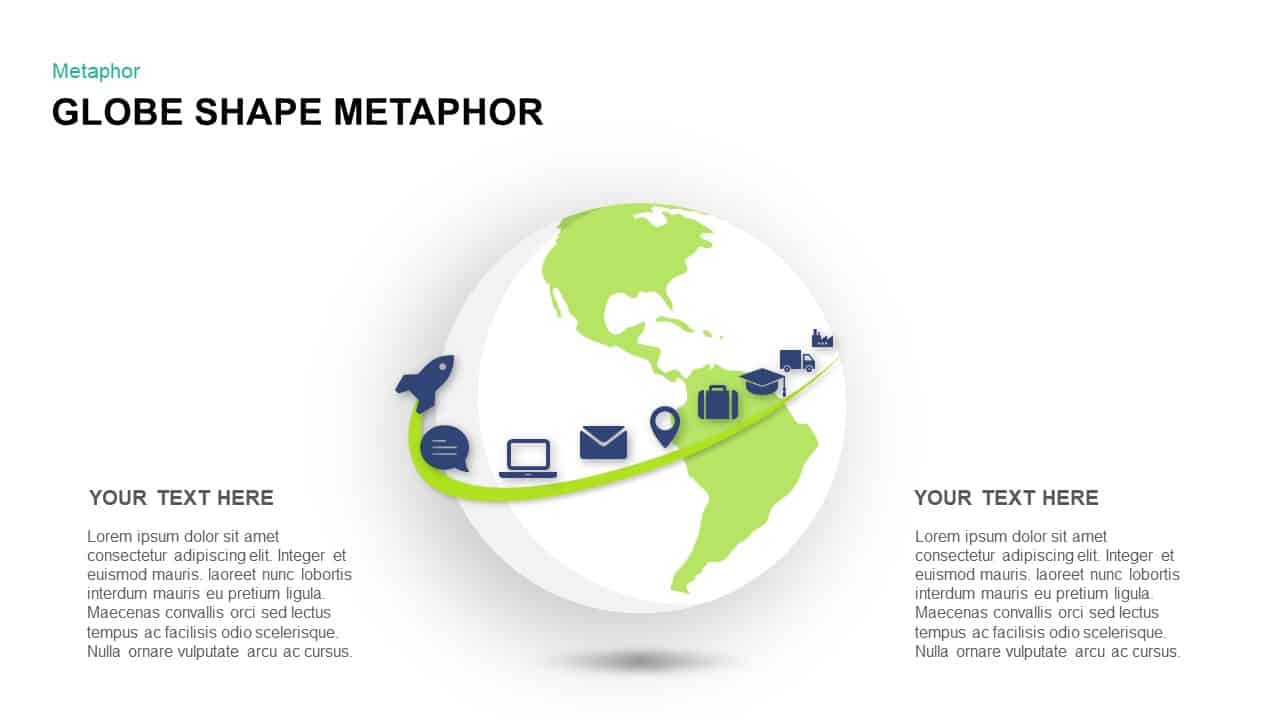
Global Business Pathway Metaphor Template for PowerPoint & Google Slides
Opportunities Challenges

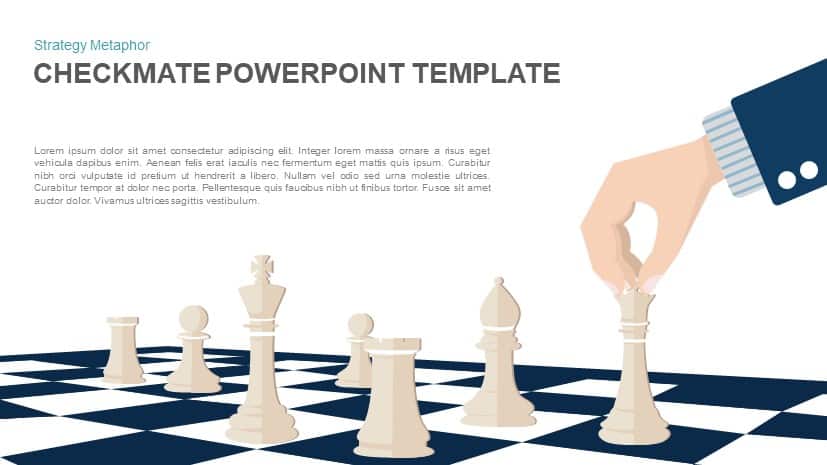
Checkmate Strategy Chess Metaphor Template for PowerPoint & Google Slides
Opportunities Challenges
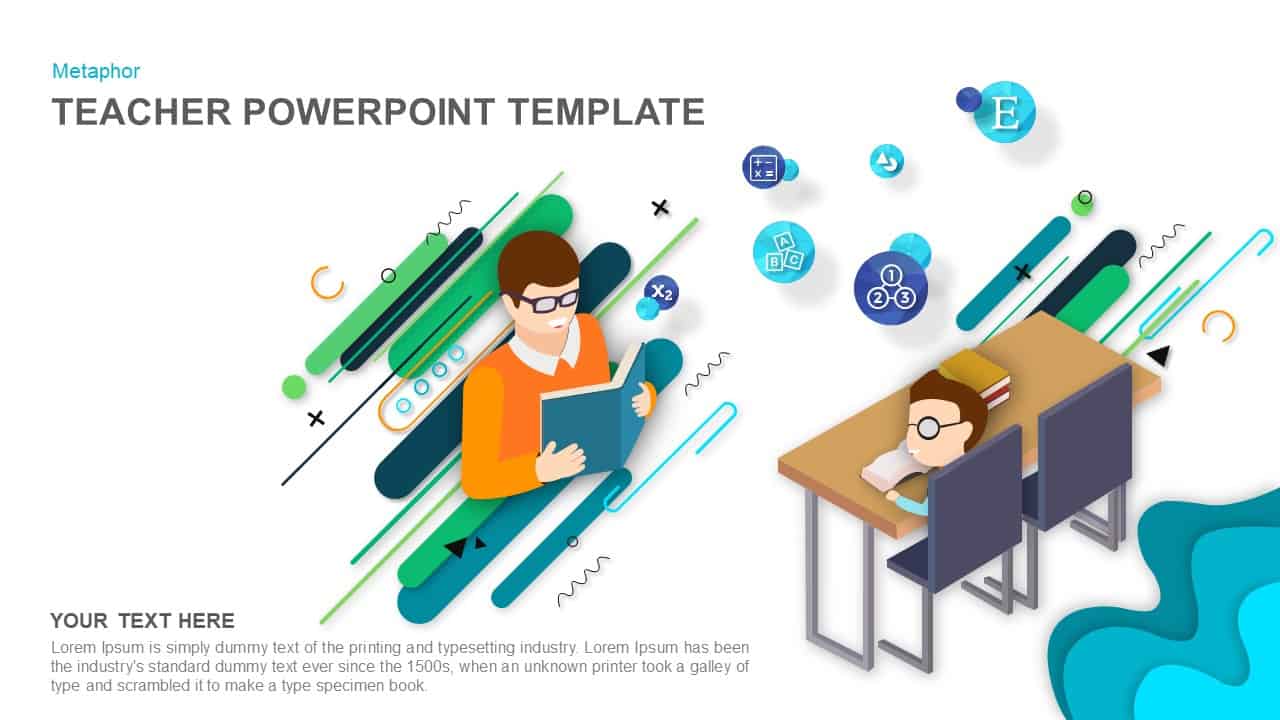
Teacher Illustration Metaphor Slide Template for PowerPoint & Google Slides
Process
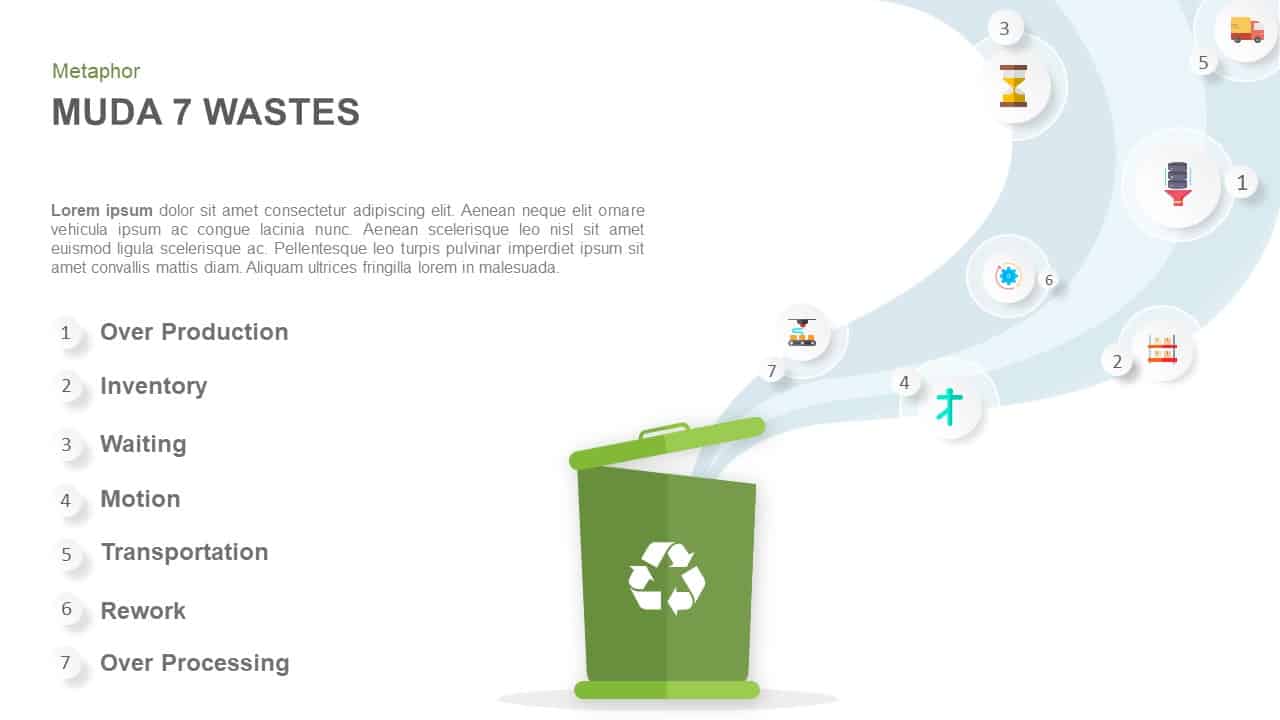
Muda 7 Wastes Recycling Bin Metaphor Template for PowerPoint & Google Slides
Process

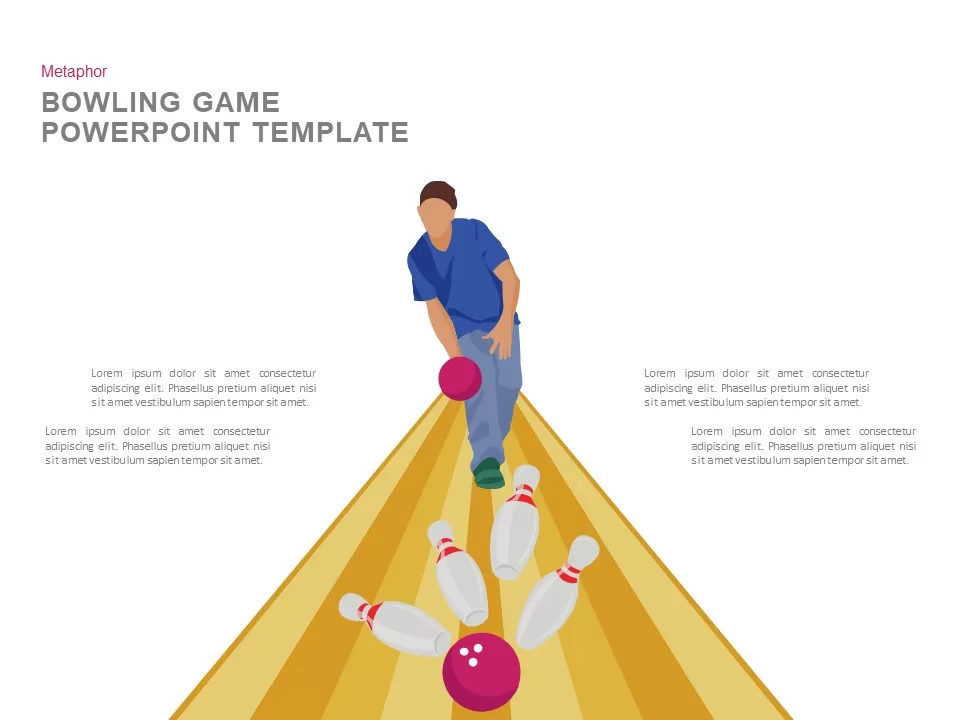
Bowling Game Illustration Metaphor Template for PowerPoint & Google Slides
Process
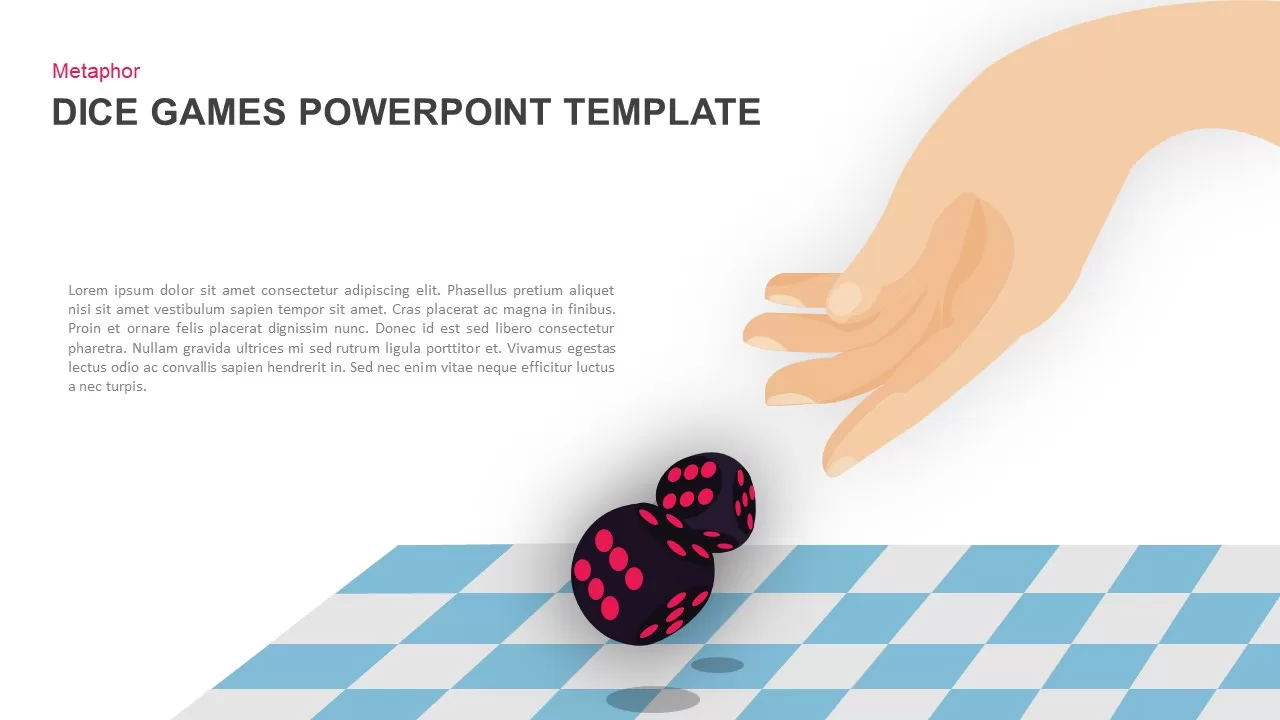
Dice Game Throwing Metaphor Slide Template for PowerPoint & Google Slides
Process
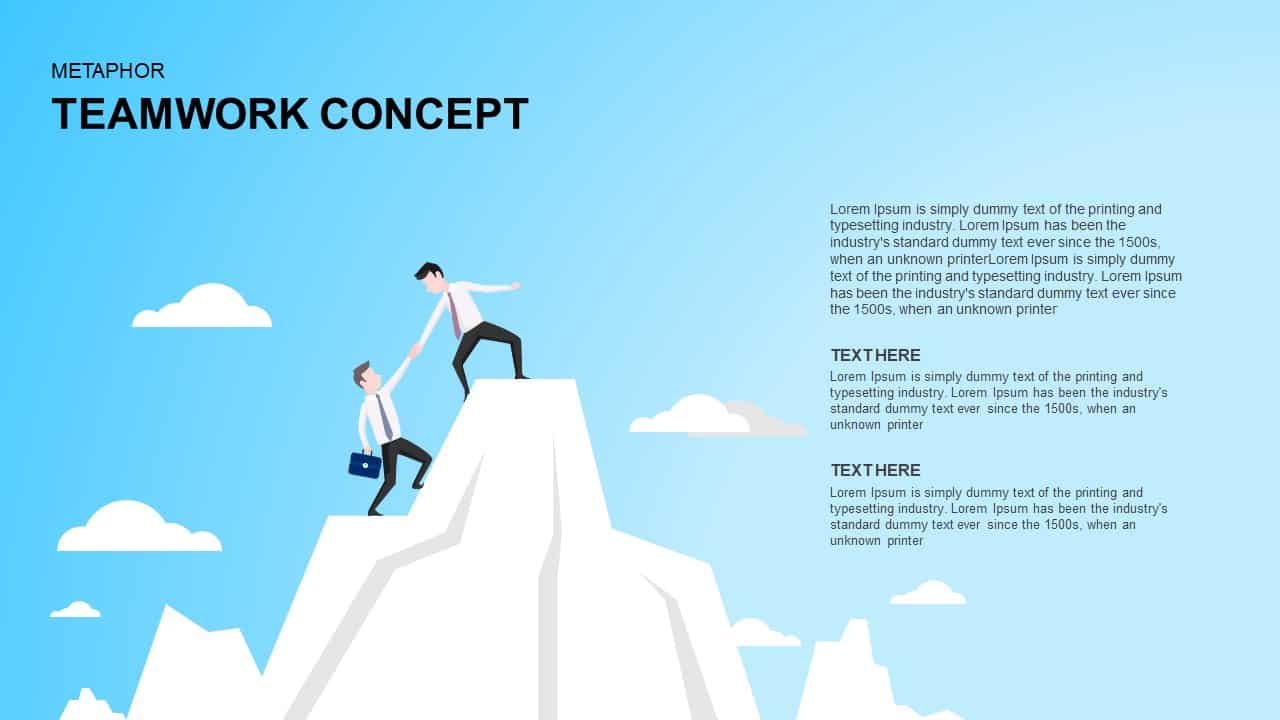
Teamwork Concept Metaphor Template for PowerPoint & Google Slides
Leadership
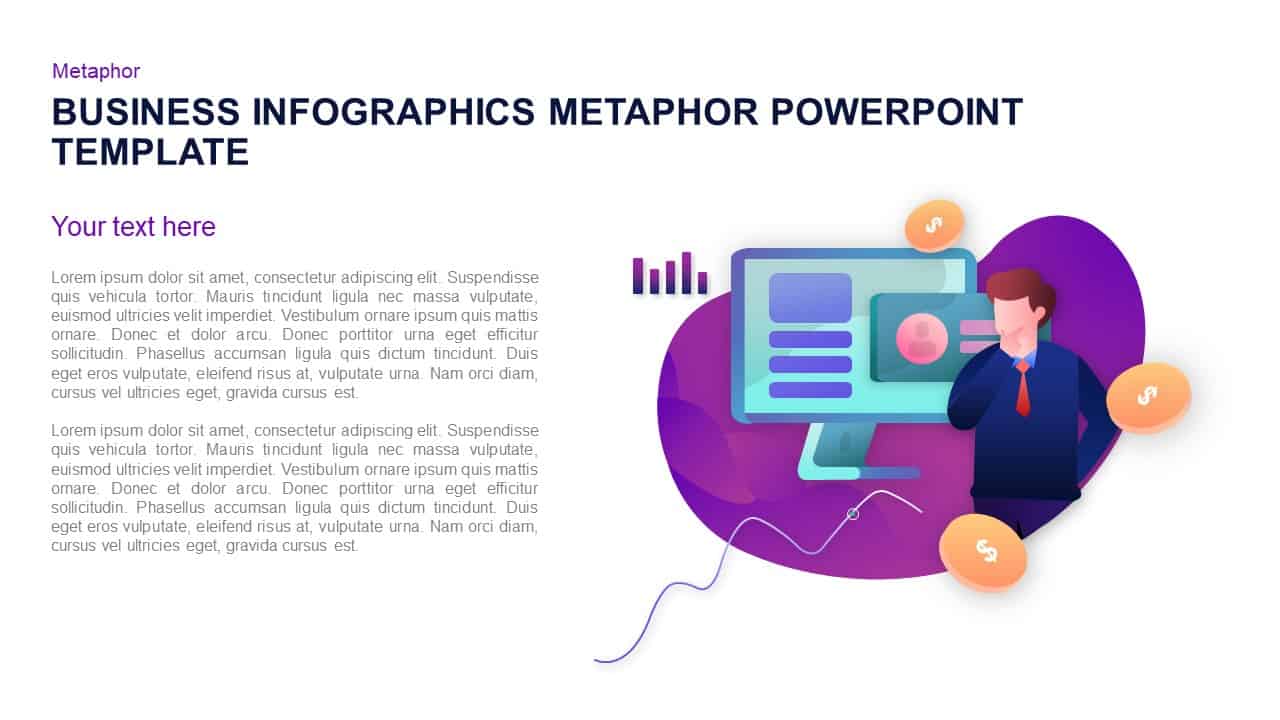
Business Growth Infographic Metaphor Template for PowerPoint & Google Slides
Revenue
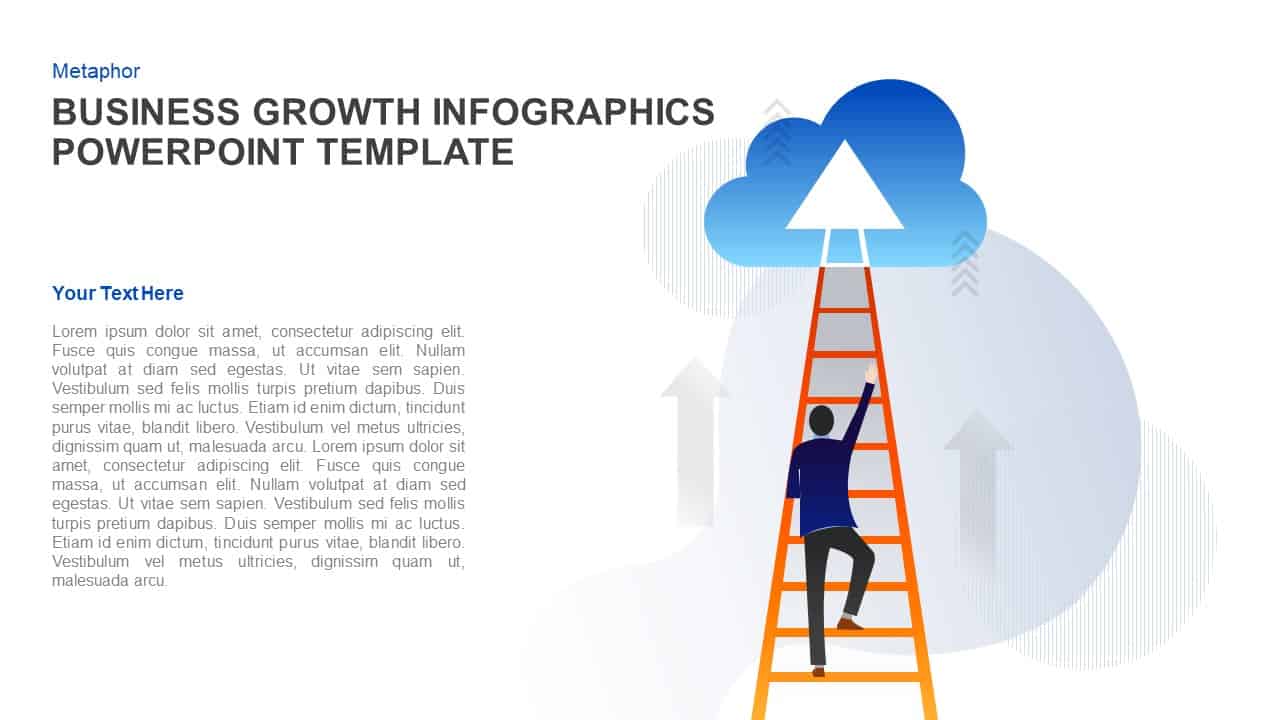
Business Growth Ladder to Cloud Metaphor Template for PowerPoint & Google Slides
Vision and Mission
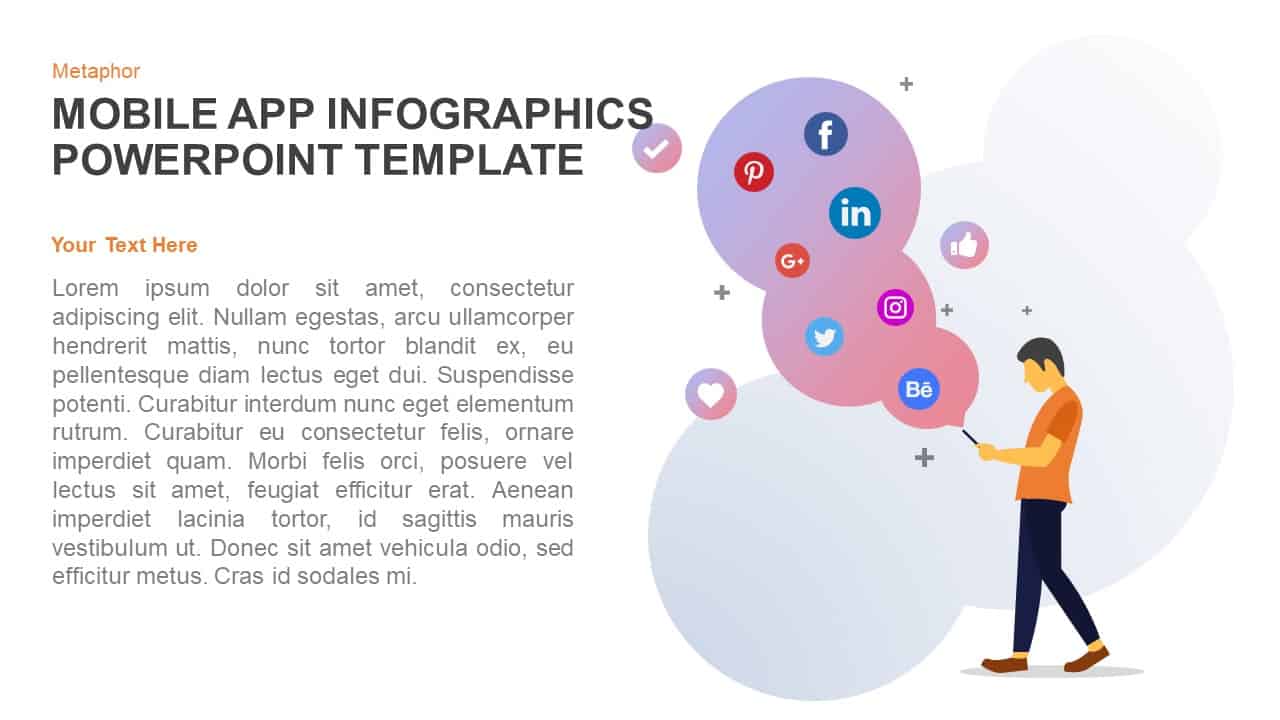
Mobile App Social Media Metaphor Template for PowerPoint & Google Slides
Infographics
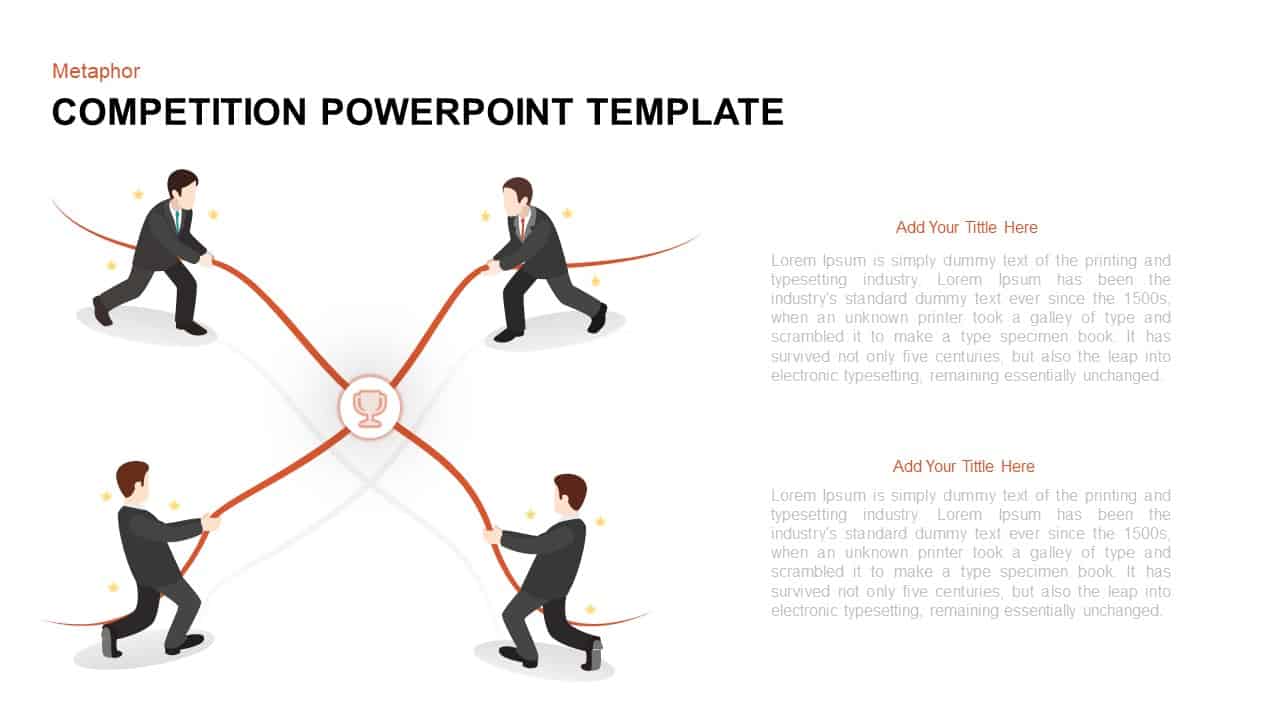
Competitive Tug-of-War Metaphor Template for PowerPoint & Google Slides
Business Strategy
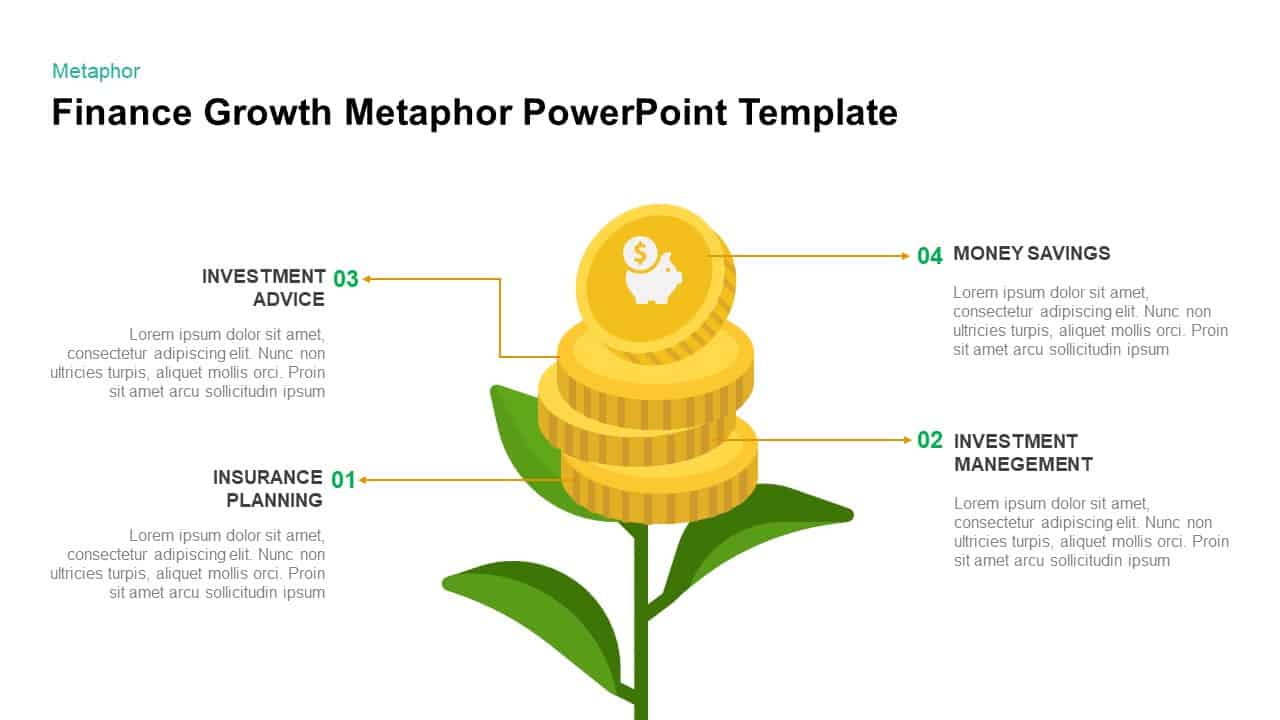
Finance Growth Plant Metaphor Slide Template for PowerPoint & Google Slides
Finance
Collaborative Teamwork Metaphor Illustration Template for PowerPoint & Google Slides
Leadership
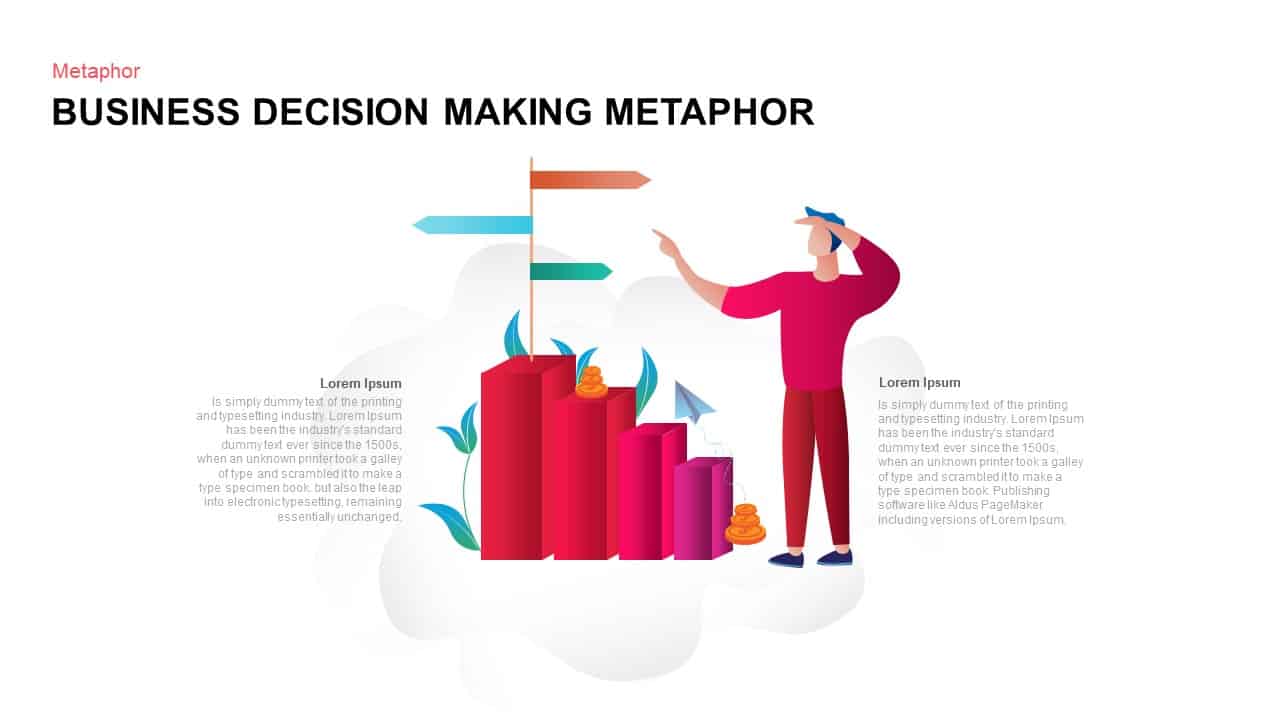
Business Decision Making Metaphor Template for PowerPoint & Google Slides
Arrow
Social Media Metaphor Illustration Template for PowerPoint & Google Slides
Digital Marketing
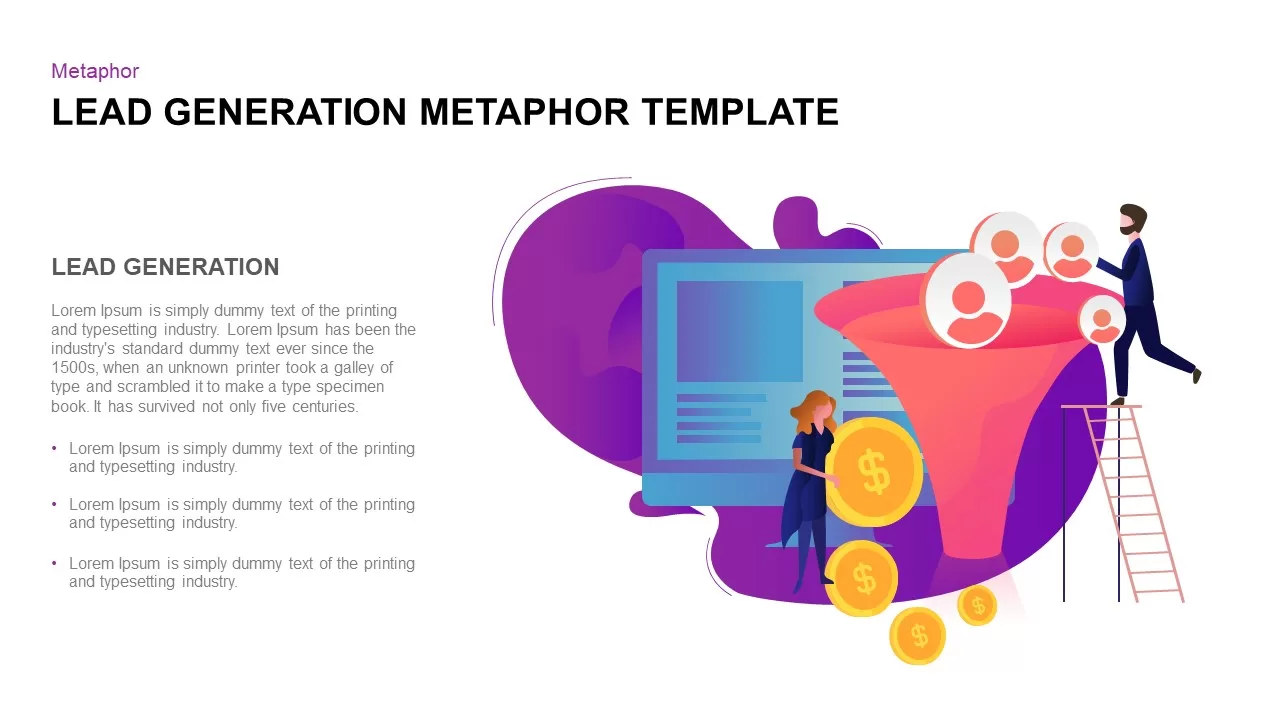
Lead Generation Funnel Metaphor Template for PowerPoint & Google Slides
Marketing Funnel
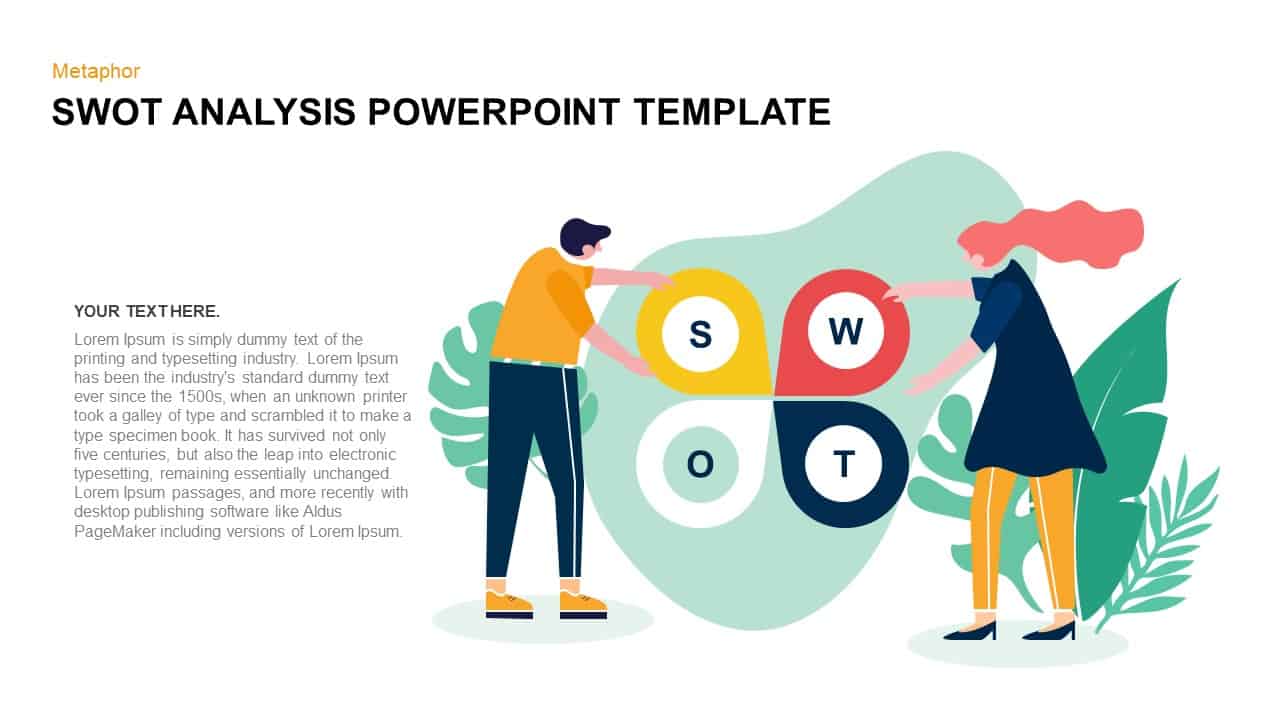
SWOT Analysis Metaphor Illustration Template for PowerPoint & Google Slides
SWOT
Vibrant Digital Marketing Metaphor Template for PowerPoint & Google Slides
Advertising
Collaborative Teamwork Metaphor Slide Template for PowerPoint & Google Slides
Our Team
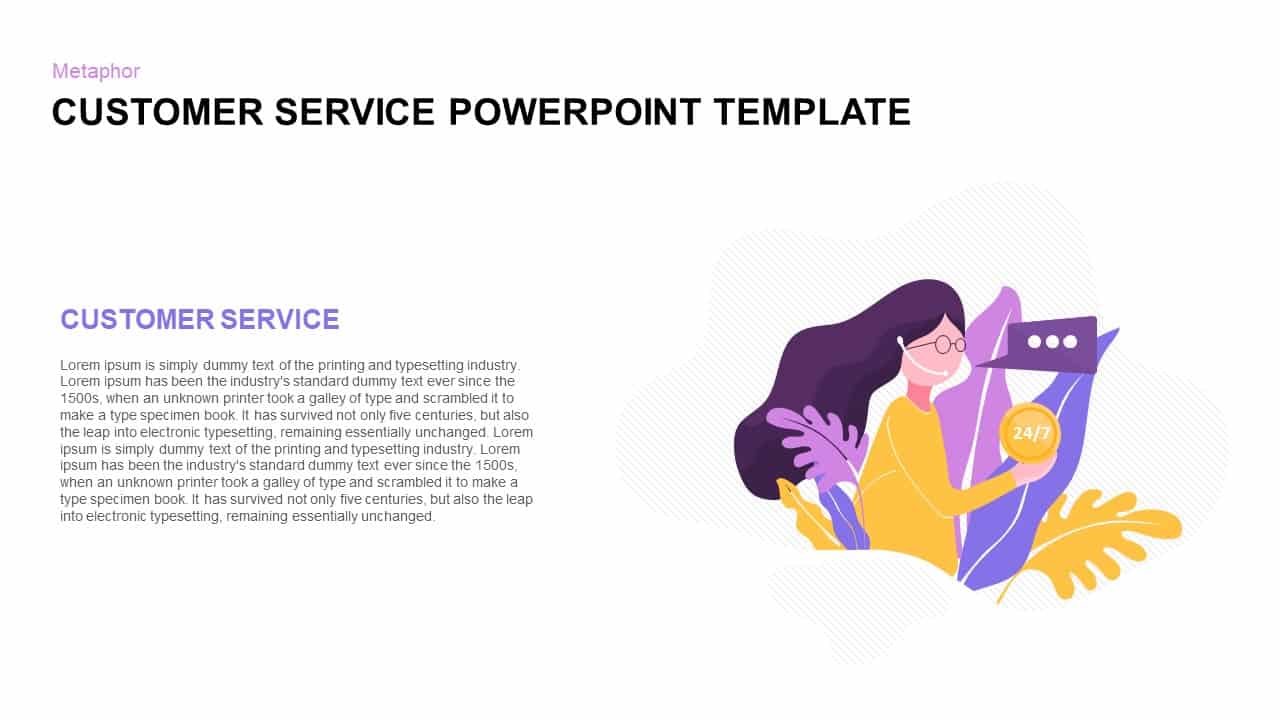
Customer Service Metaphor Infographic Template for PowerPoint & Google Slides
Customer Experience
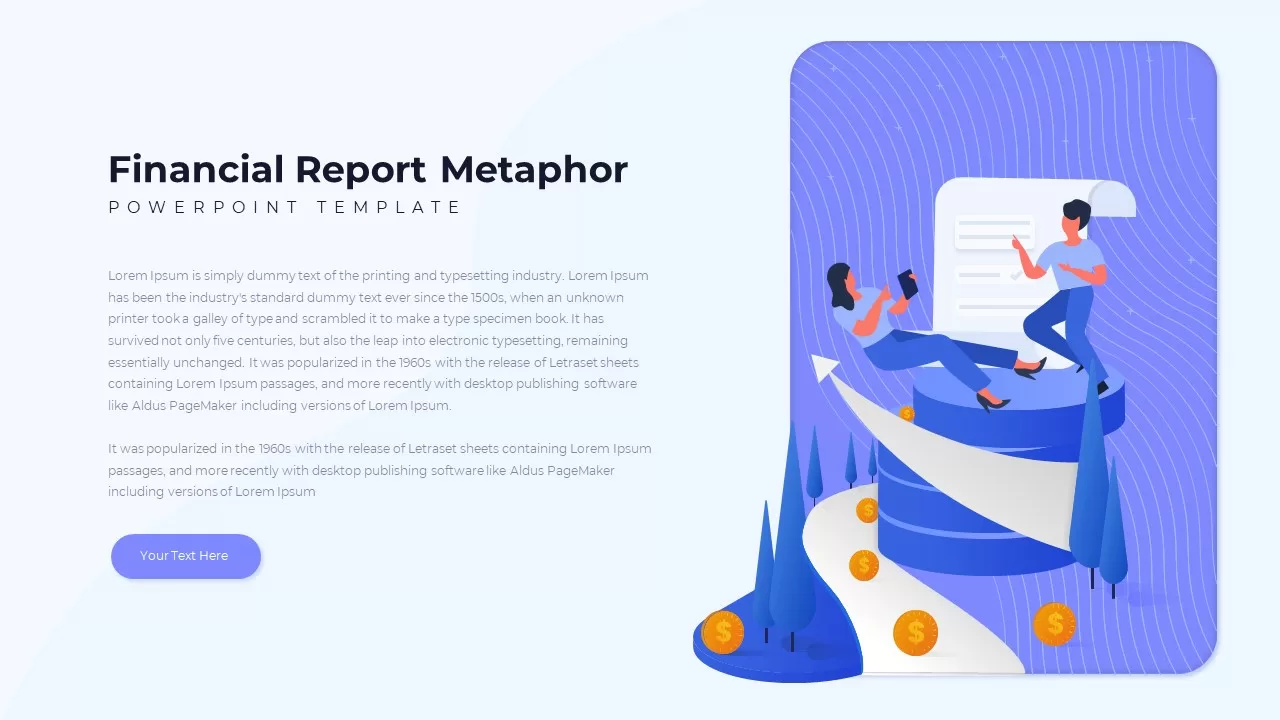
Financial Report Metaphor Illustration Template for PowerPoint & Google Slides
Finance
Business Growth Metaphor Chart Template for PowerPoint & Google Slides
Business
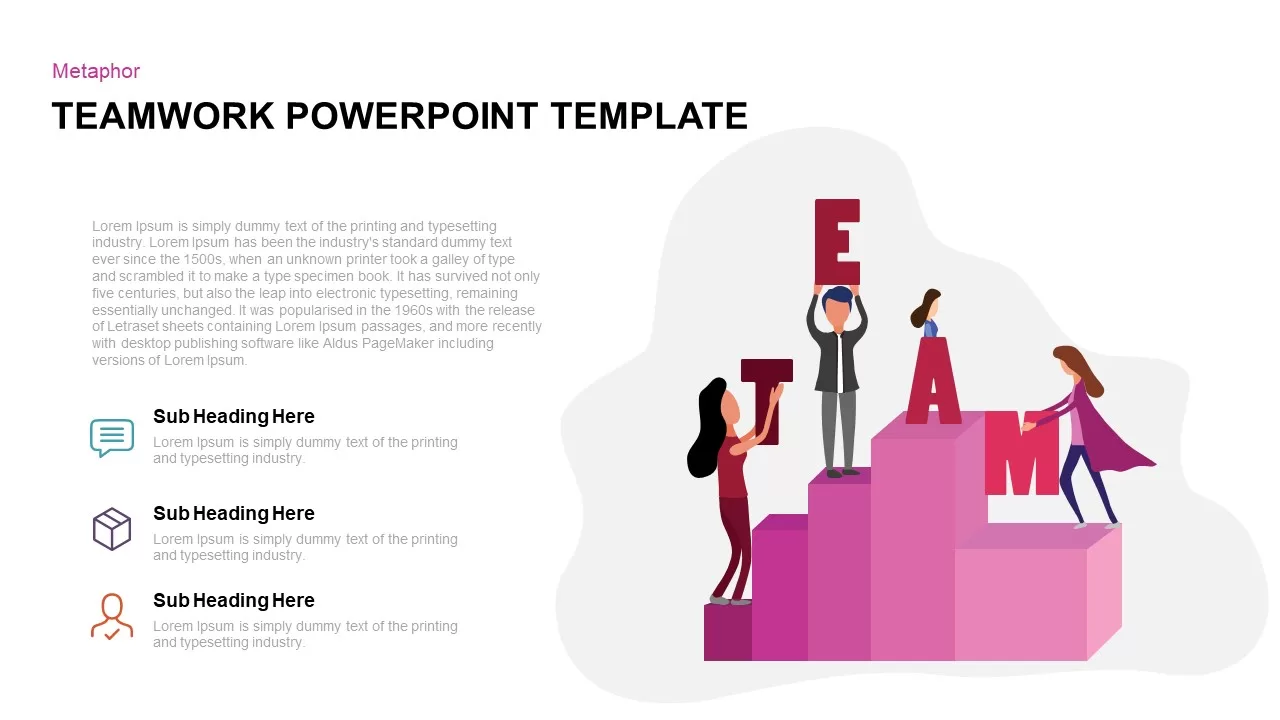
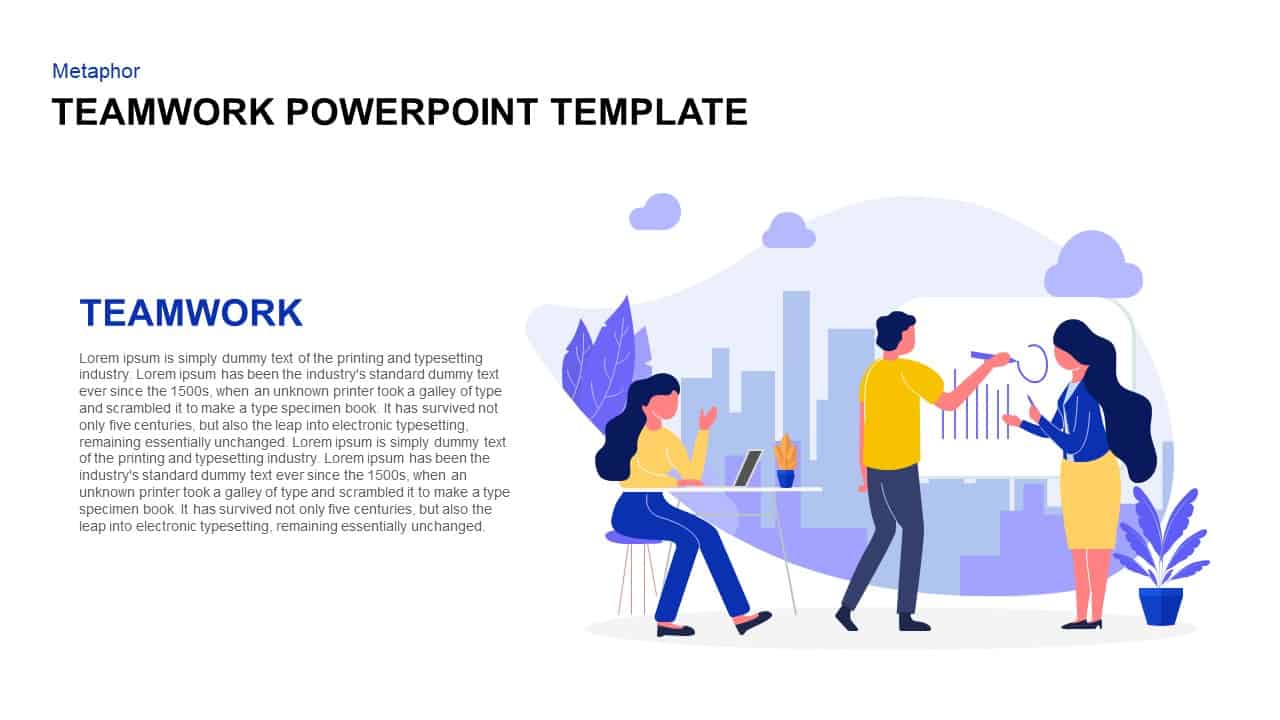
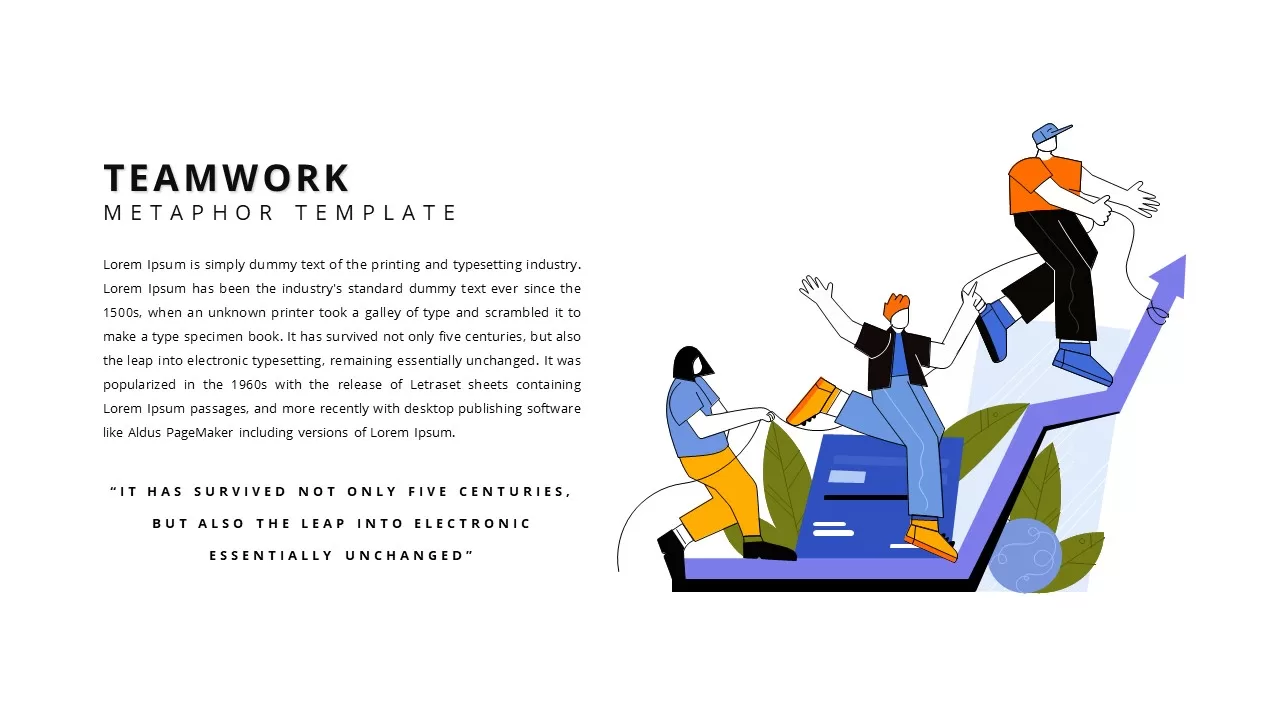
Teamwork Metaphor Illustration Template for PowerPoint & Google Slides
Leadership
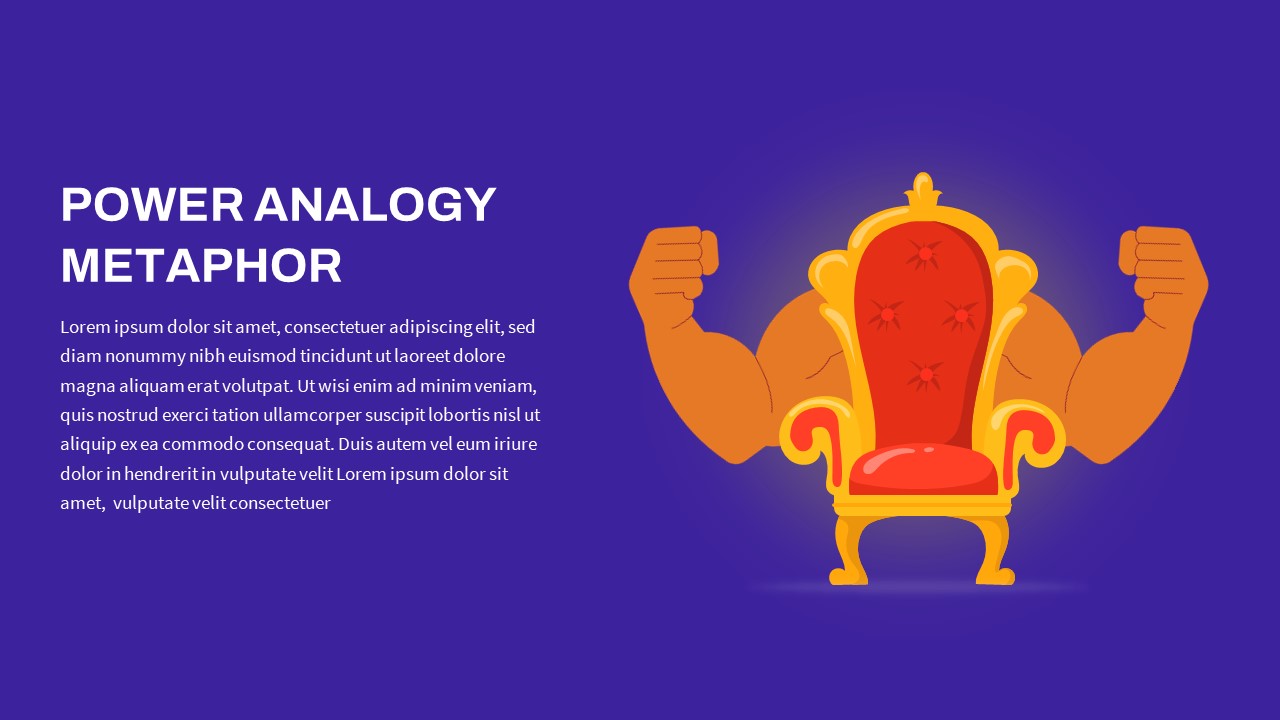
Creative Power Analogy Metaphor Slide Template for PowerPoint & Google Slides
Leadership
Powerful Visual Metaphor Analogy Slide Template for PowerPoint & Google Slides
Opportunities Challenges
Relay Race Metaphor for PowerPoint & Google Slides
Accomplishment
Animated Spinning Plates Metaphor Slide for PowerPoint & Google Slides
Infographics
Metaphor Partnership PowerPoint Template and Keynote Template
Opportunities Challenges