Pie and Donut Chart Templates for PowerPoint and Google Slides
![]() Filter
Filter
Filter
-

Agriculture Infographics Slide with Progress Rings & Metrics Template for PowerPoint & Google Slides
Pie/Donut
-

Circular Image Gallery & KPI Metrics Template for PowerPoint & Google Slides
Pie/Donut
-

Cost Reduction Strategy Donut Chart Template for PowerPoint & Google Slides
Pie/Donut
-
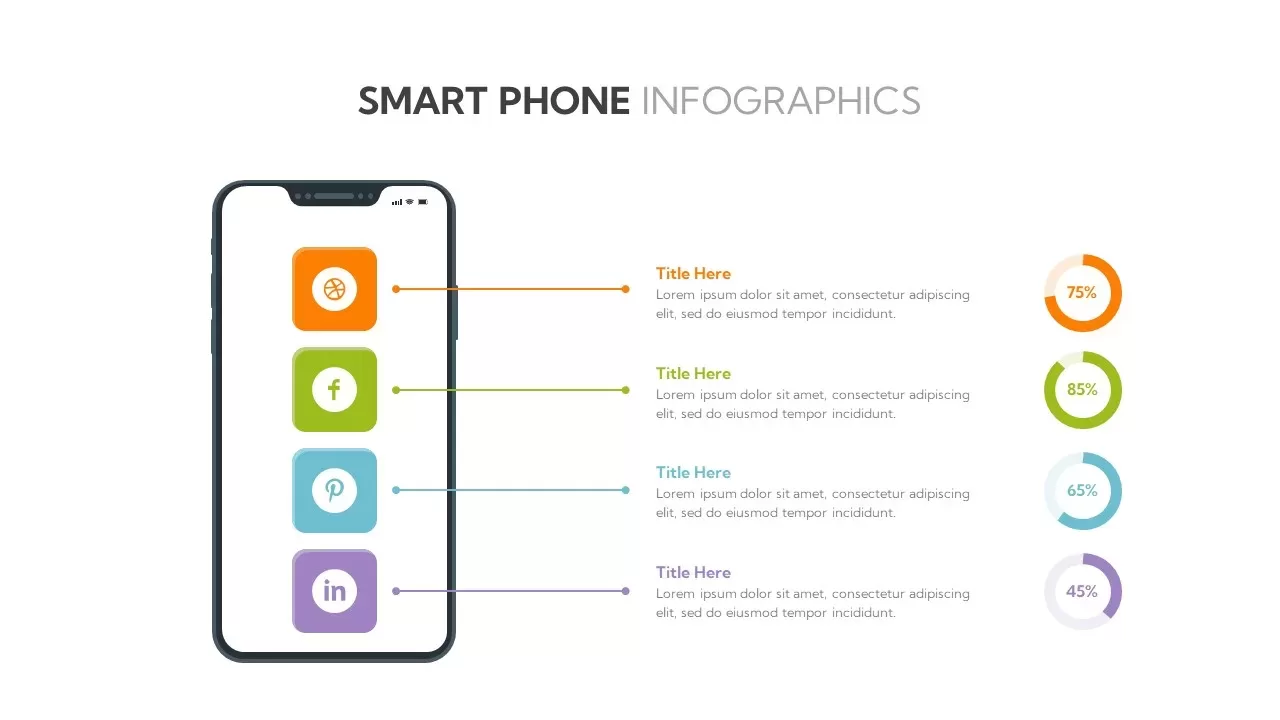
Social Media Smartphone Infographic Template for PowerPoint & Google Slides
Pie/Donut
-

Interactive Benchmarking Gauge Dashboard Template for PowerPoint & Google Slides
Pie/Donut
-

Benchmarking Metrics Comparison Slide Template for PowerPoint & Google Slides
Pie/Donut
-

KPI Dashboard Data Overview Slide Template for PowerPoint & Google Slides
Bar/Column
-

Car Sales Market Share Pie Chart Template for PowerPoint & Google Slides
BCG
-

Success Key Diagram with Donut Chart Template for PowerPoint & Google Slides
Pie/Donut
-
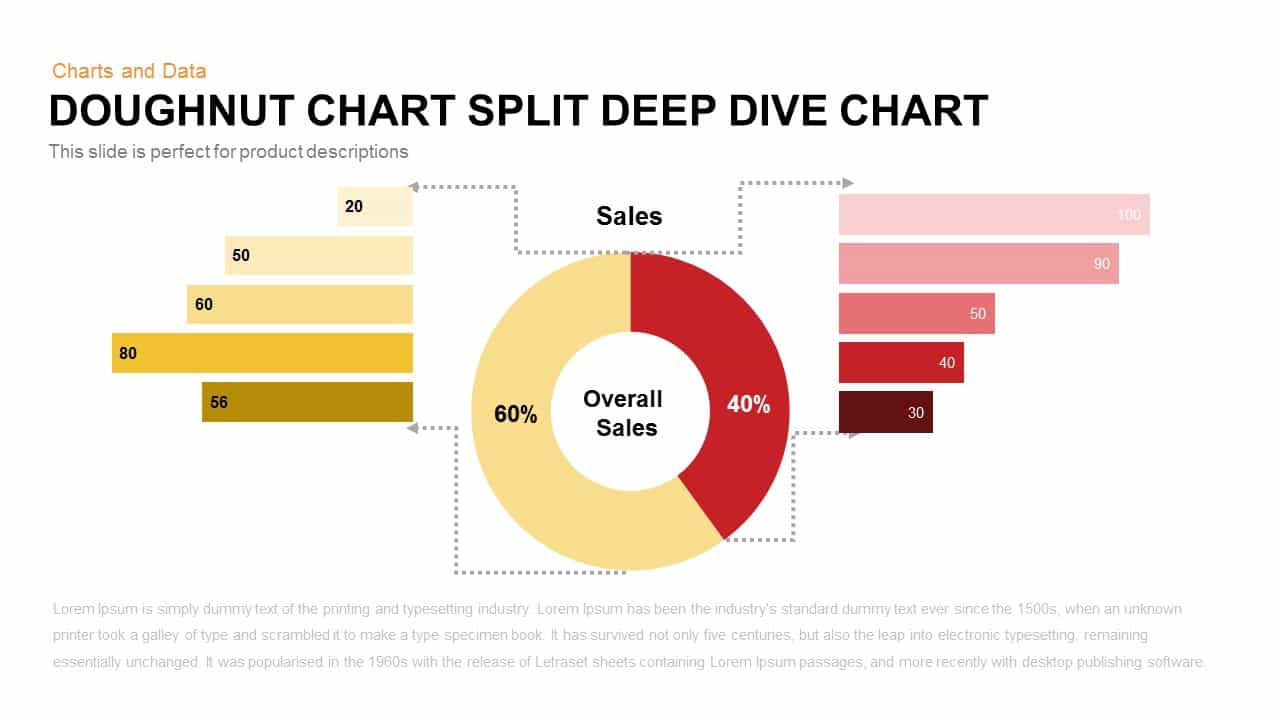
Split Doughnut Deep Dive Sales Analysis Template for PowerPoint & Google Slides
Pie/Donut
-

Donut Chart Split Template for PowerPoint & Google Slides
Charts
-
Circle Segment Sales Metrics Infographic Template for PowerPoint & Google Slides
Circular
-
Donut Chart template for PowerPoint & Google Slides
Pie/Donut
-
Donut Chart template for PowerPoint & Google Slides
Pie/Donut
-
Donut Split Analysis template for PowerPoint & Google Slides
Pie/Donut
-
Circle Chart Data template for PowerPoint & Google Slides
Pie/Donut
-
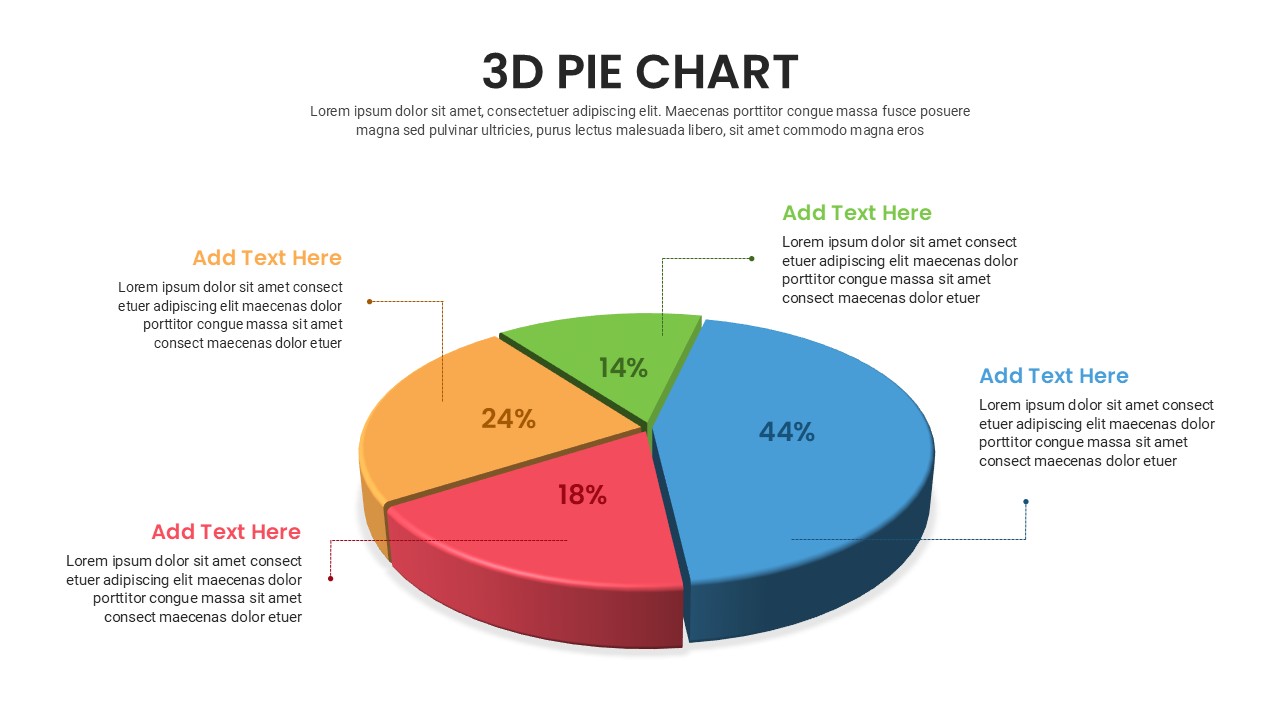
Free 3D Pie Chart template for PowerPoint & Google Slides
Pie/Donut
Free