Mobile/Tablet App Report template for PowerPoint & Google Slides
Description
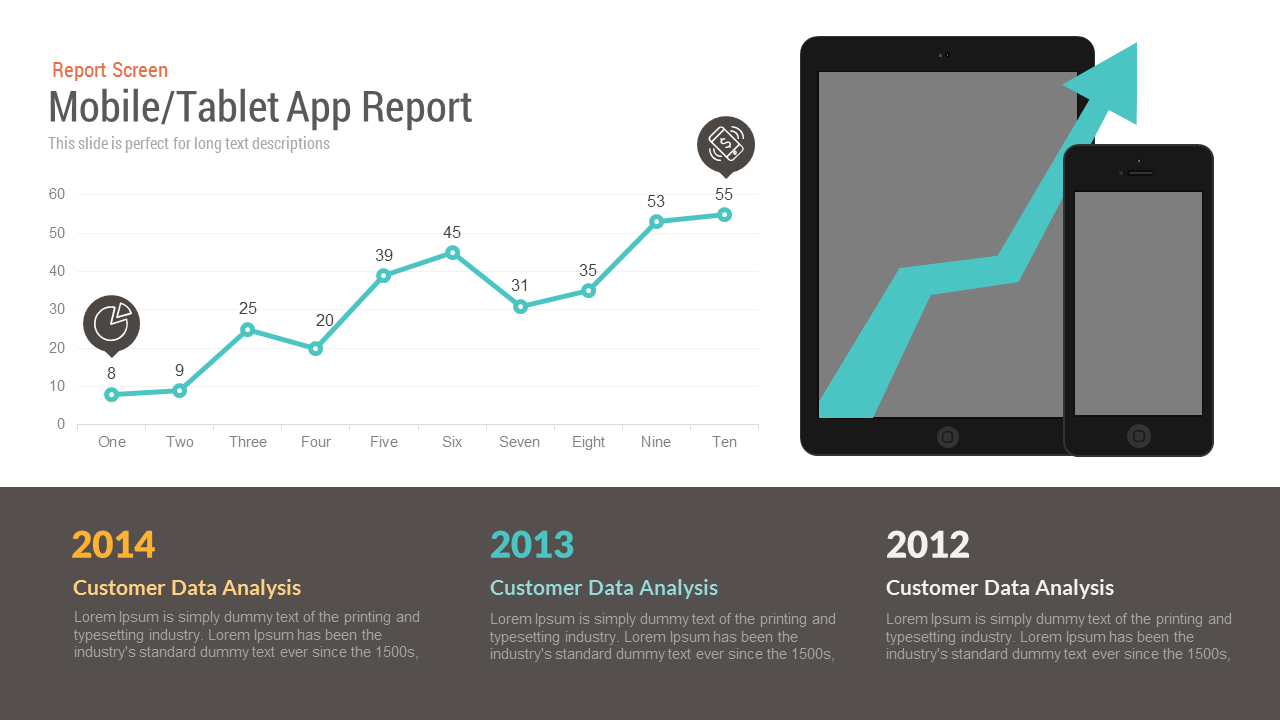
Mobile/tablet app report free PowerPoint template and keynote is an infographic template for modern and fastest growing technology. It a single PowerPoint template shows growth line charts and tablet images. You can use this free PowerPoint template to display app acceptability and its growing pace. This is a vintage model presentation using a black and white color combination with few color variances. The best PowerPoint for mockup presentation has editable features that allow customization on the objects. The template is ideal for illustrating smart and cloud computing concepts and the advantages and disadvantages of computer technology because this template can cover every aspect of information technology visually. These may involve data mining, machine learning, data management, big data analytics, and mobile phone networks. Download the free Google Slide themes & ppt template version of this template.
Mobile/Tablet PowerPoint and Google Slide template can be used in your presentation to show your report of your mobile and tablet application. The template is having tablet and mobile data in from if a line chart so that you can present your mobile/tablet application reports.
Who is it for
This slide is perfect for app developers, marketing teams, data analysts, and business leaders who need to present mobile or tablet app usage data and growth trends. It’s also great for product managers, customer engagement teams, or consultants focusing on app performance over time.
Beyond app usage reports, this slide is adaptable for sales monitoring, project monitoring, and performance evaluations. It’s well-suited for demonstrating growth trajectories, contrasting yearly figures, or showcasing key performance indicators (KPIs) over various timeframes. Its flexibility makes it a good fit for presentations covering software, digital marketing efforts, or any business undertaking that involves tracking data trends.
Login to download this file

Item ID
SBF00008
Related Templates

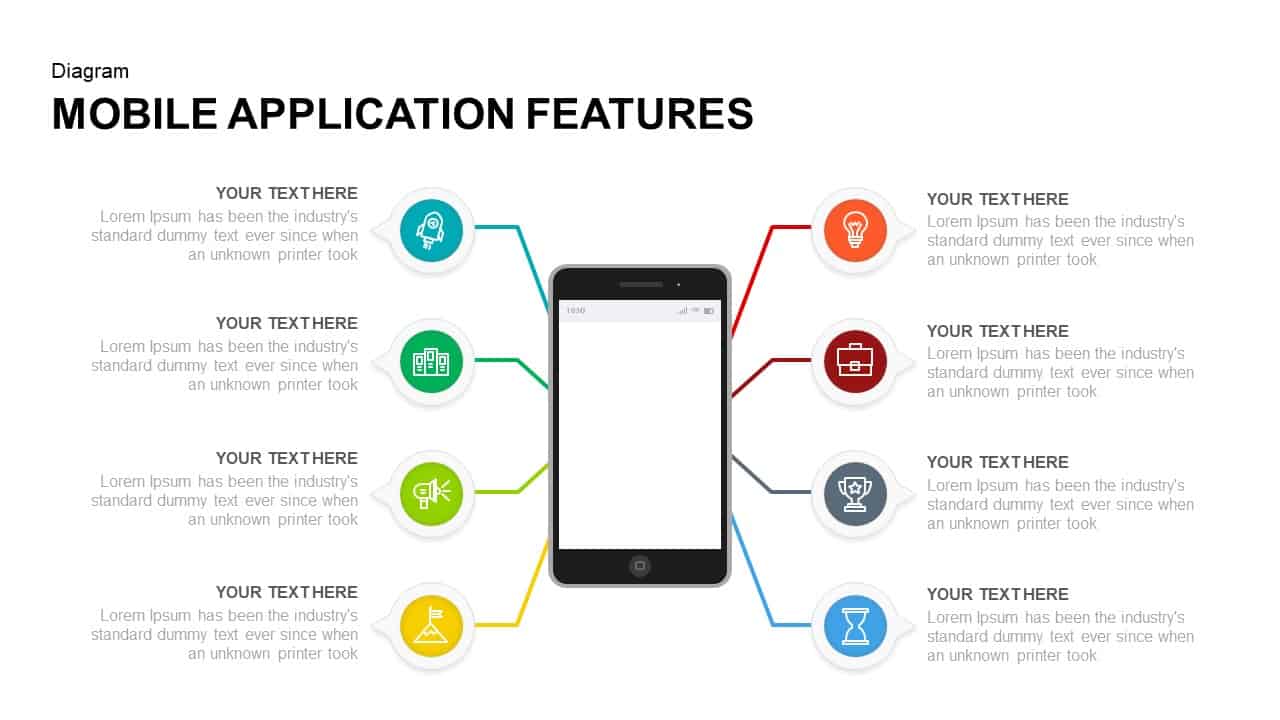
Mobile App Features template for PowerPoint & Google Slides
Technology
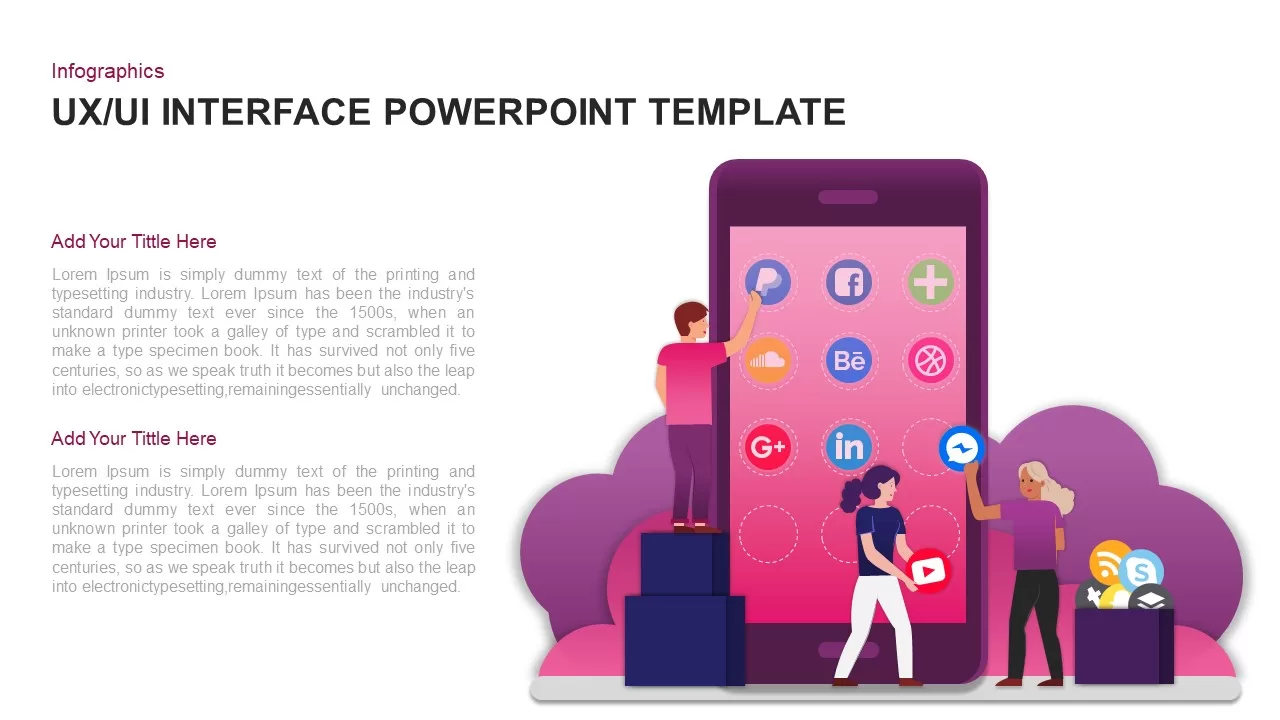
UX UI Mobile App Interface Infographic Template for PowerPoint & Google Slides
Software Development
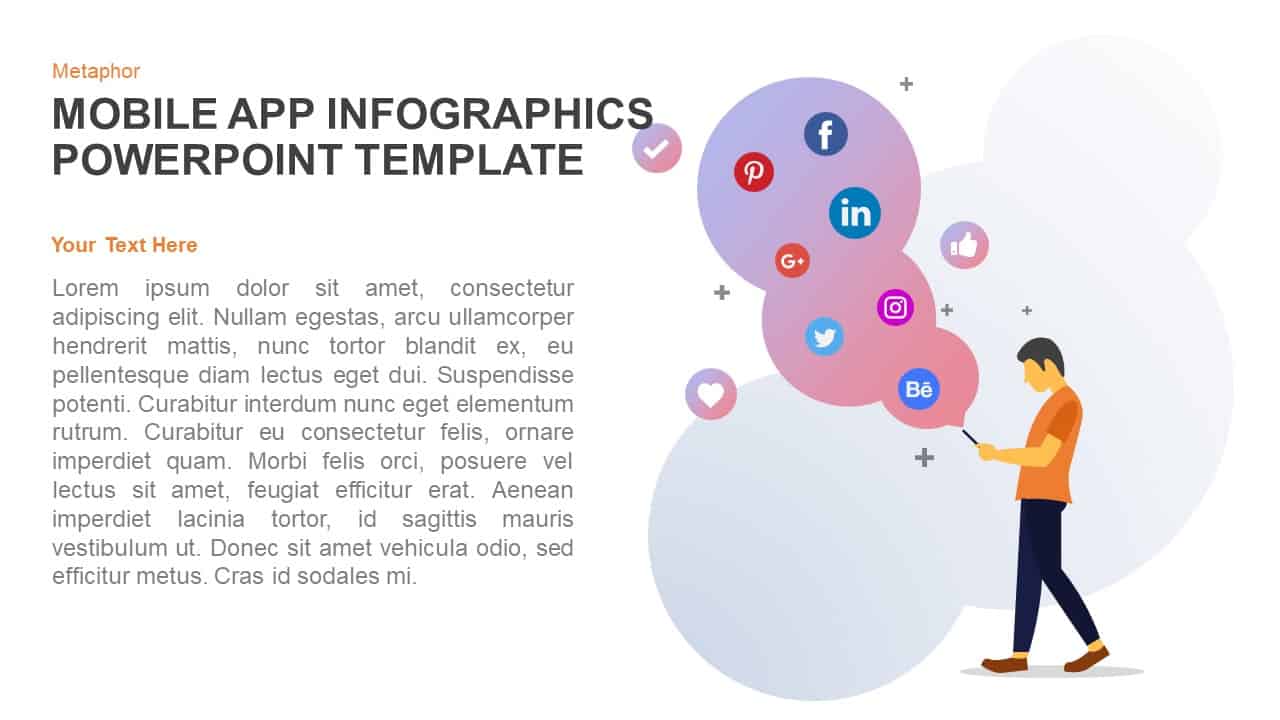
Mobile App Social Media Metaphor Template for PowerPoint & Google Slides
Infographics
Professional Mobile App Showcase Deck Template for PowerPoint & Google Slides
Pitch Deck
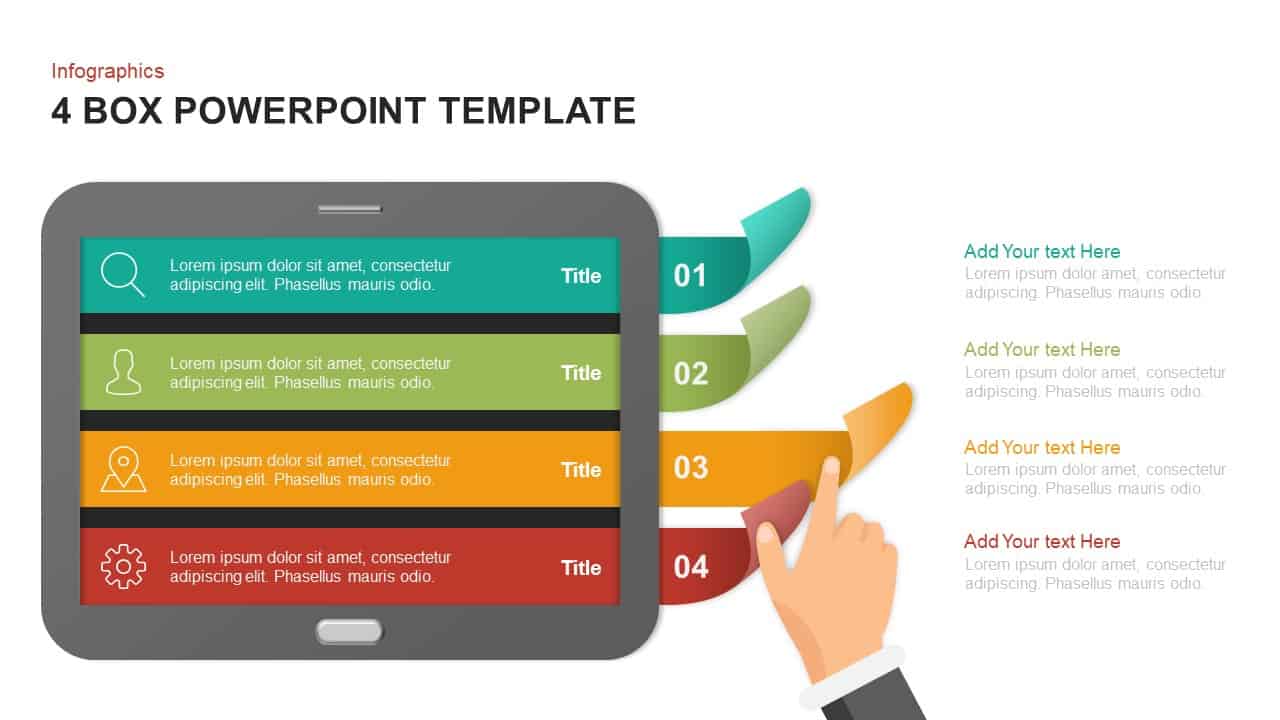
Tablet Four-Section Menu Interface Template for PowerPoint & Google Slides
Agenda
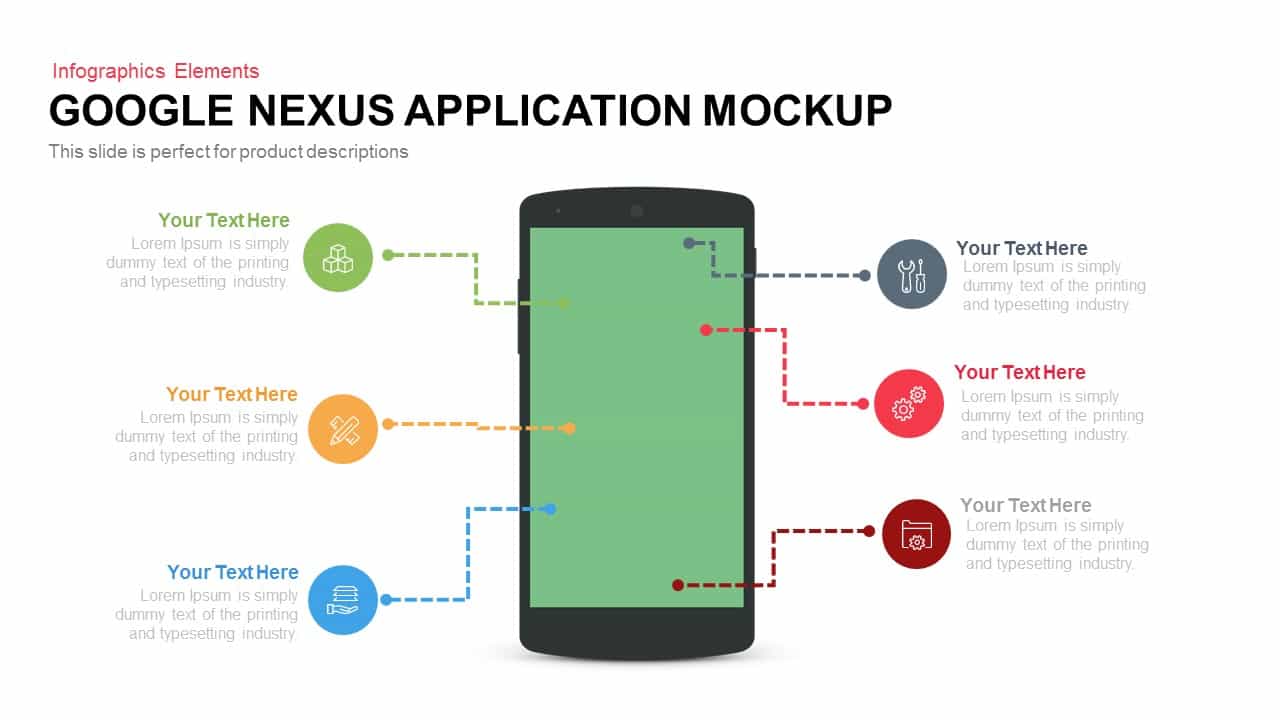
Google Nexus App Mockup Template for PowerPoint & Google Slides
Infographics
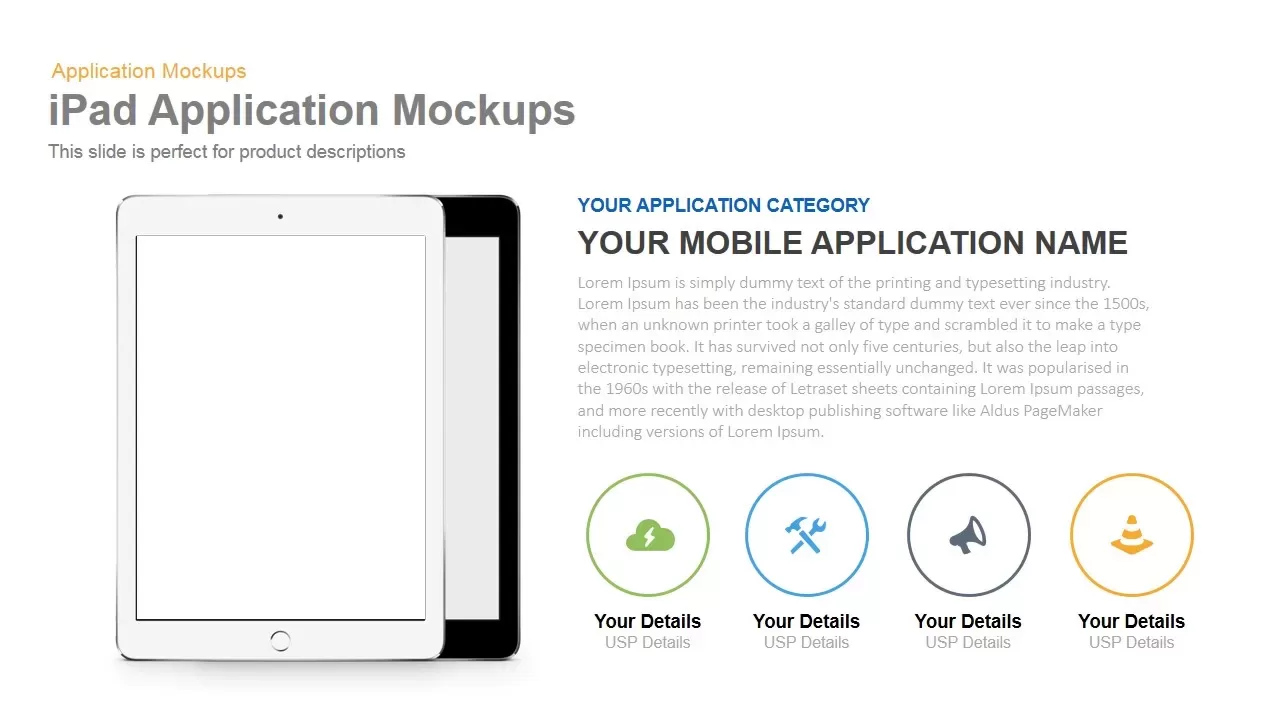
iPad App Mockup with Progress Metrics Template for PowerPoint & Google Slides
Bar/Column
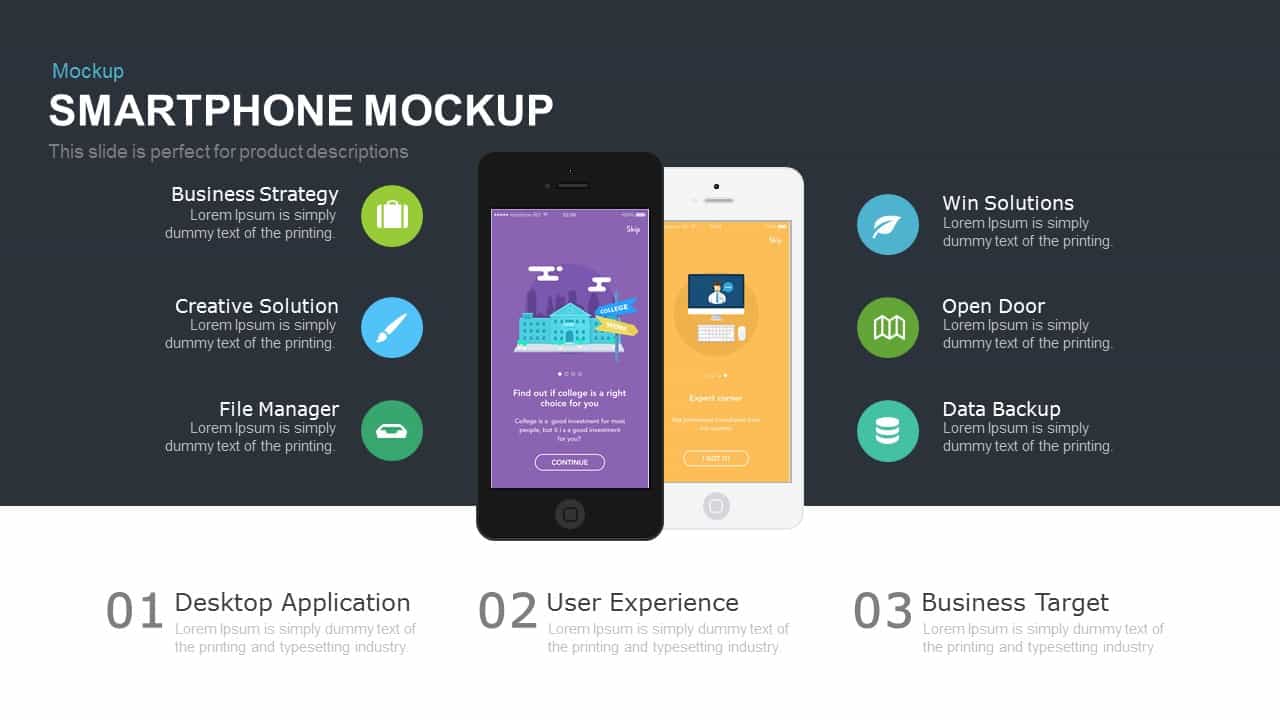
Smartphone App Mockup for Business Template for PowerPoint & Google Slides
Software Development
Smartphone App Features Mockup Template for PowerPoint & Google Slides
Software Development
School Communication App Deck Template for PowerPoint & Google Slides
Pitch Deck
Free App Development Company Profile template for PowerPoint & Google Slides
Company Profile
Free

Smartphone App Pitch Deck Presentation Template for PowerPoint & Google Slides
Pitch Deck
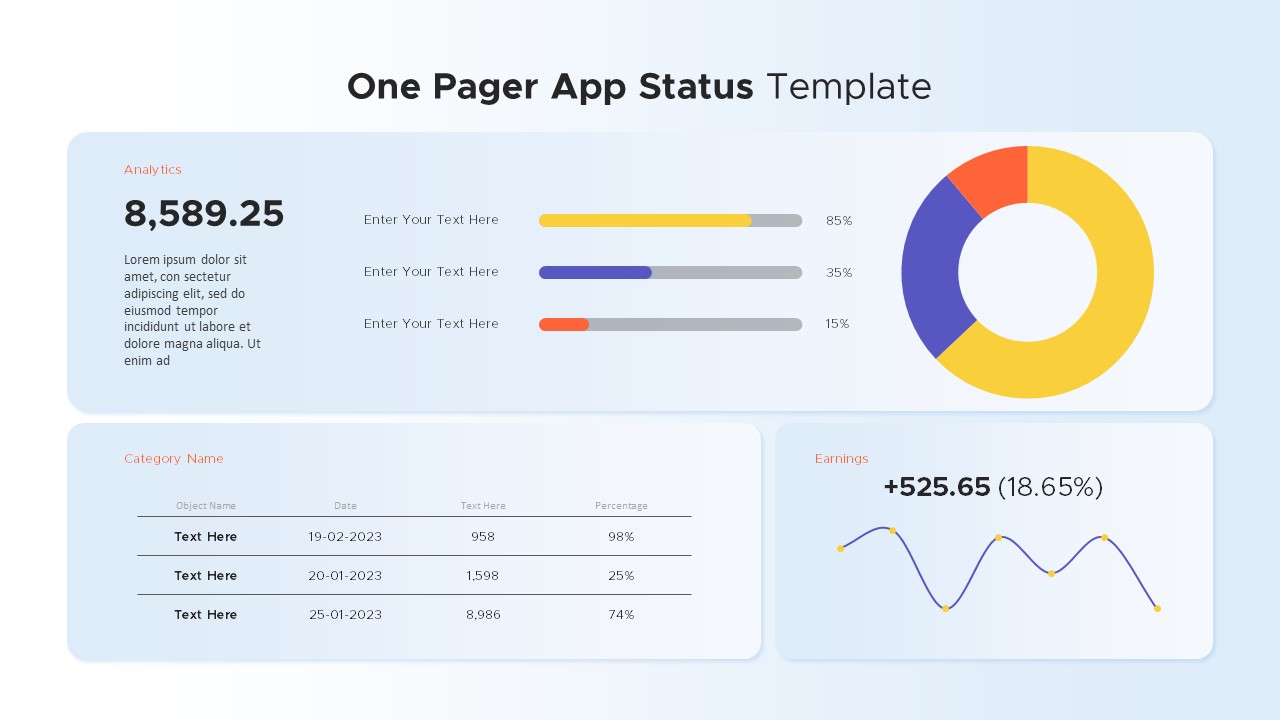
One Pager App Status template for PowerPoint & Google Slides
Business Report
Mobile Data Analysis Chart template for PowerPoint & Google Slides
Charts
Mobile Usage Metrics template for PowerPoint & Google Slides
Comparison Chart

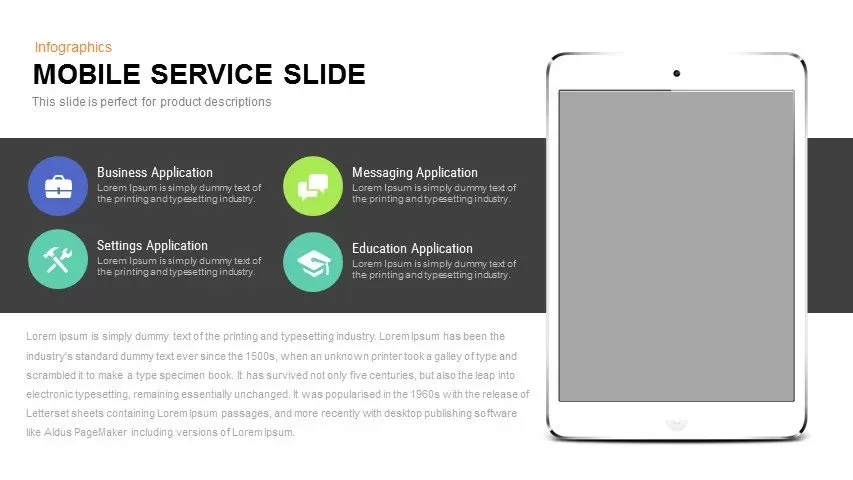
Clean Mobile Service Comparison Slide Template for PowerPoint & Google Slides
Comparison
Mobile Service Features Infographic Template for PowerPoint & Google Slides
Process
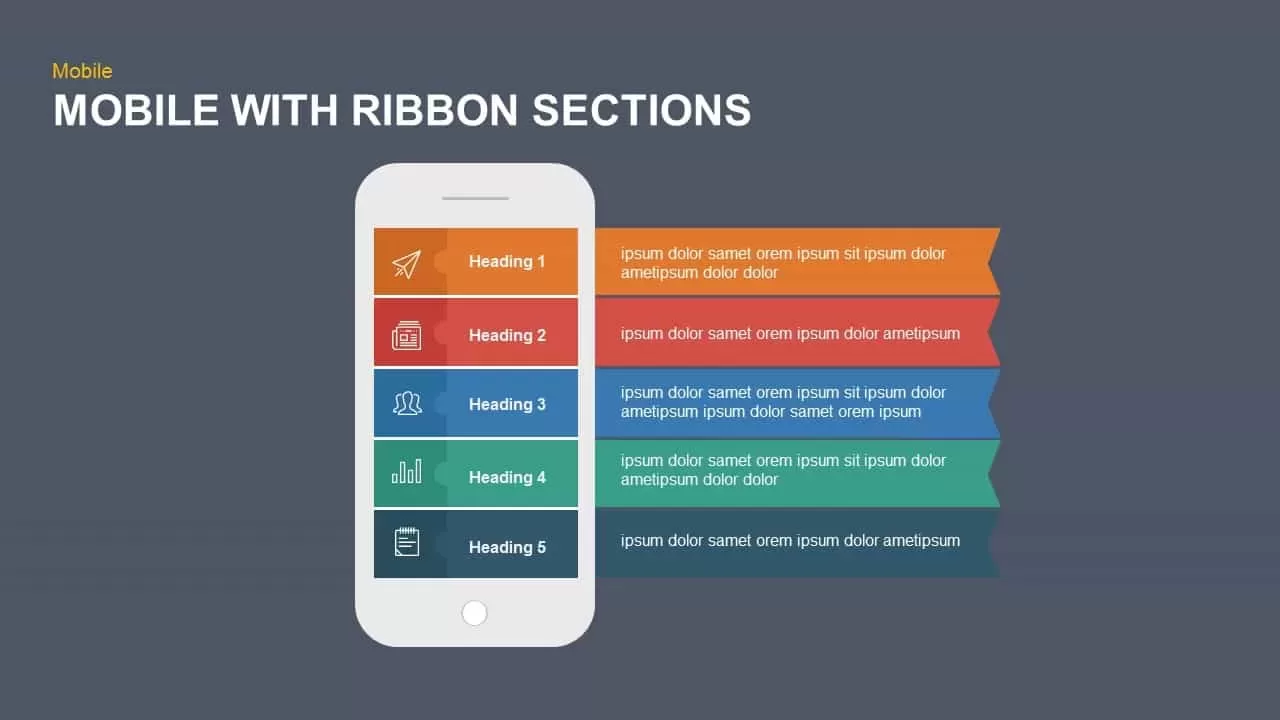
Mobile Ribbon Sections Diagram Template for PowerPoint & Google Slides
Process
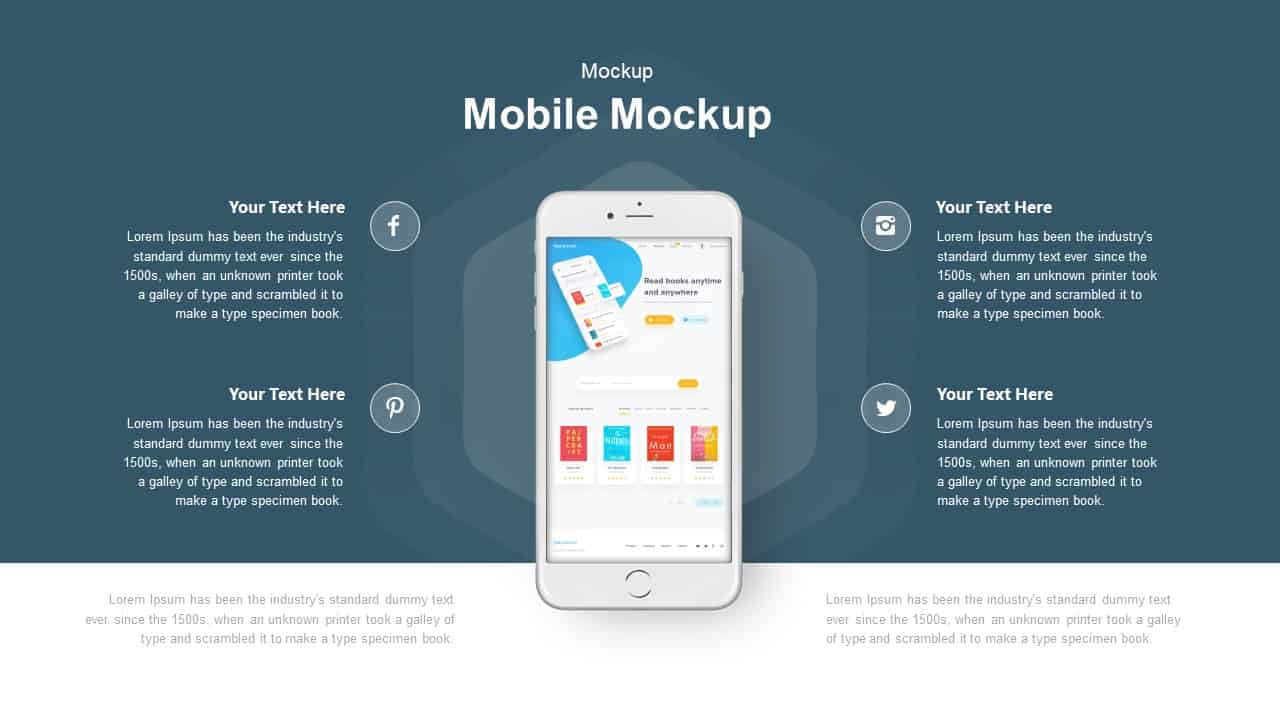
Mobile Mockup with Social Callouts Template for PowerPoint & Google Slides
Software Development
Mobile Infographics Data Visualization Template for PowerPoint & Google Slides
Infographics
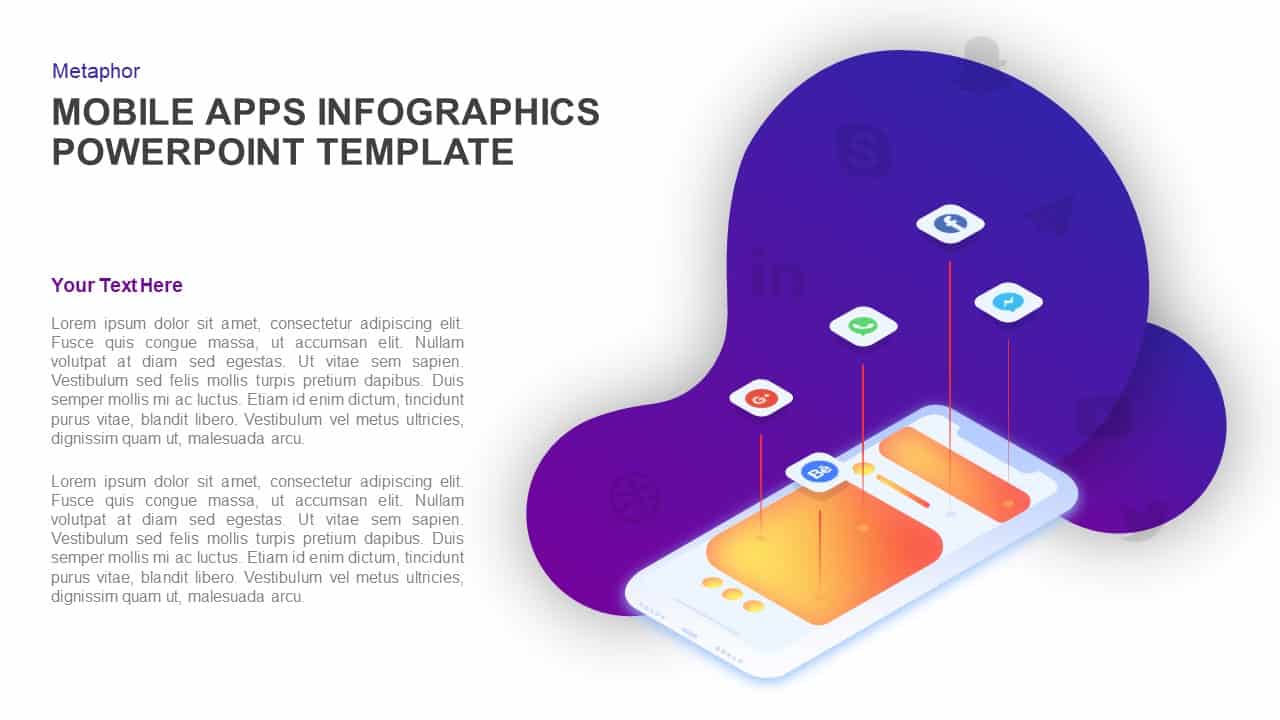
Mobile Apps Infographic Interface Template for PowerPoint & Google Slides
Software Development
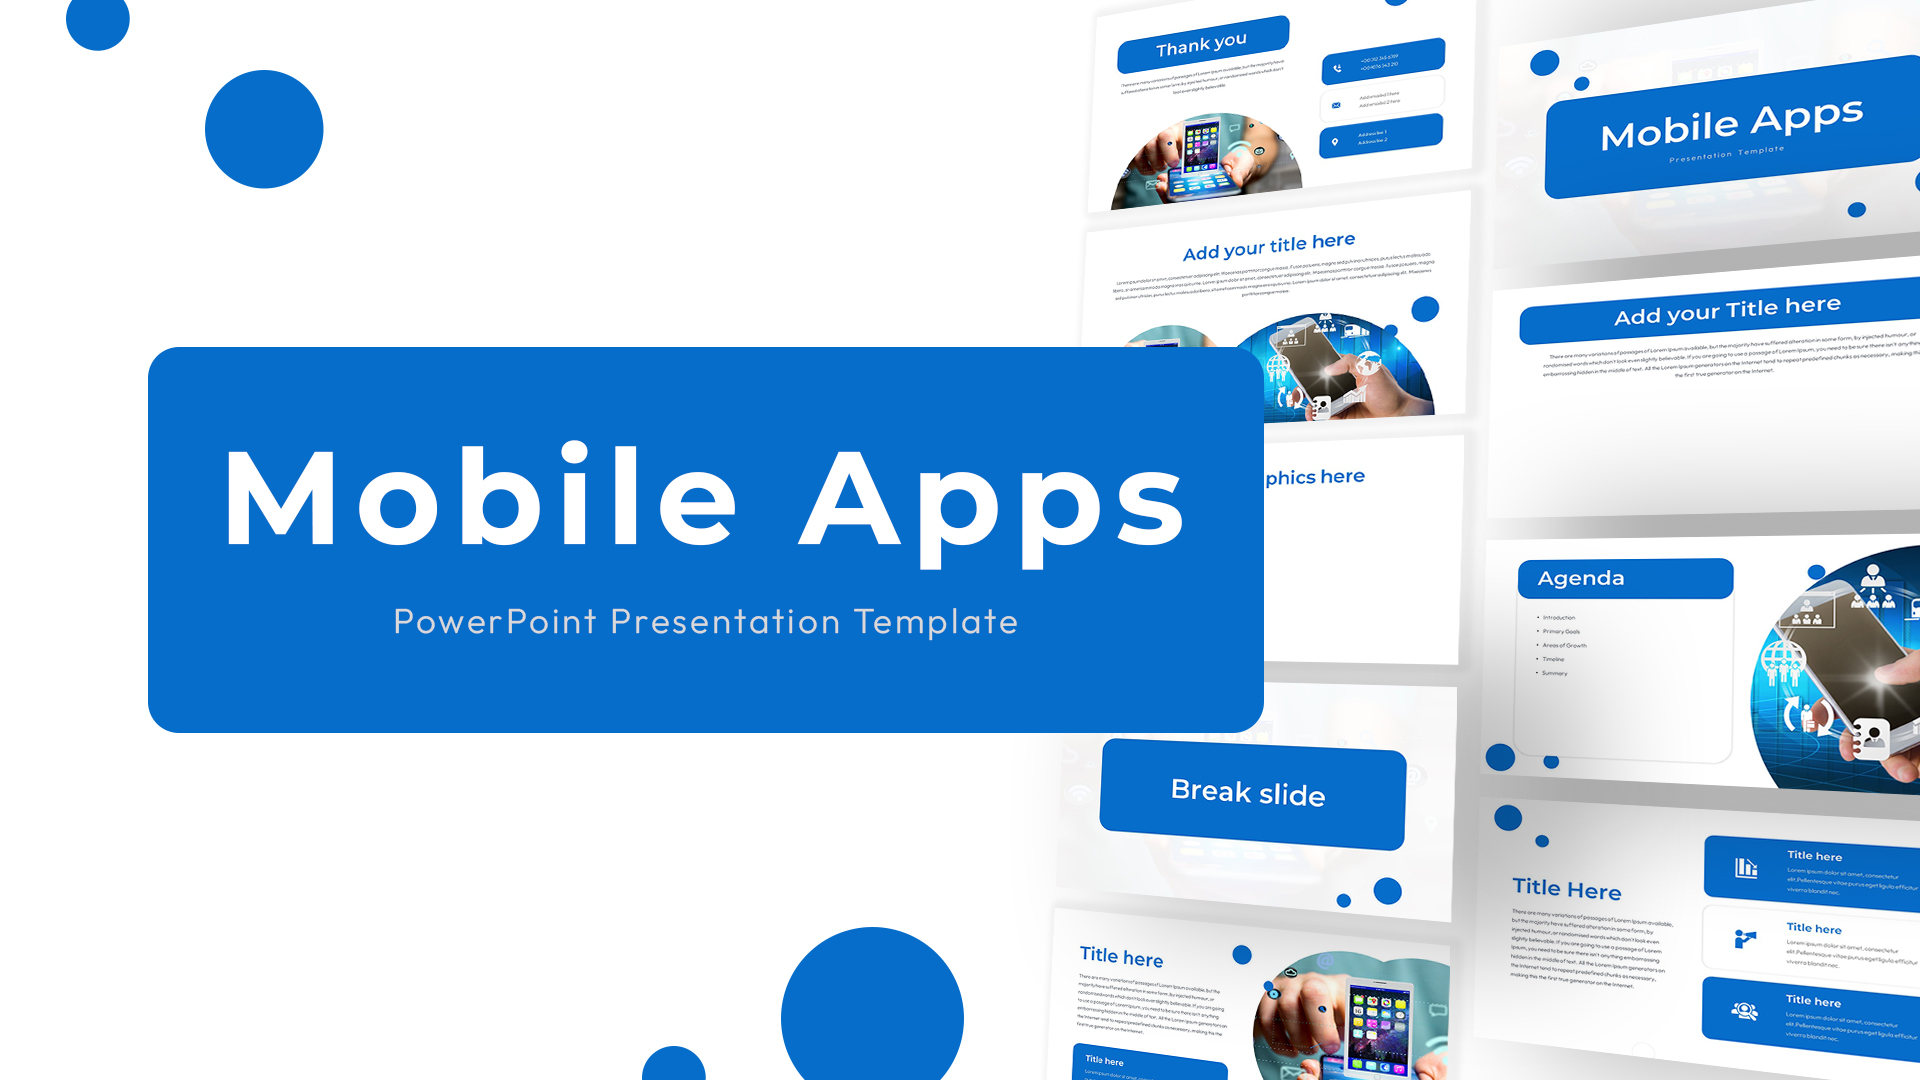
Blue Circle Mobile Apps Presentation Template for PowerPoint & Google Slides
Information Technology
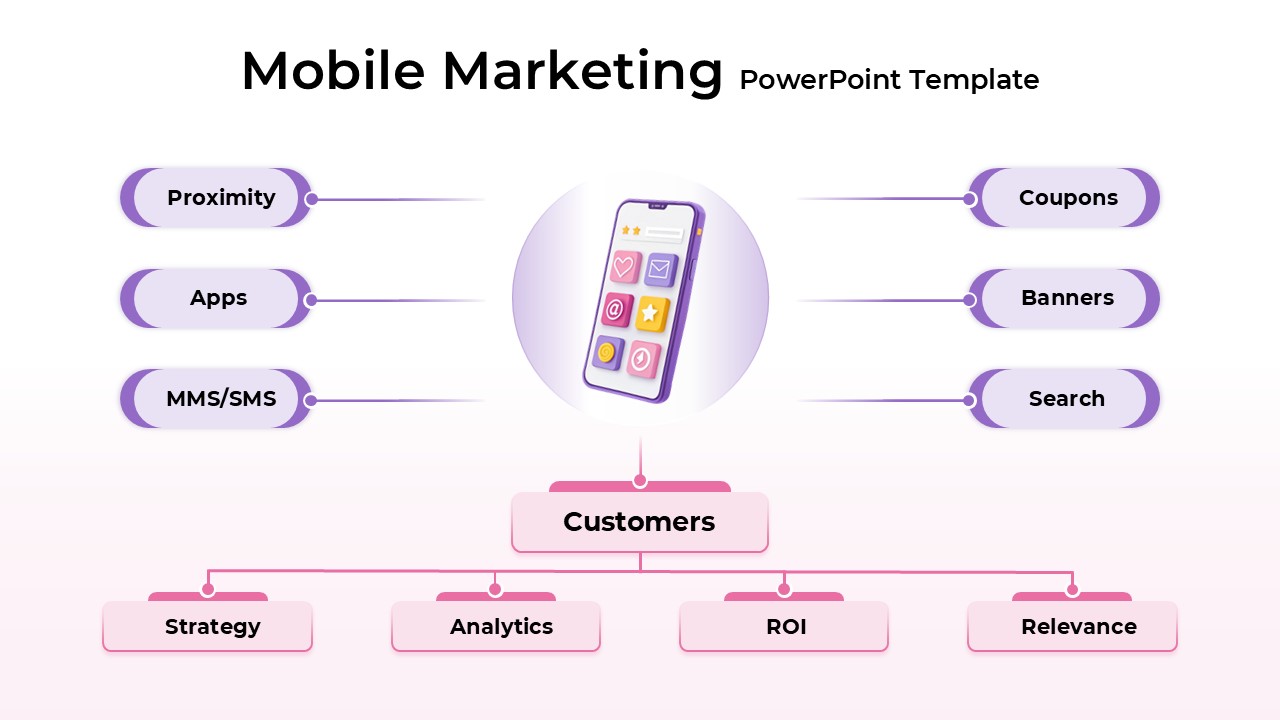
Mobile Marketing Strategy template for PowerPoint & Google Slides
Business
Mobile User Data Analysis Infographic for PowerPoint & Google Slides
Process
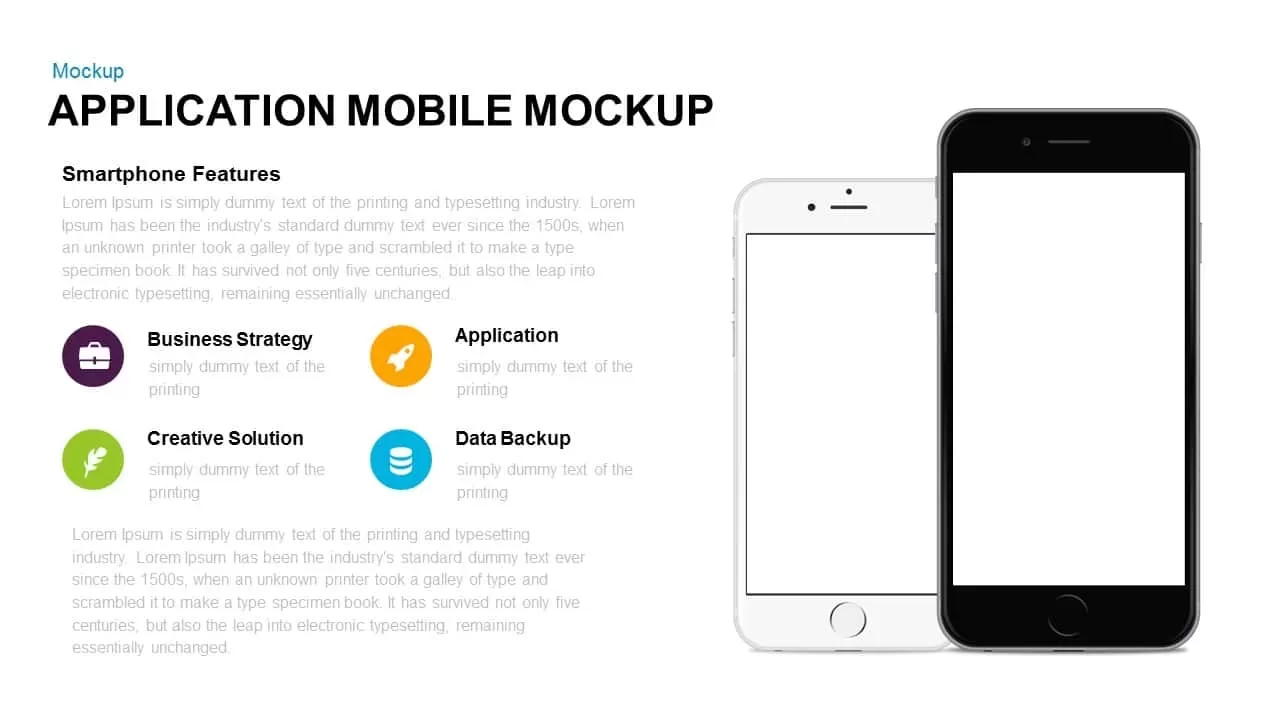
Mobile Application Features Mockup for PowerPoint & Google Slides
Graphics
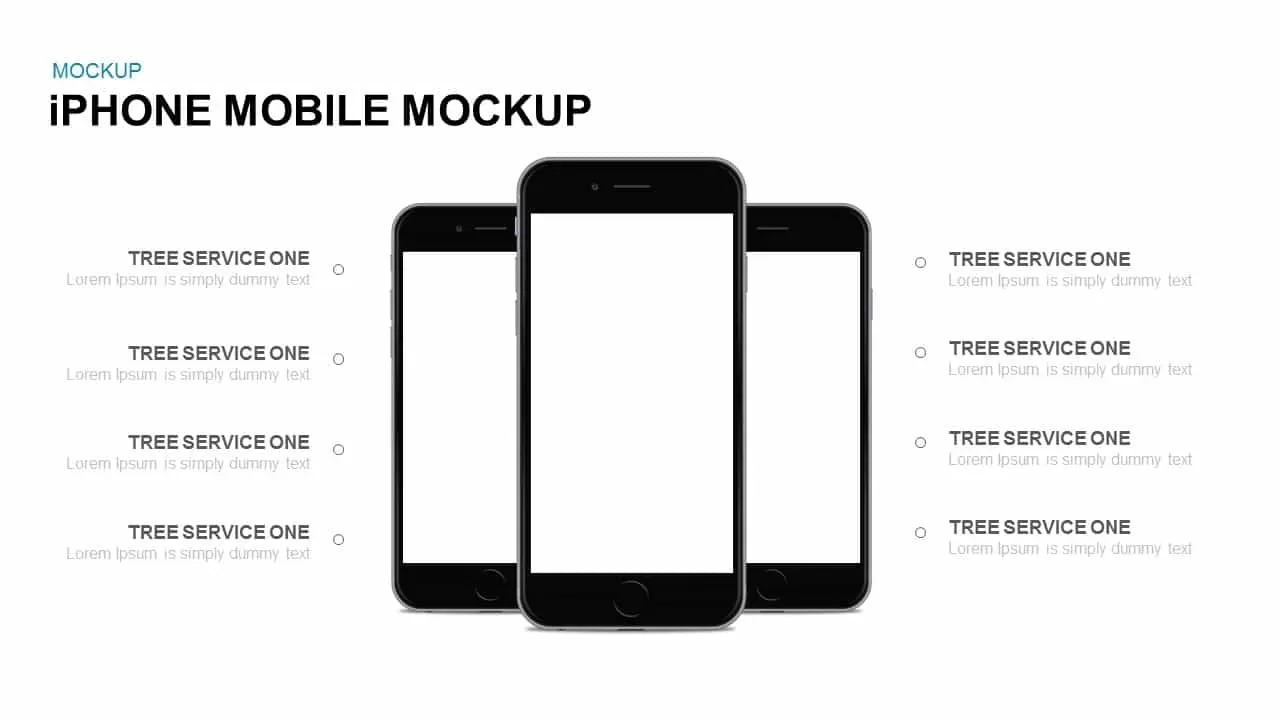
iPhone Mobile Mockup for PowerPoint & Google Slides
Graphics
Mobile Application Features Diagram for PowerPoint & Google Slides
Technology

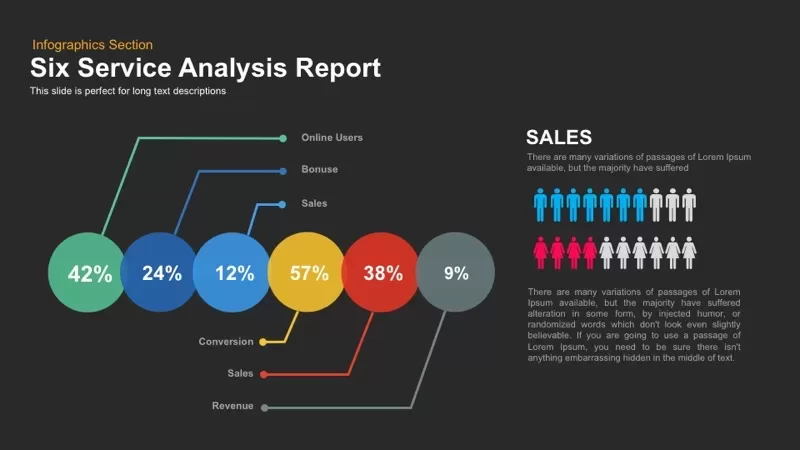
Six Service Analysis Report template for PowerPoint & Google Slides
Infographics
E-Learning Report Analysis Template for PowerPoint & Google Slides
Infographics
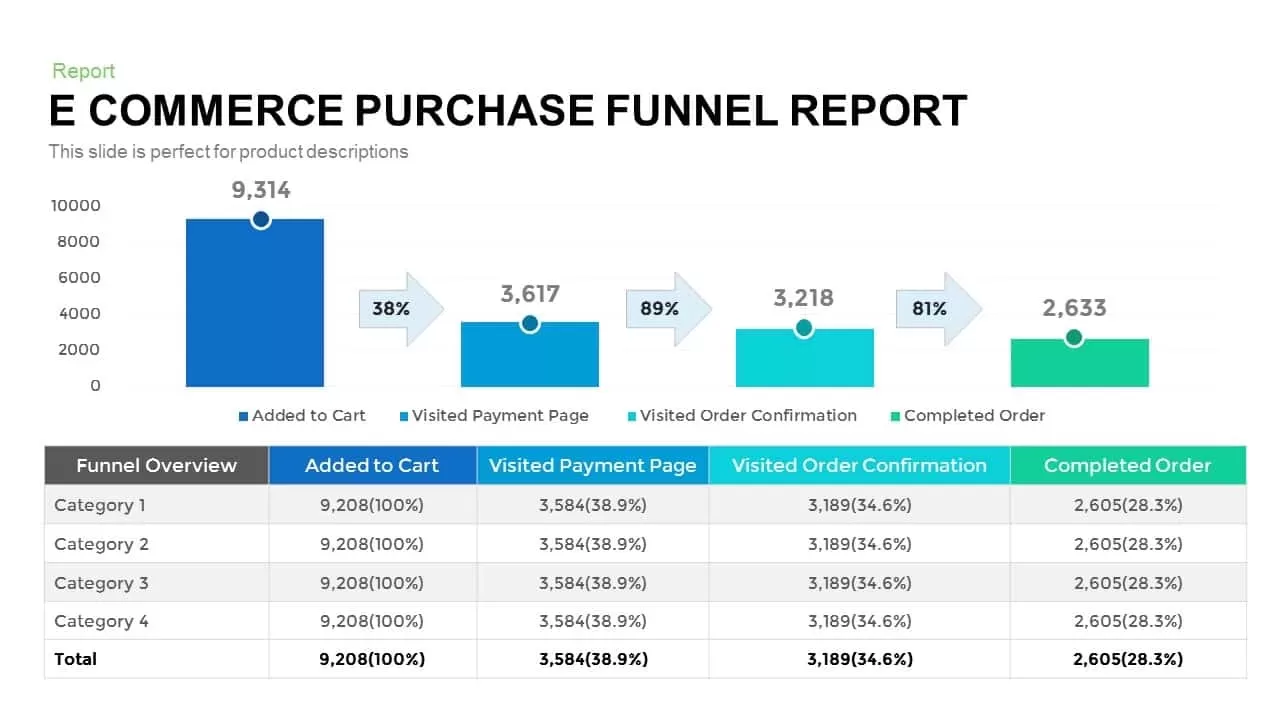
E-commerce Purchase Funnel Report template for PowerPoint & Google Slides
Funnel
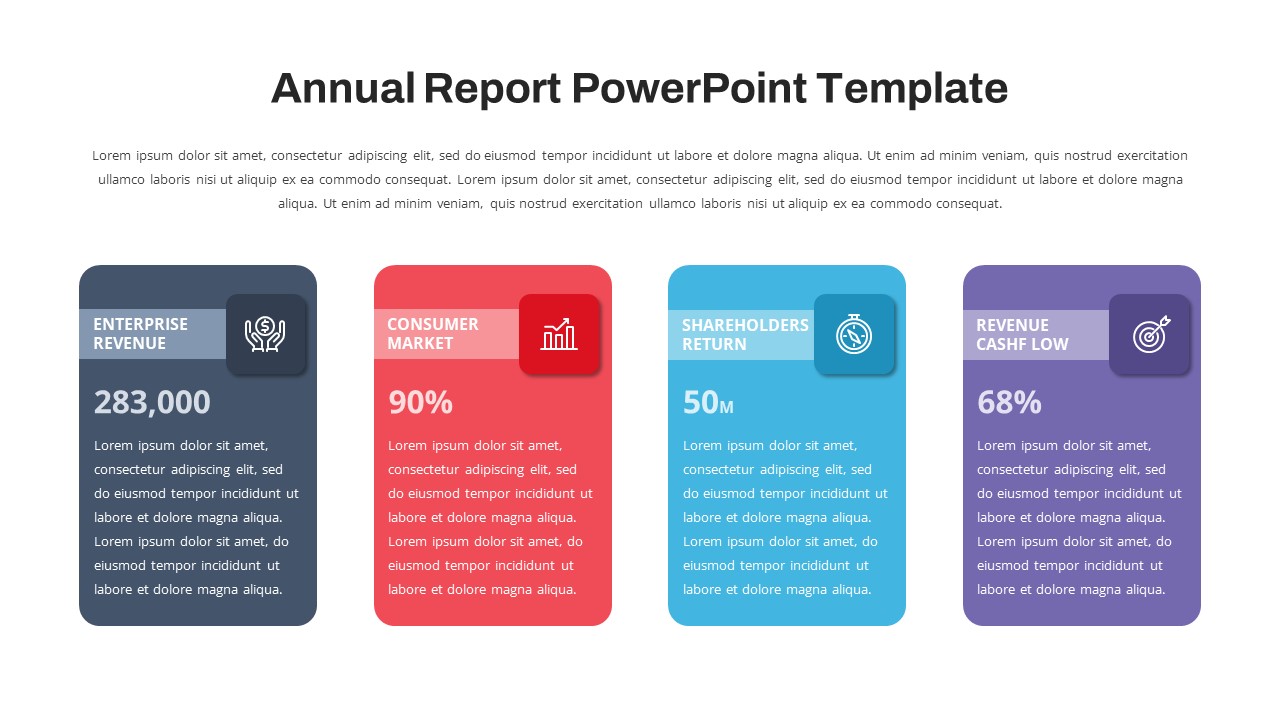
Annual Report Template for PowerPoint & Google Slides
Company Profile

Digital Marketing Report Deck Template for PowerPoint & Google Slides
Pitch Deck
Professional Sales Performance Report Template for PowerPoint & Google Slides
Business Report
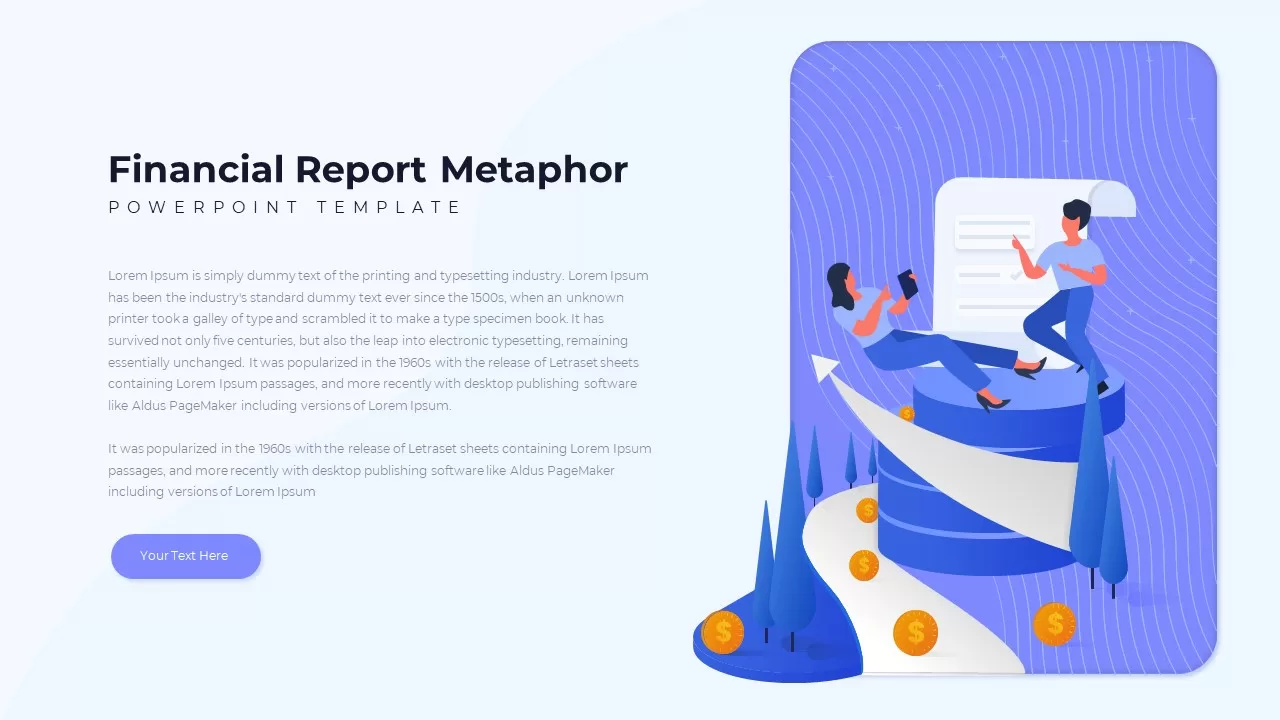
Financial Report Metaphor Illustration Template for PowerPoint & Google Slides
Finance
Annual Report Overview Template for PowerPoint & Google Slides
Decks
Comprehensive Recruitment Metrics Report Template for PowerPoint & Google Slides
Recruitment
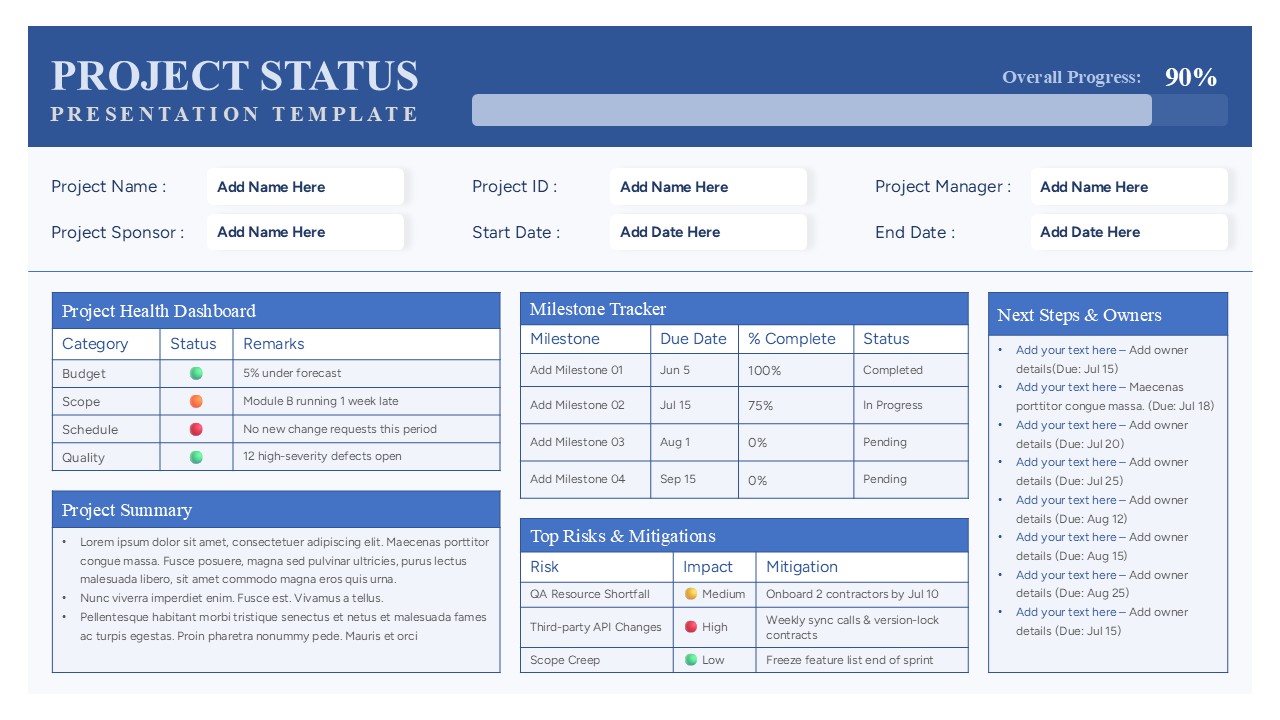
Modern Project Status Report Dashboard Template for PowerPoint & Google Slides
Project Status
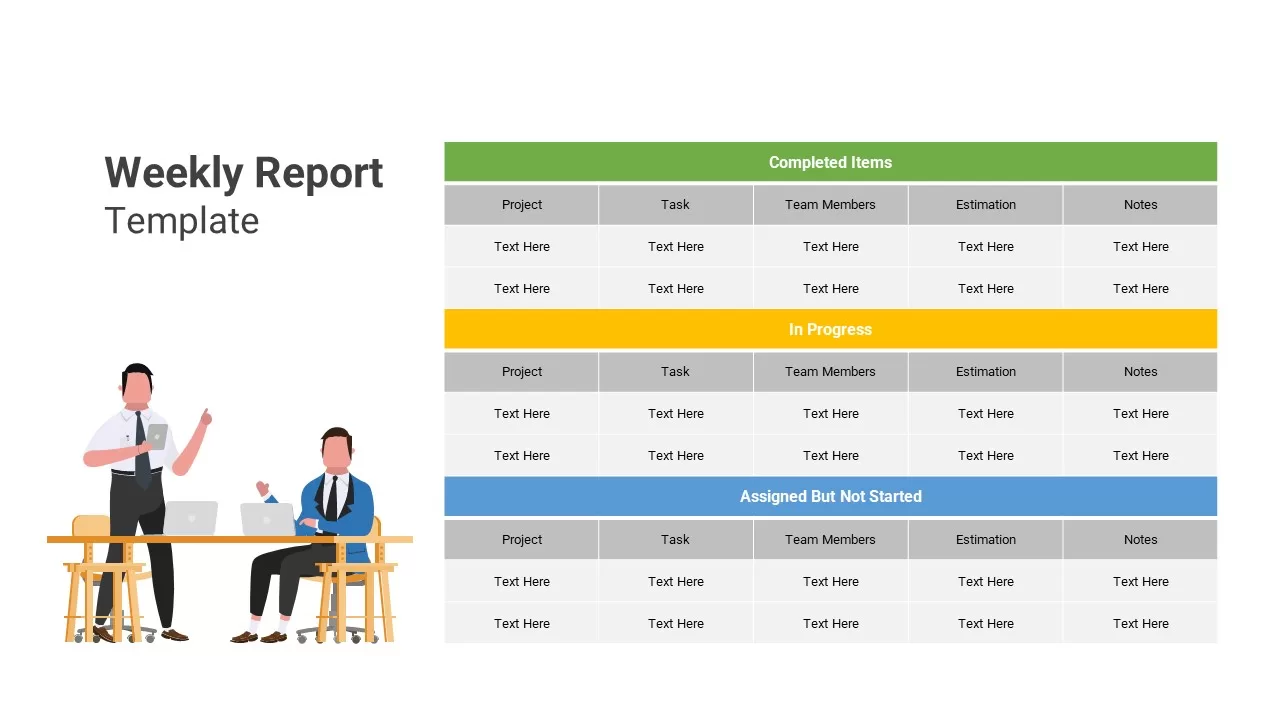
Weekly Report template for PowerPoint & Google Slides
Infographics
Classic Newspaper Report Slide Template for PowerPoint & Google Slides
Graphics
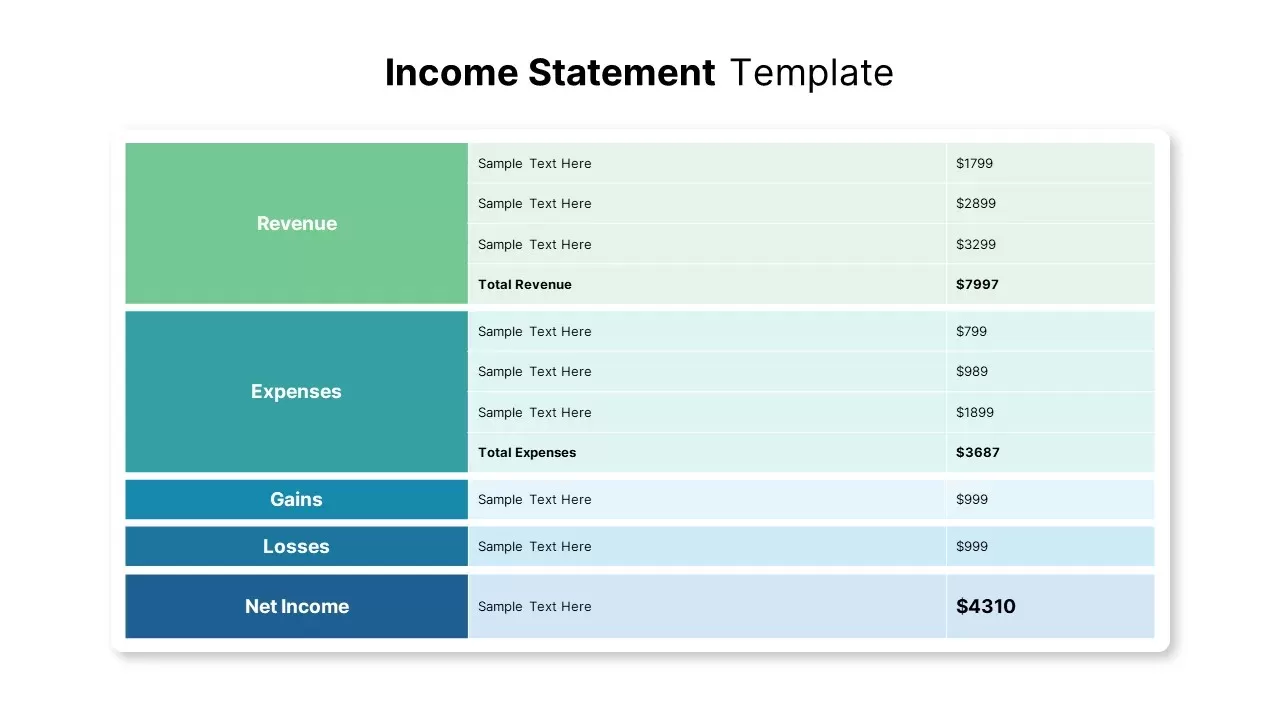
Income Statement Financial Report Template for PowerPoint & Google Slides
Business Report
Weekly Status Report Dashboard Template for PowerPoint & Google Slides
HR
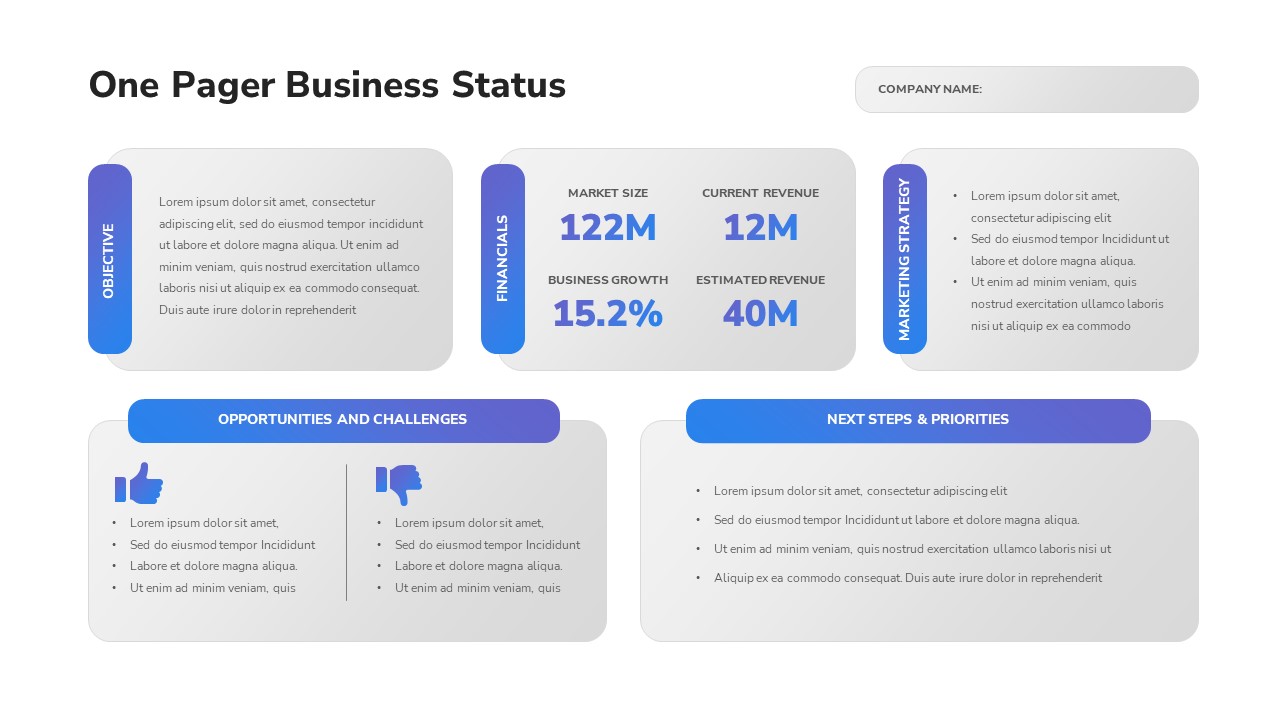
One-Pager Business Status Report Slide Template for PowerPoint & Google Slides
Business Report
One Pager Annual Report Dashboard Template for PowerPoint & Google Slides
Business Report
Social Media Report Presentation Template for PowerPoint & Google Slides
Digital Marketing
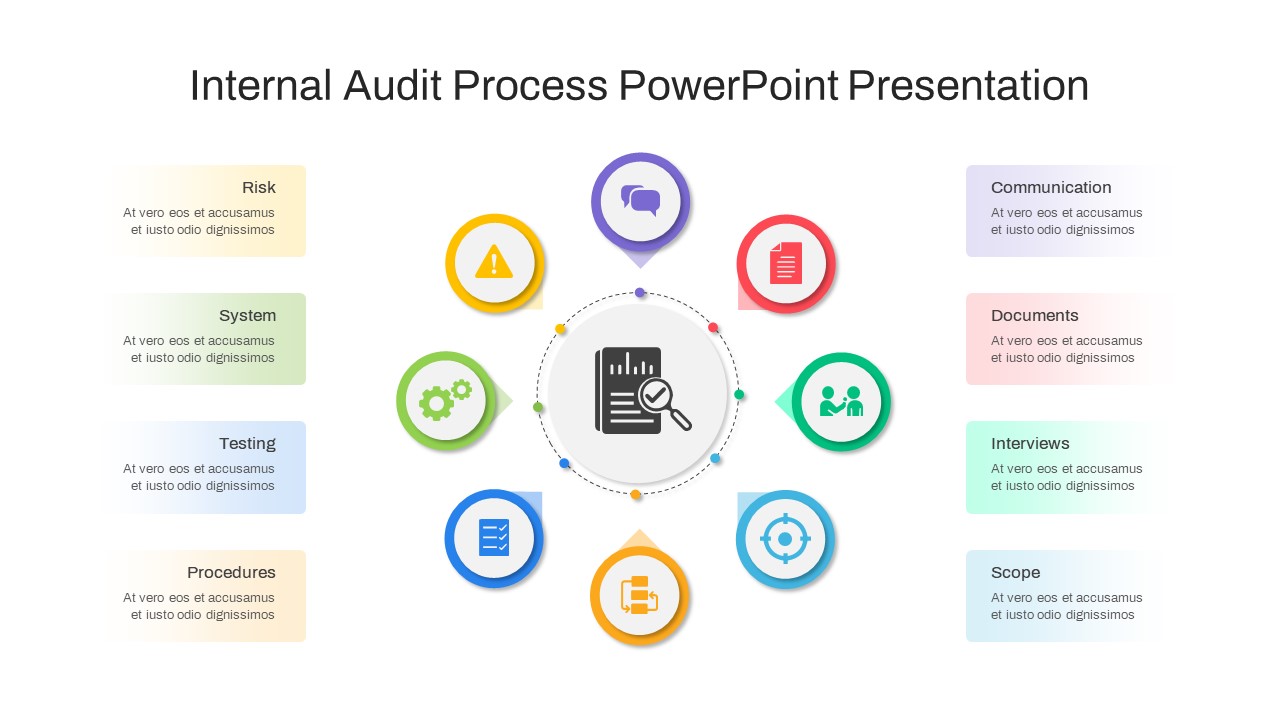
Internal Audit Report & Recommendations Template for PowerPoint & Google Slides
Business Report
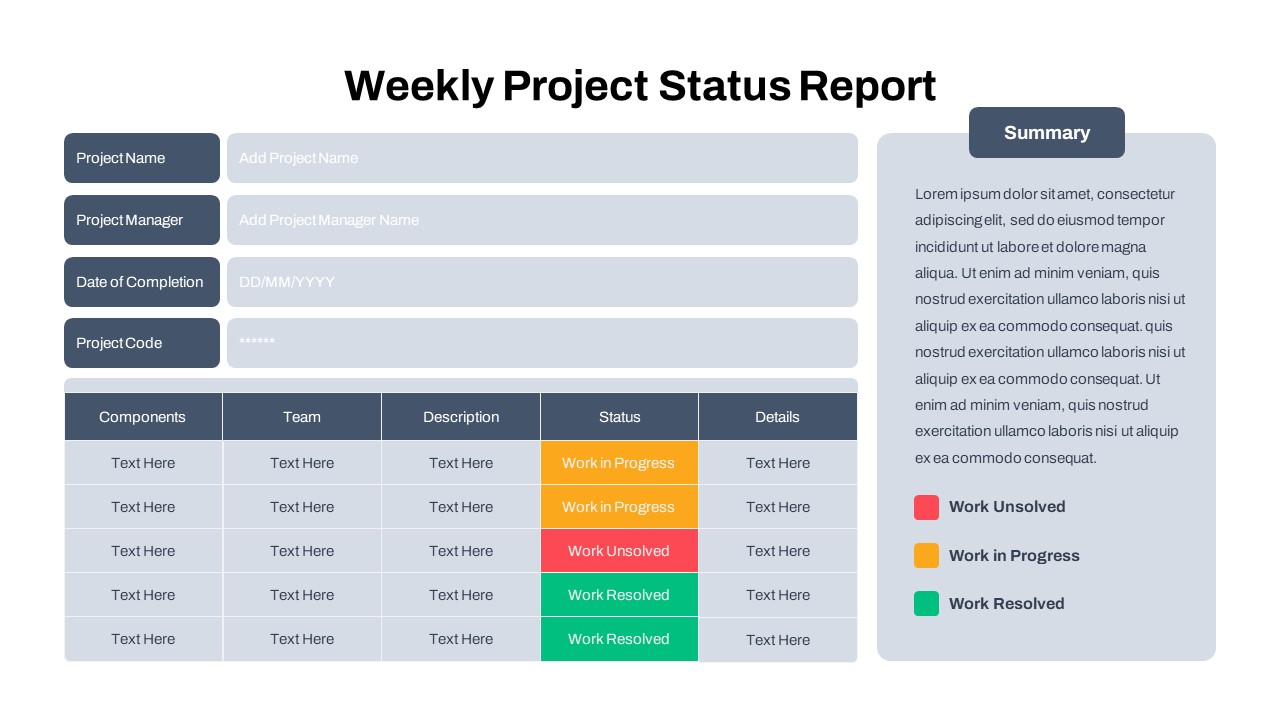
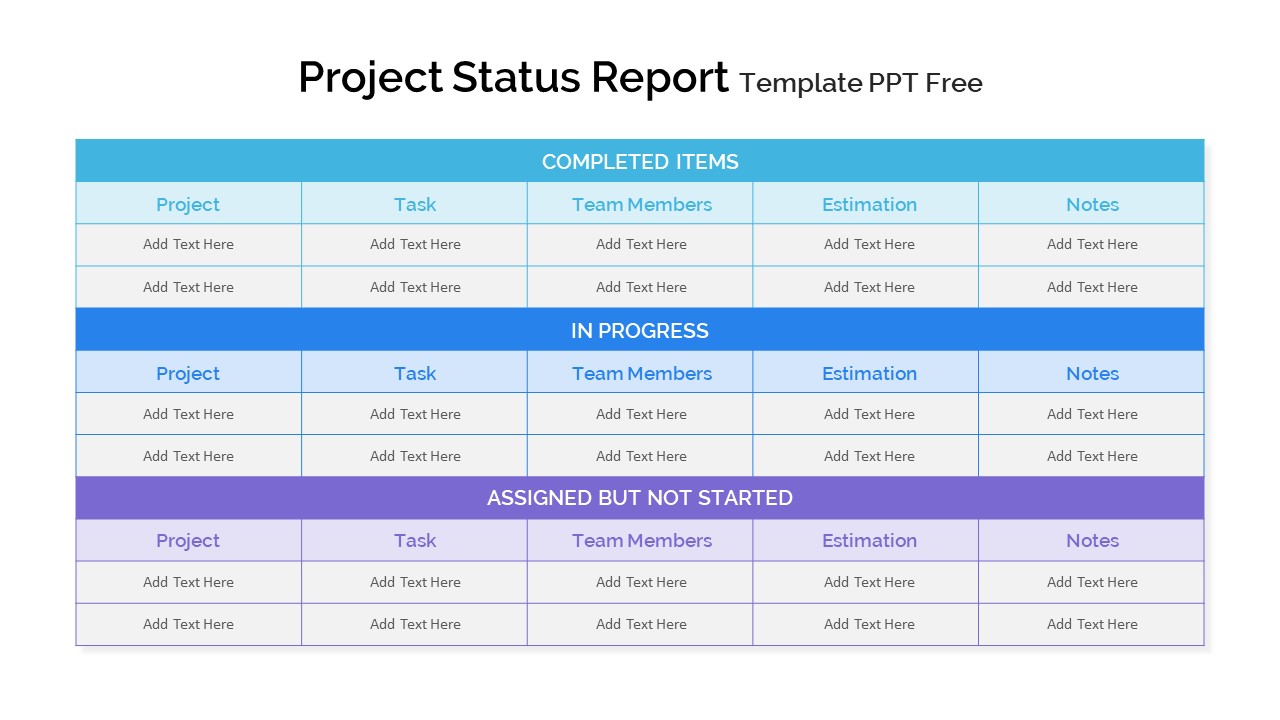
Free Simple Weekly Project Status Report Template for PowerPoint & Google Slides
Project Status
Free
HR Report Dashboard Template for PowerPoint & Google Slides
Employee Performance
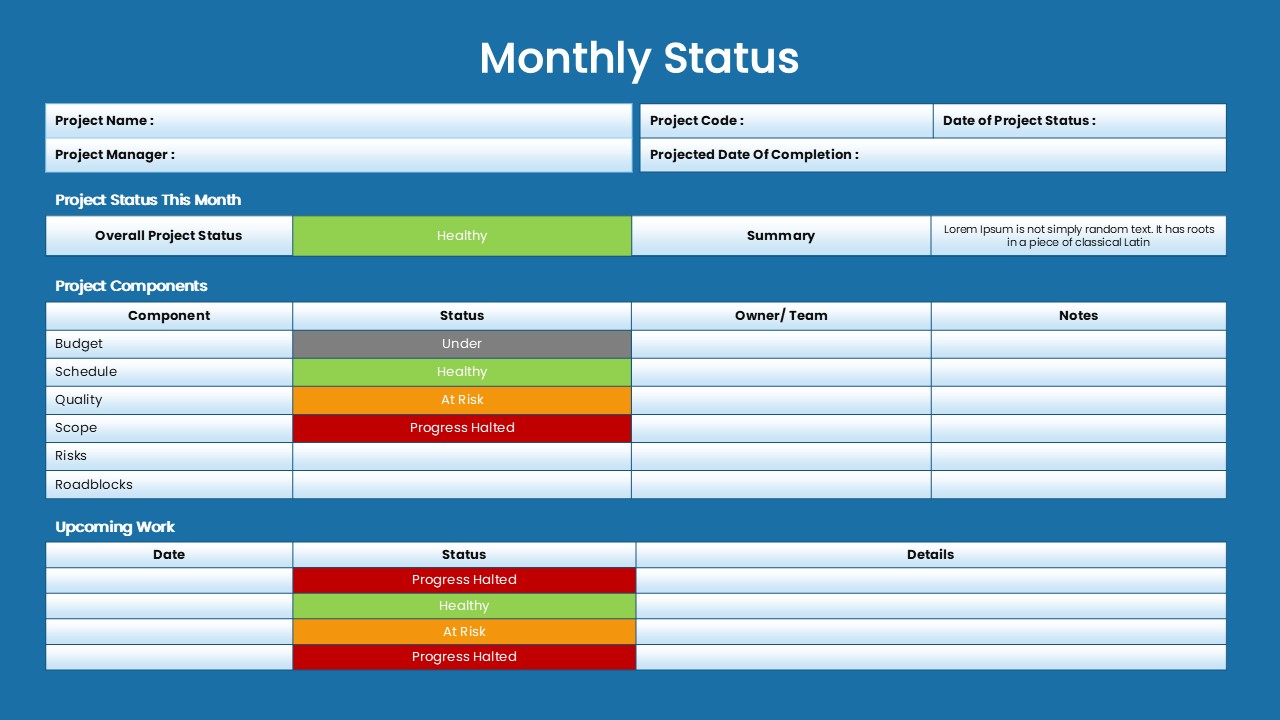
Monthly Status Report Template for PowerPoint & Google Slides
Project Status
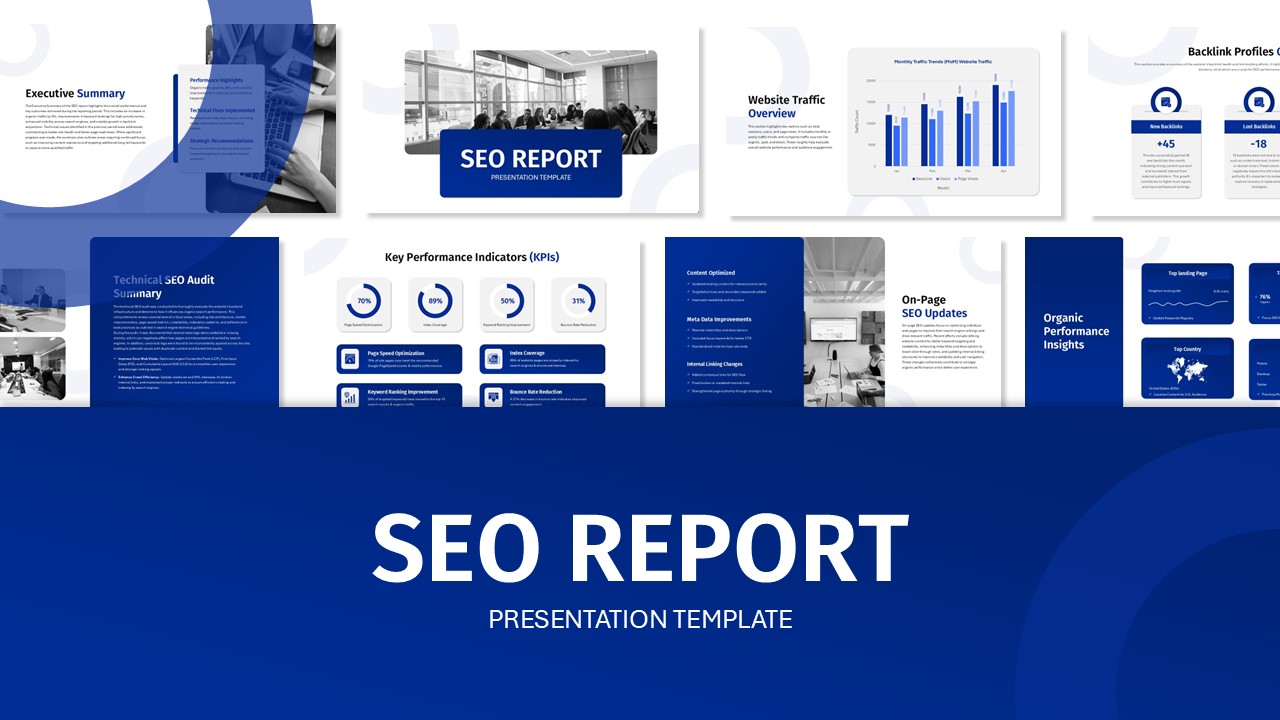
SEO Performance Report Overview template for PowerPoint & Google Slides
Digital Marketing
Project Status Dashboard Report Template for PowerPoint & Google Slides
Project Status
Comprehensive Project Status Report Template for PowerPoint & Google Slides
Project Status
Employee Headcount Dashboard Report Template for PowerPoint & Google Slides
Employee Performance
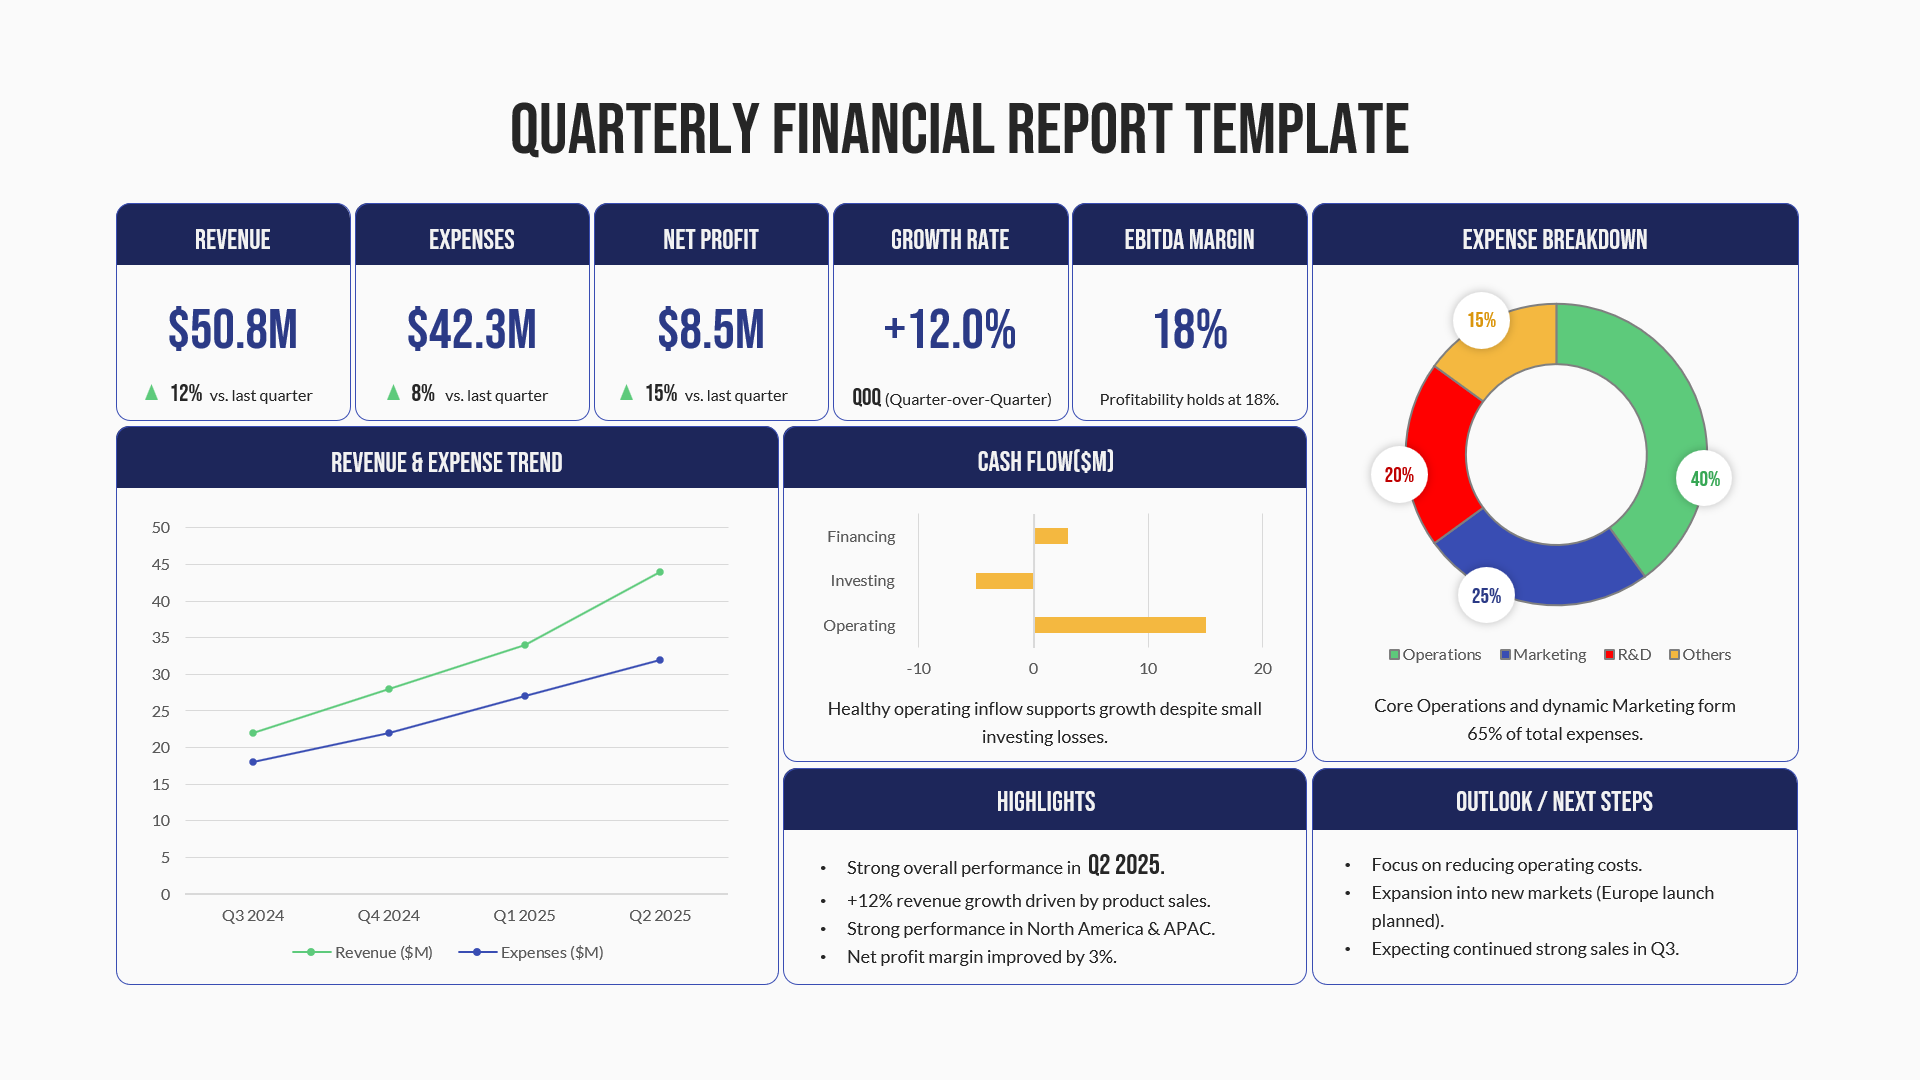
Quarterly Financial Report Dashboard Template for PowerPoint & Google Slides
Finance
Consulting Report for PowerPoint & Google Slides
Business
Project Status Report Tracker Slide for PowerPoint & Google Slides
Project Status
Free Annual Business Report Slide for PowerPoint & Google Slides
Finance
Free

Annual Report Template for PowerPoint
4 Step Process PowerPoint & Google Slides Template for PowerPoint & Google Slides
Process