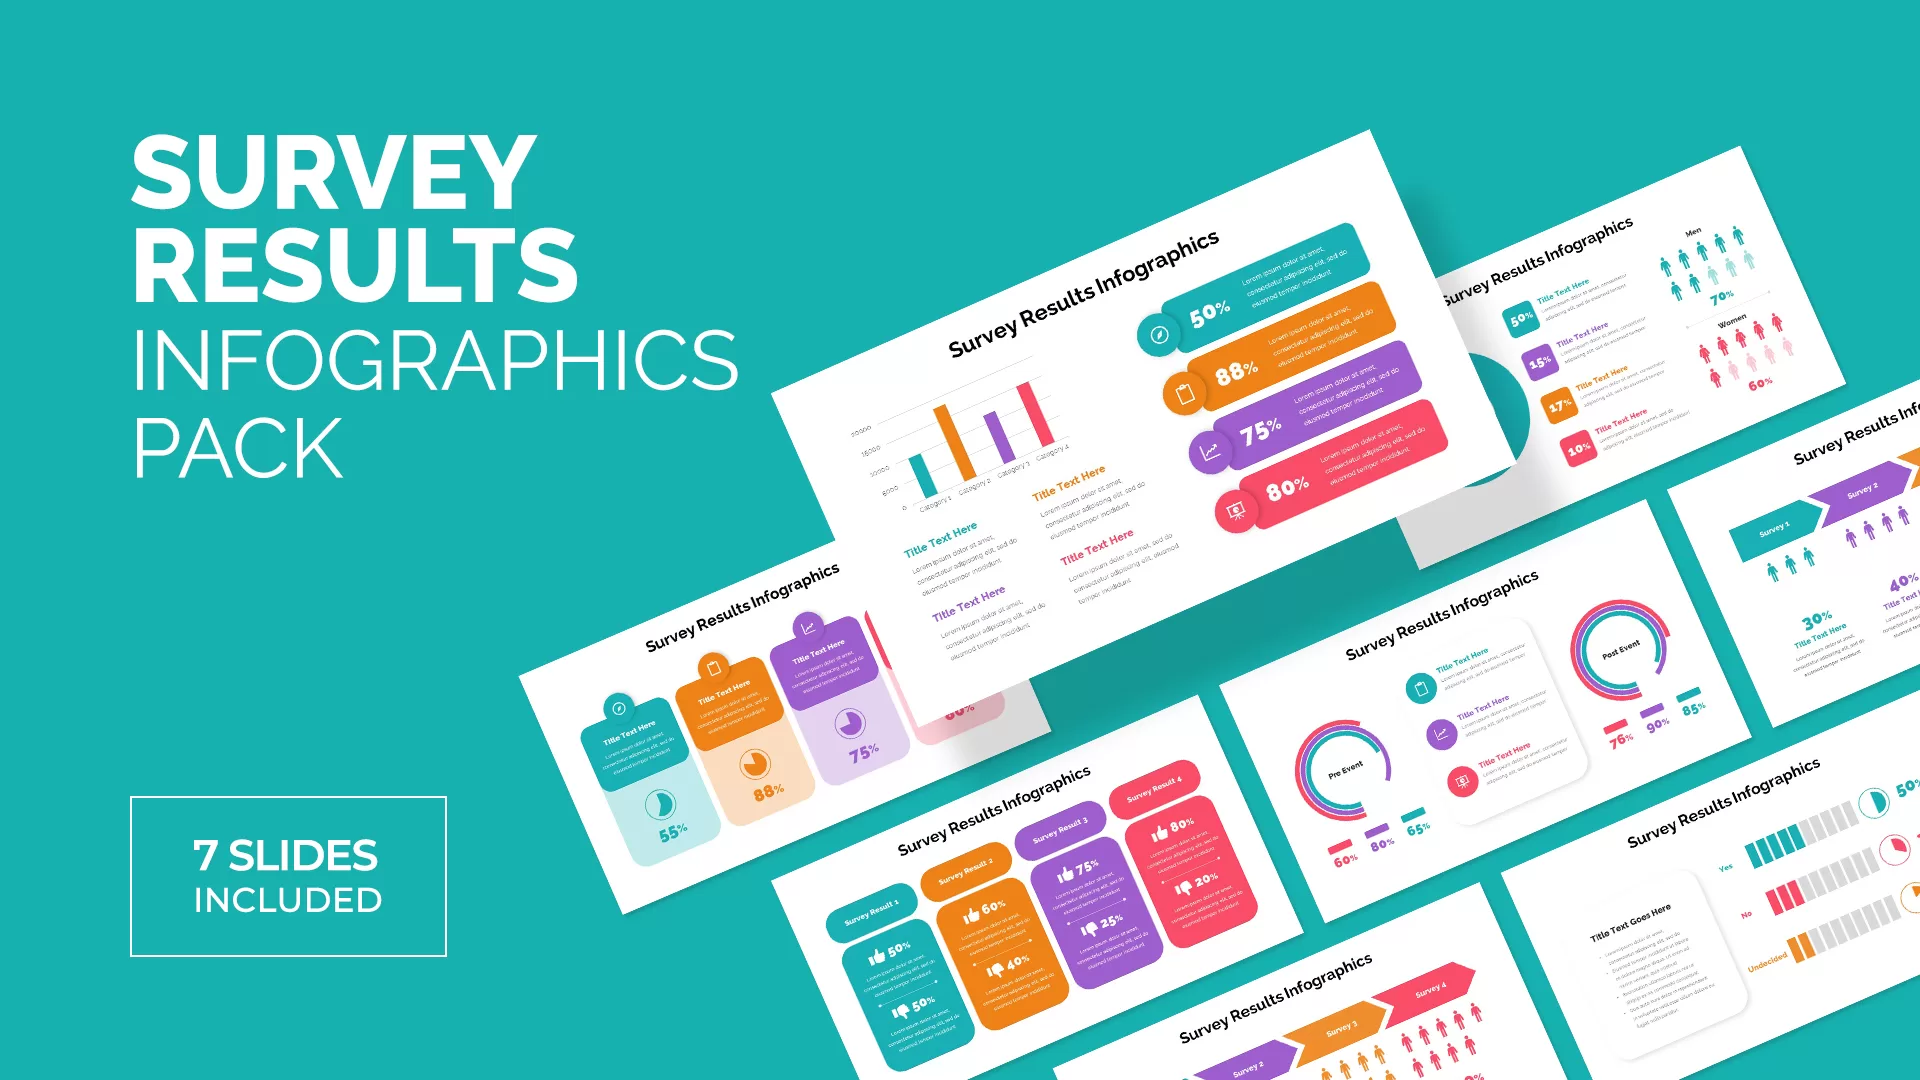
Likert Scale Survey Results infographic pack for PowerPoint & Google Slides


Description
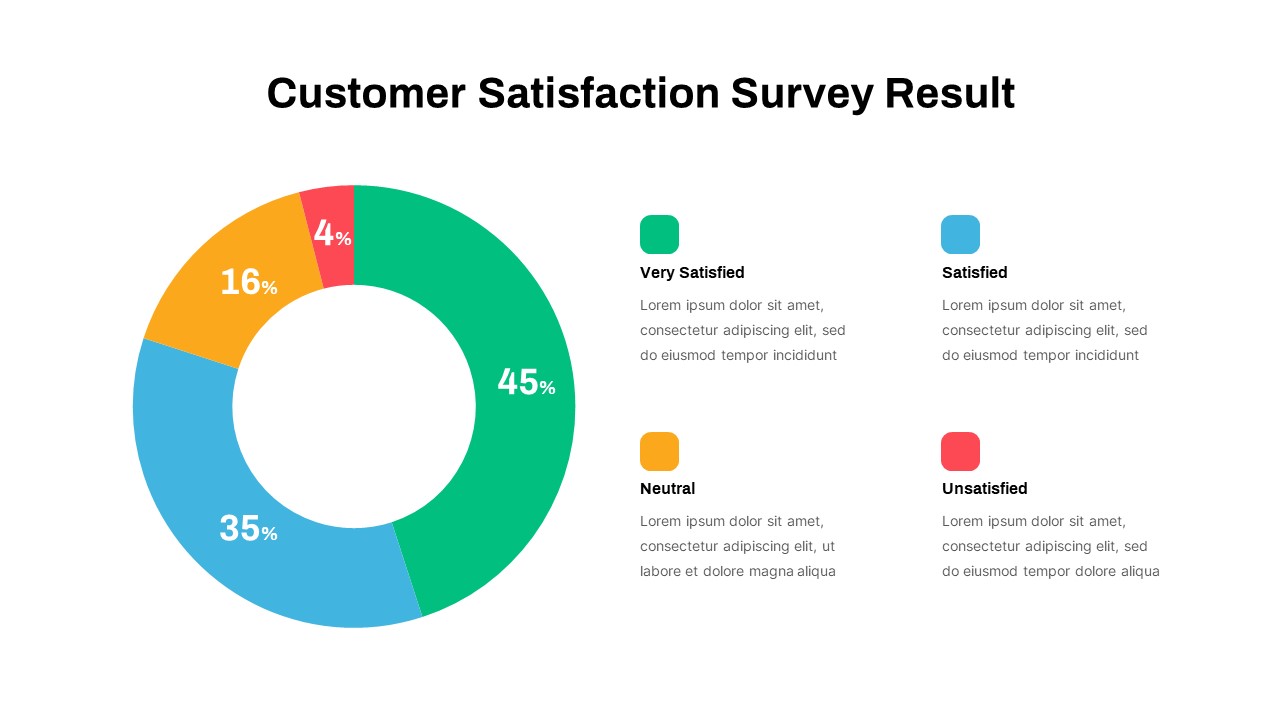
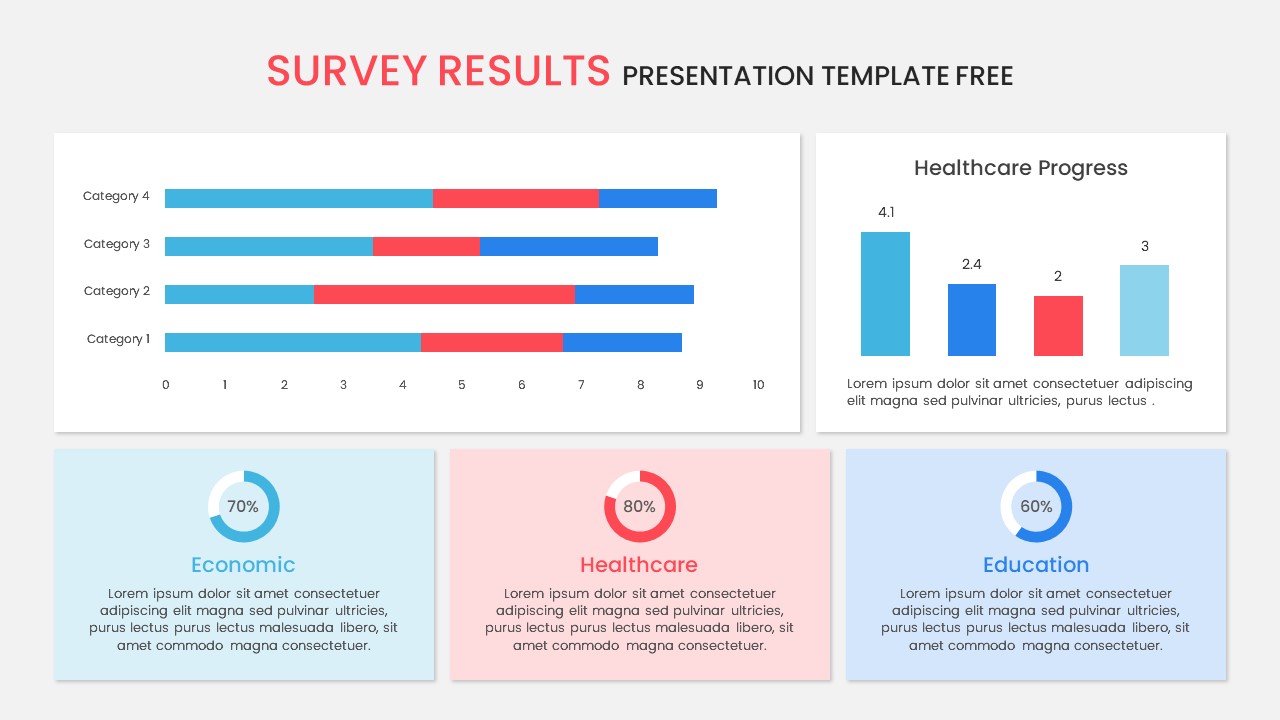
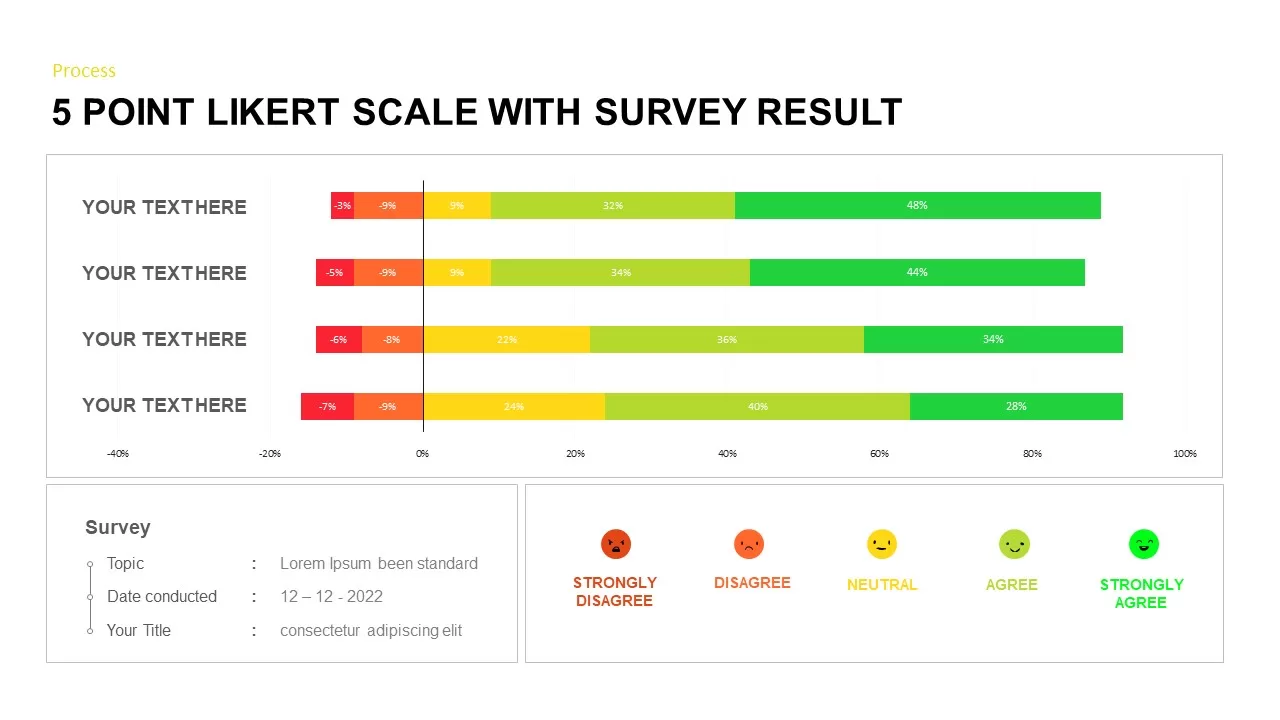
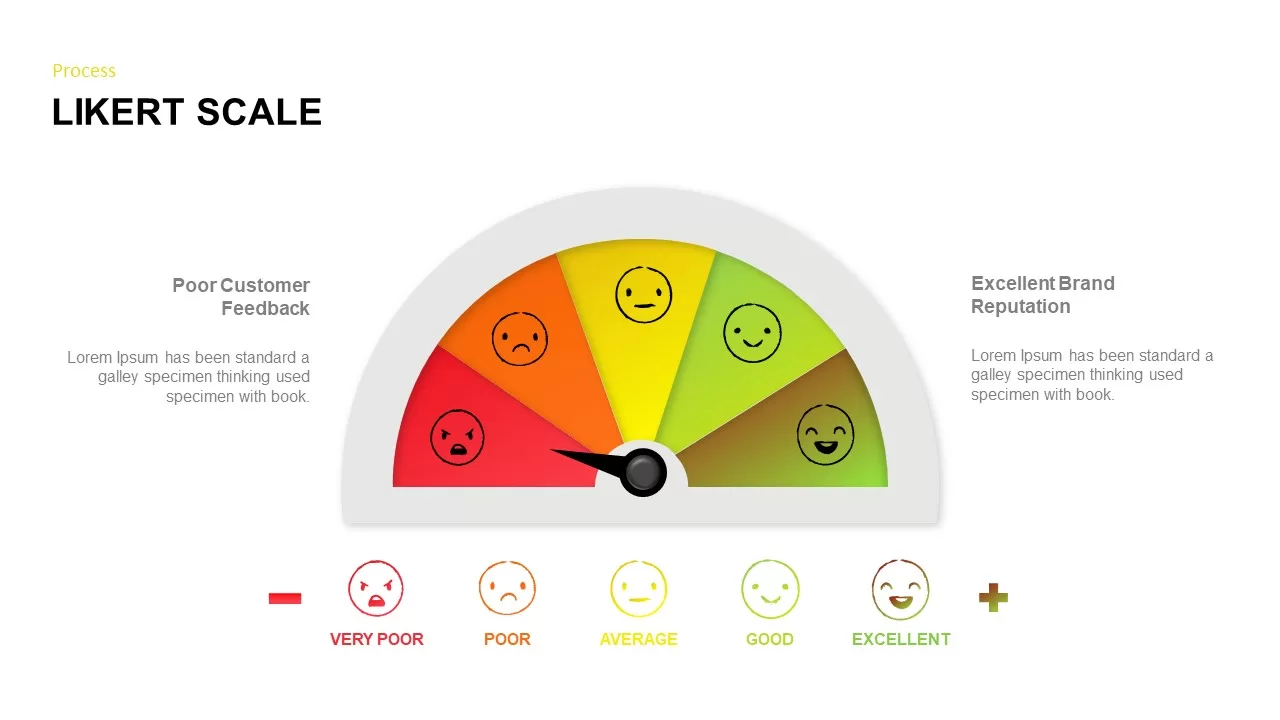
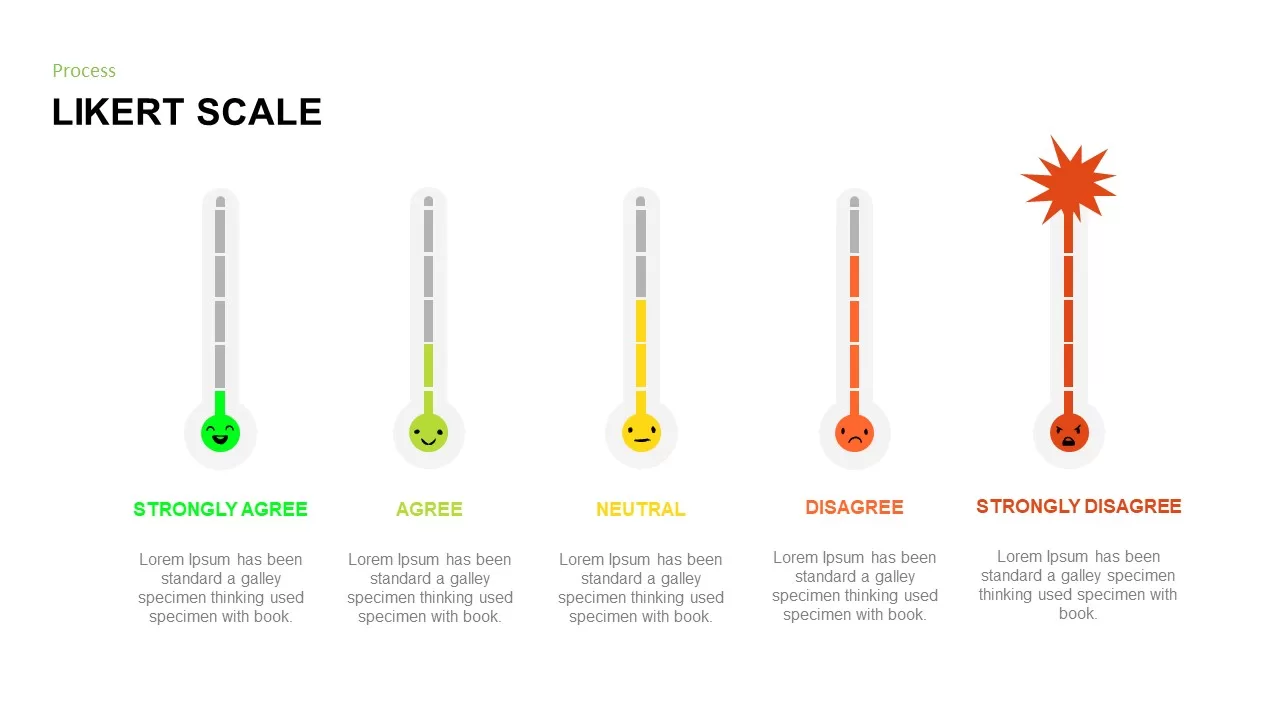
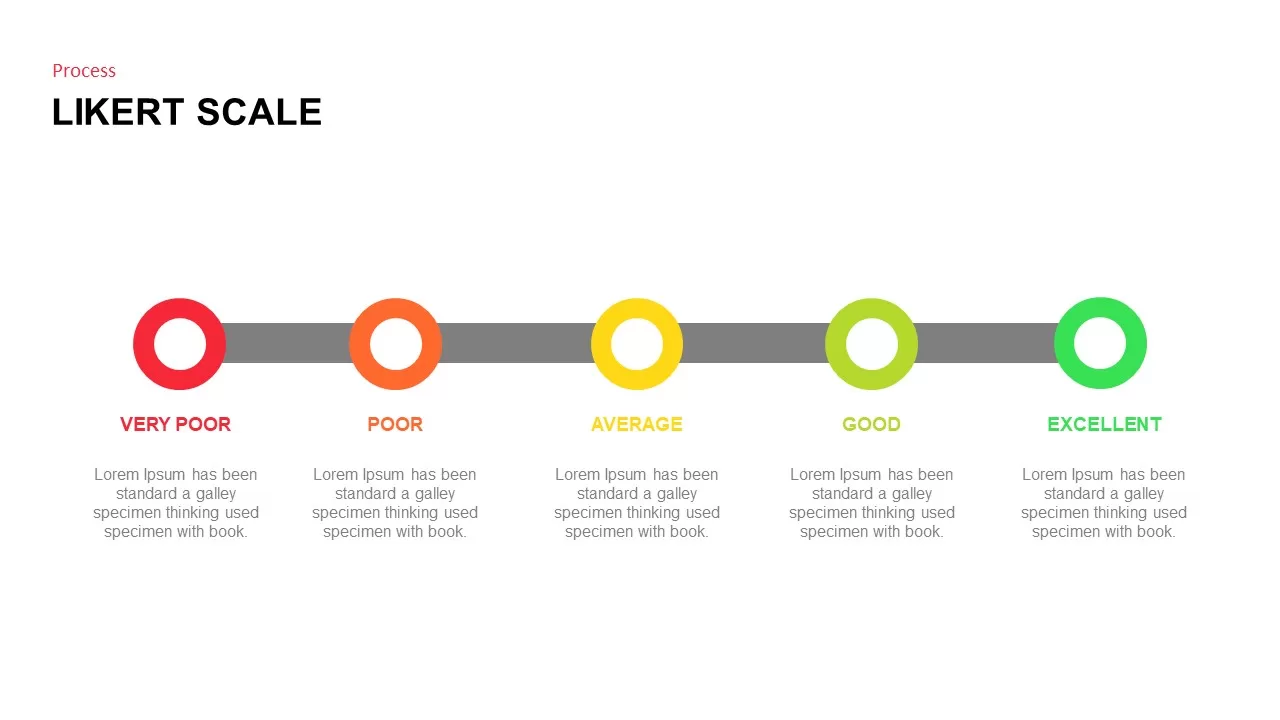
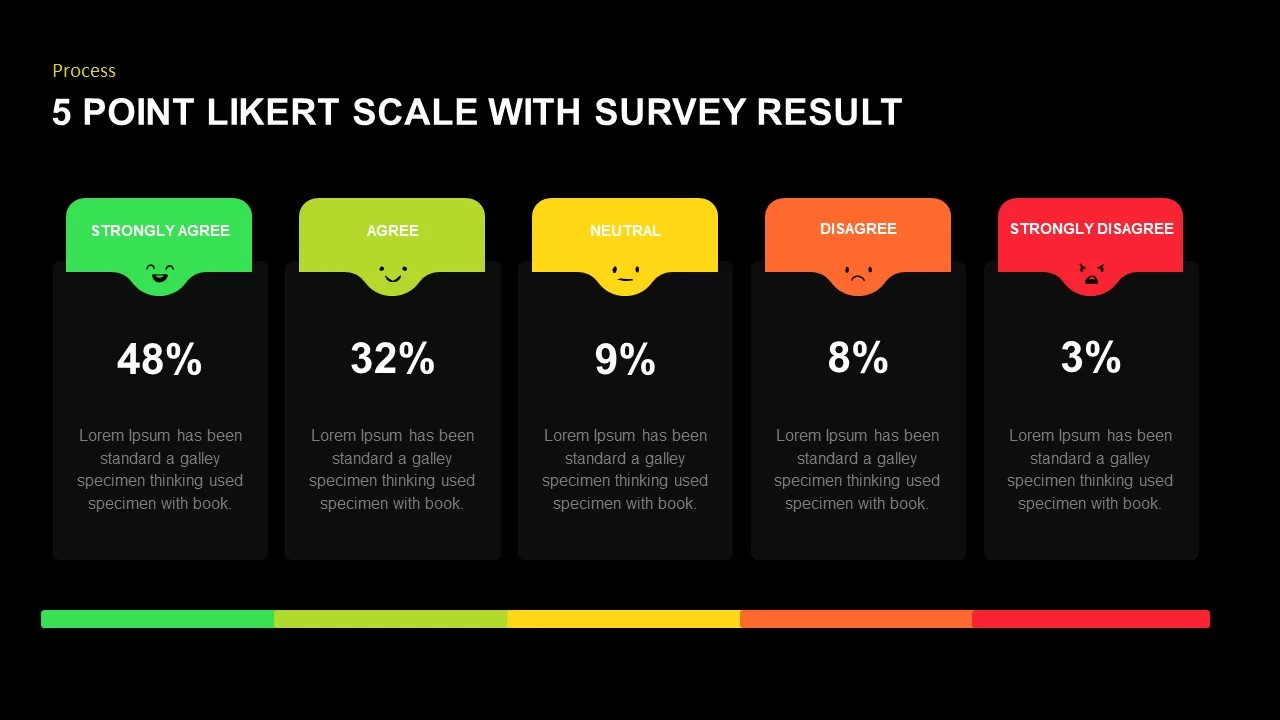
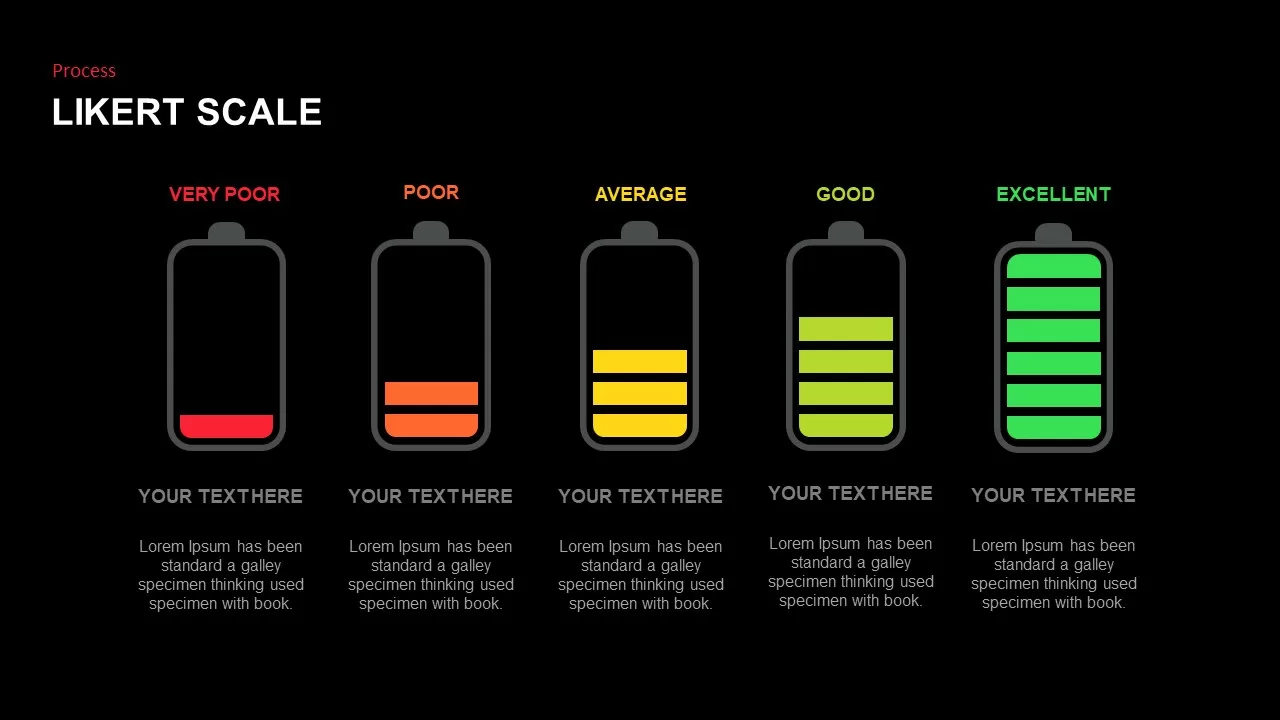
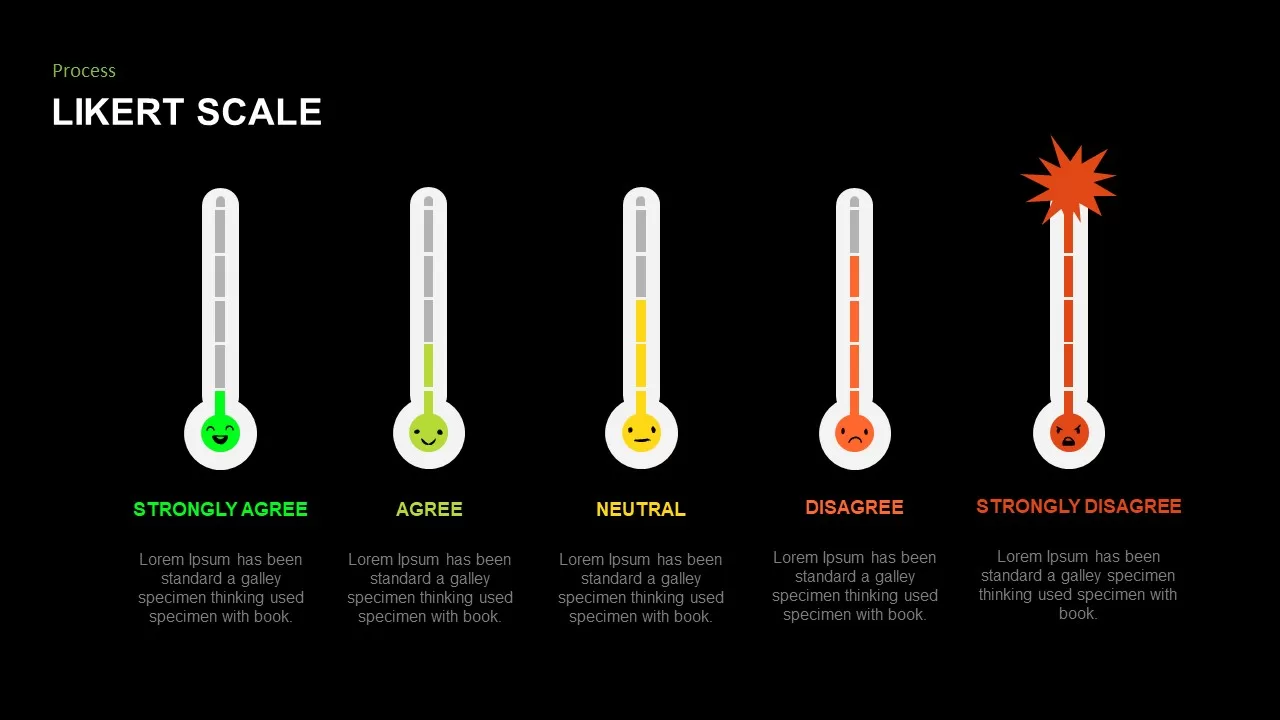
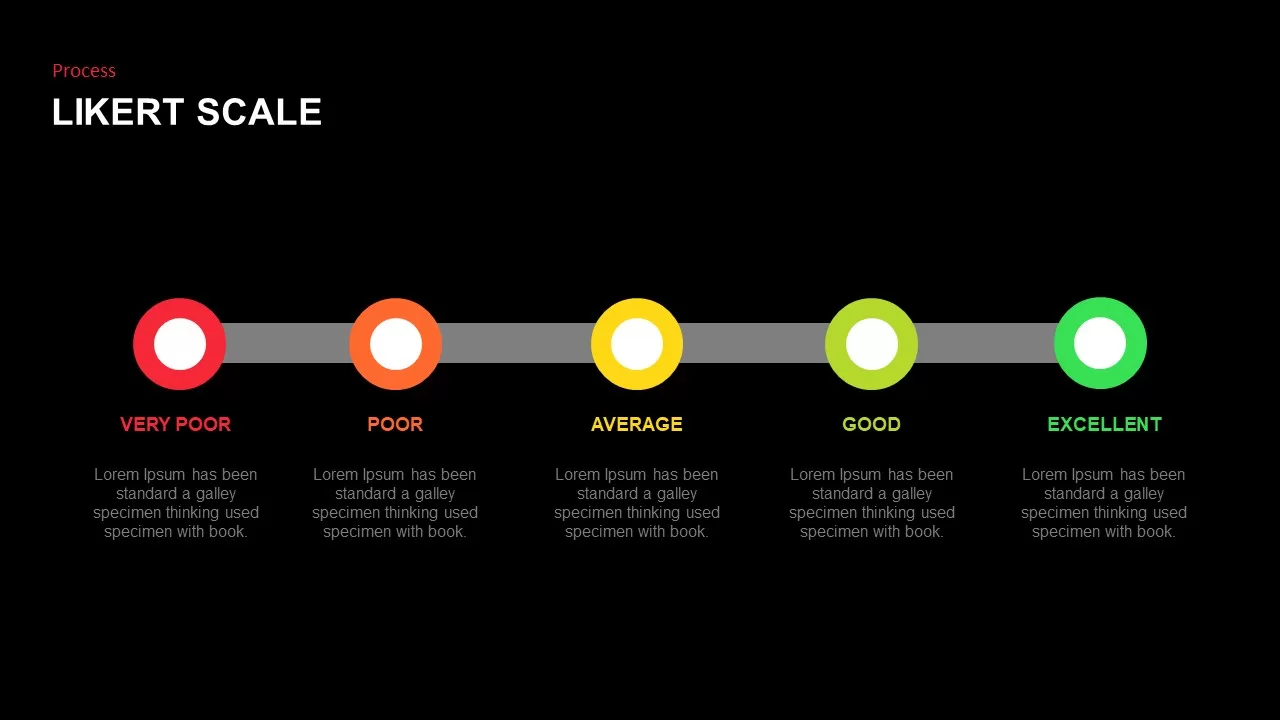
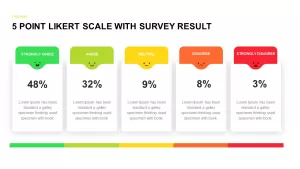
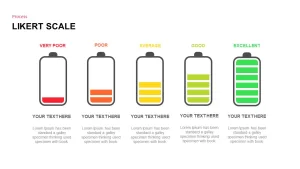
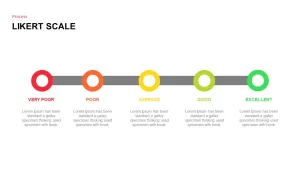
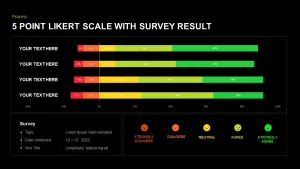
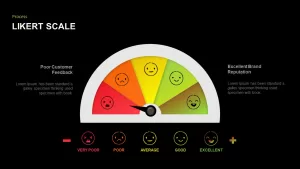
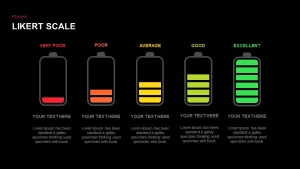
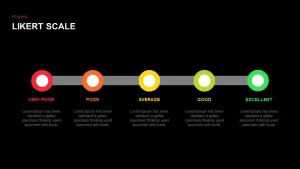
This comprehensive pack features 10 vibrant and dynamic infographic slides focused on presenting Likert scale survey results. With colorful visualizations and clear, easy-to-understand data representation, this set enables you to effectively display survey feedback in an engaging way. The slides showcase multiple ways to present responses, including bar graphs, gauges, battery indicators, and emoticon scales to categorize responses from very poor to excellent. Each slide features customizable placeholders for your survey data, allowing for quick and intuitive updates. The color-coding system used in the slides (green, yellow, orange, and red) aids in effectively communicating sentiment, whether for customer satisfaction surveys, market research, or feedback evaluations. With clean, professional designs, this pack ensures your presentation is not only informative but also visually appealing.
Who is it for
This infographic pack is ideal for marketers, business analysts, HR professionals, and consultants who need to present survey results in an organized and visually appealing manner. It’s perfect for anyone who needs to display feedback in an accessible and engaging way, such as during customer satisfaction reviews, employee surveys, or market research presentations. Educators or students working on research-based projects can also benefit from these easy-to-understand layouts to present findings.
Other Uses
Beyond standard surveys, these slides can be repurposed for a range of uses, such as presenting KPIs, performance evaluations, or customer feedback analysis. These slides are also suitable for showcasing comparative data or highlighting trends over time in a visually impactful manner. Whether used in business meetings, academic research, or product development discussions, these slides can support a variety of presentation needs.
Login to download this file

Item ID
SB02255
Related Templates

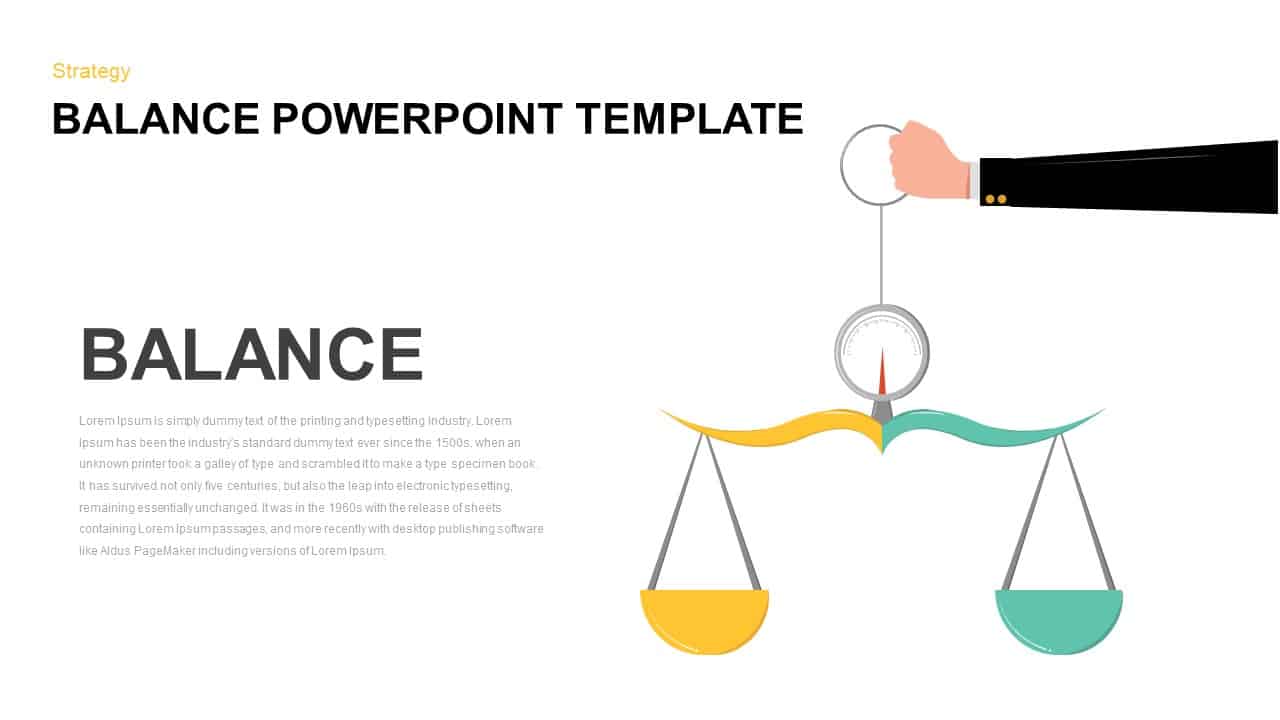
Balance Scale Visualization Infographic Template for PowerPoint & Google Slides
Comparison
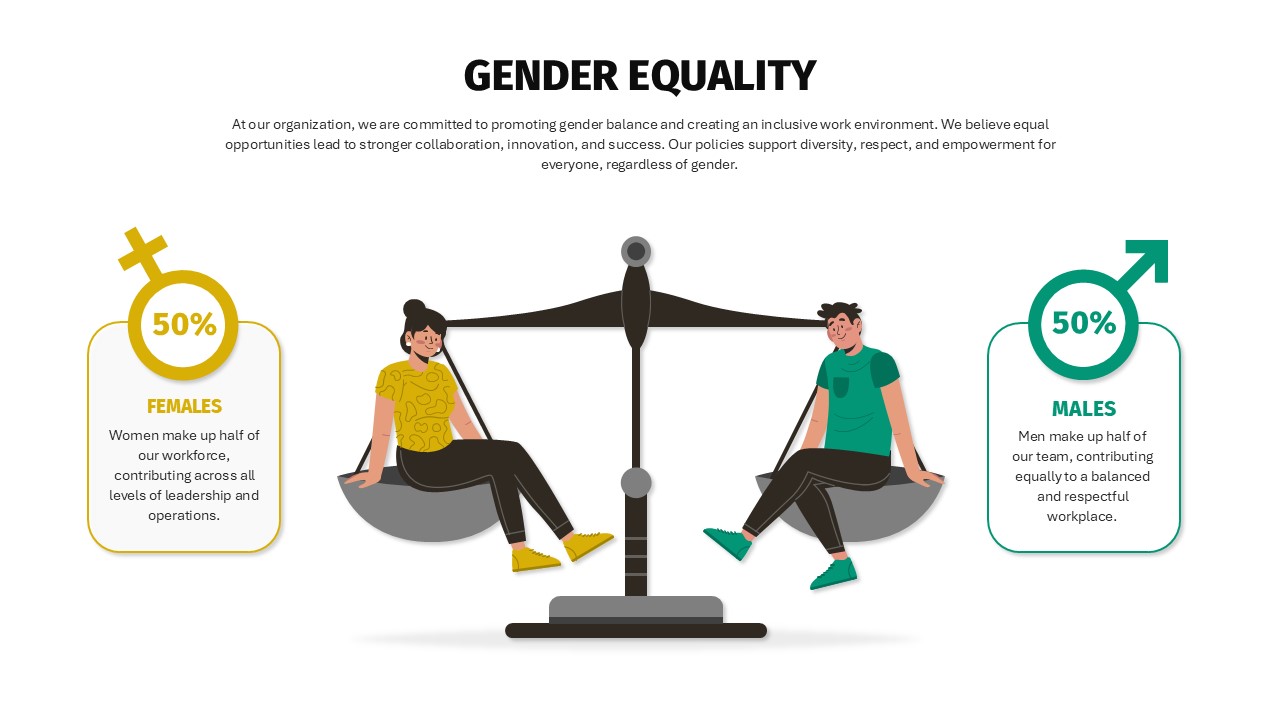
Balanced Gender Equality Scale Infographic Template for PowerPoint & Google Slides
Comparison
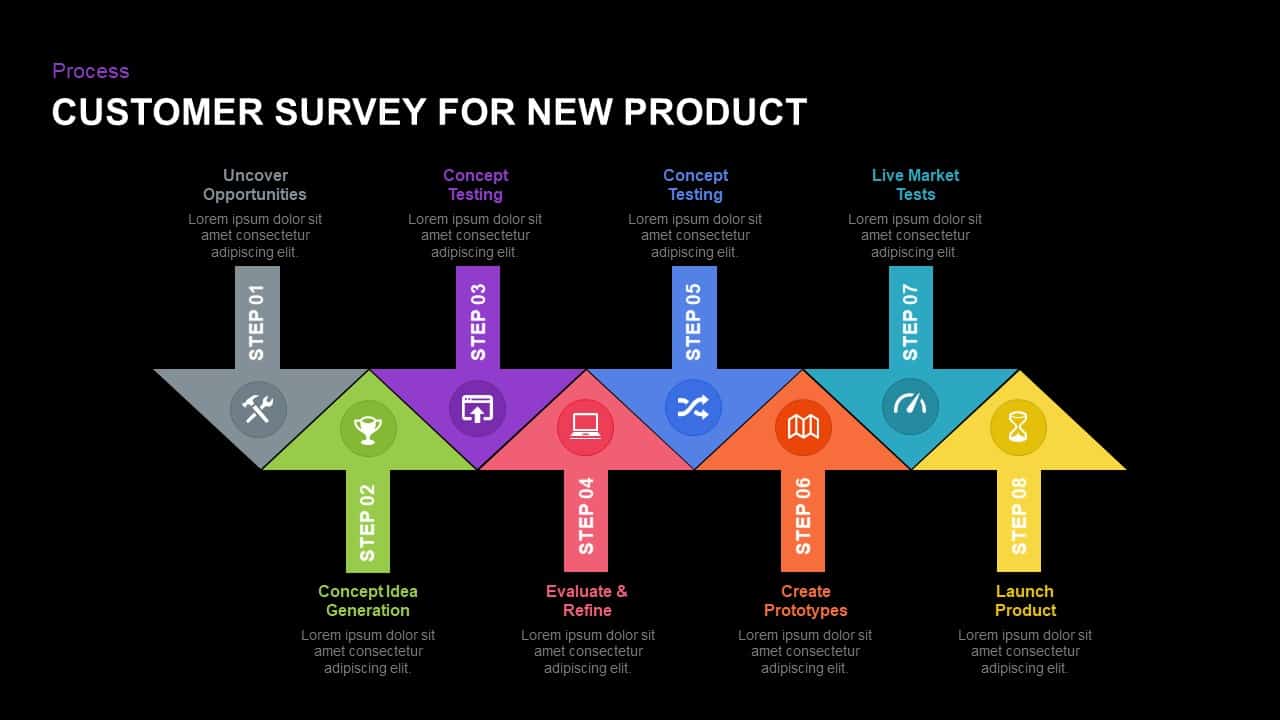
Eight-Step New Product Survey Process Template for PowerPoint & Google Slides
Process

Survey Results Infographics for PowerPoint & Google Slides
Infographics
Employee Satisfaction Survey Dashboard Template for PowerPoint & Google Slides
Employee Performance
Customer Satisfaction Survey Result Template for PowerPoint & Google Slides
Marketing
Free Survey Results Analysis Slide for PowerPoint & Google Slides
Business Report
Free
Sales Process Infographic Slides Pack Template for PowerPoint & Google Slides
Process
Agenda Infographic Pack of 2 Slides Template for PowerPoint & Google Slides
Agenda
Quad Chart Infographic Pack of 8 Slides Template for PowerPoint & Google Slides
Comparison Chart
Game Plan Infographic Slides Pack Template for PowerPoint & Google Slides
Infographics
Free Infographic Deck PowerPoint Pack for PowerPoint & Google Slides
Infographics
Free

North Korea Map with Provinces Infographic Pack Template for PowerPoint & Google Slides
Maps
Pakistan Provinces Map Infographic Pack Template for PowerPoint & Google Slides
Maps
Sri Lanka Map Infographic Pack Template for PowerPoint & Google Slides
Maps
Thailand Provinces Map Infographic Pack Template for PowerPoint & Google Slides
Maps
Vietnam Provinces Map Infographic Pack Template for PowerPoint & Google Slides
Maps
Target Marketing Infographic Slide Pack Template for PowerPoint & Google Slides
Infographics
Four-Step Funnel Infographic Pack Template for PowerPoint & Google Slides
Funnel

IT Strategic Diagram Infographic Pack Template for PowerPoint & Google Slides
Business Strategy
Overcoming Challenges Infographic Pack Template for PowerPoint & Google Slides
Opportunities Challenges
From To infographic pack for PowerPoint & Google Slides
Business Plan
1 to 5 Column infographic pack for PowerPoint & Google Slides
Business
Sales Infographic pack for PowerPoint & Google Slides
Business
Progress Bar infographic pack for PowerPoint & Google Slides
Business
Three-Year Plan Infographic Pack Template for PowerPoint & Google Slides
Timeline
Now Next Later Infographic Pack Template for PowerPoint & Google Slides
Process
Animated Spinning Wheel Infographic Pack Template for PowerPoint & Google Slides
Circular
Root Cause Analysis Infographic Pack Template for PowerPoint & Google Slides
Process
Traffic Light Infographic Pack Template for PowerPoint & Google Slides
Pitch Deck
Types of Budget Infographic Pack Template for PowerPoint & Google Slides
Comparison
Data-driven GDP Growth Infographic Pack Template for PowerPoint & Google Slides
Infographics
Transformation Roadmap Infographic Pack Template for PowerPoint & Google Slides
Timeline
Competitive Battle Card Infographic Pack Template for PowerPoint & Google Slides
Competitor Analysis

Free Colorful Infographic Slide Pack Template for PowerPoint & Google Slides
Roadmap
Free
Free Multi-Step Funnel Infographic Slide Pack Template for PowerPoint & Google Slides
Funnel
Free
Training Roadmap Infographic Pack Template for PowerPoint & Google Slides
Roadmap
Free 4 Safety Equipment Infographic Pack Template for PowerPoint & Google Slides
Pitch Deck
Free
Free Three and Four Pillar Infographic Pack Template for PowerPoint & Google Slides
Process
Free
3D Building Blocks Infographic Pack Template for PowerPoint & Google Slides
Infographics
Vision & Strategy Infographic Pack Template for PowerPoint & Google Slides
Vision and Mission
Three Options Infographic Pack Template for PowerPoint & Google Slides
Process
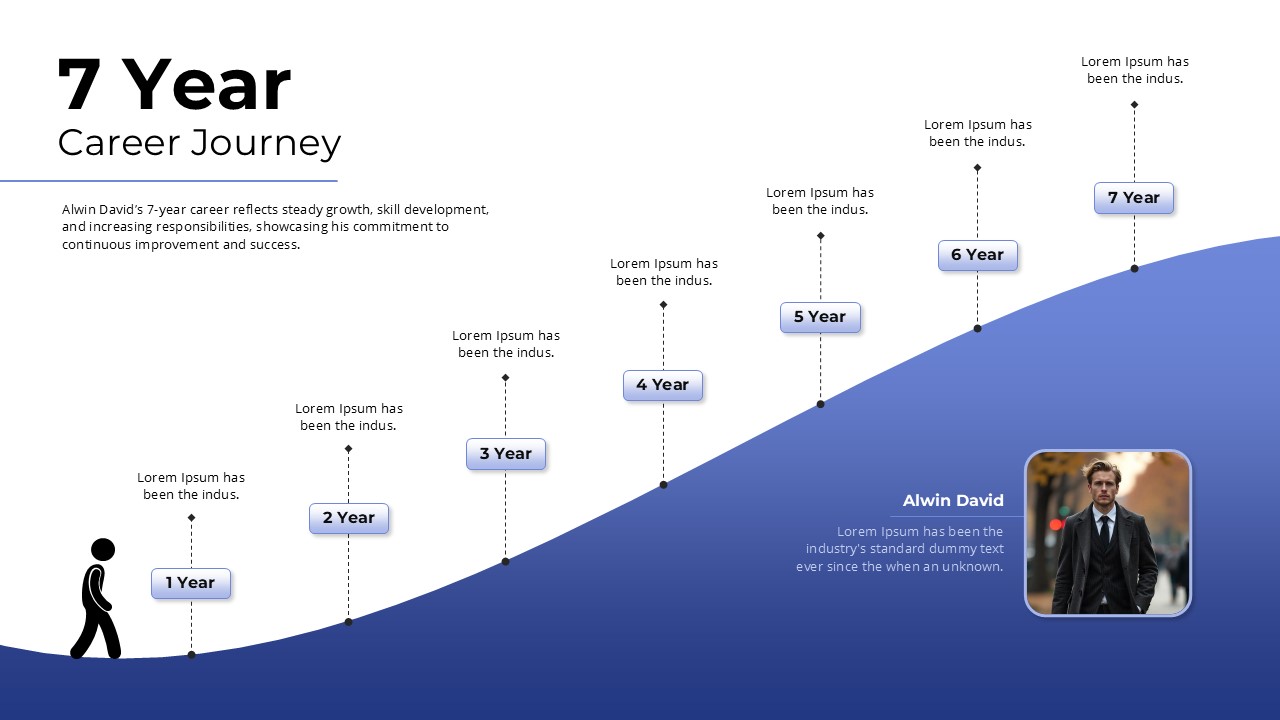
Career Journey Infographic Pack Template for PowerPoint & Google Slides
Timeline
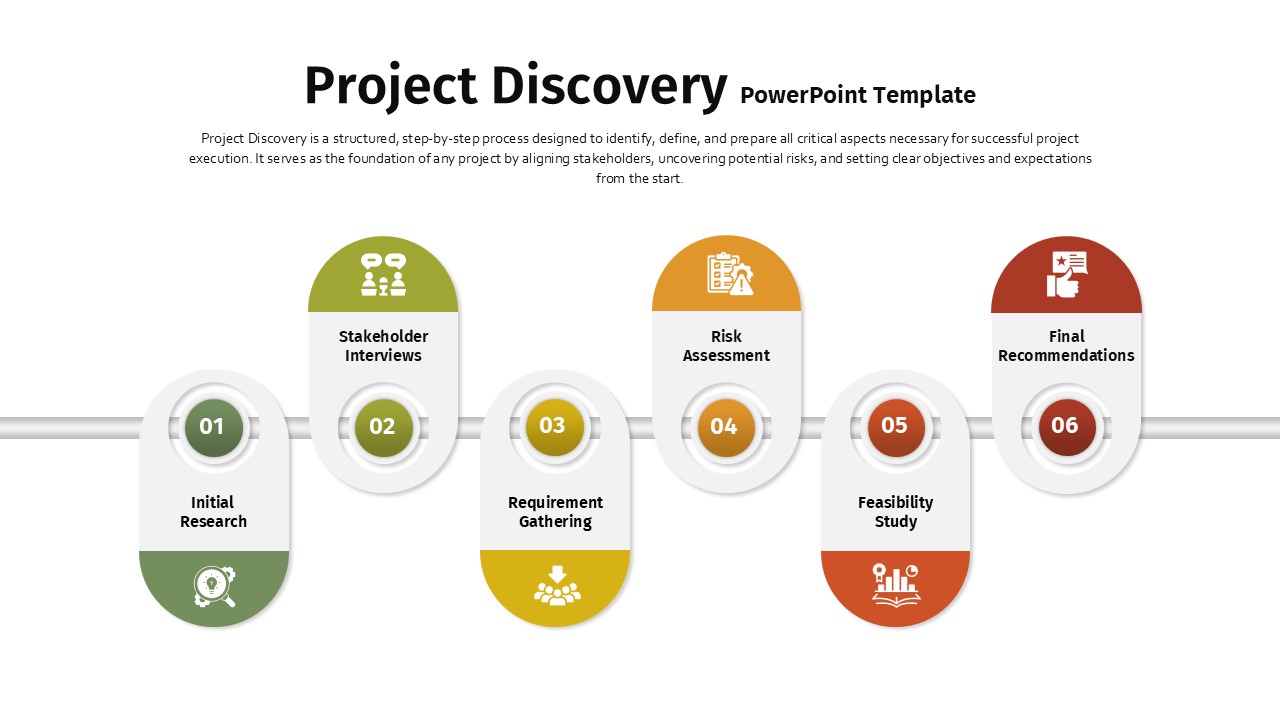
Project Discovery Infographic Pack Template for PowerPoint & Google Slides
Timeline
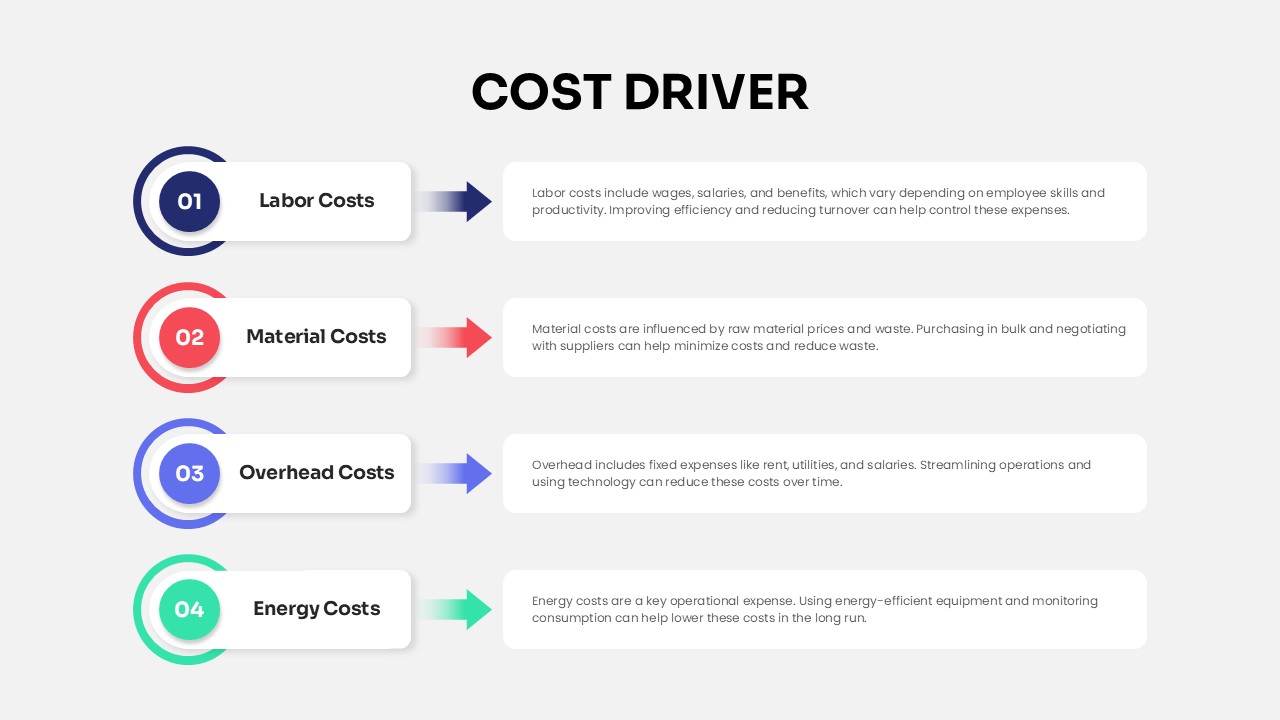
Cost Driver Infographic Slide Pack Template for PowerPoint & Google Slides
Process
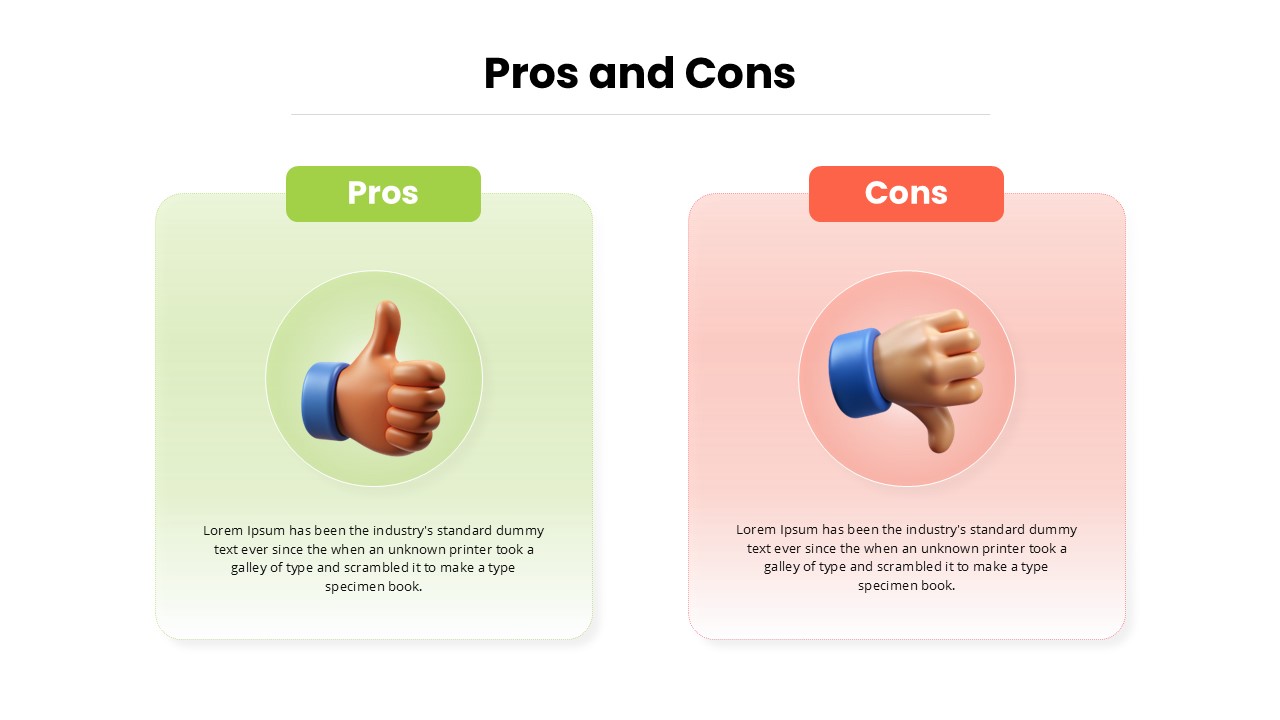
Pros and Cons Infographic Slide Pack Template for PowerPoint & Google Slides
Comparison
Emoji Scale PowerPoint Diagram for PowerPoint & Google Slides
Infographics

Scale Metaphor Metrics Comparison Template for PowerPoint & Google Slides
Charts
Mustard and Navy Balance Scale Metaphor Template for PowerPoint & Google Slides
Comparison
IQ Scale Analysis Diagram template for PowerPoint & Google Slides
Employee Performance
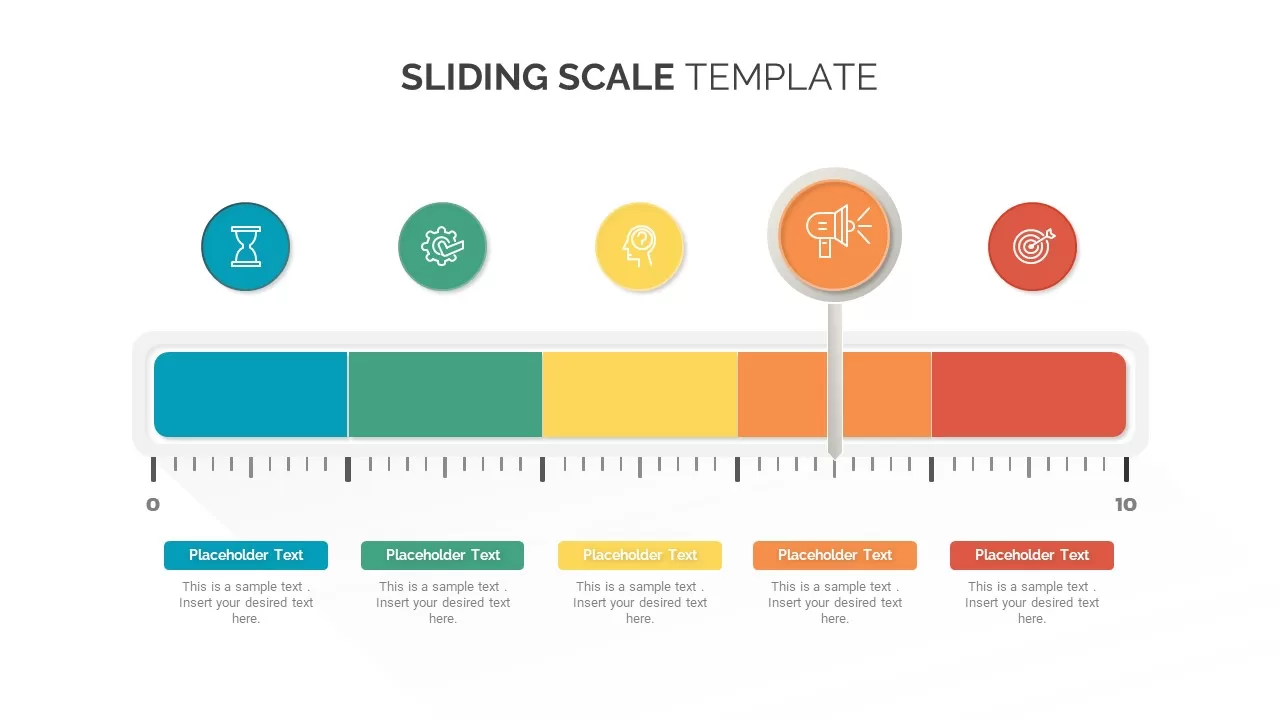
Sliding Scale template for PowerPoint & Google Slides
Business
Adam’s Equity Theory Scale Comparison Template for PowerPoint & Google Slides
Comparison
Economies of Scale Cost Curve Comparison Template for PowerPoint & Google Slides
Comparison Chart
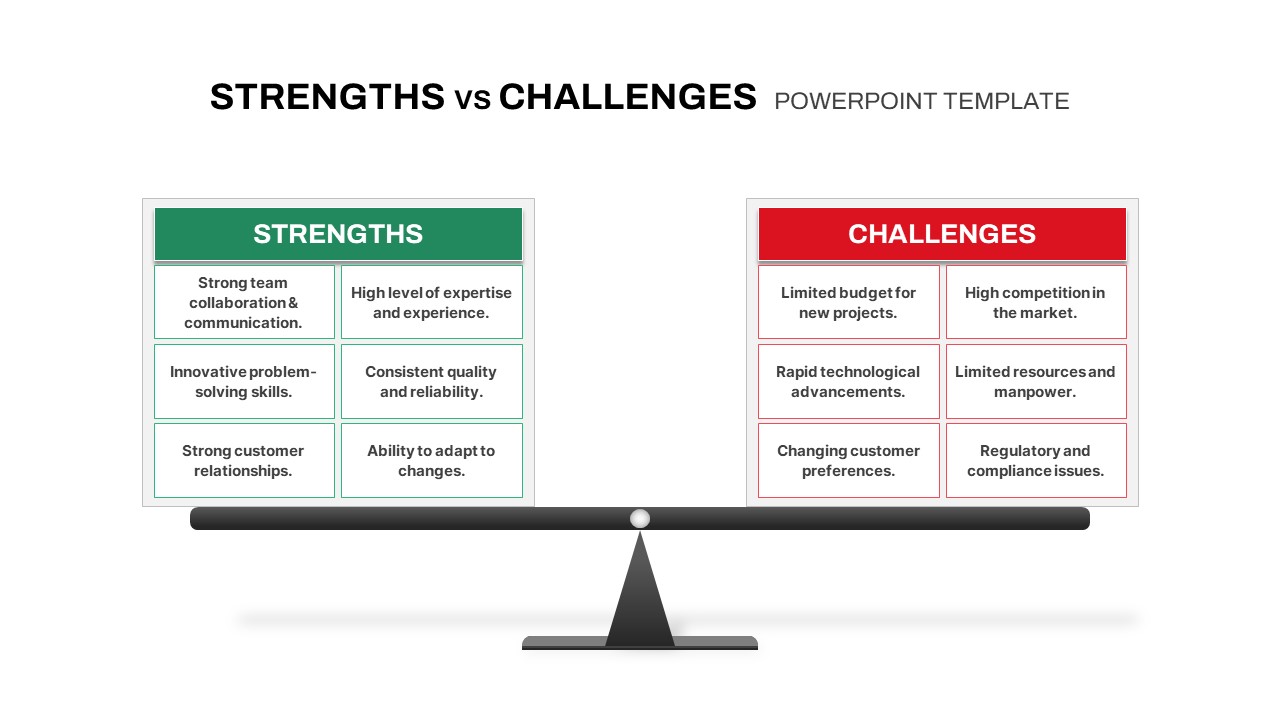
Strengths vs Challenges Weighing Scale Template for PowerPoint & Google Slides
Opportunities Challenges
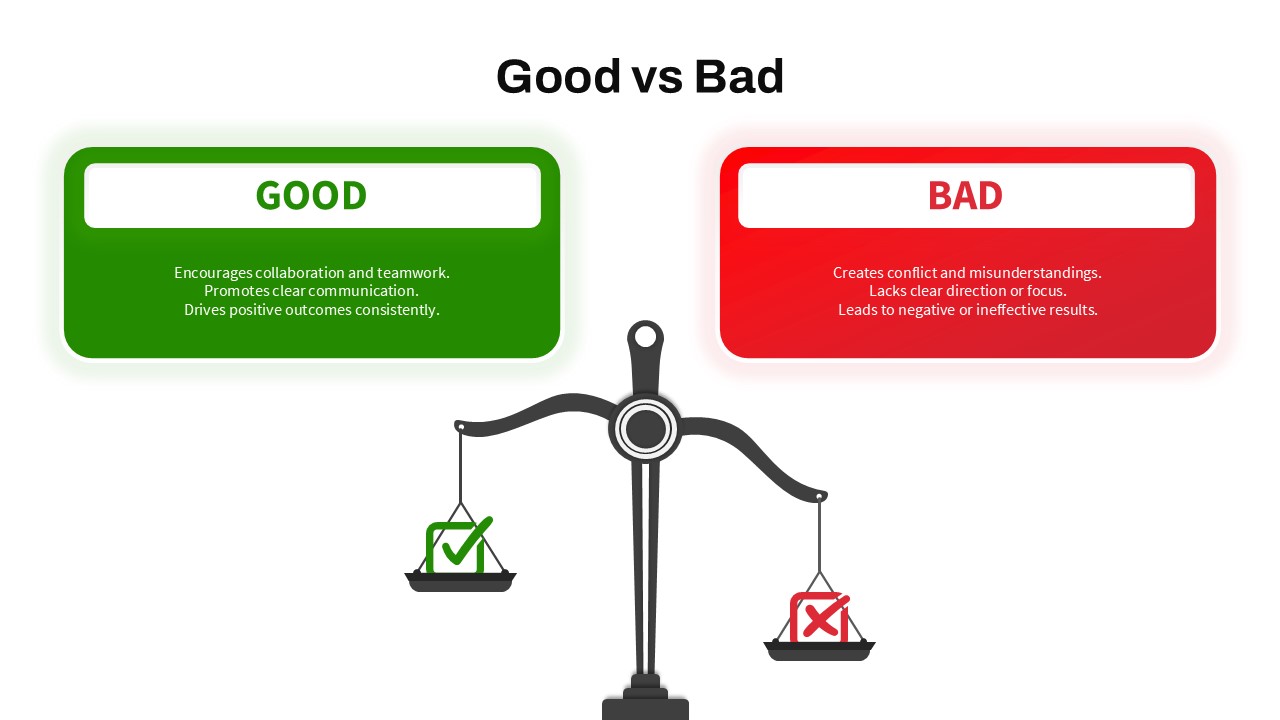
Good vs Bad Comparison with Scale Template for PowerPoint & Google Slides
Comparison
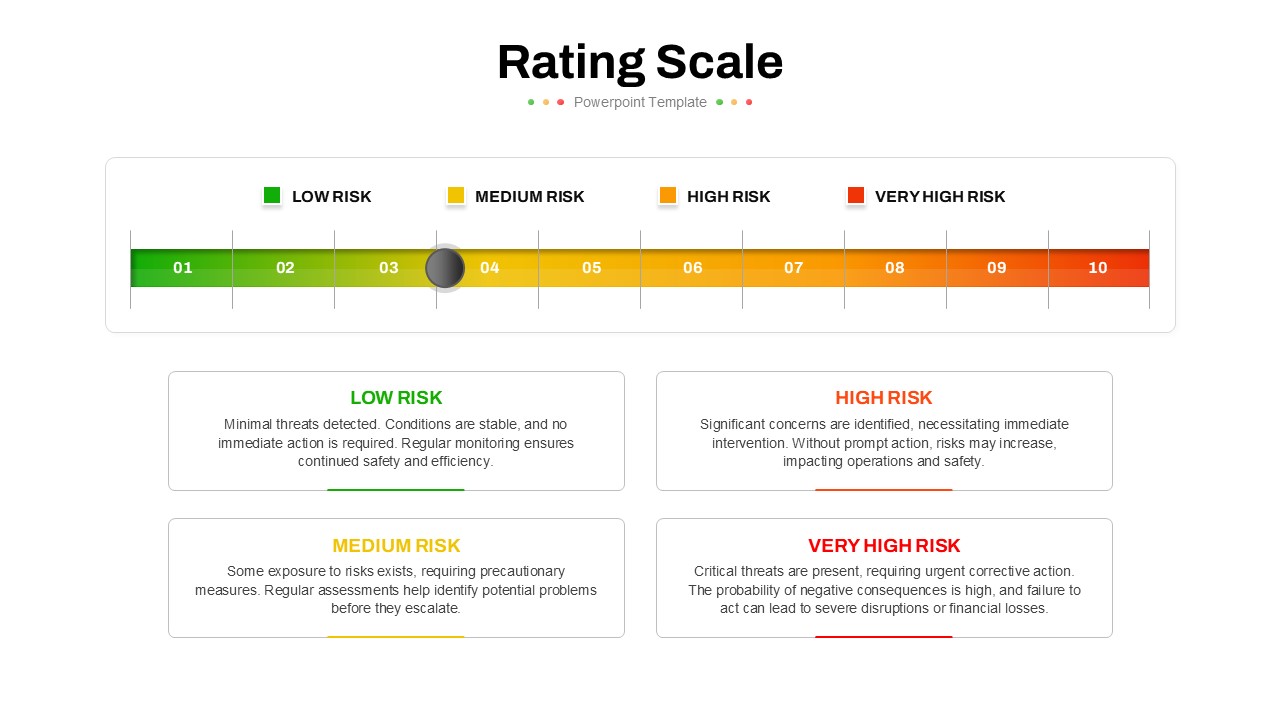
Five-Point Rating Scale Feedback Template for PowerPoint & Google Slides
Employee Performance
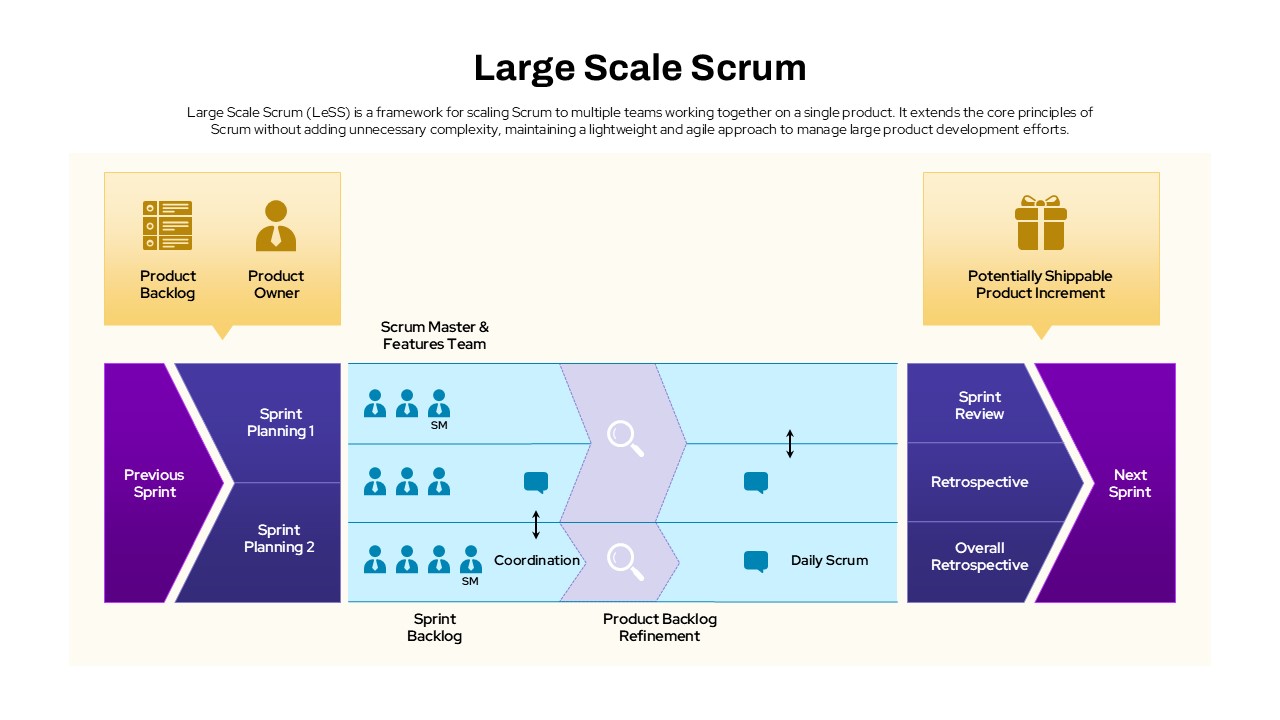
Large Scale Scrum Framework Process Template for PowerPoint & Google Slides
Scrum
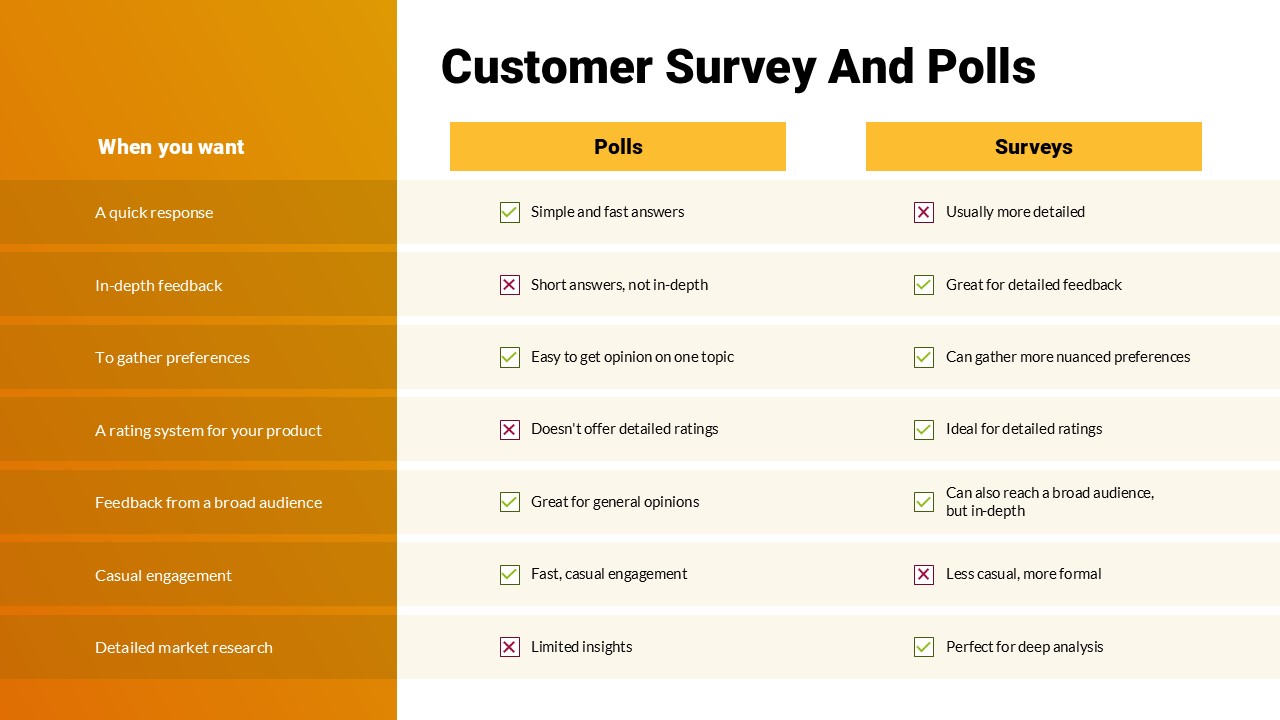
Customer Survey & Polls Comparison PowerPoint Template
Customer Experience
Snake Diagram Pack of 8 Slides template for PowerPoint & Google Slides
Process
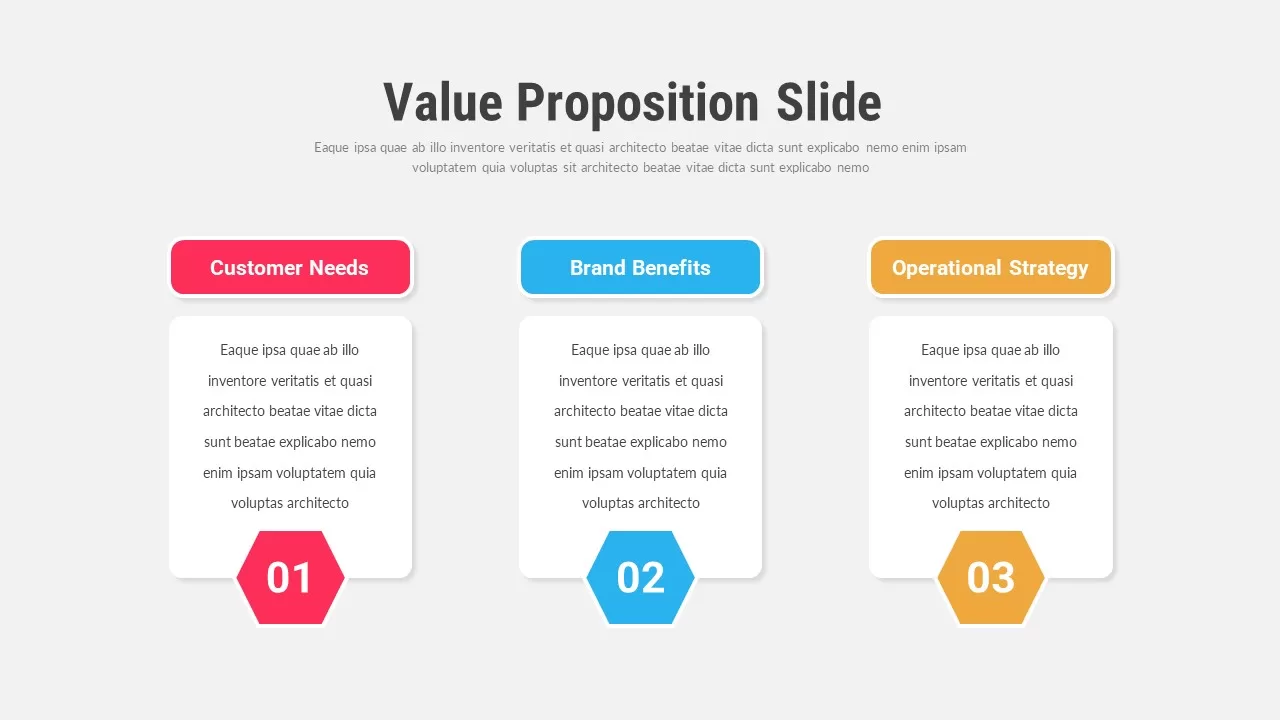
Value Proposition Slides Pack for PowerPoint & Google Slides
Infographics
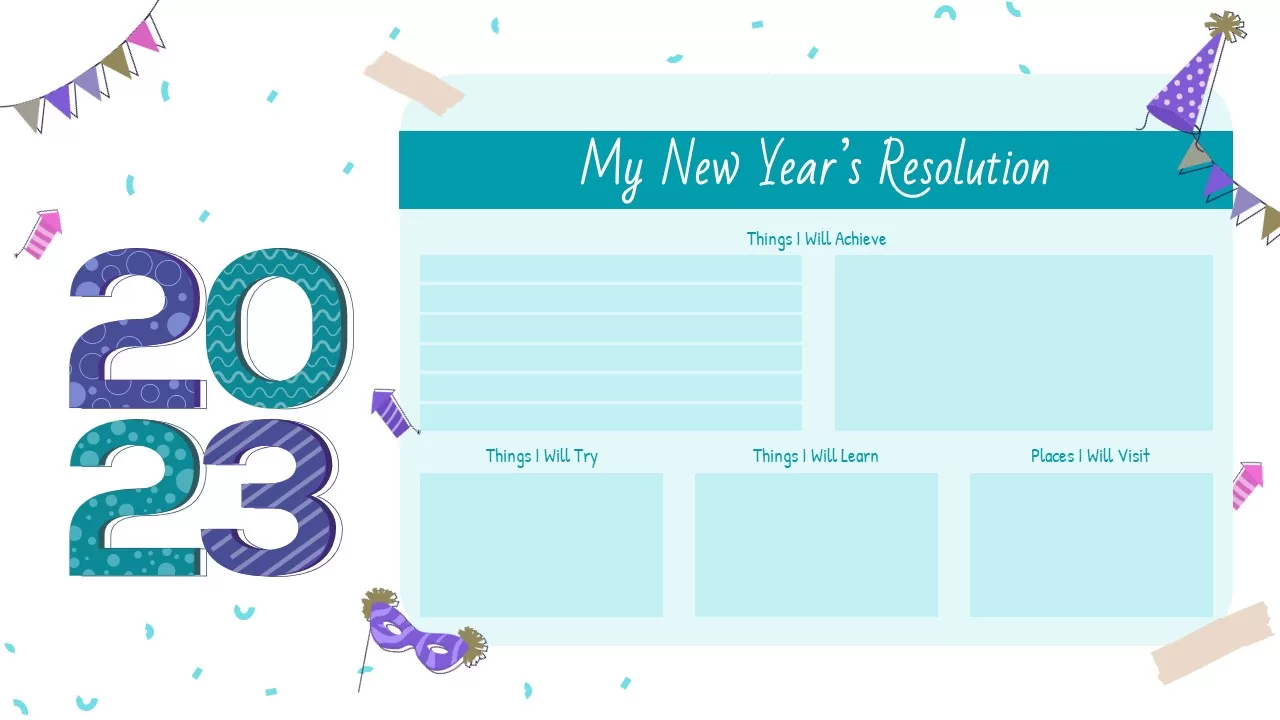
Free New Year’s Resolution Slides Pack for PowerPoint & Google Slides 2023
Graphics
Free
Acknowledgement Slides Pack Template for PowerPoint & Google Slides
Our Team
Free Professional Gantt Chart Pack – 4 Slides Template for PowerPoint & Google Slides
Gantt Chart
Free
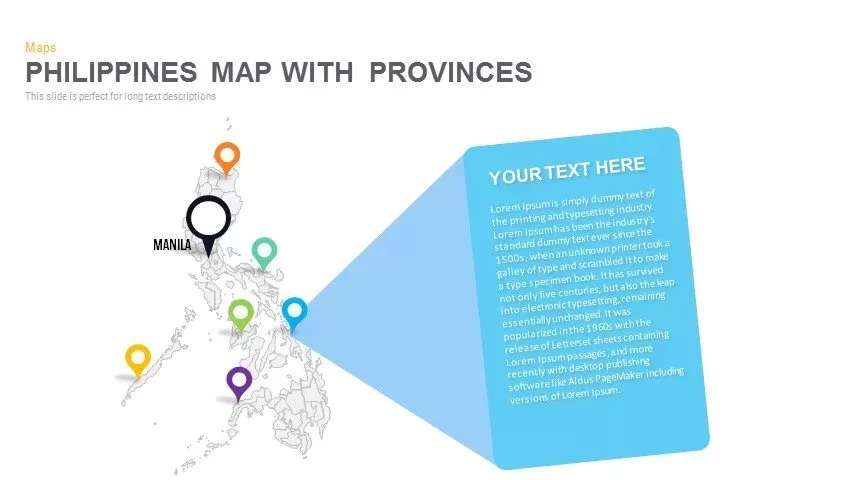
Philippines Map with Provinces Pack Template for PowerPoint & Google Slides
Maps
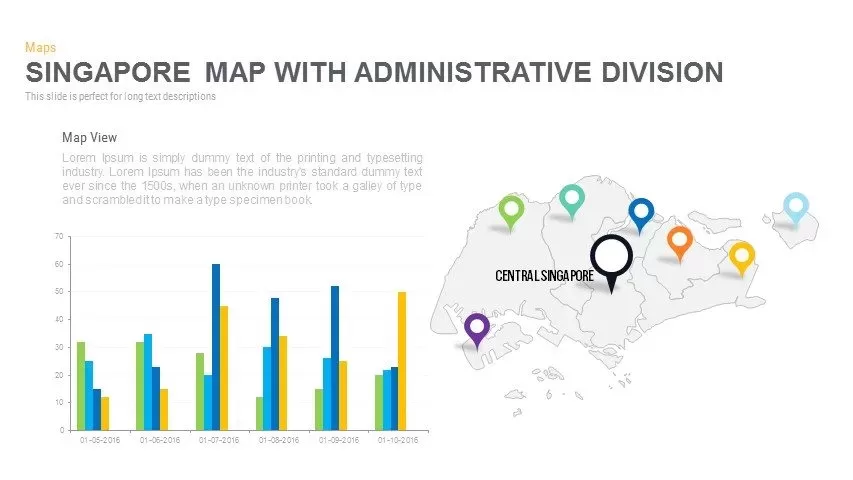
Singapore Map Pack Template for PowerPoint & Google Slides
Maps
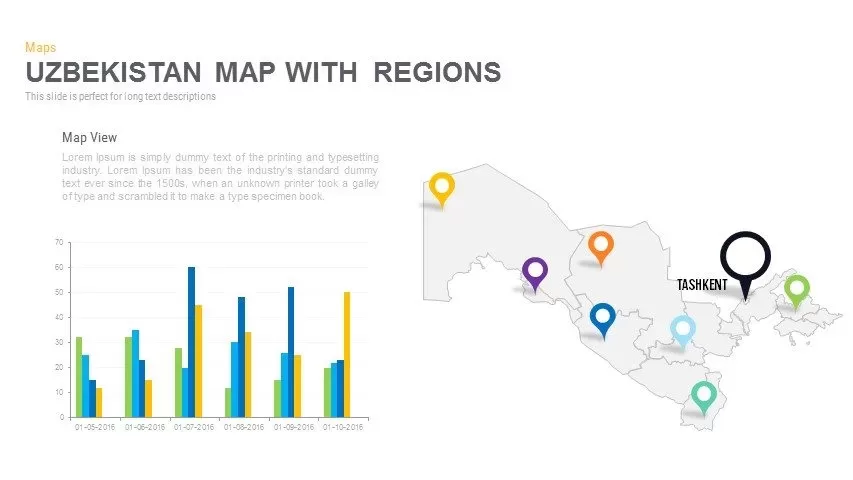
Uzbekistan Map with Regions Pack Template for PowerPoint & Google Slides
Maps
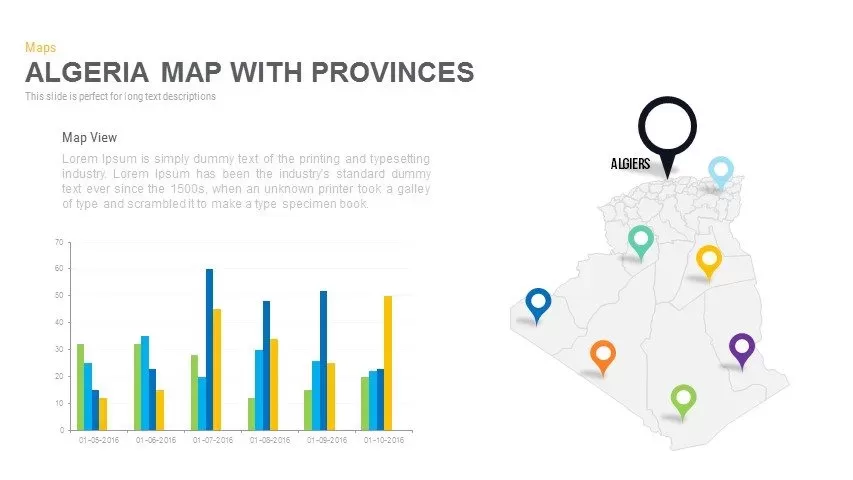
Algeria Map with Provinces Pack Template for PowerPoint & Google Slides
Maps
Angola Provinces Map Slide Pack Template for PowerPoint & Google Slides
World Maps
Chad Map with Regions Slide Pack Template for PowerPoint & Google Slides
World Maps
DR Congo Prefecture Map Slide Pack Template for PowerPoint & Google Slides
World Maps
Egypt Regional Map Slide Pack Template for PowerPoint & Google Slides
World Maps
Ethiopia Map with Regions Slide Pack Template for PowerPoint & Google Slides
World Maps
Iran Map with Provinces Slide Pack Template for PowerPoint & Google Slides
World Maps
Interactive Iraq Map with Governorates Slide Pack for PowerPoint & Google Slides
World Maps
Zimbabwe Map with Provinces Slide Pack Template for PowerPoint & Google Slides
World Maps
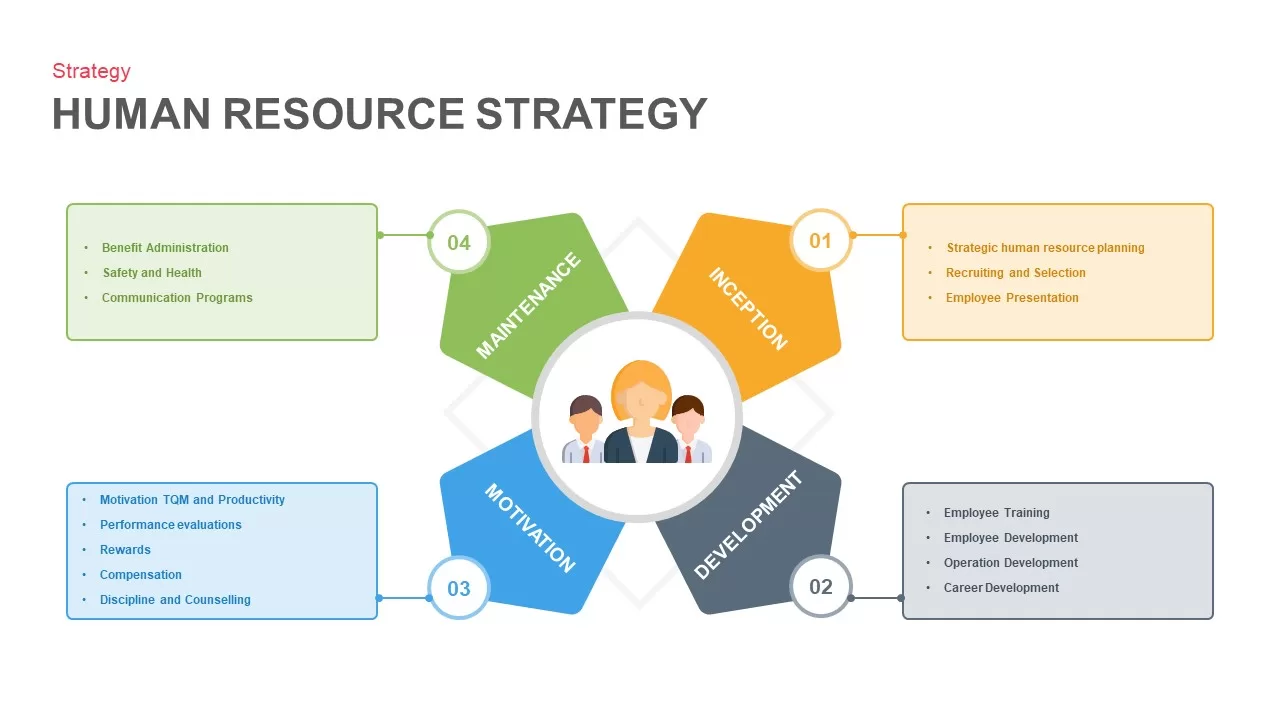
Human Resource Strategy Model Pack Template for PowerPoint & Google Slides
HR
4-Stage Agenda Slide Pack Template for PowerPoint & Google Slides
Agenda
Communication Plan Outline Template Pack for PowerPoint & Google Slides
Infographics
Balanced Scorecard Strategy Map Diagram Pack for PowerPoint & Google Slides
Business Strategy
Business Model Spectrum Diagram Pack for PowerPoint & Google Slides
Business Models
Opposing Ideas Infographics Pack Template for PowerPoint & Google Slides
Comparison
Market Segmentation & STP Infographics Pack Template for PowerPoint & Google Slides
Marketing
Business Growth Plant Infographics Pack Template for PowerPoint & Google Slides
Process
Theory of Change Infographics Pack Template for PowerPoint & Google Slides
Process
Career Development Plan Infographics Pack for PowerPoint & Google Slides
Infographics
Competitive Landscape Comparison Template Pack for PowerPoint & Google Slides
Comparison
Quiet Quitting Infographics Pack for PowerPoint & Google Slides
Employee Performance
Free
Newspaper Template Pack for PowerPoint & Google Slides
Business Proposal
Free Veterans Day Patriotic Slide Pack Template for PowerPoint & Google Slides
Graphics
Free
Business Icon Pack Template for PowerPoint & Google Slides
Graphics
Sprint Review Process Infographics Pack Template for PowerPoint & Google Slides
Infographics
Flywheel Infographics Pack Template for PowerPoint & Google Slides
Circular
Free Colorful Animal 2024 Calendar Slide Pack Template for PowerPoint & Google Slides
Infographics
Free
Agile Project Roadmap Timeline Template Pack for PowerPoint & Google Slides
Scrum
Agile Transformation Roadmap Slide Pack Template for PowerPoint & Google Slides
Roadmap
Free Law Infographics Slide Pack Collection Template for PowerPoint & Google Slides
Infographics
Free
Versatile Startup Roadmap Slide Pack Template for PowerPoint & Google Slides
Timeline
Comprehensive RAID Log Slide Pack Template for PowerPoint & Google Slides
Project
Looking Ahead 3-Slide Infographics Pack Template for PowerPoint & Google Slides
Business
Business Development Framework Pack Template for PowerPoint & Google Slides
Business Strategy