KPI Presentation Templates for PowerPoint and Google Slides
![]() Filter
Filter
Filter
-

Project Status Dashboard with RAG Legend Template for PowerPoint & Google Slides
Project Status
-

Project Status Template Dashboard with Gauge for PowerPoint & Google Slides
Project Status
-
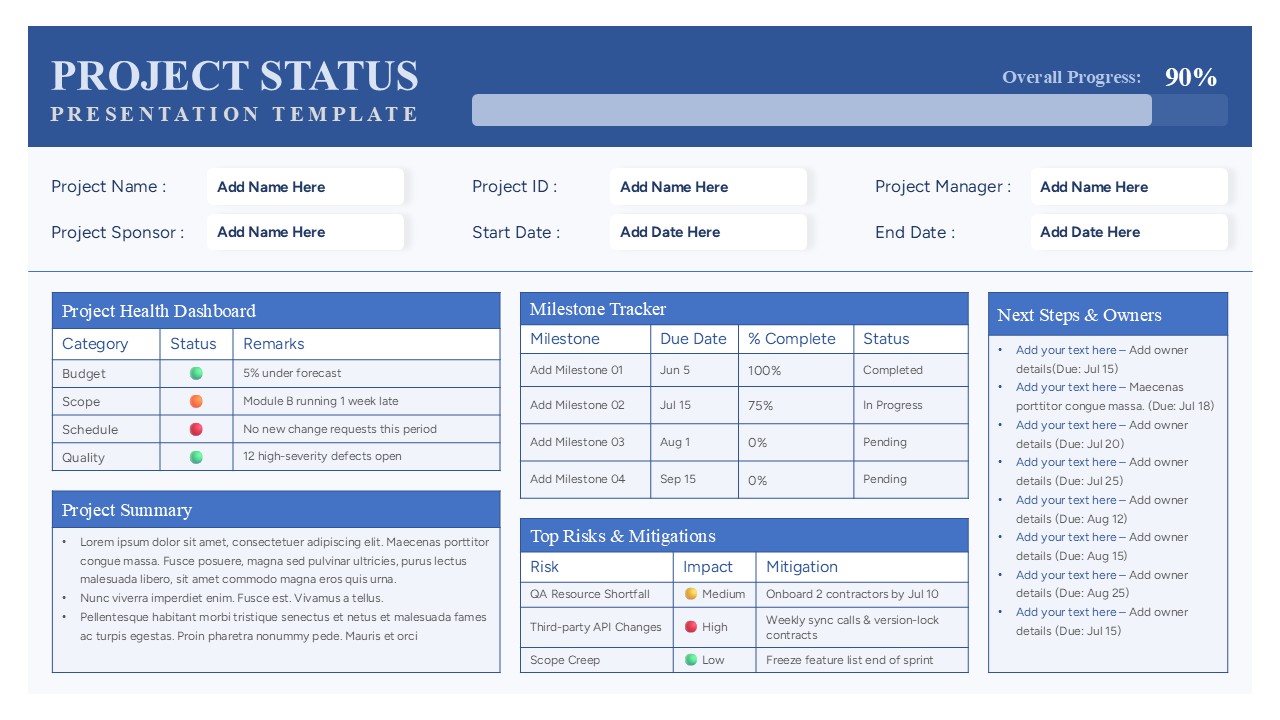
Comprehensive Project Status Report Template for PowerPoint & Google Slides
Project Status
-

Cohort Analysis Retention Dashboard Template for PowerPoint & Google Slides
Comparison Chart
-
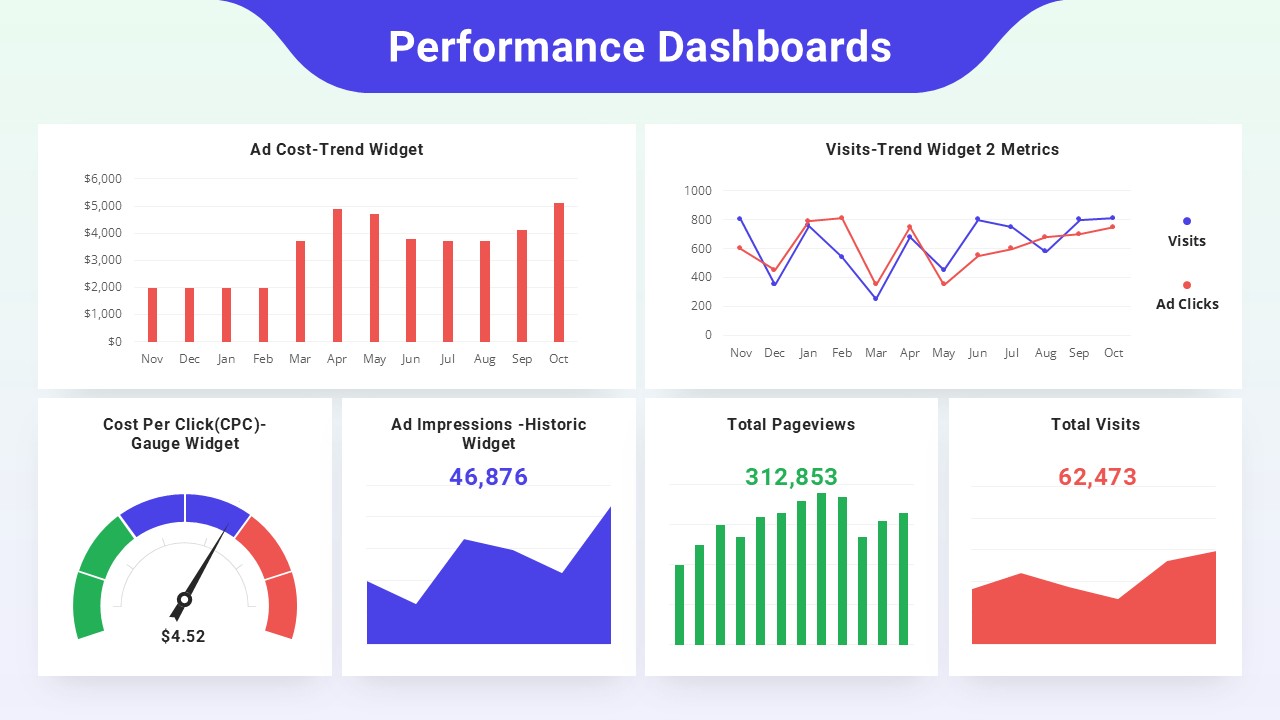
Performance Dashboards Overview Template for PowerPoint & Google Slides
Business Report
-
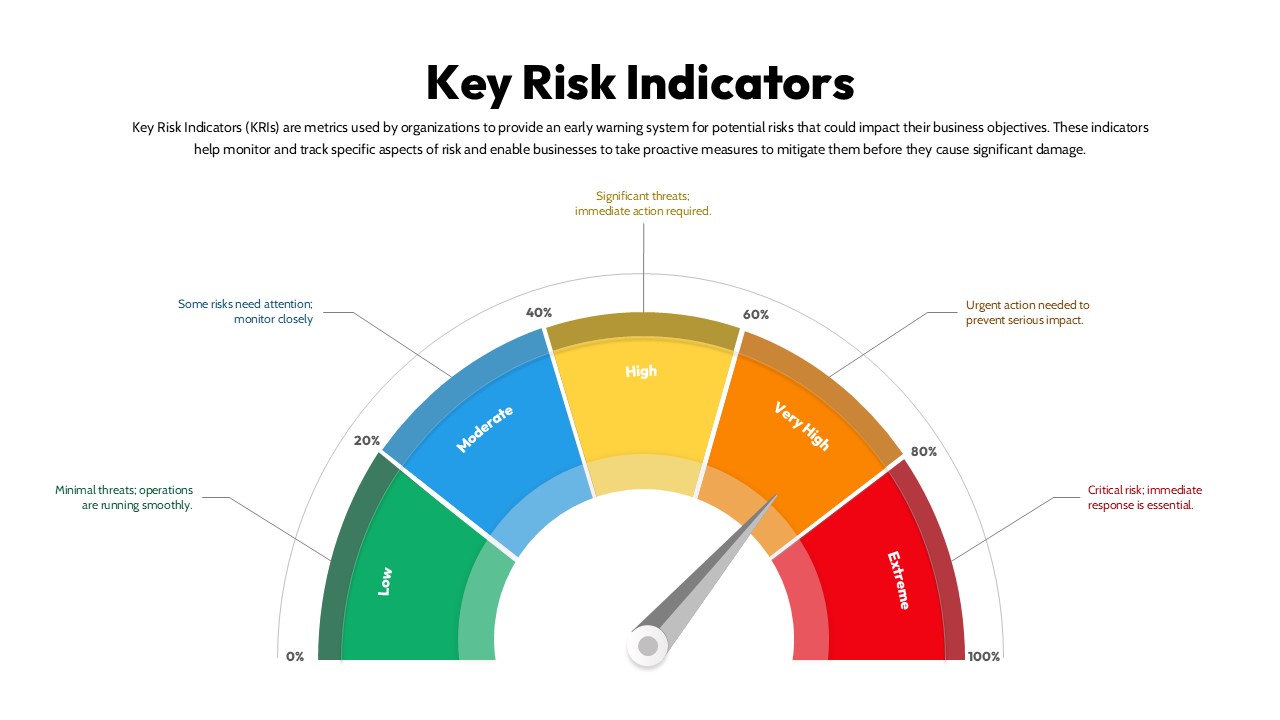
Key Risk Indicators (KRI) Gauge Template for PowerPoint & Google Slides
Risk Management
-

Patient-Satisfaction KPI Dashboard for PowerPoint & Google Slides
Business
-
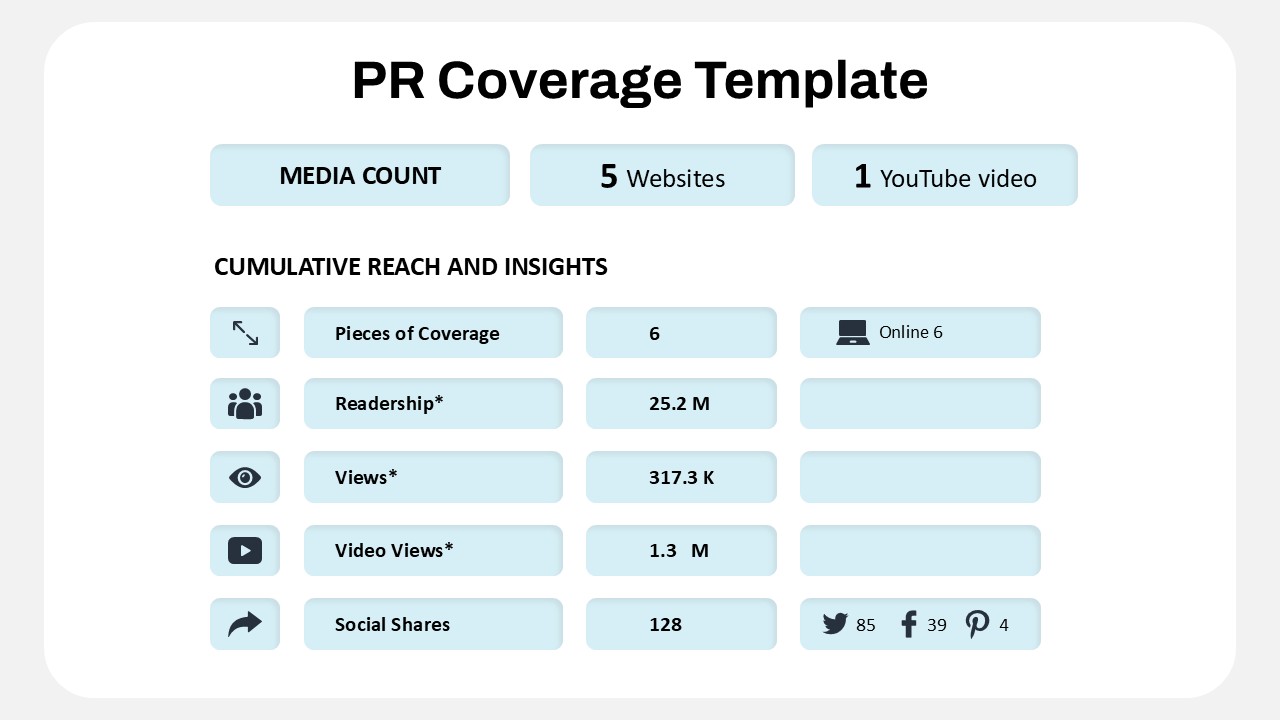
Public Relations Coverage Metrics Template for PowerPoint & Google Slides
Business Report
-

Turnover Analysis Dashboard Template for PowerPoint & Google Slides
Employee Performance
-

Employee Performance Metrics Dashboard Template for PowerPoint & Google Slides
Employee Performance
-

Digital Marketing KPIs Dashboard Dark Template for PowerPoint & Google Slides
Business Report
-
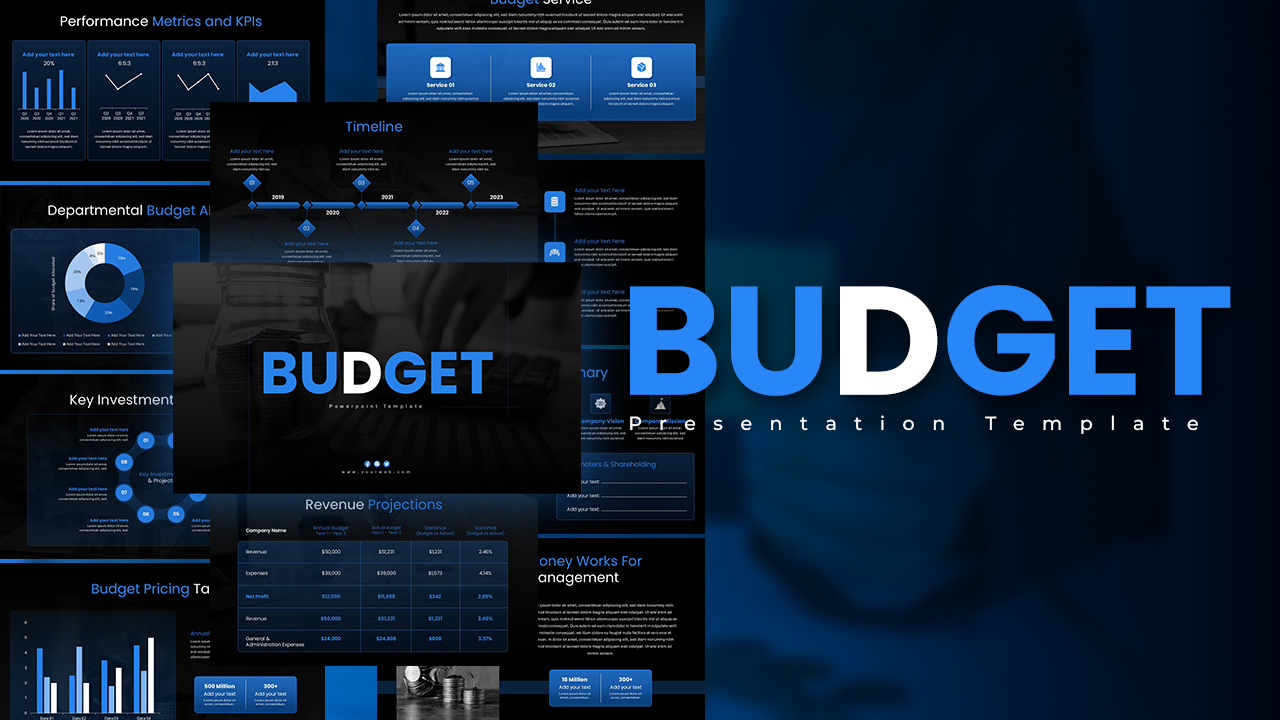
Engaging Dark Blue Budget Presentation Template for PowerPoint & Google Slides
Pitch Deck
-
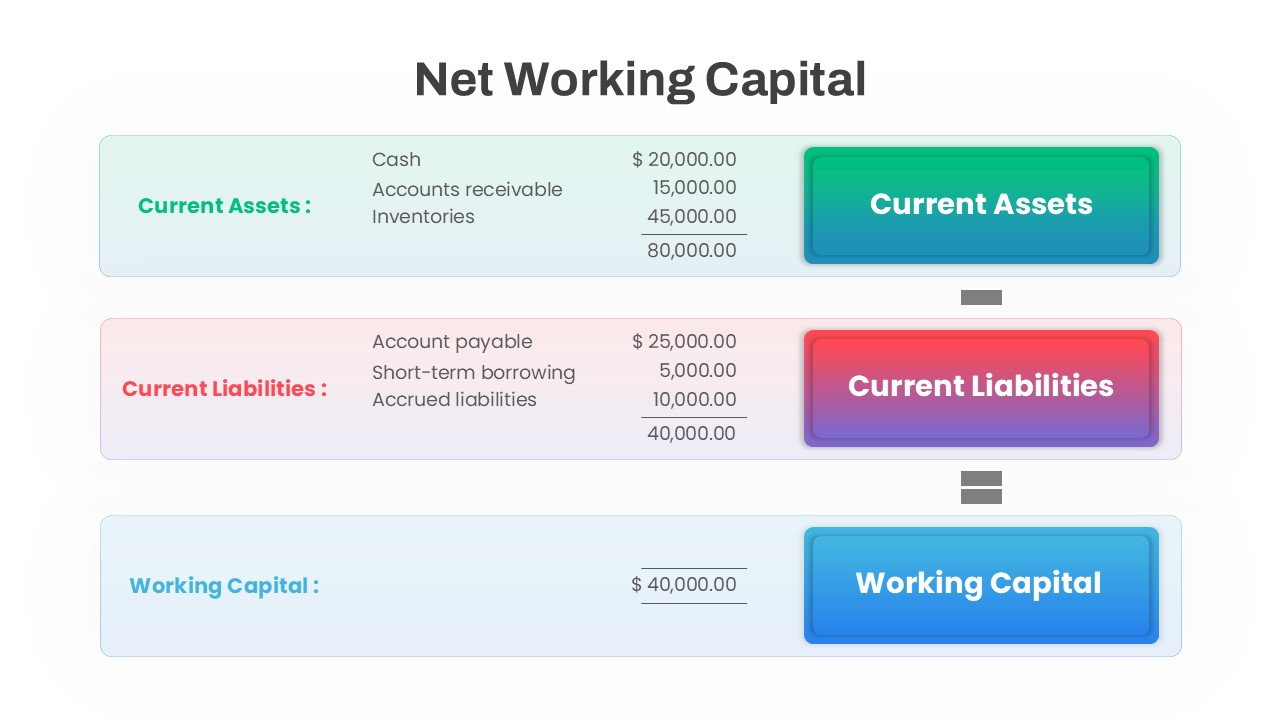
Net Working Capital Calculation Template for PowerPoint & Google Slides
Finance
-
Professional Animated Sales Presentation Template for PowerPoint & Google Slides
Pitch Deck
-
Budget Forecast Dashboard & Donut Charts Template for PowerPoint & Google Slides
Pie/Donut
-
Market Validation Metrics Overview Template for PowerPoint & Google Slides
Business
-
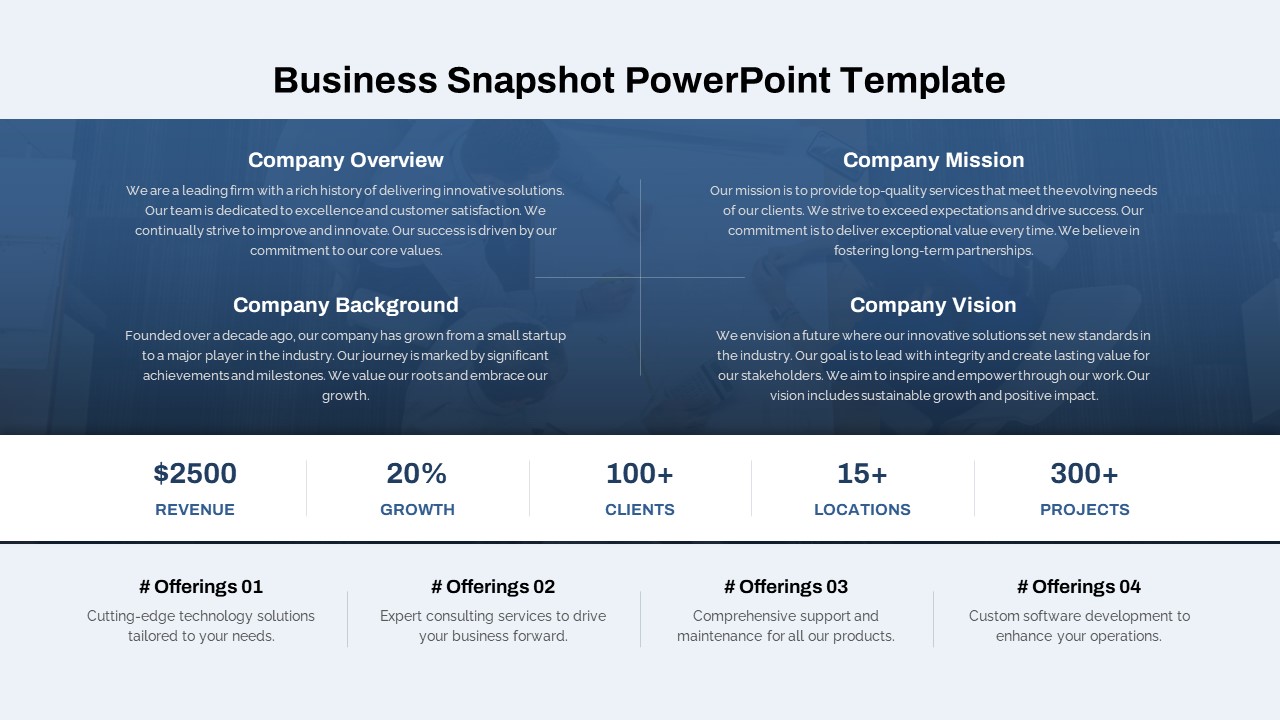
Modern Business Snapshot Overview Template for PowerPoint & Google Slides
Business Report
-
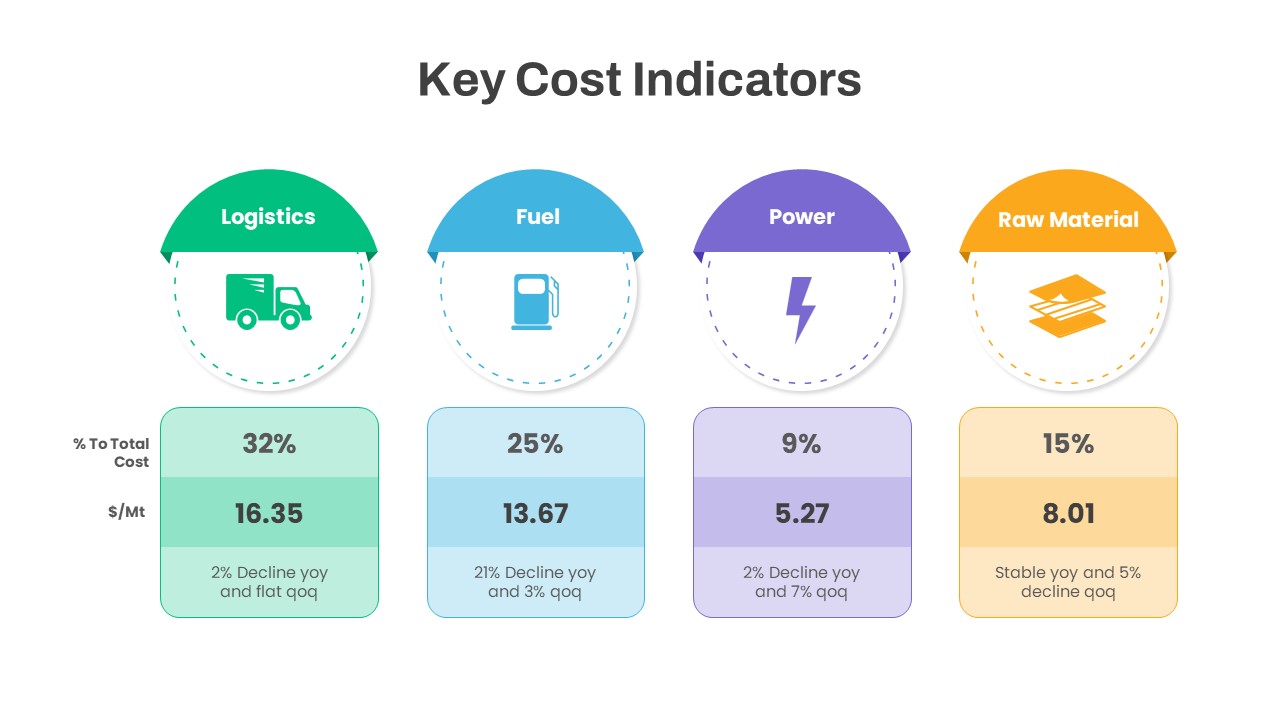
Key Cost Indicators Infographic Template for PowerPoint & Google Slides
Finance
-
Monthly Sales Performance Dashboard Template for PowerPoint & Google Slides
Charts
-
Project Progress Dashboard Pie Charts Template for PowerPoint & Google Slides
Project
-
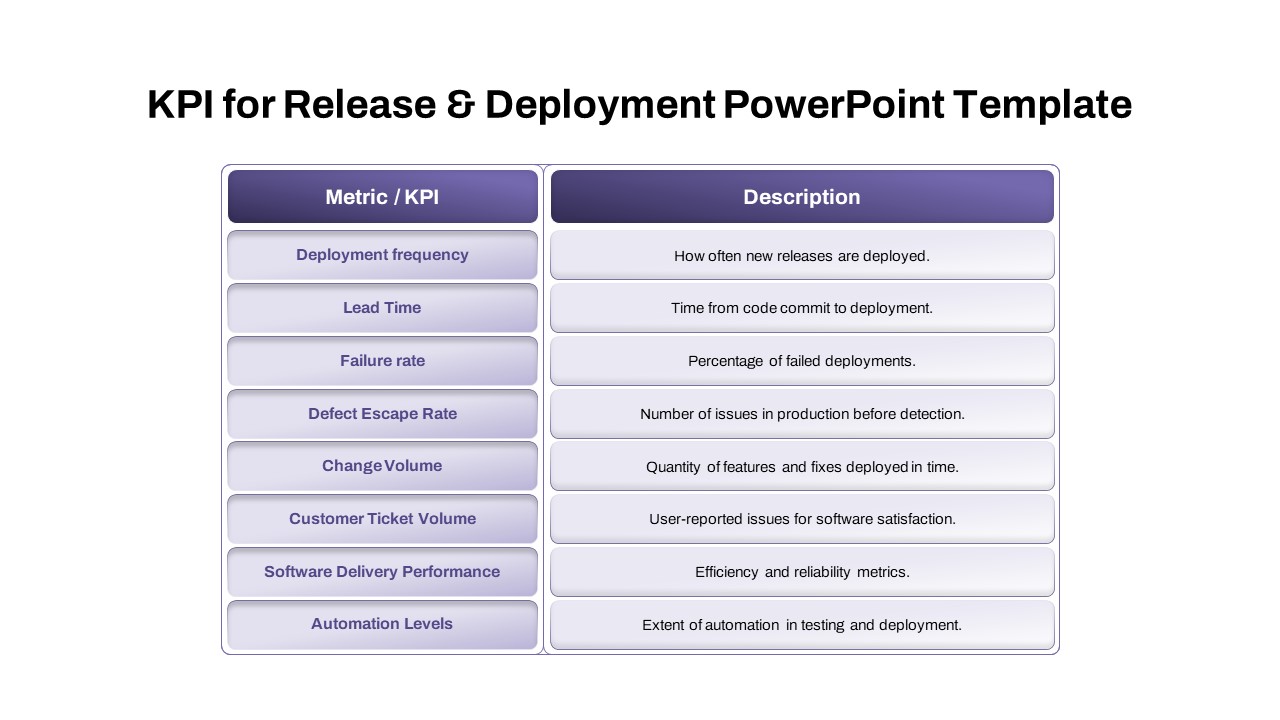
Comprehensive Release & Deployment KPI Template for PowerPoint & Google Slides
Software Development
-
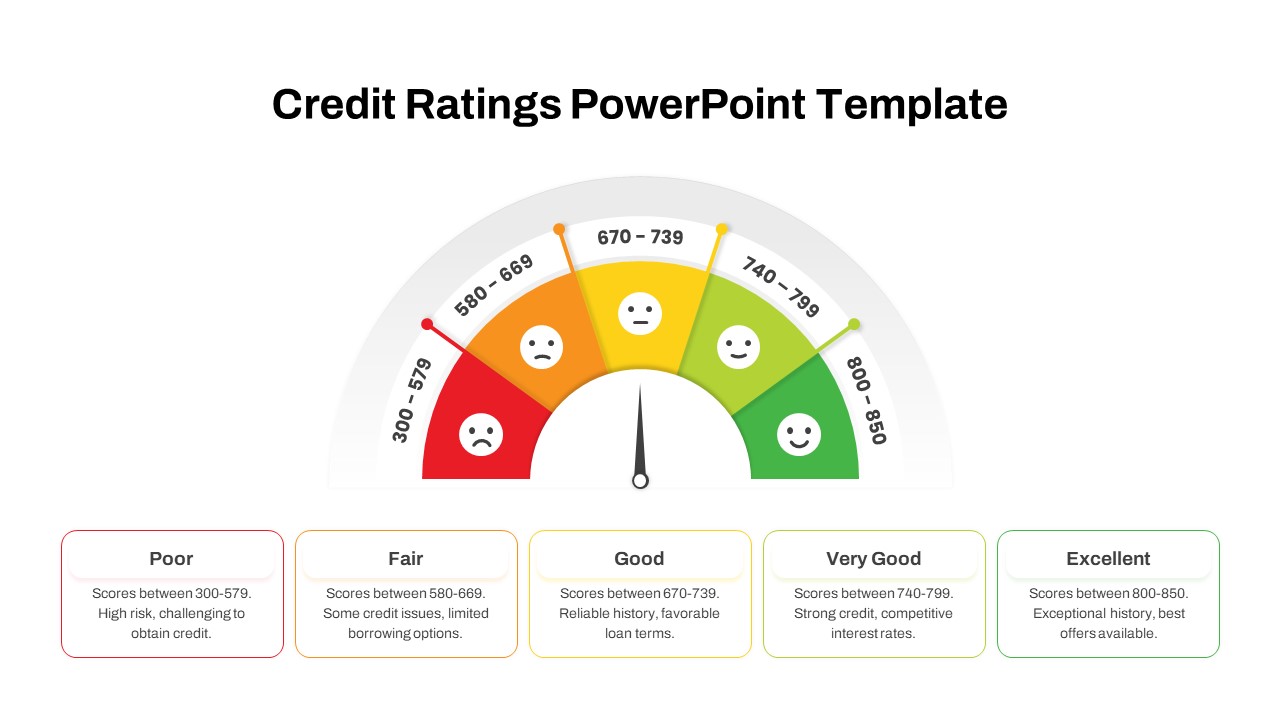
Credit Ratings Gauge Infographic Template for PowerPoint & Google Slides
Circular
-
Procurement KPI Dashboard & Metrics Template for PowerPoint & Google Slides
Business Report
-
Financial Snapshot & Metrics Overview Template for PowerPoint & Google Slides
Finance
-
Purchasing KPI Metrics Dashboard Template for PowerPoint & Google Slides
Business Report
-
DevOps KPI Dashboard Performance Metrics Template for PowerPoint & Google Slides
Software Development
-
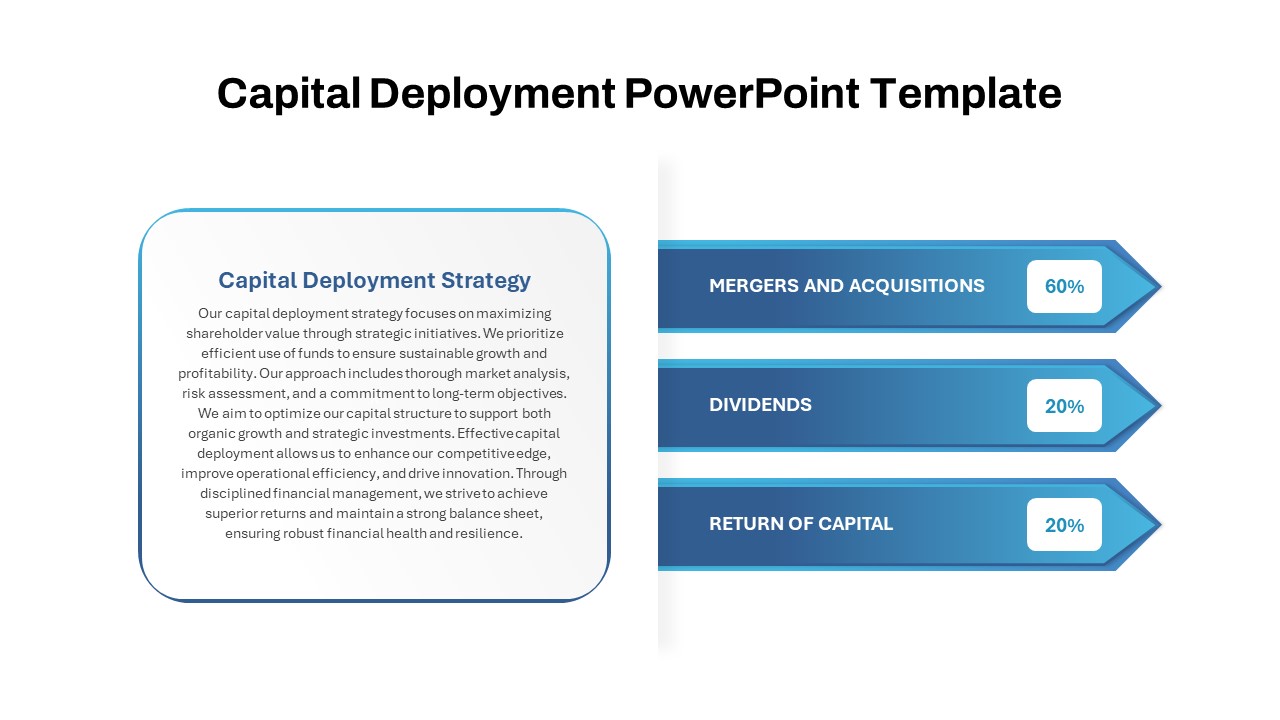
Capital Deployment Percentage Breakdown Template for PowerPoint & Google Slides
Pitch Deck
-
Monthly Business Review Dashboard Deck Template for PowerPoint & Google Slides
Business Report
-
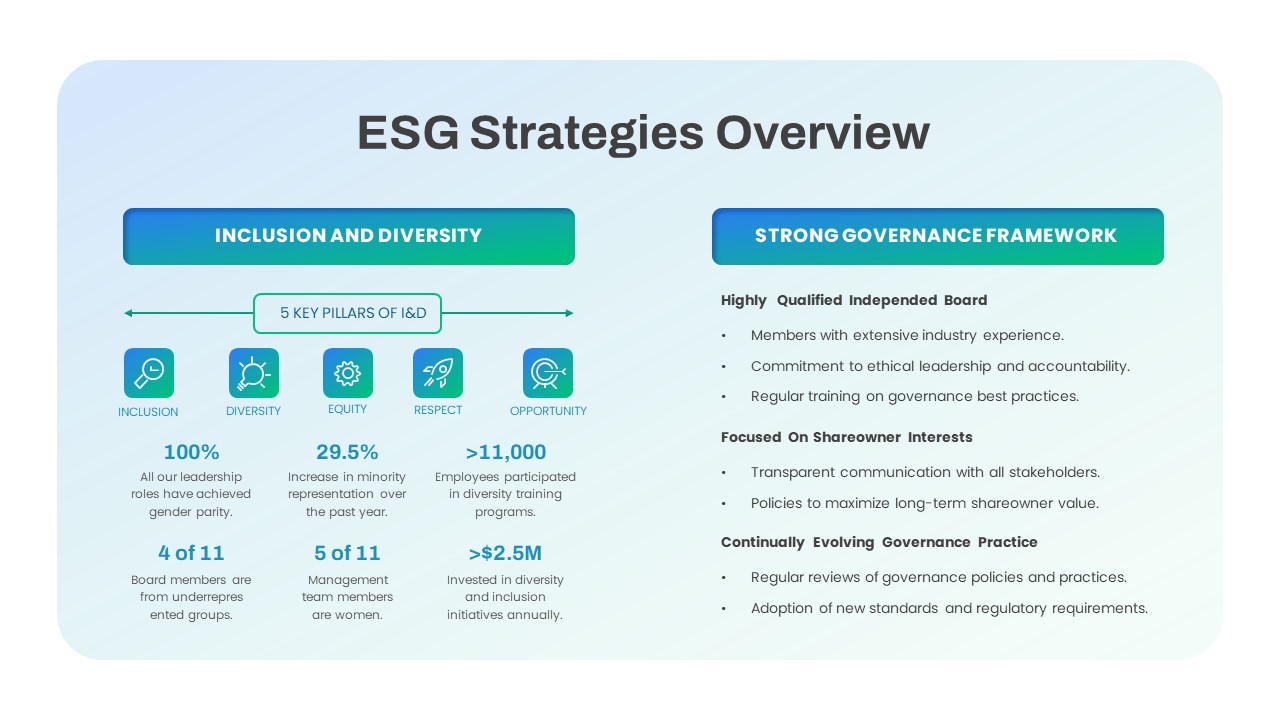
Comprehensive ESG Strategies Overview Template for PowerPoint & Google Slides
Infographics
-

Quarterly Net Interest Income Growth Template for PowerPoint & Google Slides
Bar/Column
-
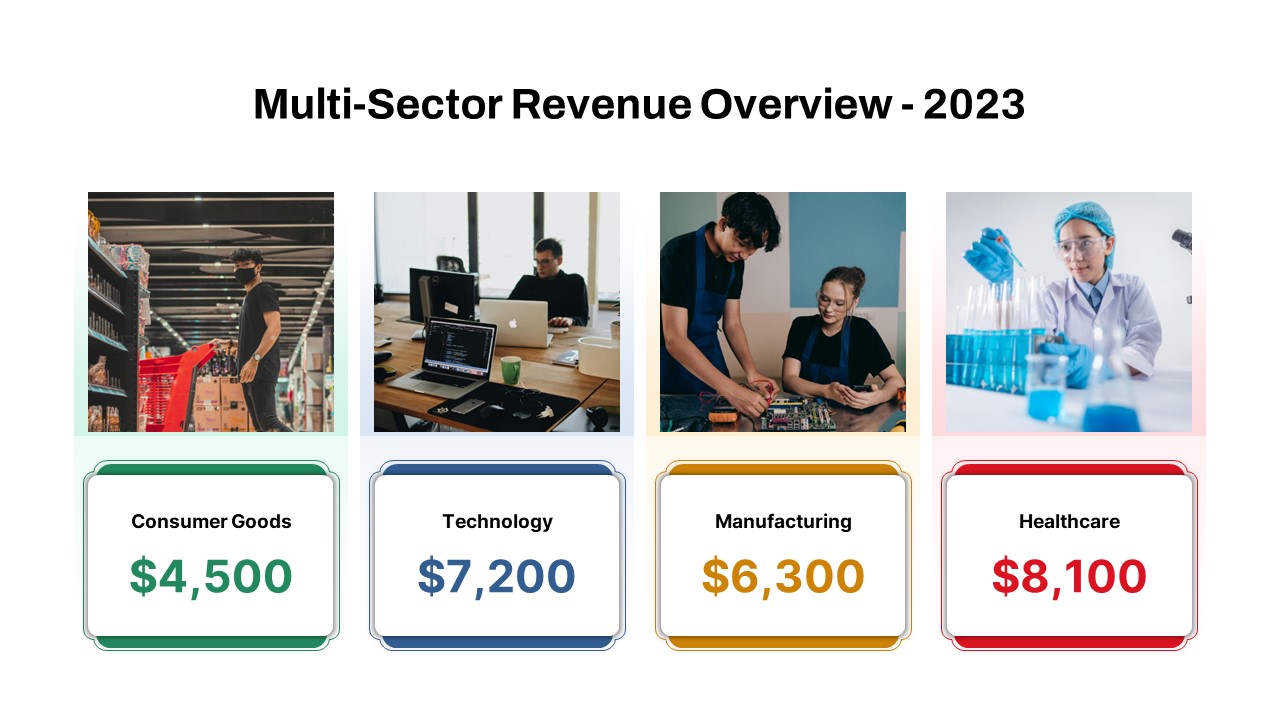
Multi-Sector Revenue Breakdown Cards Template for PowerPoint & Google Slides
Comparison
-
Quarterly Business Review Dashboard Template for PowerPoint & Google Slides
Pitch Deck
-
Quarterly Network Volume Analysis Template for PowerPoint & Google Slides
Business Report
-
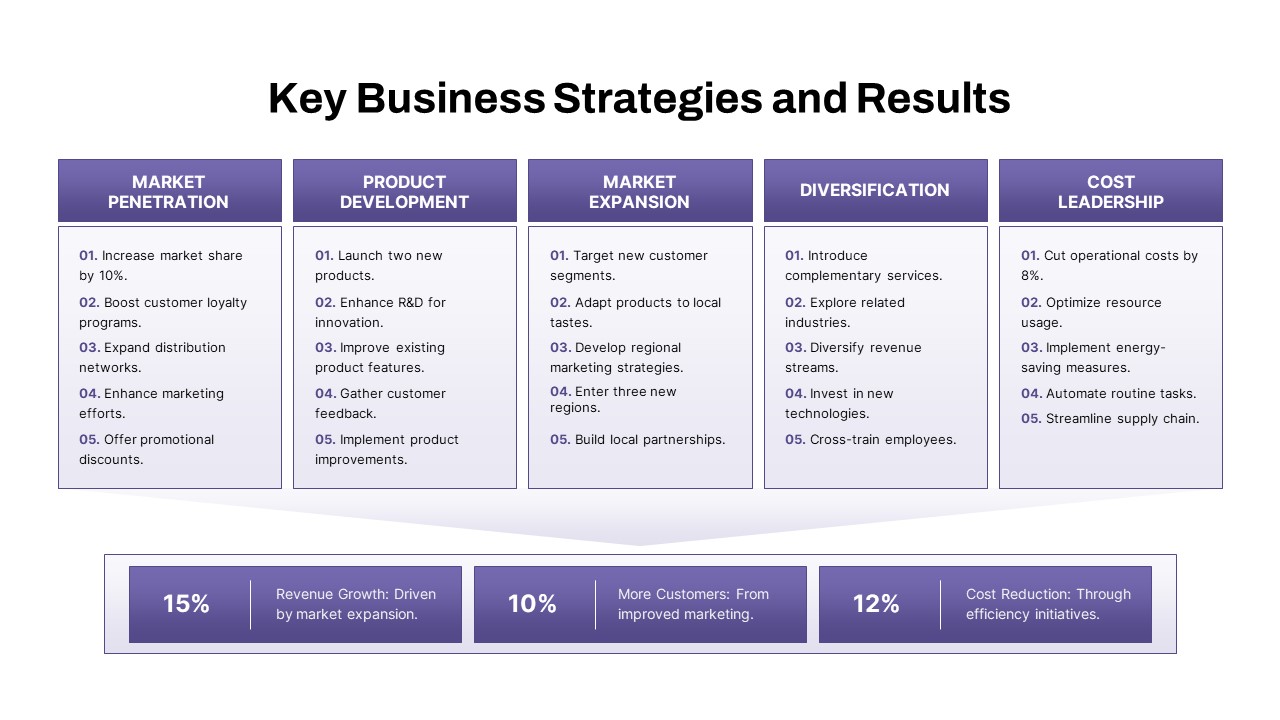
Key Business Strategies and Results Template for PowerPoint & Google Slides
Business Strategy
-
Banking Financial Overview Dashboard Template for PowerPoint & Google Slides
Finance