KPI Tree OEE Breakdown Template for PowerPoint & Google Slides

Description
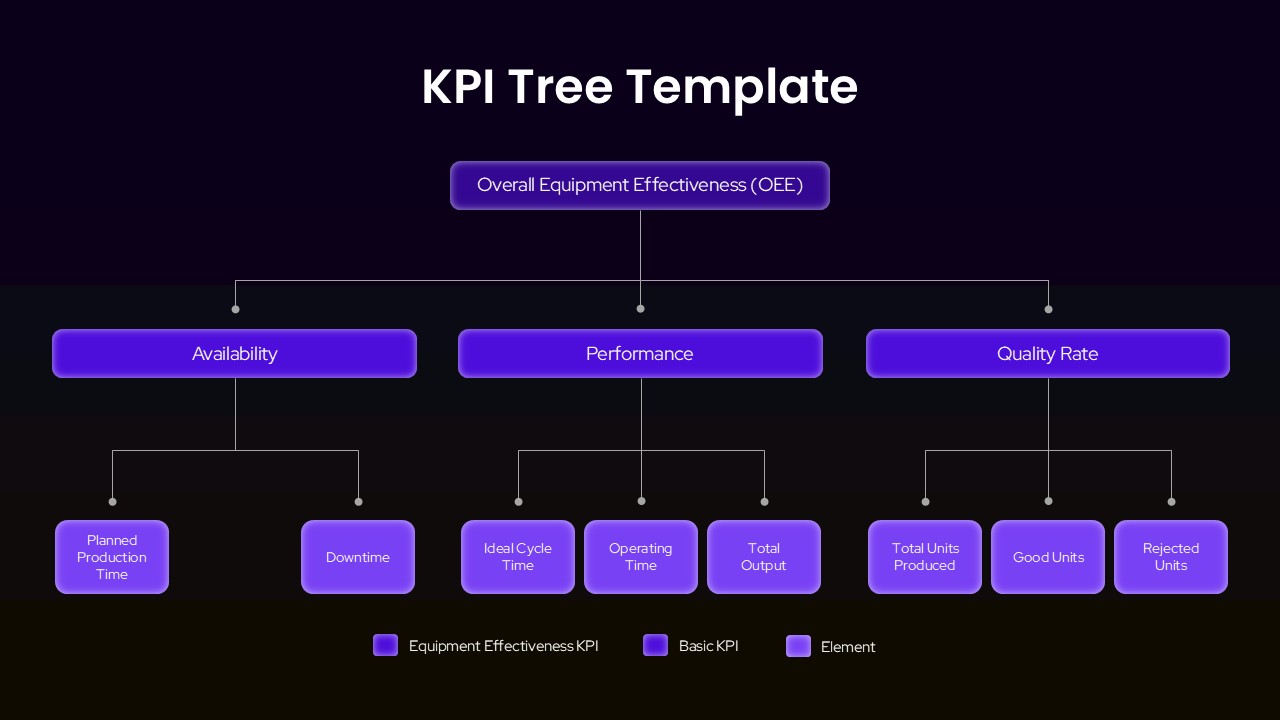
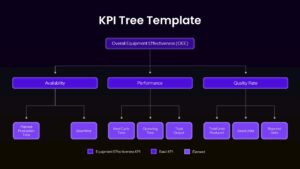
Visualize your manufacturing performance metrics using this KPI Tree OEE Breakdown Template. The slide presents a clean three-level hierarchical tree diagram that decomposes Overall Equipment Effectiveness into its fundamental pillars: Availability, Performance, and Quality Rate. Each pillar branches further into actionable sub-elements including Planned Production Time, Downtime, Ideal Cycle Time, Operating Time, Total Output, Total Units Produced, Good Units, and Rejected Units.
Designed with a professional purple gradient color scheme, the template uses distinct shading across three hierarchy levels for immediate visual clarity. A built-in color-coded legend distinguishes Equipment Effectiveness KPIs, Basic KPIs, and Elements at a glance. The set includes both light and dark theme variants, ensuring seamless integration with any presentation style or viewing environment.
Who is it for
This template is built for operations managers, manufacturing engineers, lean Six Sigma practitioners, quality assurance professionals, and business analysts who need to present KPI hierarchies with precision. Production supervisors and continuous improvement leaders will find it essential for performance reviews, strategy sessions, and team training workshops.
Other Uses
Beyond OEE analysis, repurpose this KPI tree structure for financial metric breakdowns, sales performance hierarchies, supply chain efficiency mapping, customer satisfaction decomposition, or any business scenario that demands clear visualization of how top-level objectives connect to granular operational metrics.
Frequently Asked Questions
What is a KPI Tree and how does it work?
Can I customize the OEE metrics?
Login to download this file

Item ID
SB05795Designed By
Naseeba Sithara
Related Templates

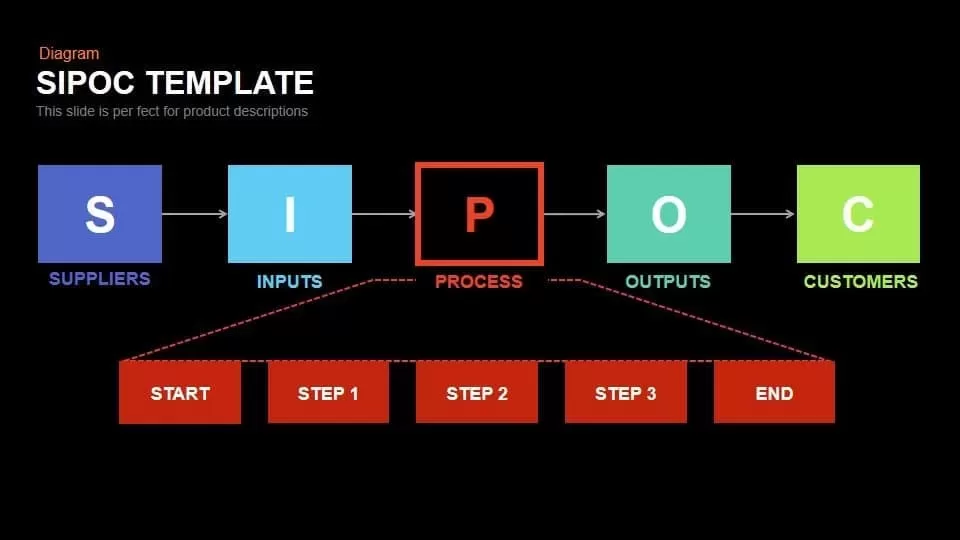
SIPOC Diagram with Process Breakdown Template for PowerPoint & Google Slides
Process

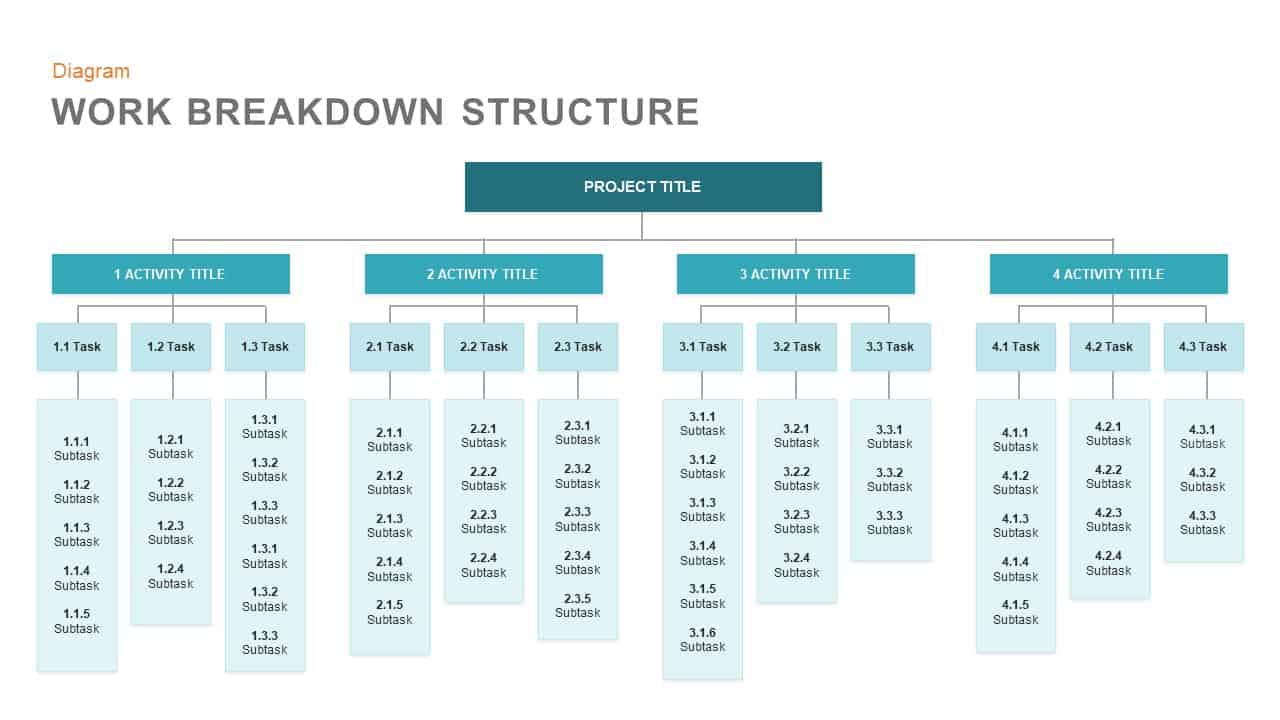
Work Breakdown Structure Diagram Template for PowerPoint & Google Slides
Diagrams
Donut Chart Data Breakdown template for PowerPoint & Google Slides
Pie/Donut
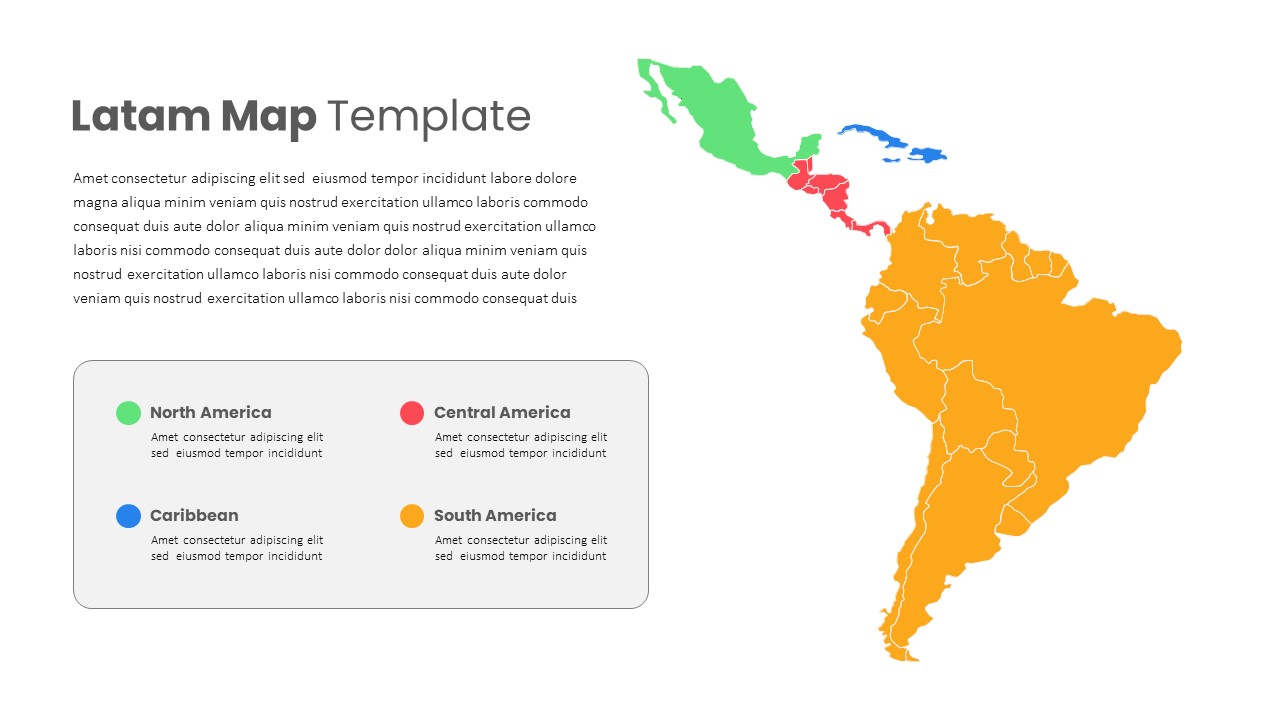
Latin America Regional Map Breakdown Template for PowerPoint & Google Slides
World Maps
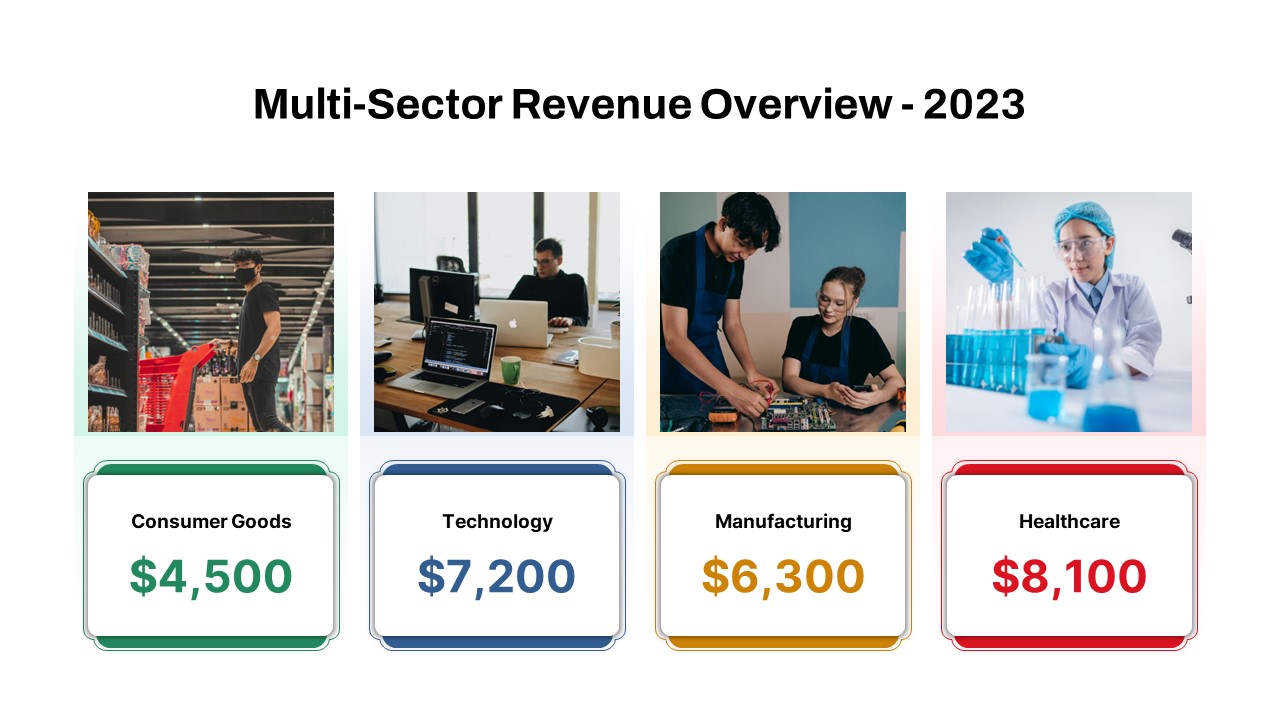
Multi-Sector Revenue Breakdown Cards Template for PowerPoint & Google Slides
Comparison
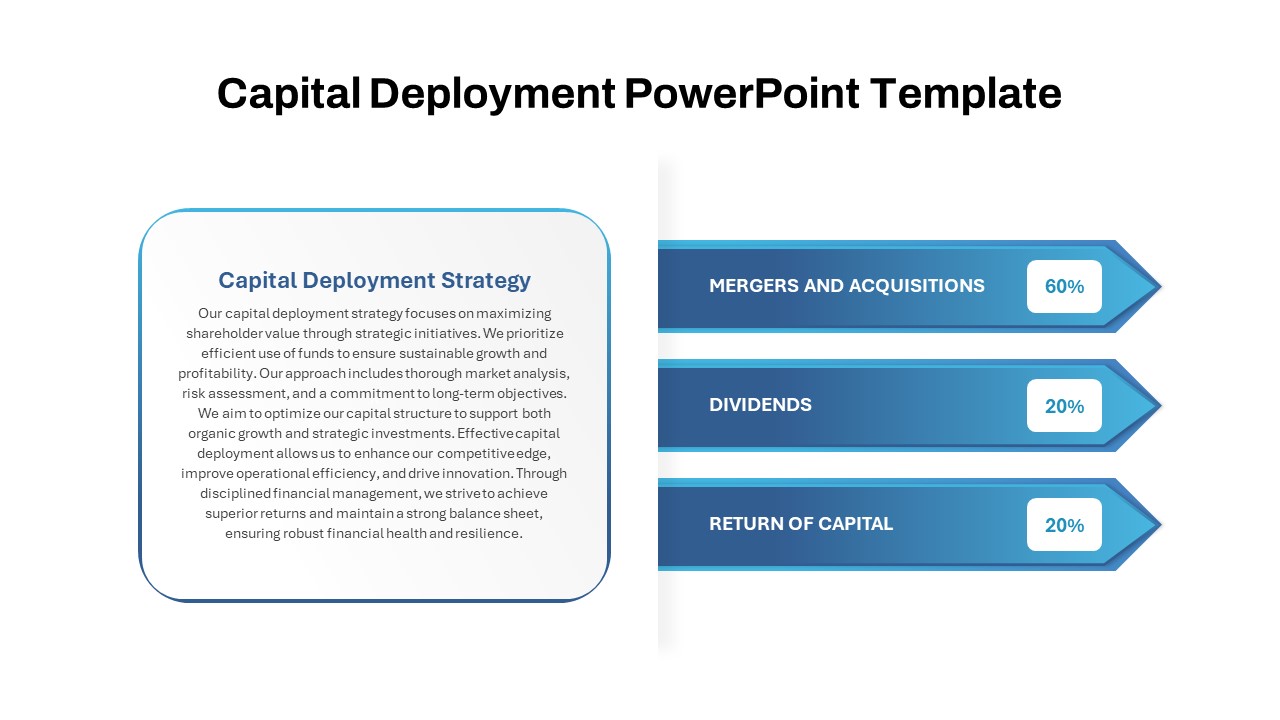
Capital Deployment Percentage Breakdown Template for PowerPoint & Google Slides
Pitch Deck
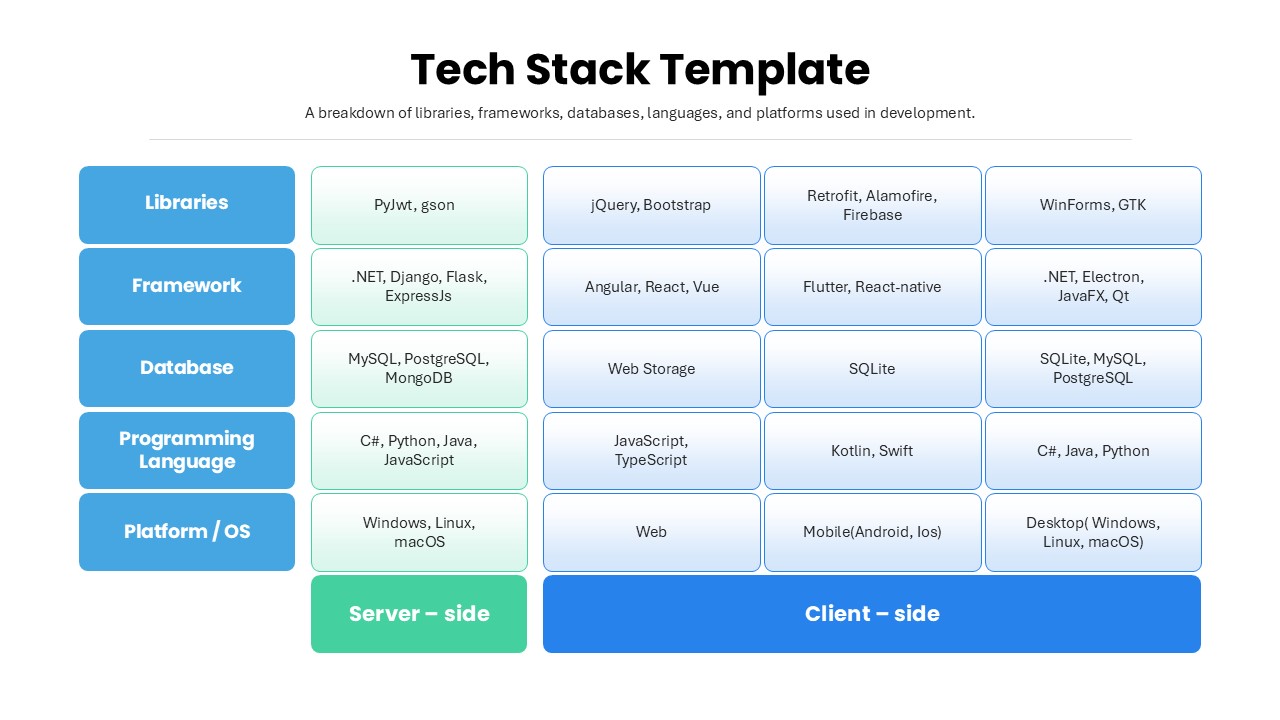
Comprehensive Tech Stack Breakdown Slide Template for PowerPoint & Google Slides
Software Development
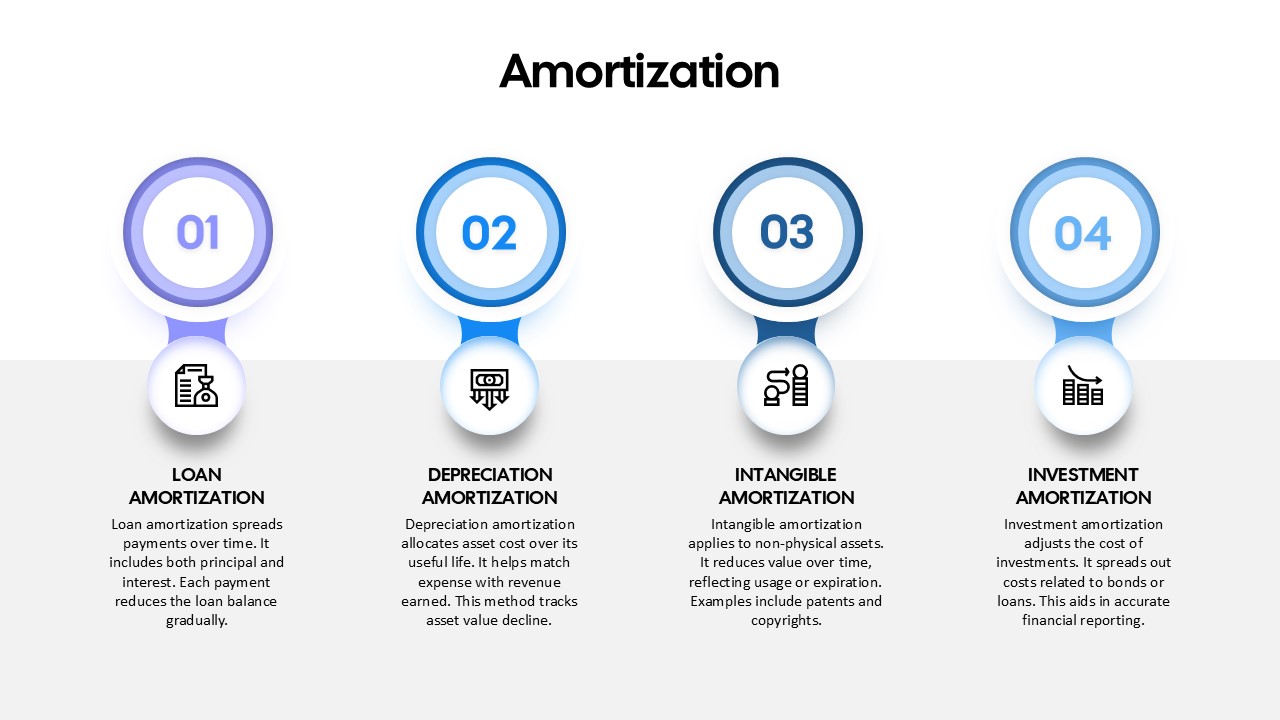
Amortization Breakdown Overview template for PowerPoint & Google Slides
Finance
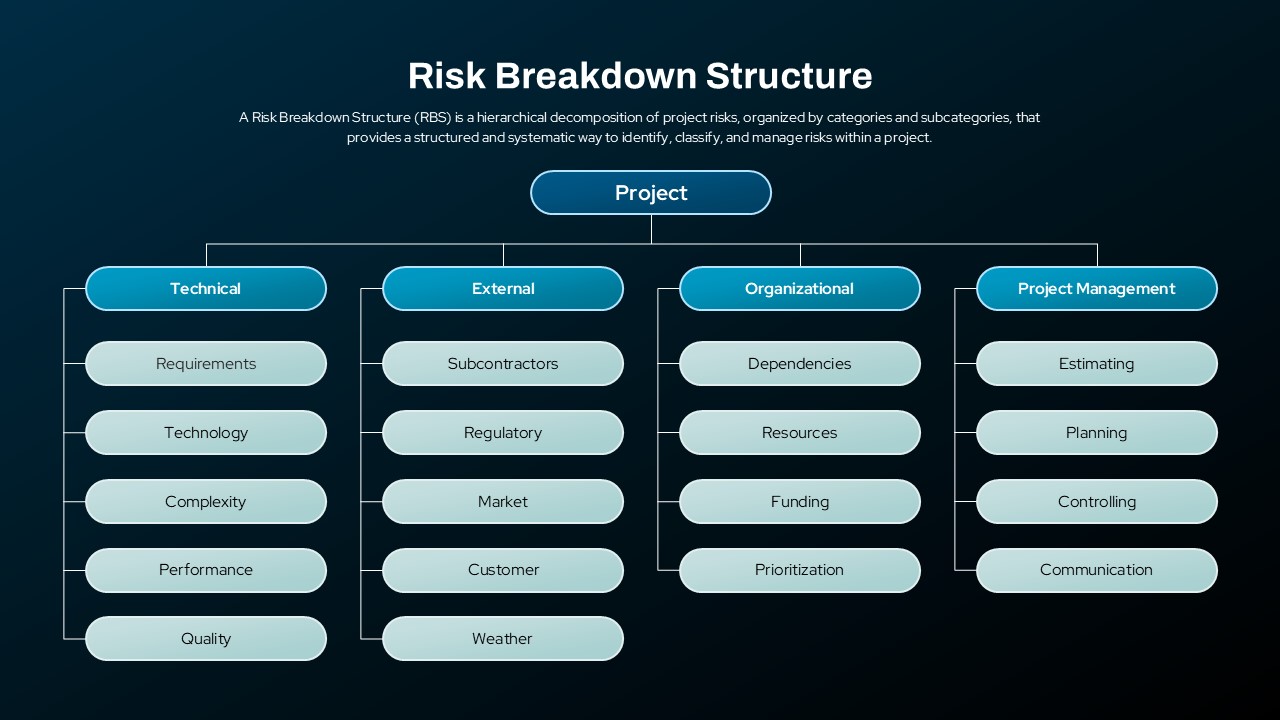
Risk Breakdown Structure Diagram Template for PowerPoint & Google Slides
Org Chart
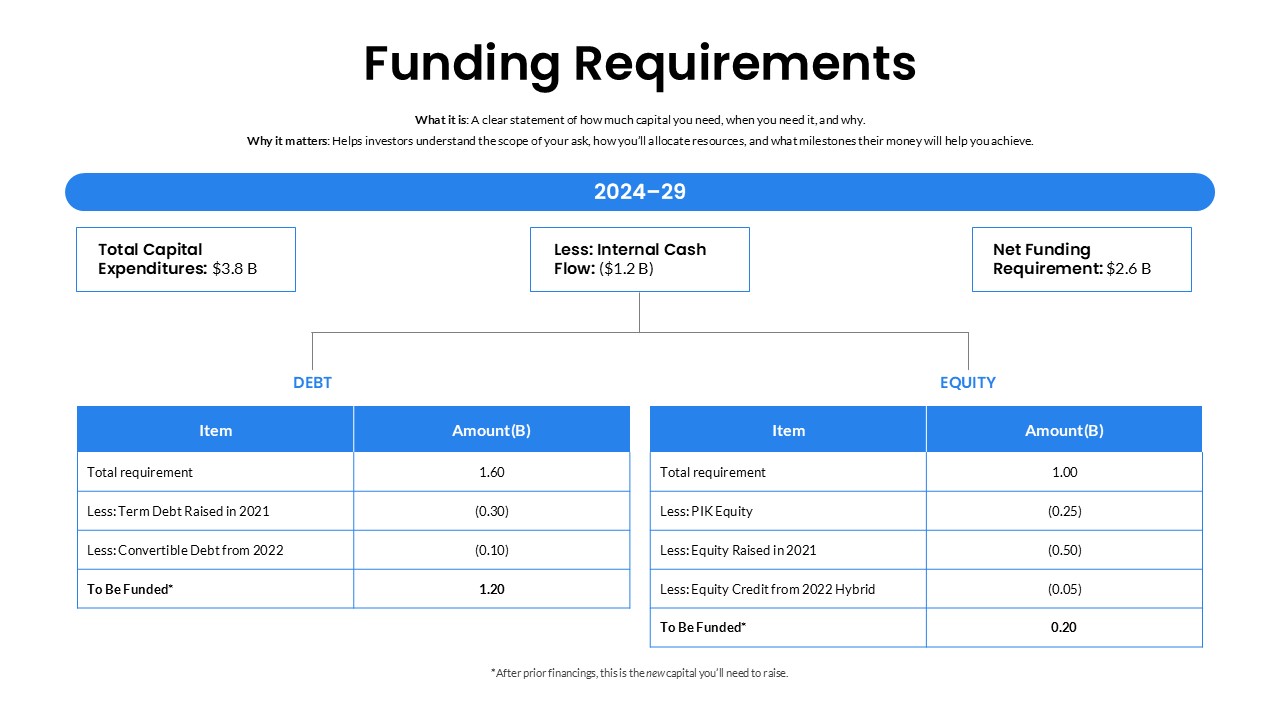
Funding Requirements Breakdown Template for PowerPoint & Google Slides
Finance
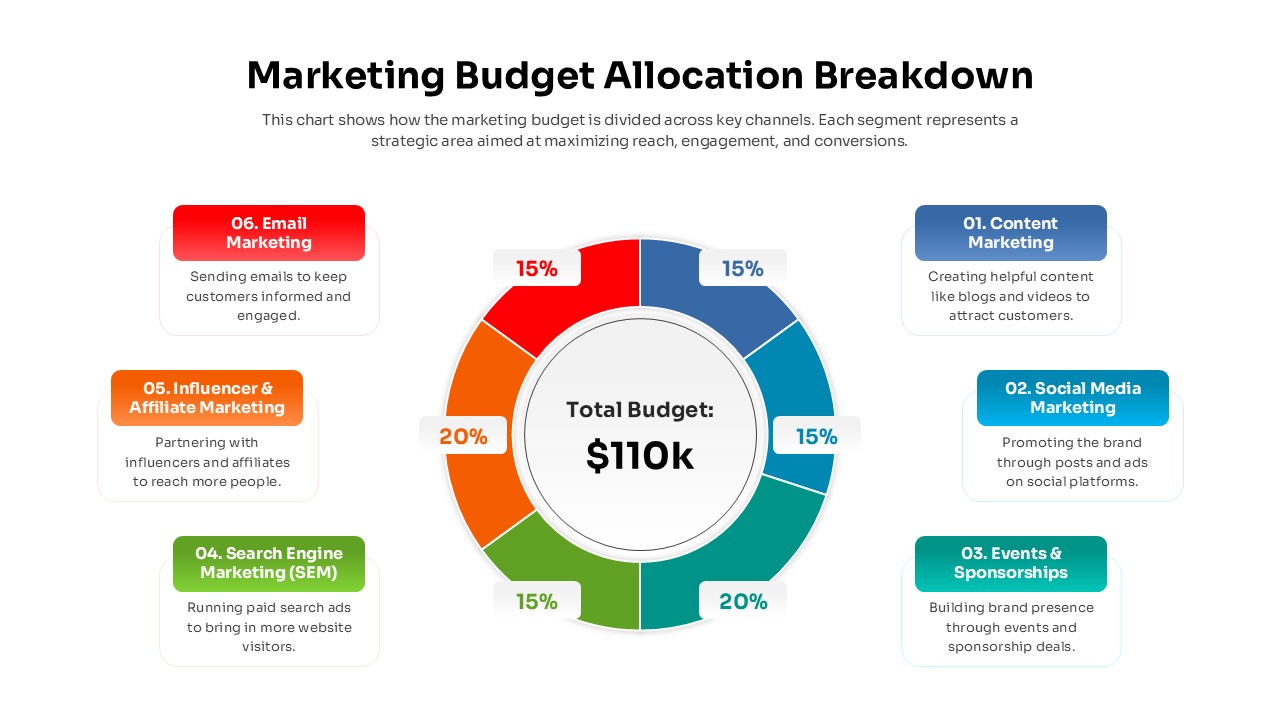
Marketing Budget Allocation Breakdown Template for PowerPoint & Google Slides
Finance
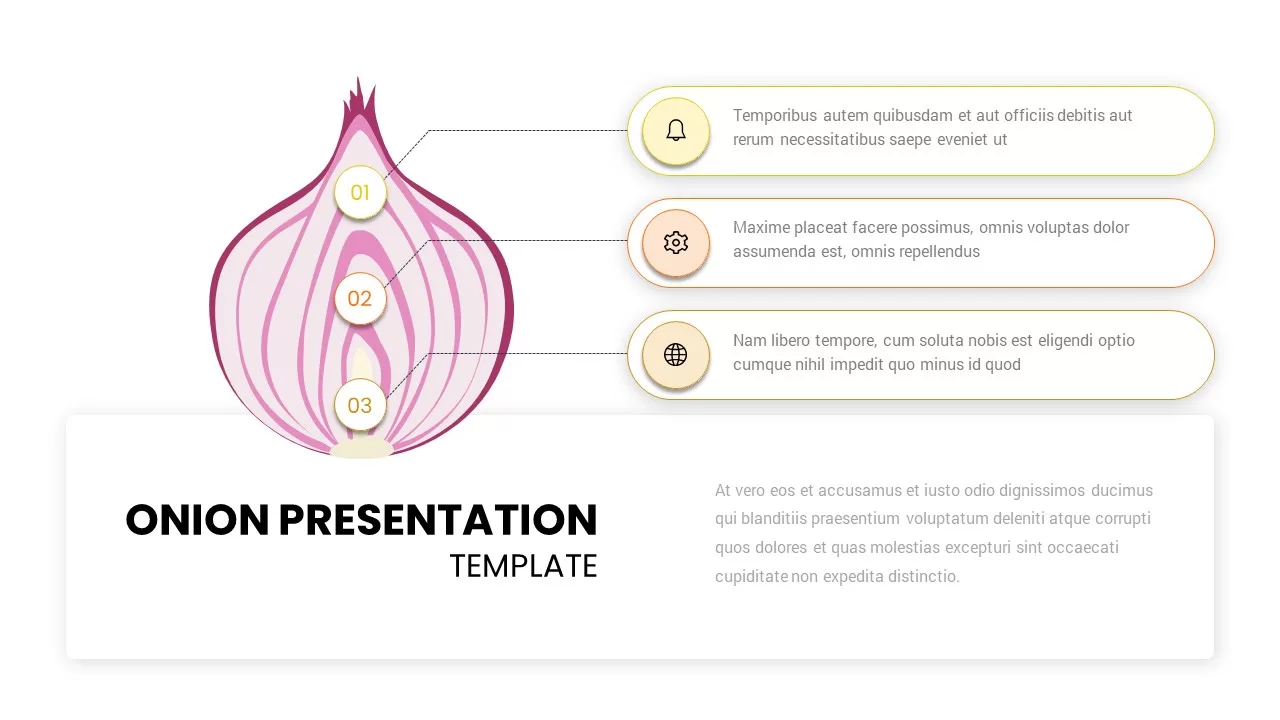
Layered Onion Diagram Slide for Process Breakdown in PowerPoint & Google Slides
Process
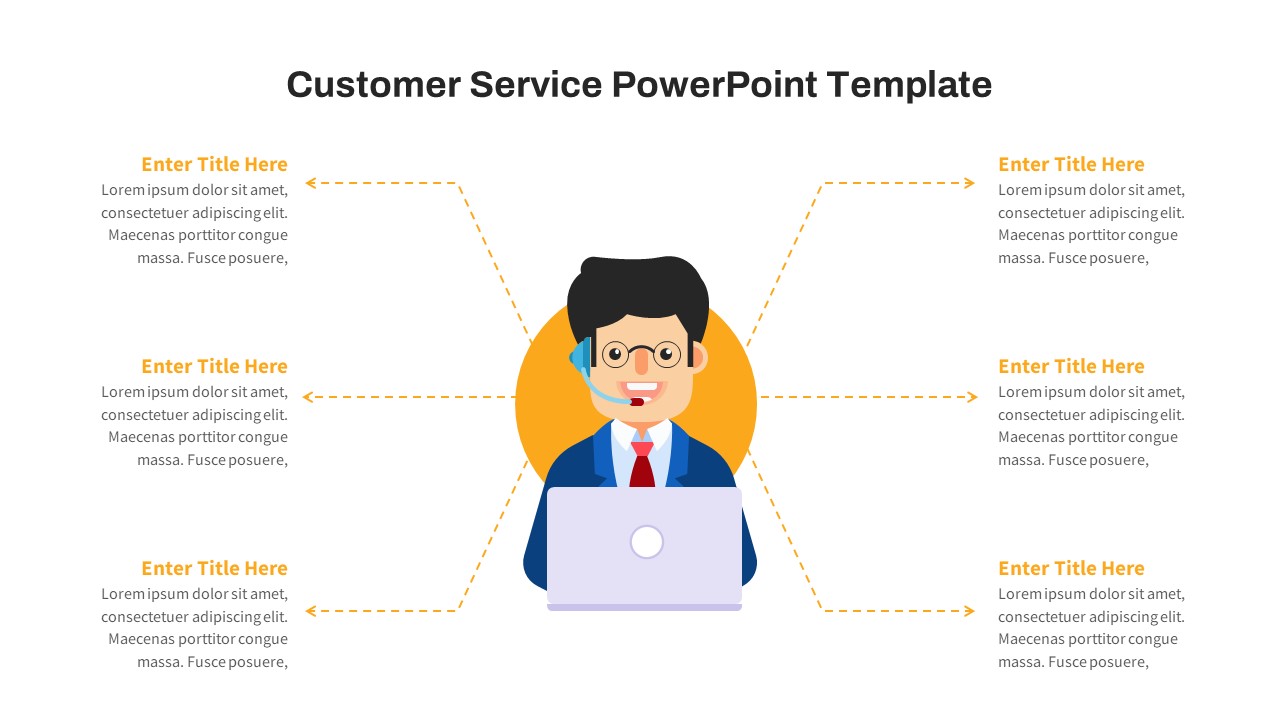
Free Customer Service Breakdown Slide for PowerPoint & Google Slides
Infographics
Free
Free KPI Dashboard PowerPoint Template for PowerPoint & Google Slides
Charts
Free
Asia Map with KPI Metrics and Legend Template for PowerPoint & Google Slides
World Maps

Efficiency KPI Dashboard Metaphor Template for PowerPoint & Google Slides
Infographics

Application Revenue Line Chart KPI Template for PowerPoint & Google Slides
Revenue
Sales Growth Dashboard: KPI Gauge & Line Template for PowerPoint & Google Slides
Revenue
Performance KPI Dashboard Slide Template for PowerPoint & Google Slides
Business Report
KPI Dashboard template for PowerPoint & Google Slides
Business Report
KPI Dashboard Overview template for PowerPoint & Google Slides
Finance
KPI Dashboard Data Visualization Template for PowerPoint & Google Slides
Bar/Column
KPI Dashboard Data Overview Slide Template for PowerPoint & Google Slides
Bar/Column
Professional Team Collage & KPI Slide Template for PowerPoint & Google Slides
Business
Circular Image Gallery & KPI Metrics Template for PowerPoint & Google Slides
Pie/Donut
Statistics Infographic & KPI Bar Chart Template for PowerPoint & Google Slides
Bar/Column
Monthly Recurring Revenue KPI Bar Chart Template for PowerPoint & Google Slides
Bar/Column
Customer Satisfaction KPI Dashboard Template for PowerPoint & Google Slides
Customer Experience
Free Balanced Scorecard Quadrant KPI Layout Template for PowerPoint & Google Slides
Employee Performance
Free
Michigan County Map with KPI Dashboard Template for PowerPoint & Google Slides
World Maps
DevOps KPI Dashboard Performance Metrics Template for PowerPoint & Google Slides
Software Development
Purchasing KPI Metrics Dashboard Template for PowerPoint & Google Slides
Business Report
Procurement KPI Dashboard & Metrics Template for PowerPoint & Google Slides
Business Report
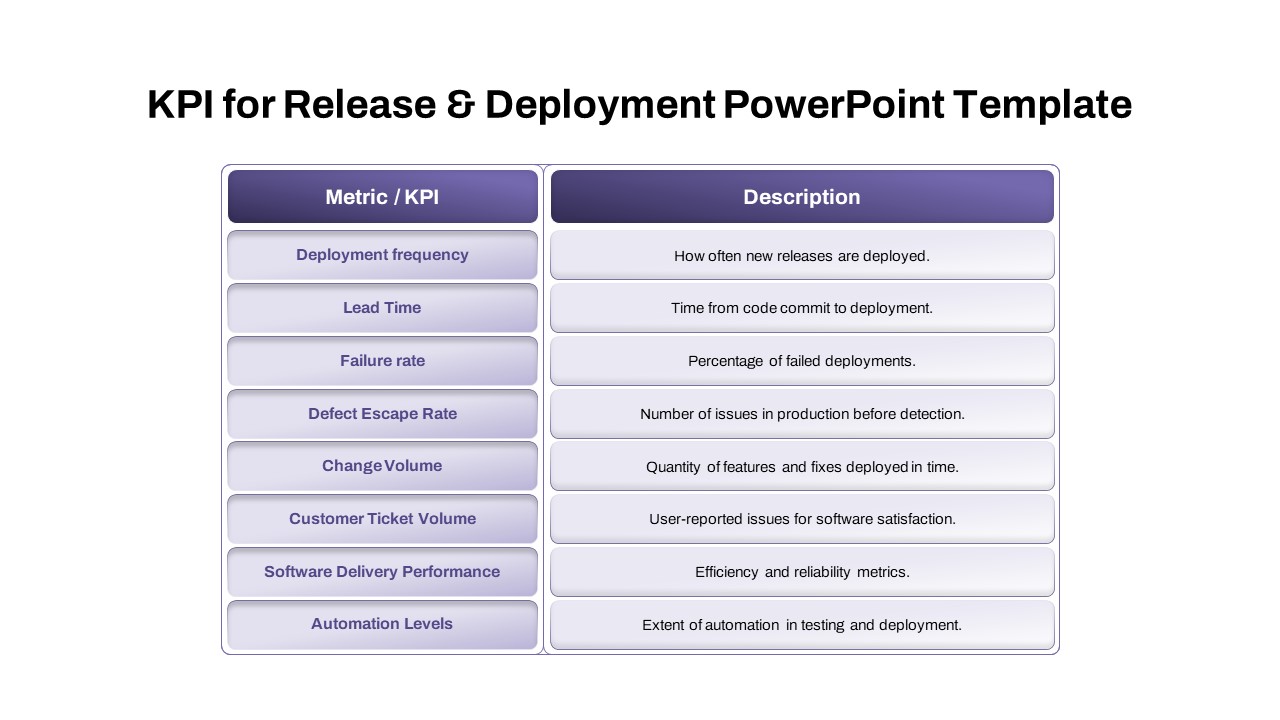
Comprehensive Release & Deployment KPI Template for PowerPoint & Google Slides
Software Development
Three Segment Donut Chart KPI Infographic Template for PowerPoint & Google Slides
Pie/Donut
4DX Scoreboard KPI Gauge Dashboard Template for PowerPoint & Google Slides
Business Strategy
Year in Review KPI Highlights Slide for PowerPoint & Google Slides
Business Report
Patient-Satisfaction KPI Dashboard for PowerPoint & Google Slides
Business
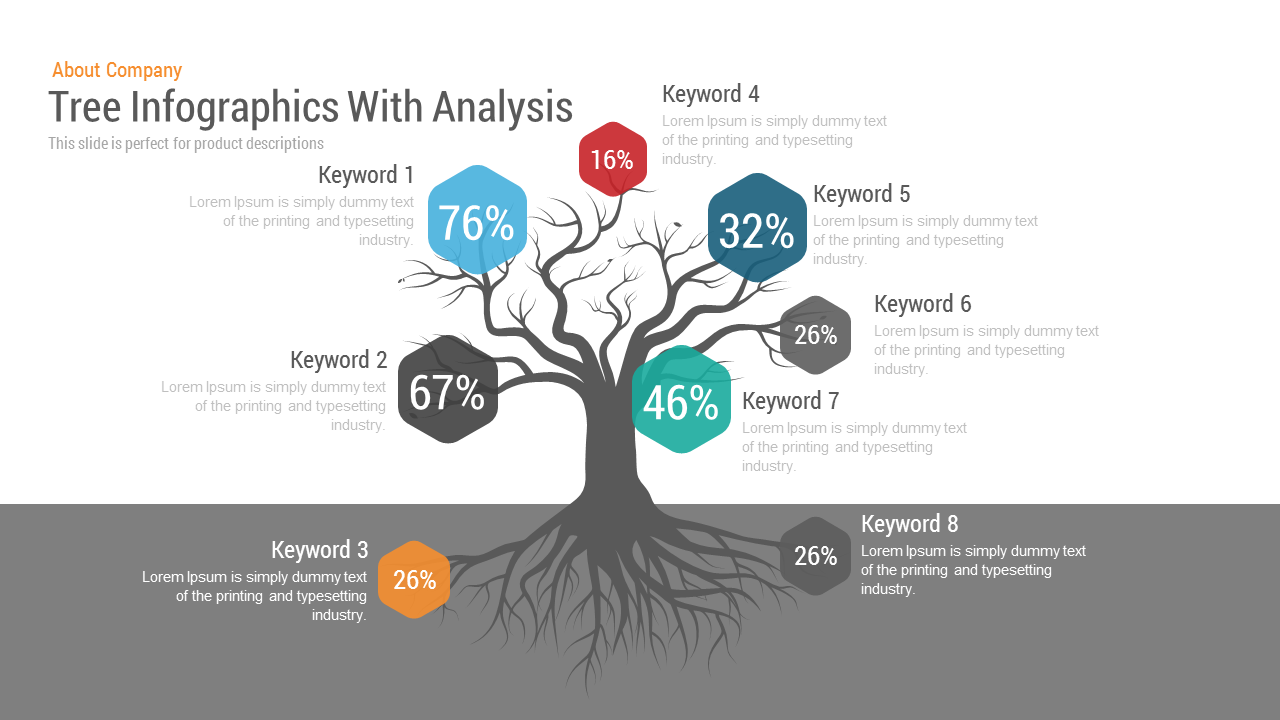
Tree Infographics template for PowerPoint & Google Slides
Decision Tree
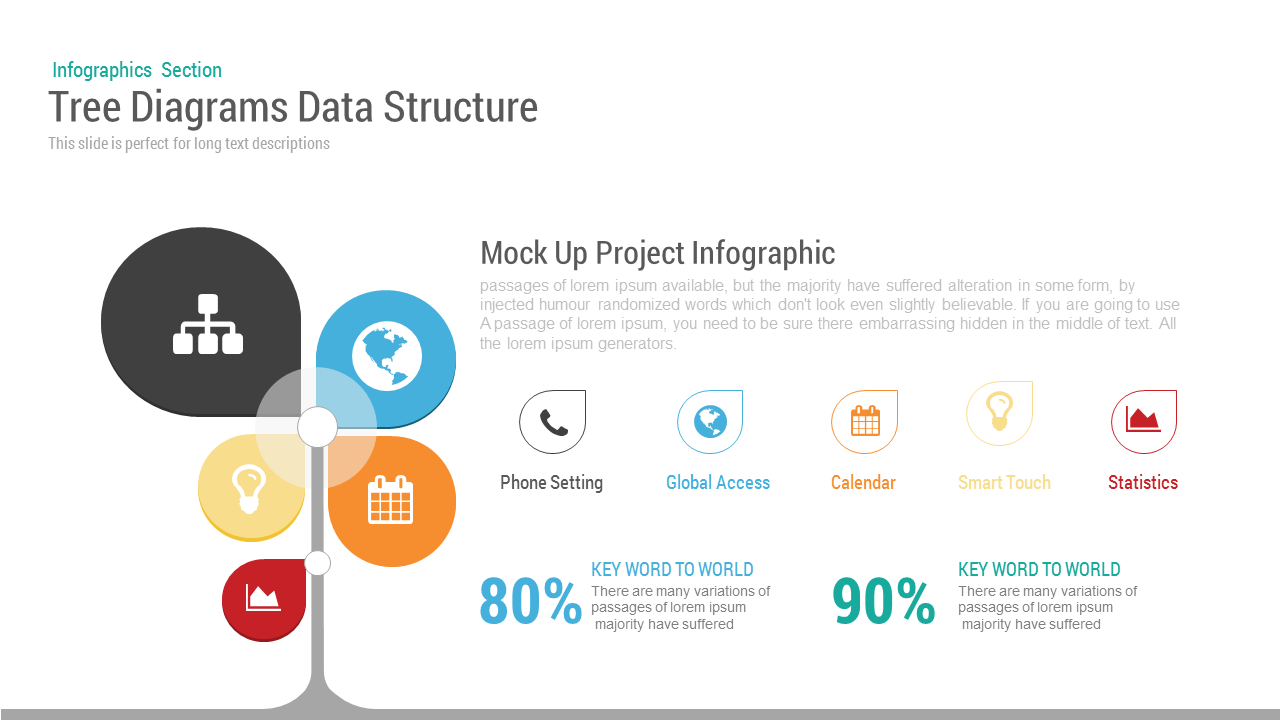
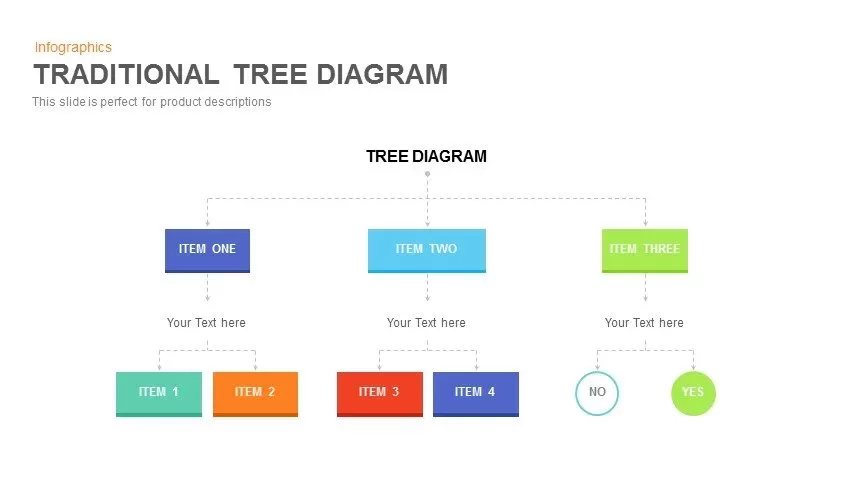
Tree Diagram template for PowerPoint & Google Slides
Decision Tree
Business Tree Diagram template for PowerPoint & Google Slides
Business Strategy
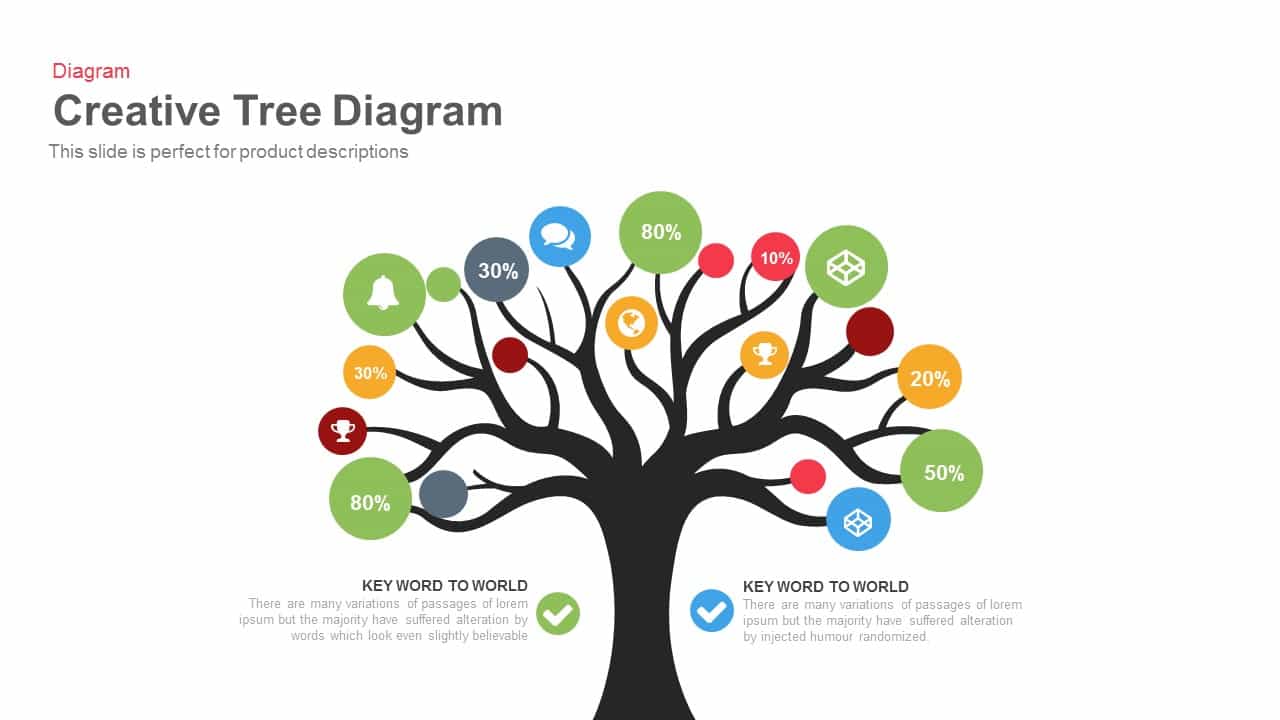
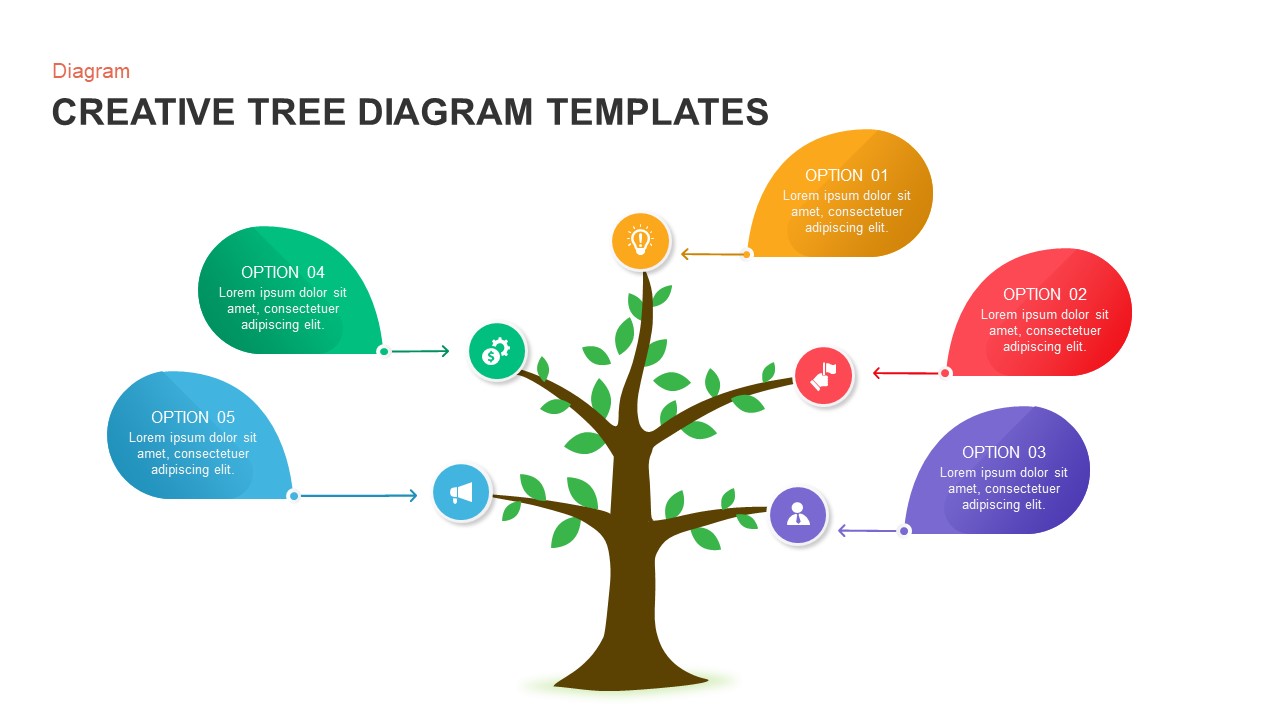
Engaging Creative Tree Diagram Slide Template for PowerPoint & Google Slides
Flow Charts
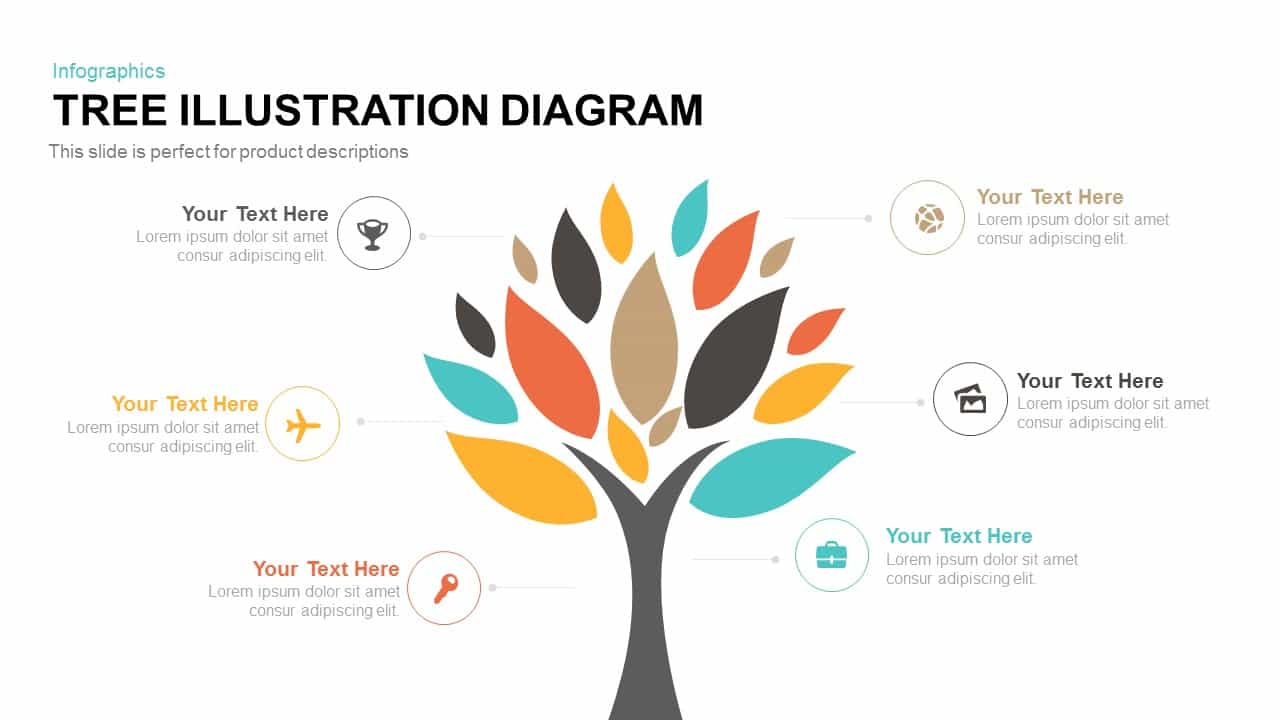
Tree Illustration template for PowerPoint & Google Slides
Process
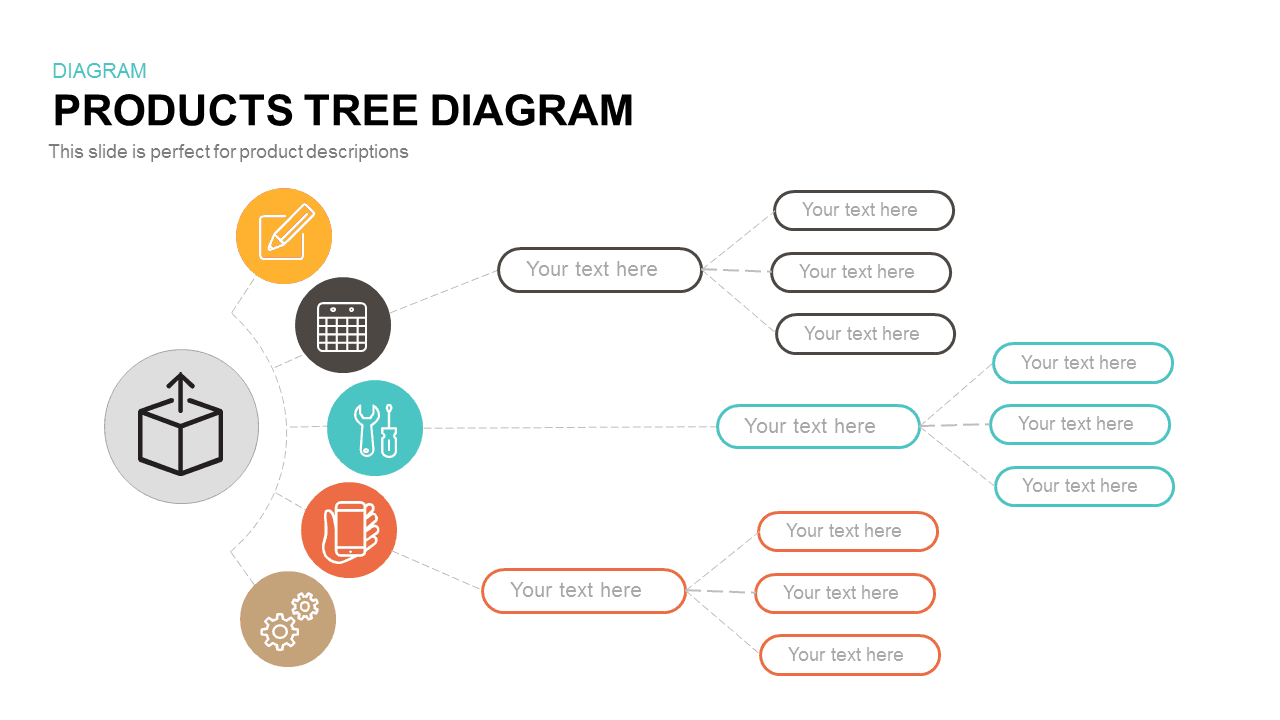
Interactive Products Tree Diagram template for PowerPoint & Google Slides
Org Chart
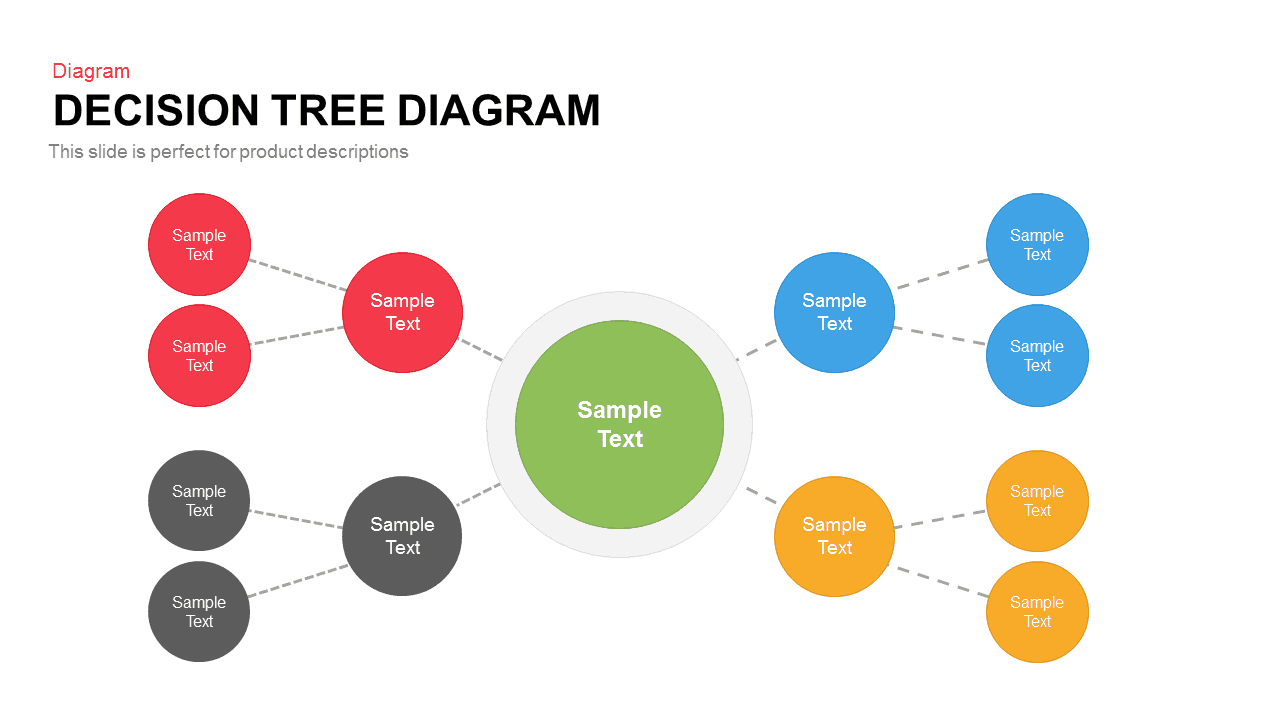
Colorful Decision Tree Diagram template for PowerPoint & Google Slides
Decision Tree

Editable Hierarchical Tree Diagram Template for PowerPoint & Google Slides
Decision Tree
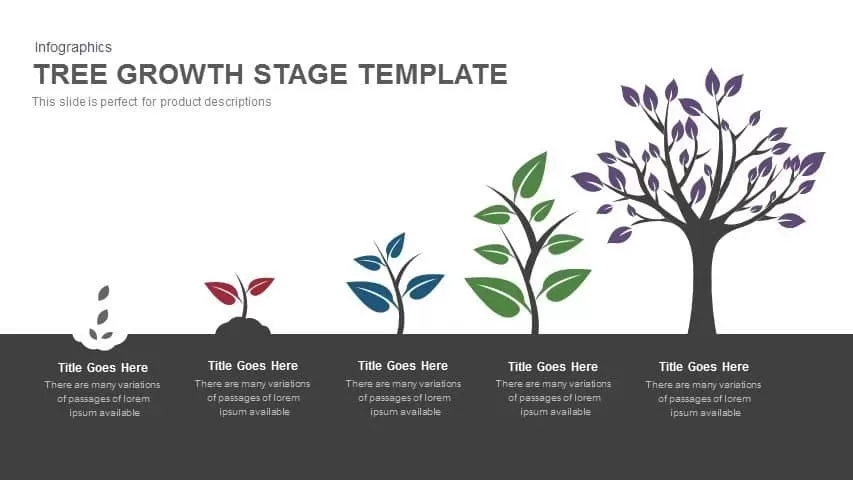
Tree Growth Stage Infographic Template for PowerPoint & Google Slides
Timeline
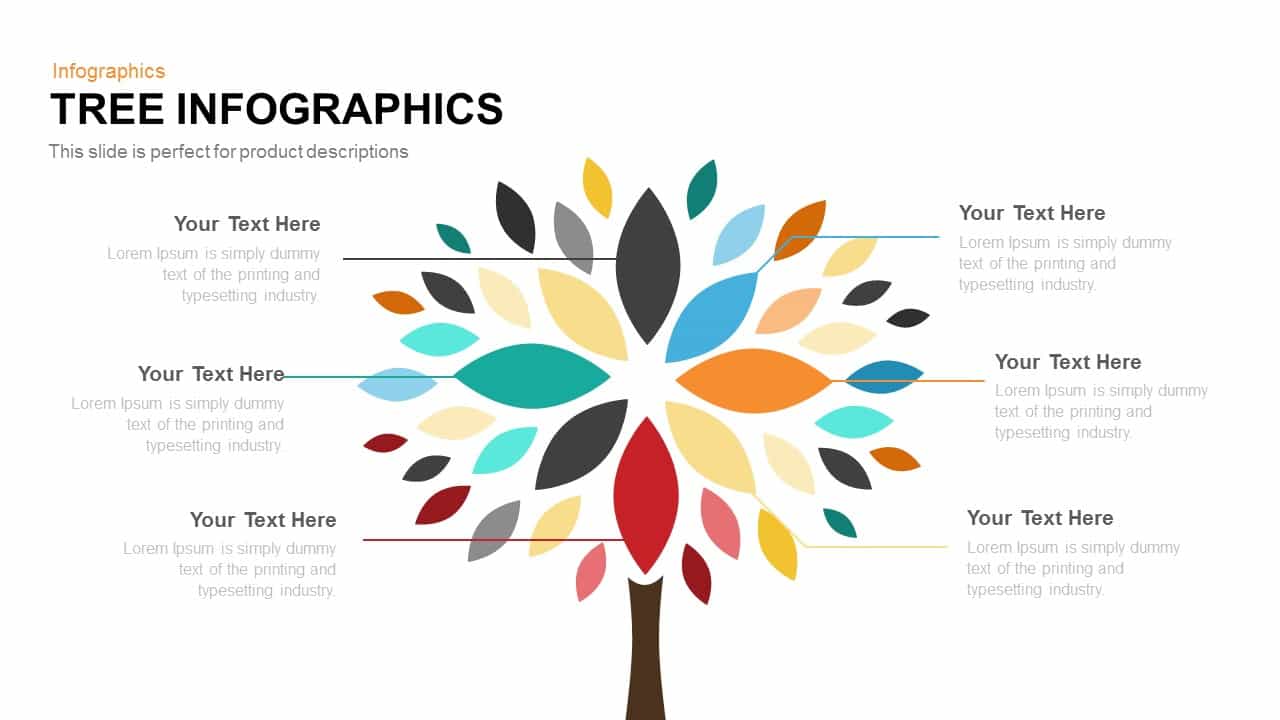
Tree Infographics template for PowerPoint & Google Slides
Infographics
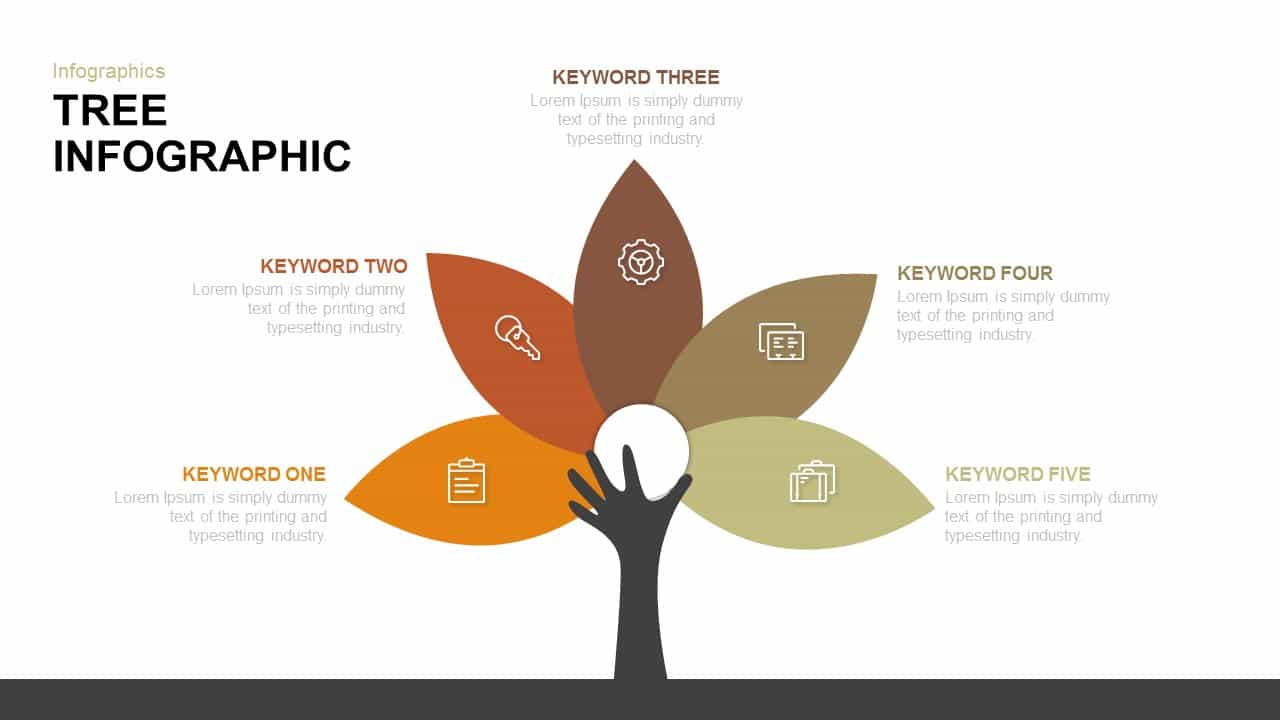
Tree Keyword Petals Infographic Template for PowerPoint & Google Slides
Process
Decision Tree Diagram template for PowerPoint & Google Slides
Decision Tree
Creative Tree Diagram with Percentages Template for PowerPoint & Google Slides
Decision Tree
Creative Tree Infographic Diagram Template for PowerPoint & Google Slides
Infographics
Five-Stage Eco Tree Process Diagram Template for PowerPoint & Google Slides
Process
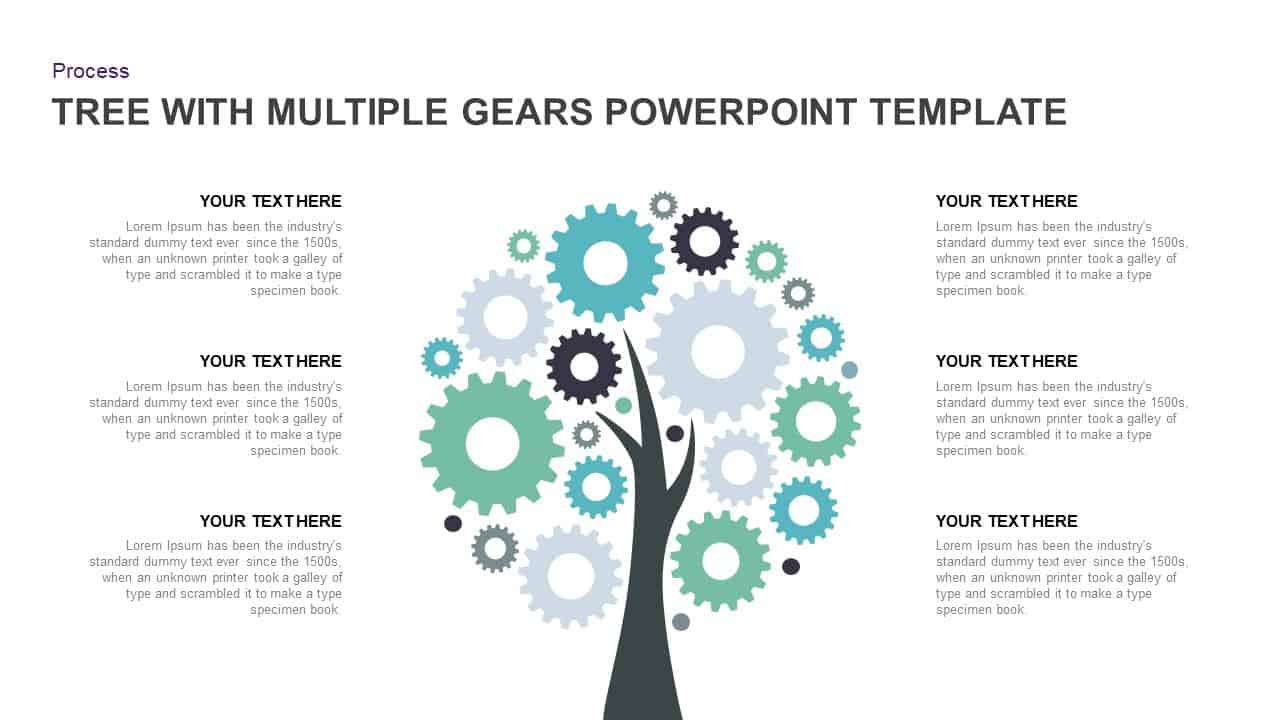
Tree Diagram with Gears Process Template for PowerPoint & Google Slides
Process
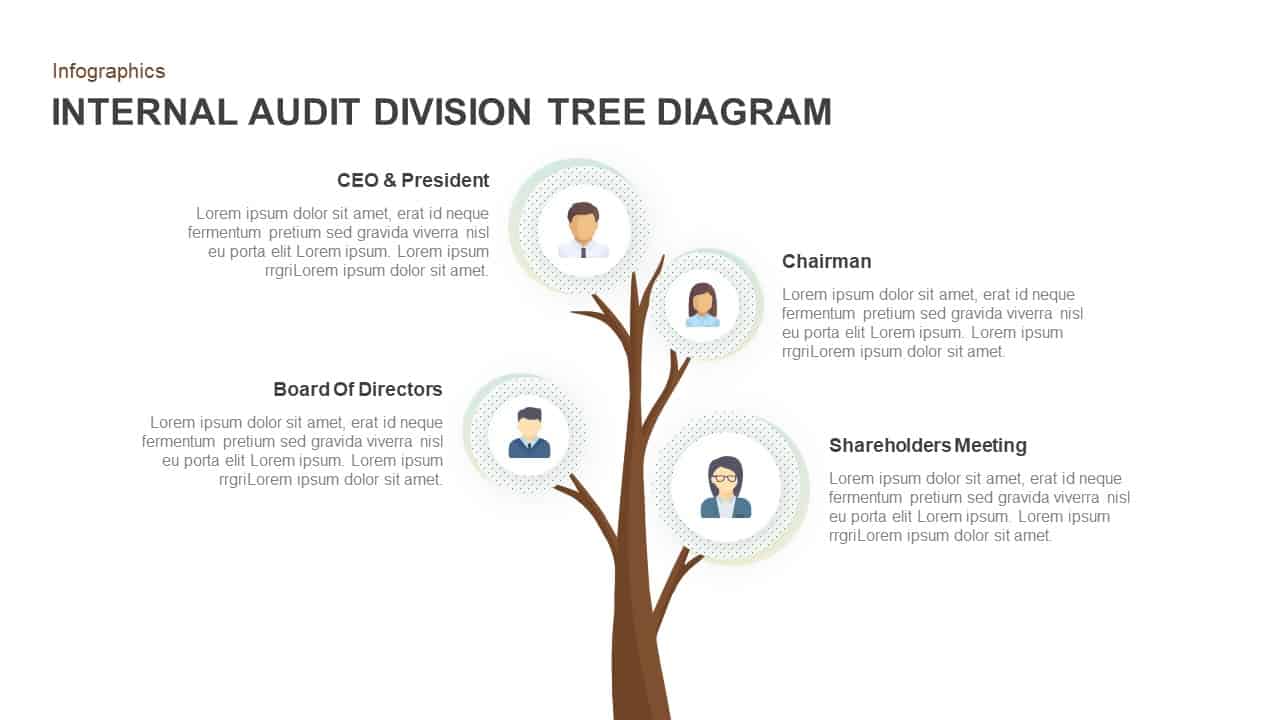
Internal Audit Division Tree Diagram Template for PowerPoint & Google Slides
Org Chart
Creative Tree Diagram Infographic Template for PowerPoint & Google Slides
Decision Tree
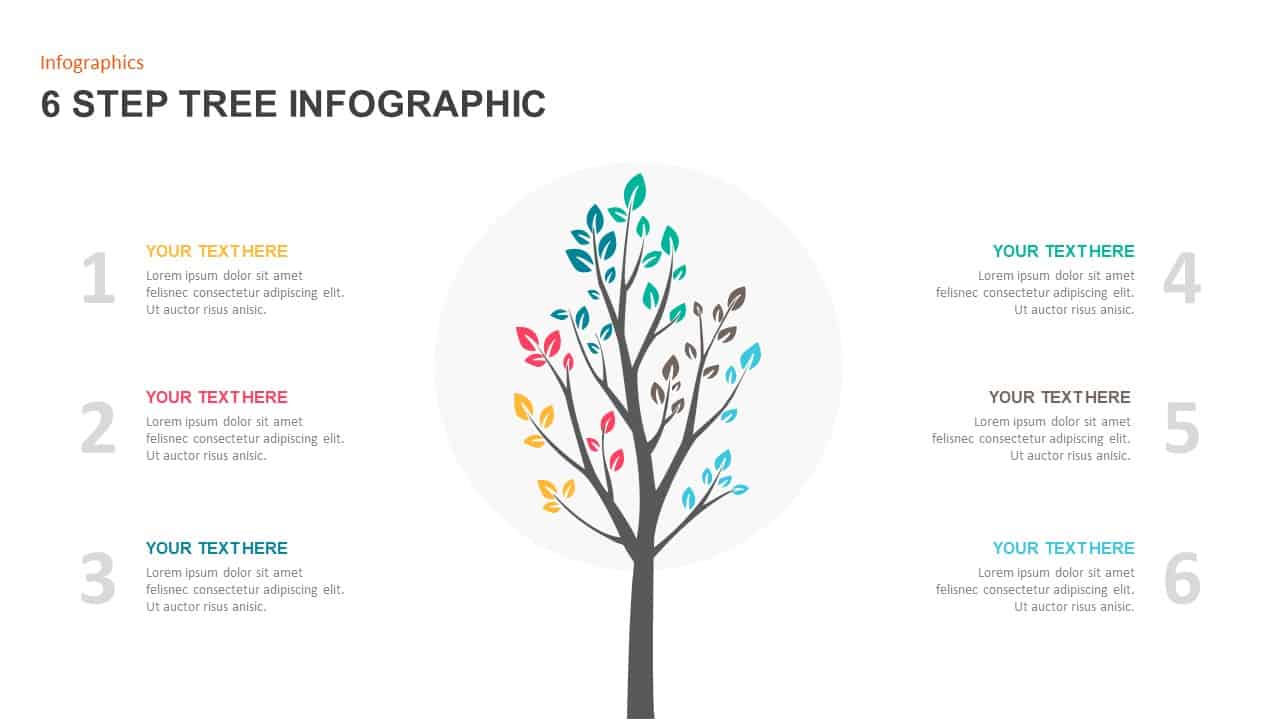
Six-Step Tree Diagram Infographic Template for PowerPoint & Google Slides
Infographics
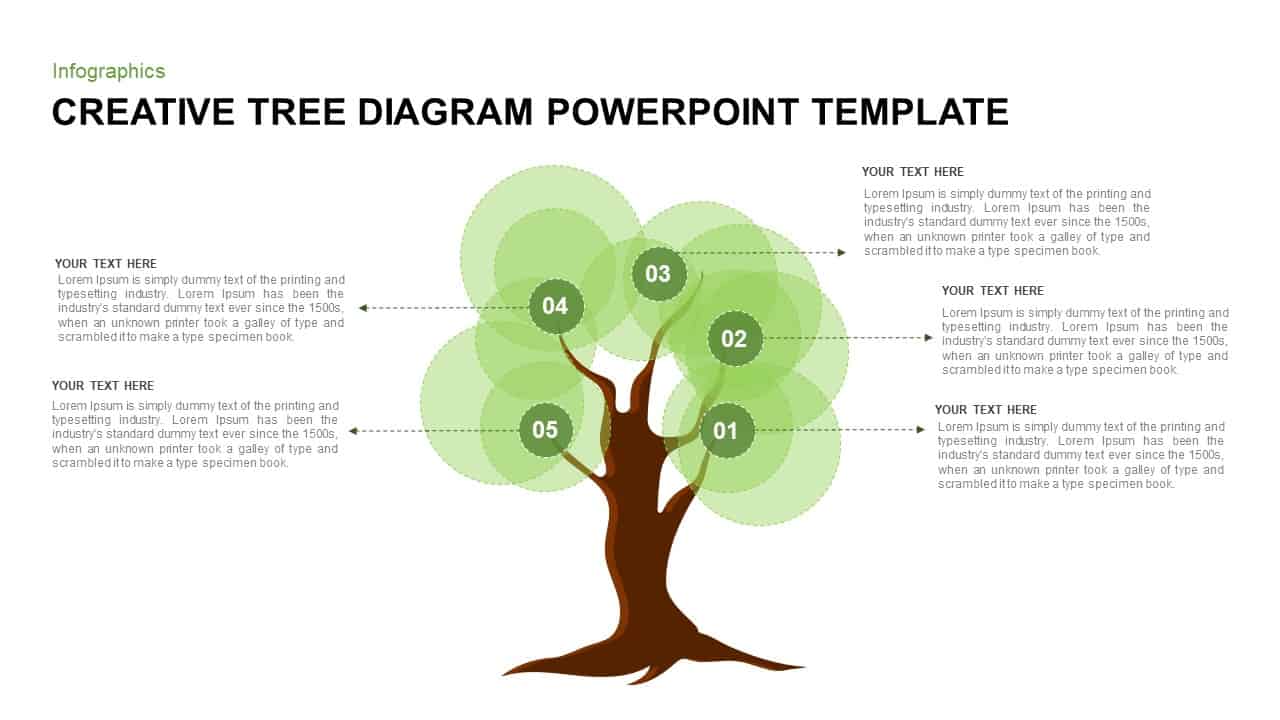
Creative Tree Diagram template for PowerPoint & Google Slides
Process
Creative Tree Diagram Infographic Template for PowerPoint & Google Slides
Decision Tree
Sky and Tree Root Cause Analysis Deck Template for PowerPoint & Google Slides
Opportunities Challenges
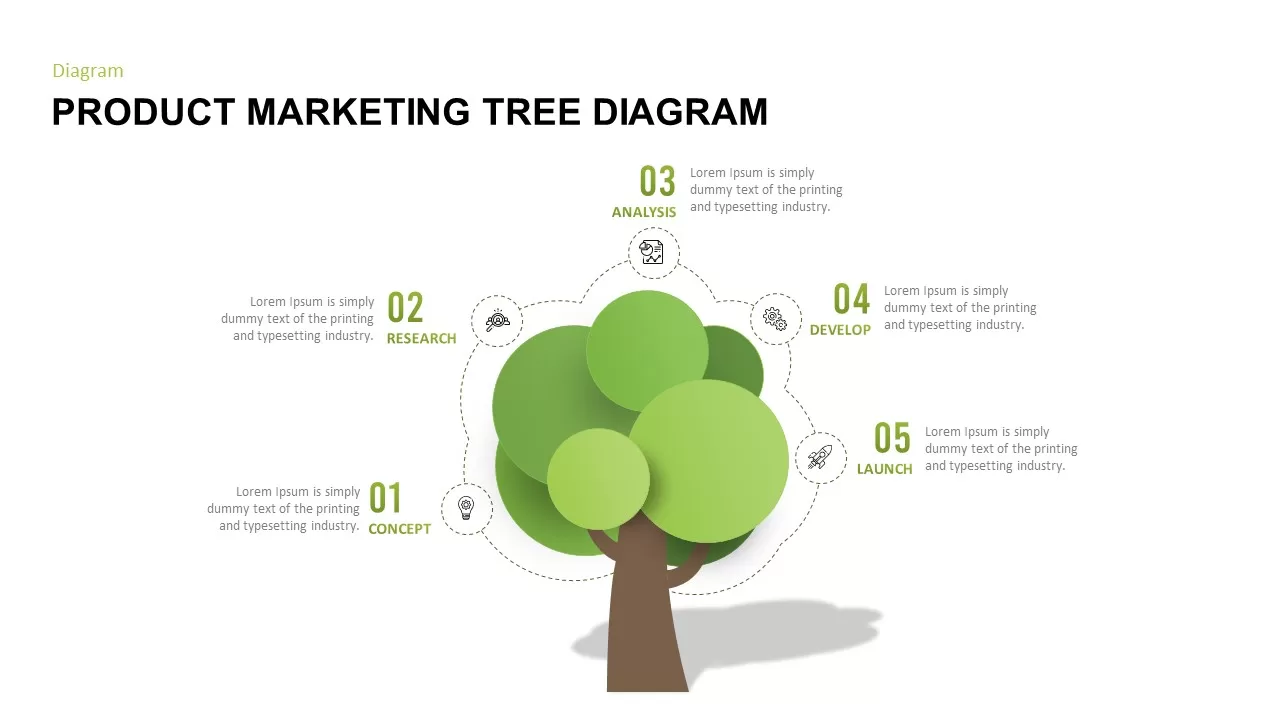
Product Marketing Tree Diagram Template for PowerPoint & Google Slides
Marketing
Paper Tree Business Introduction Template for PowerPoint & Google Slides
Company Profile
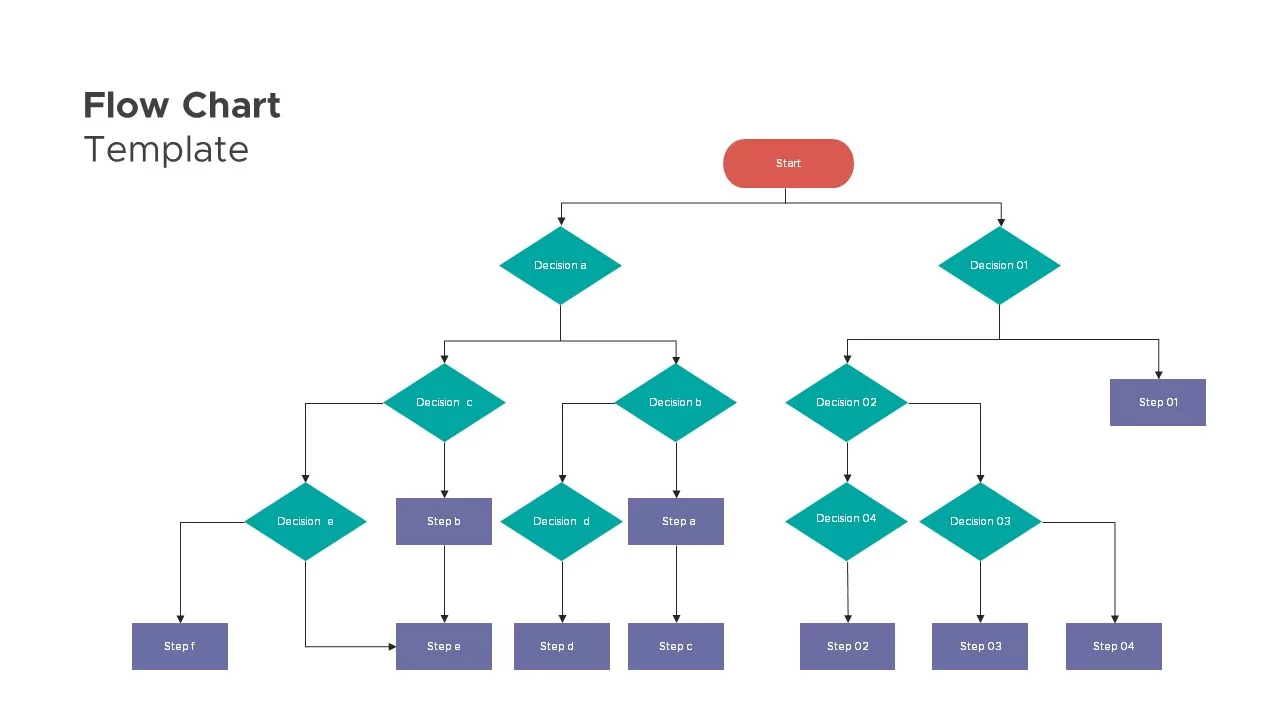
Flow Chart Decision Tree Template for PowerPoint & Google Slides
Flow Charts
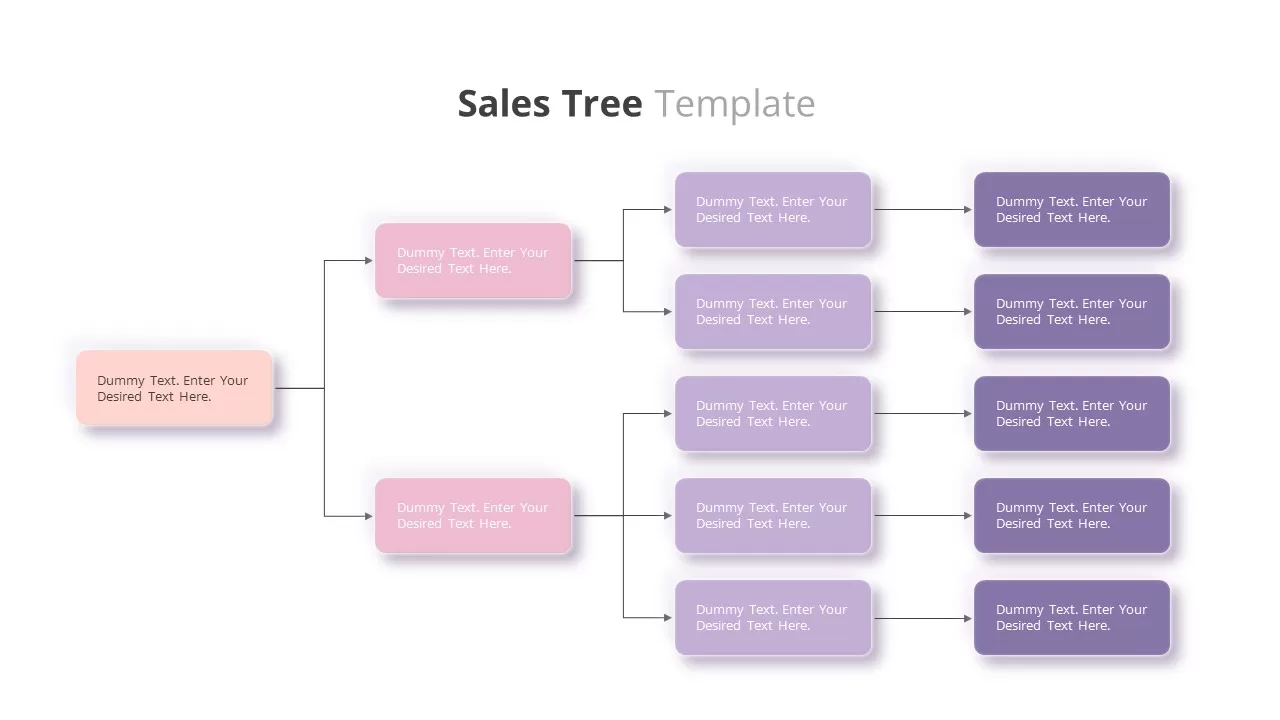
Customizable Sales Tree Diagram Template for PowerPoint & Google Slides
Org Chart
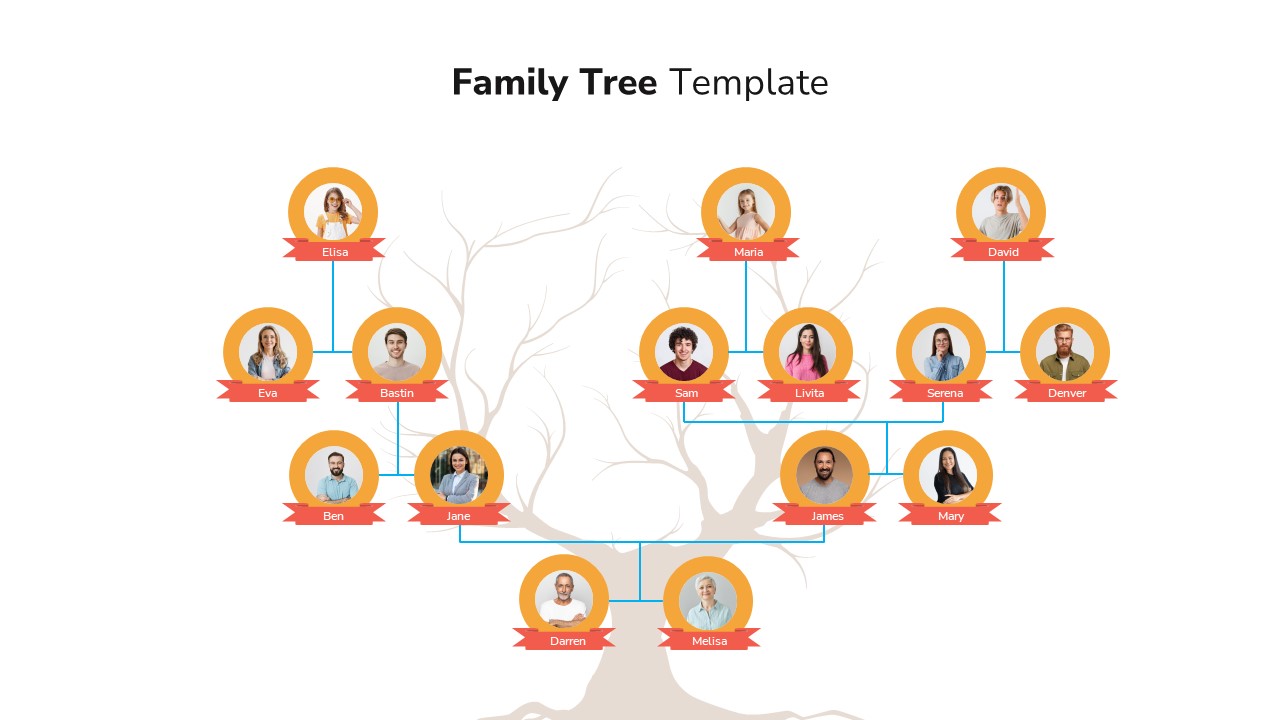
Classic Family Tree Diagram Layout Template for PowerPoint & Google Slides
Infographics
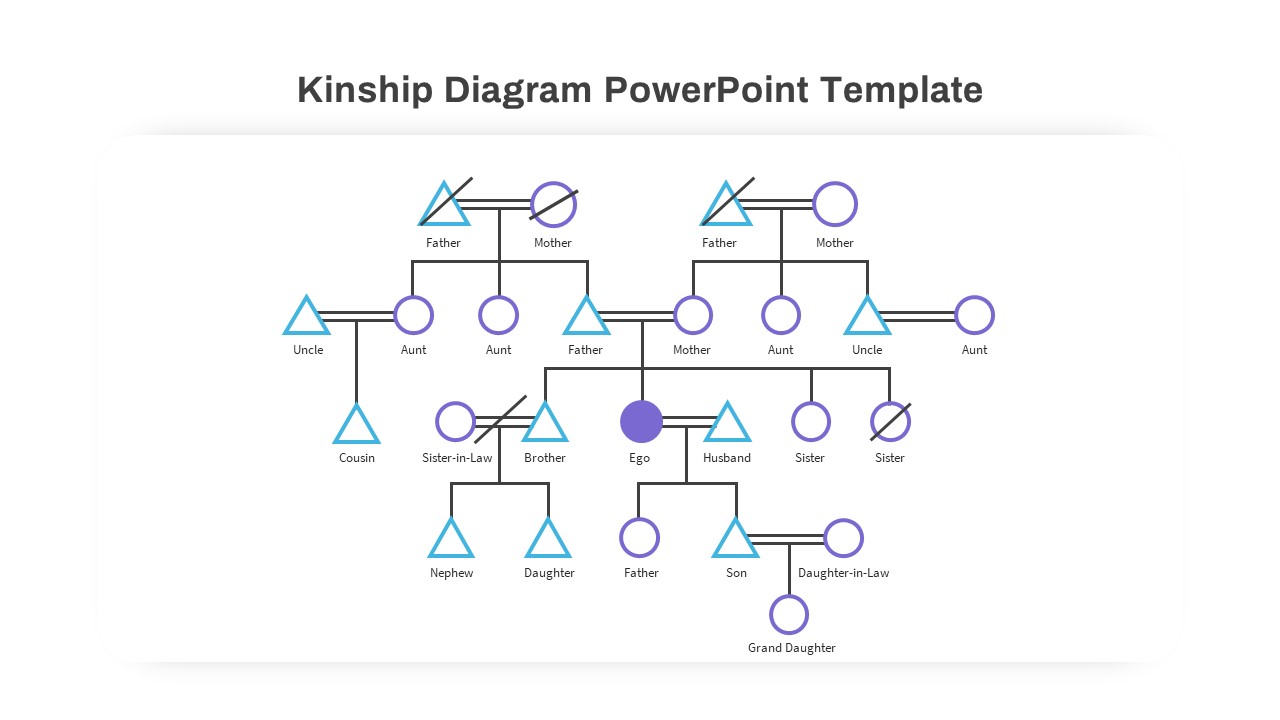
Elegant Kinship Diagram Family Tree Template for PowerPoint & Google Slides
Org Chart
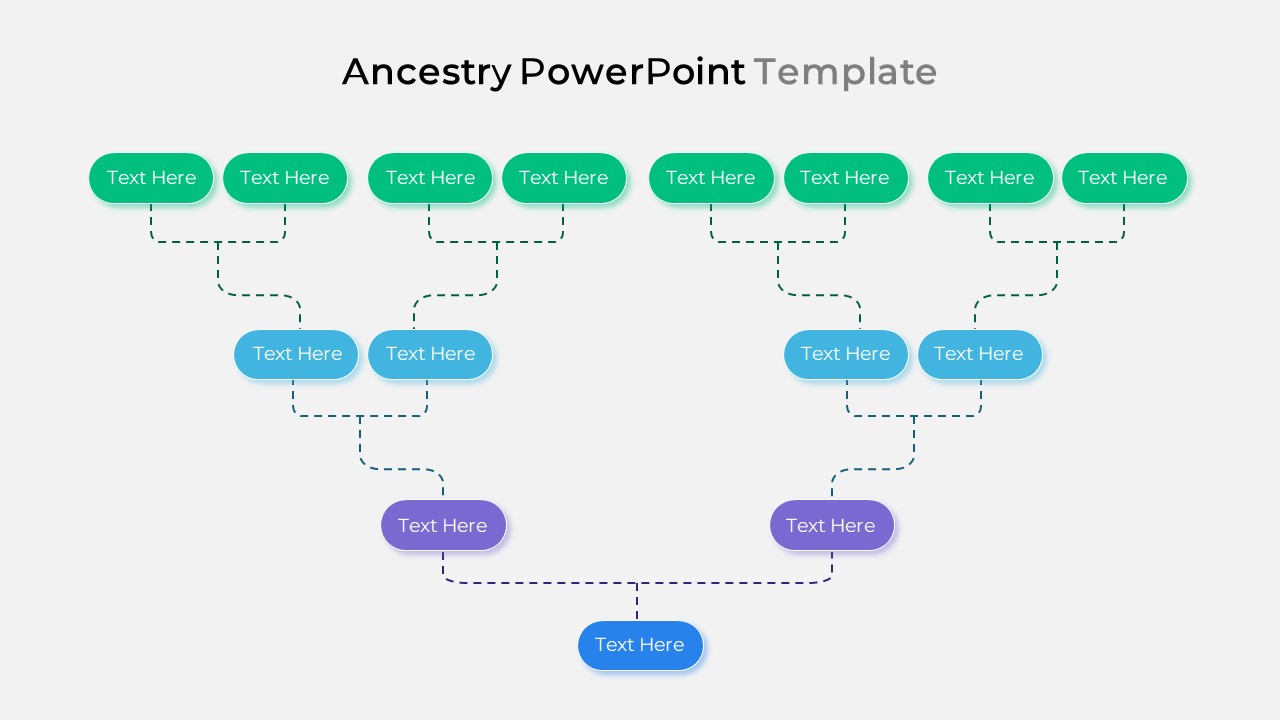
Smart Ancestry Diagram Family Tree Template for PowerPoint & Google Slides
Org Chart
Free Editable Family Tree Genealogy Diagram Template for PowerPoint & Google Slides
Org Chart
Free
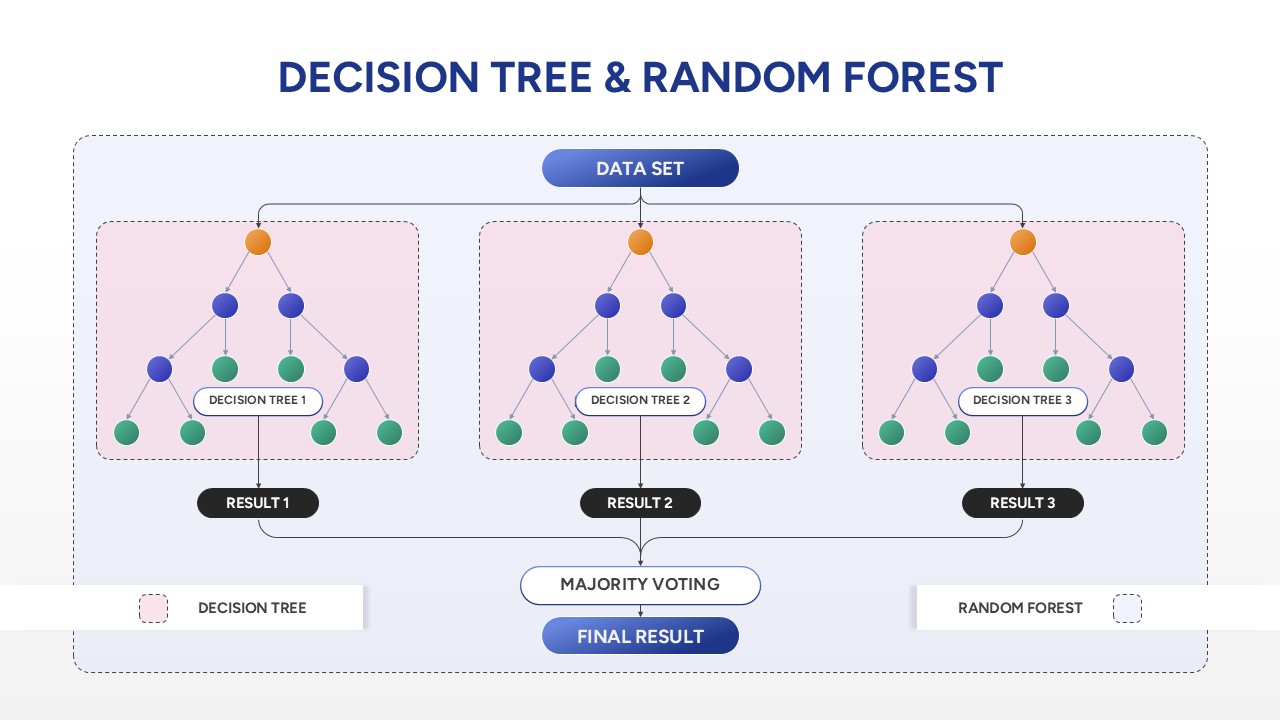
Decision Tree & Random Forest template for PowerPoint & Google Slides
Technology
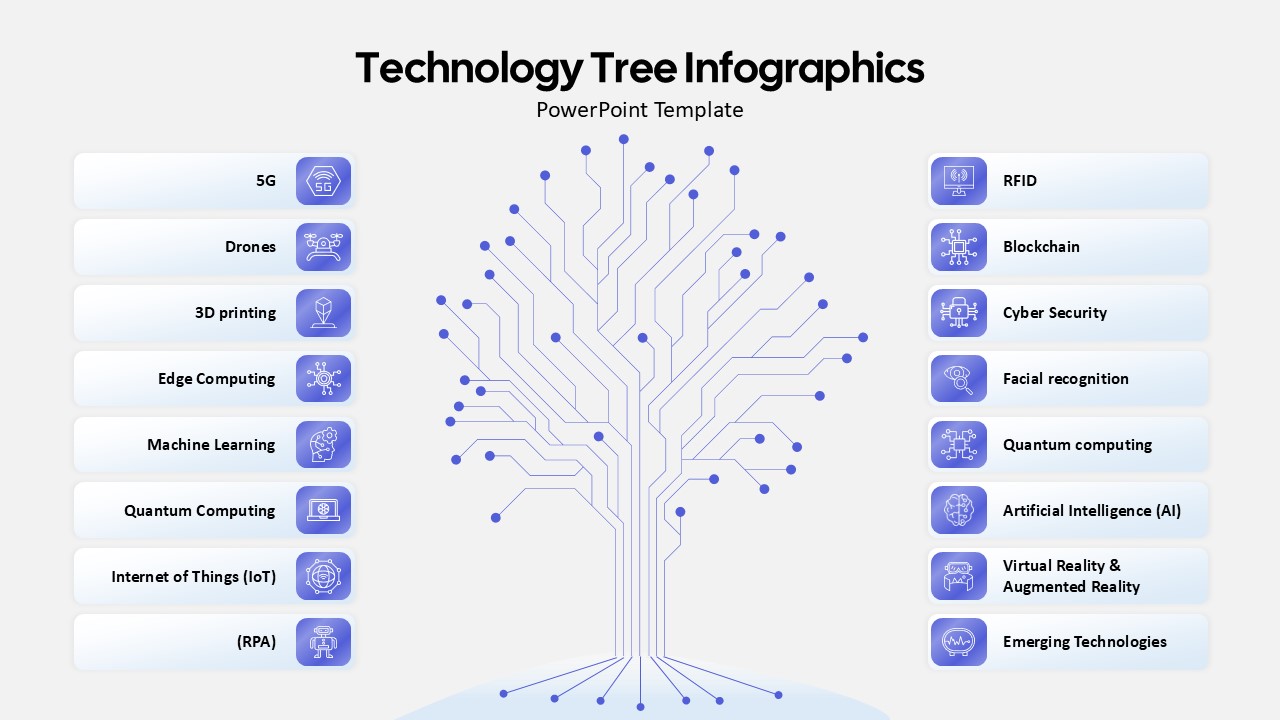
Technology Tree Infographics Template for PowerPoint & Google Slides
AI
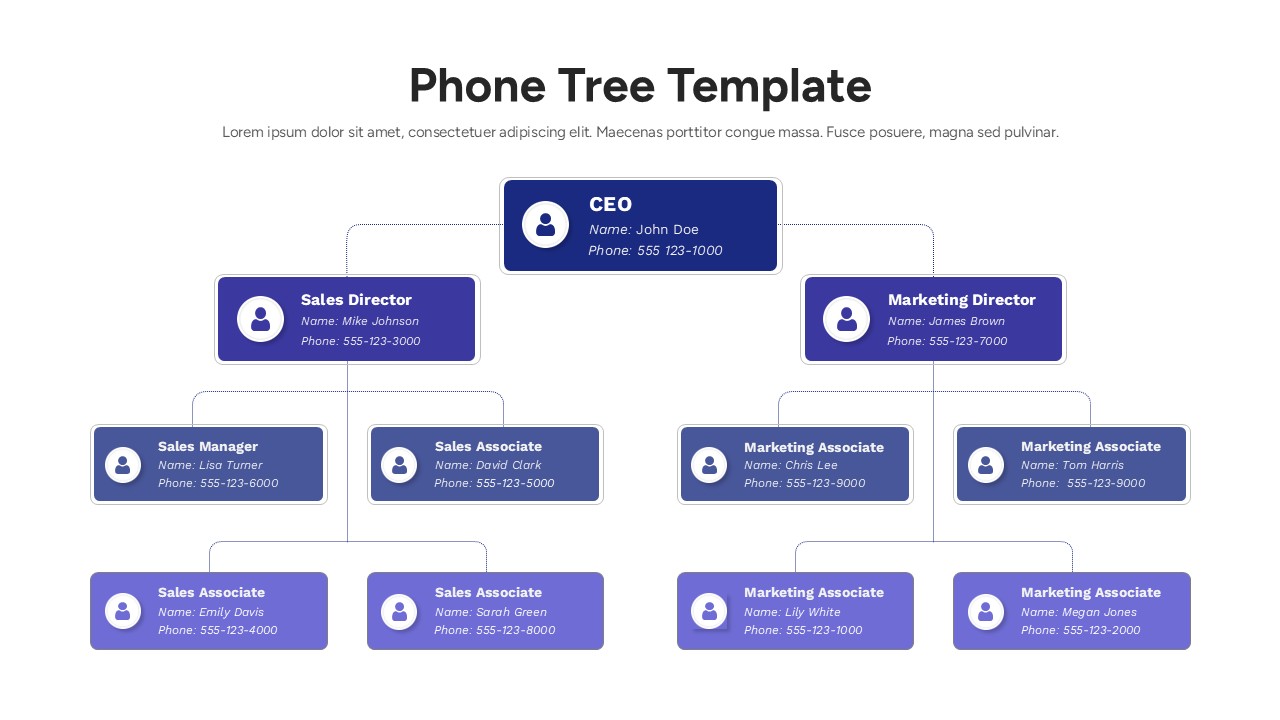
Corporate Phone Tree Hierarchy Template for PowerPoint & Google Slides
Org Chart
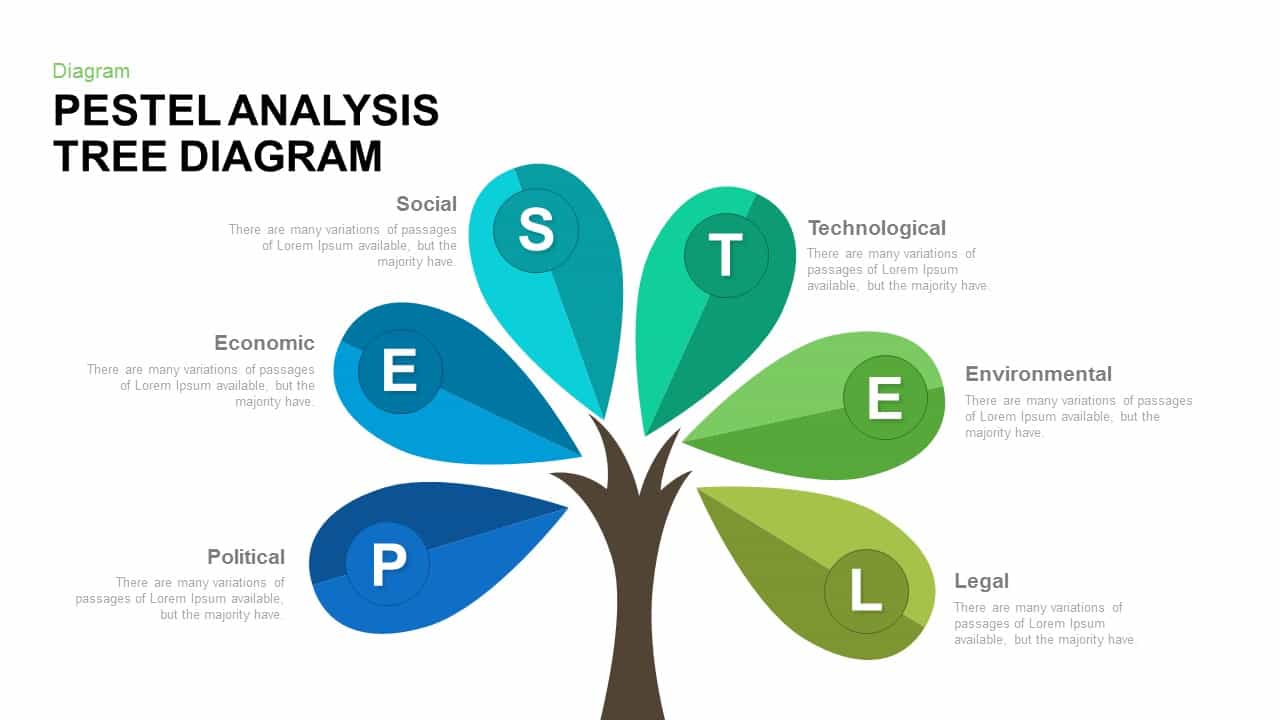
PESTEL Analysis Tree Diagram for PowerPoint & Google Slides
Process
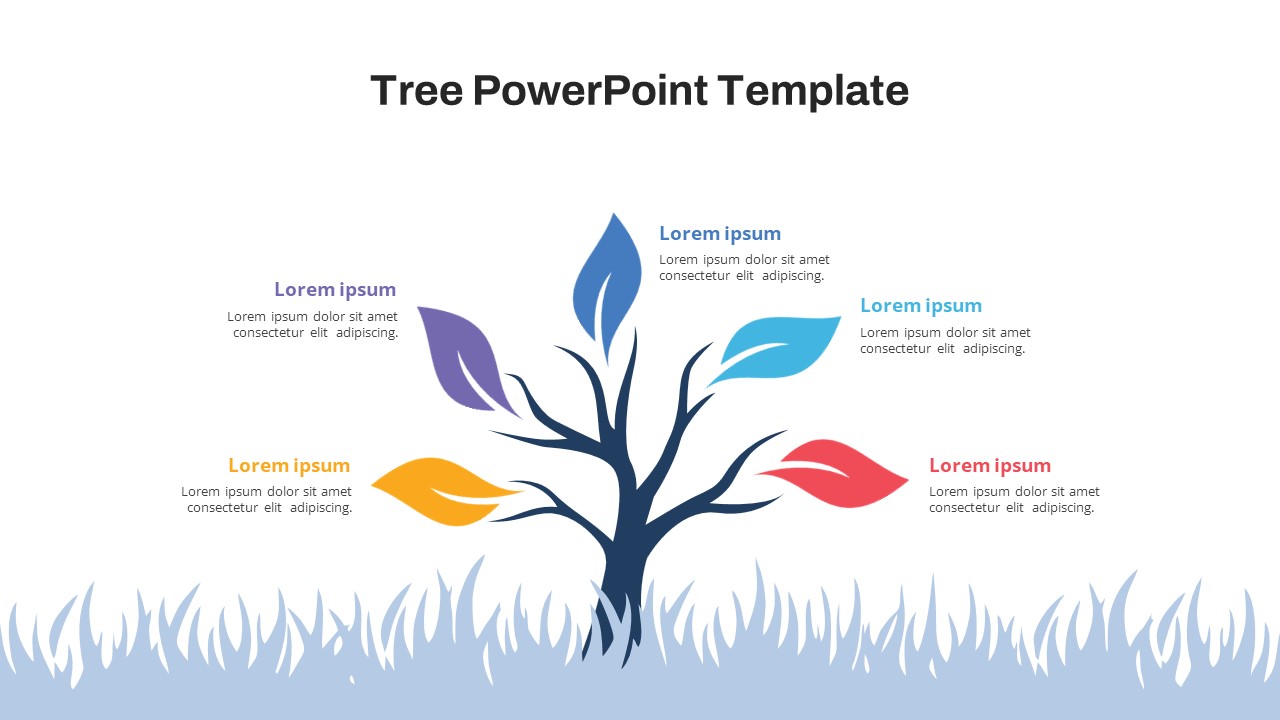
Free Colorful Tree Diagram for Growth & Strategy in PowerPoint & Google Slides
Infographics
Free
4 Step Process PowerPoint & Google Slides Template for PowerPoint & Google Slides
Process