Infographics Presentation Templates for PowerPoint and Google Slides
![]() Filter
Filter
Filter
-

Fishbone Process Diagram template for PowerPoint & Google Slides
Infographics
-
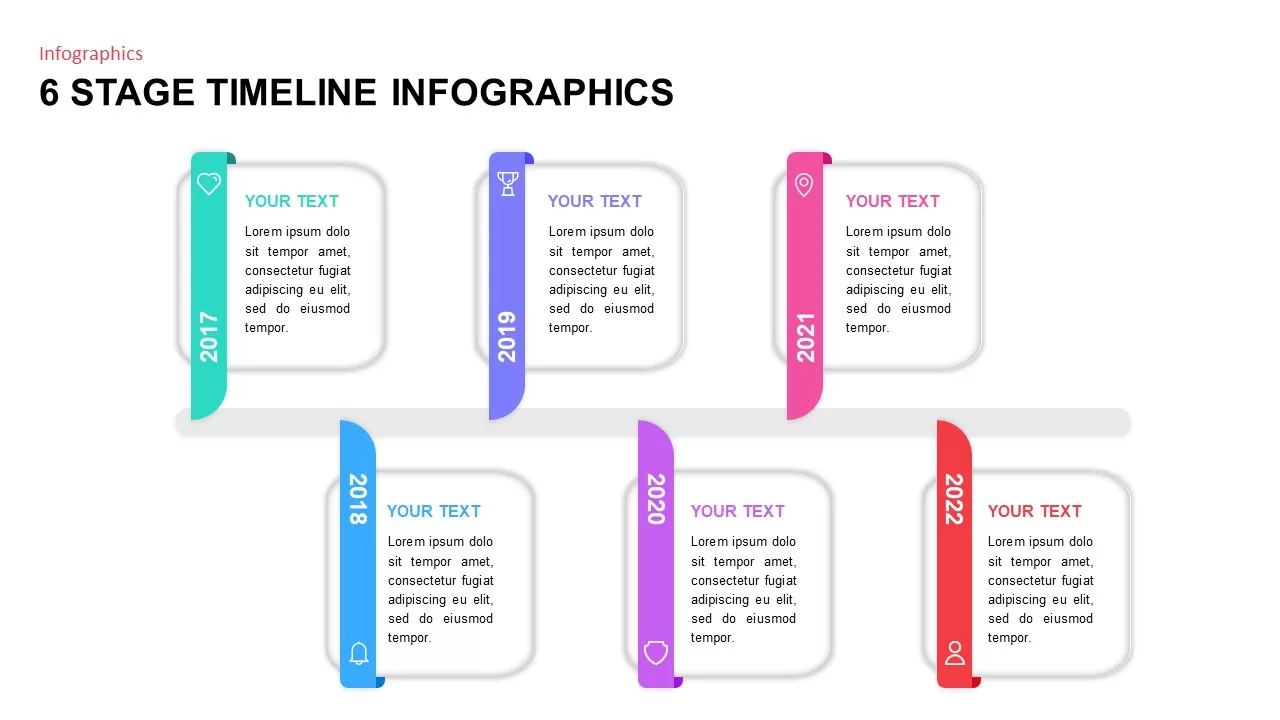
6 Stage Timeline Infographics template for PowerPoint & Google Slides
Timeline
-
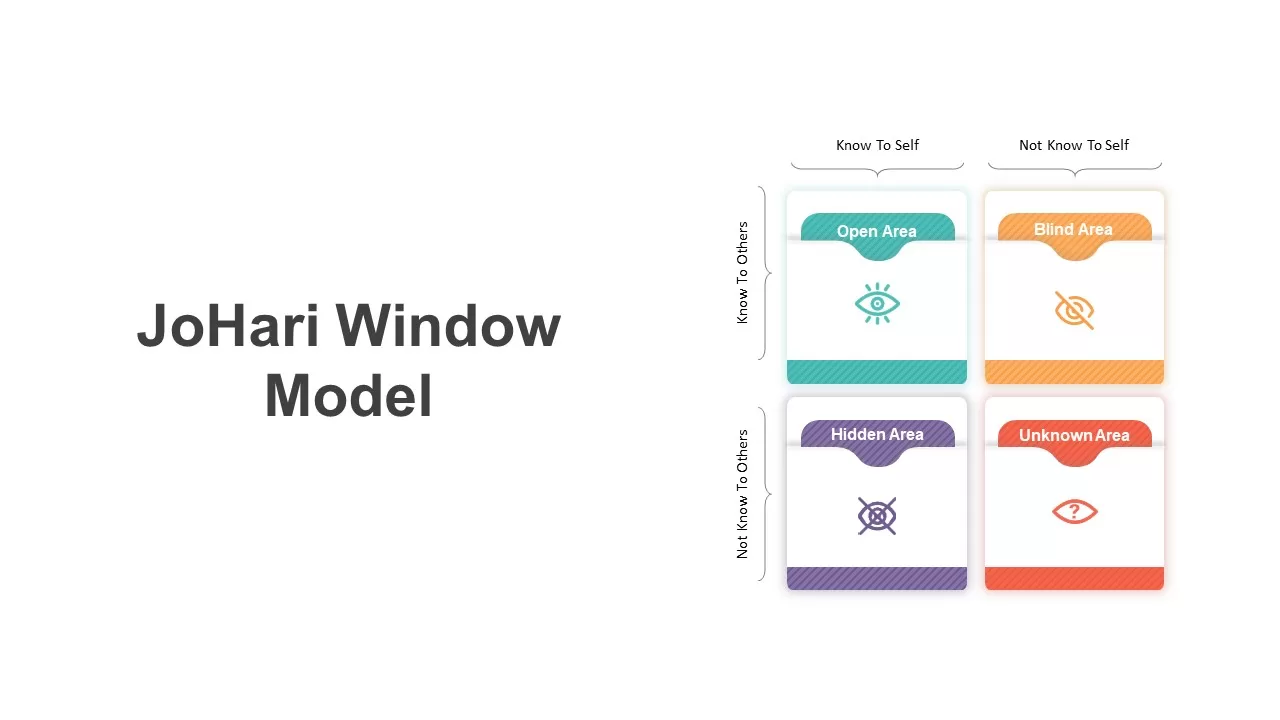
JoHari Window Model Template for PowerPoint & Google Slides
Employee Performance
-
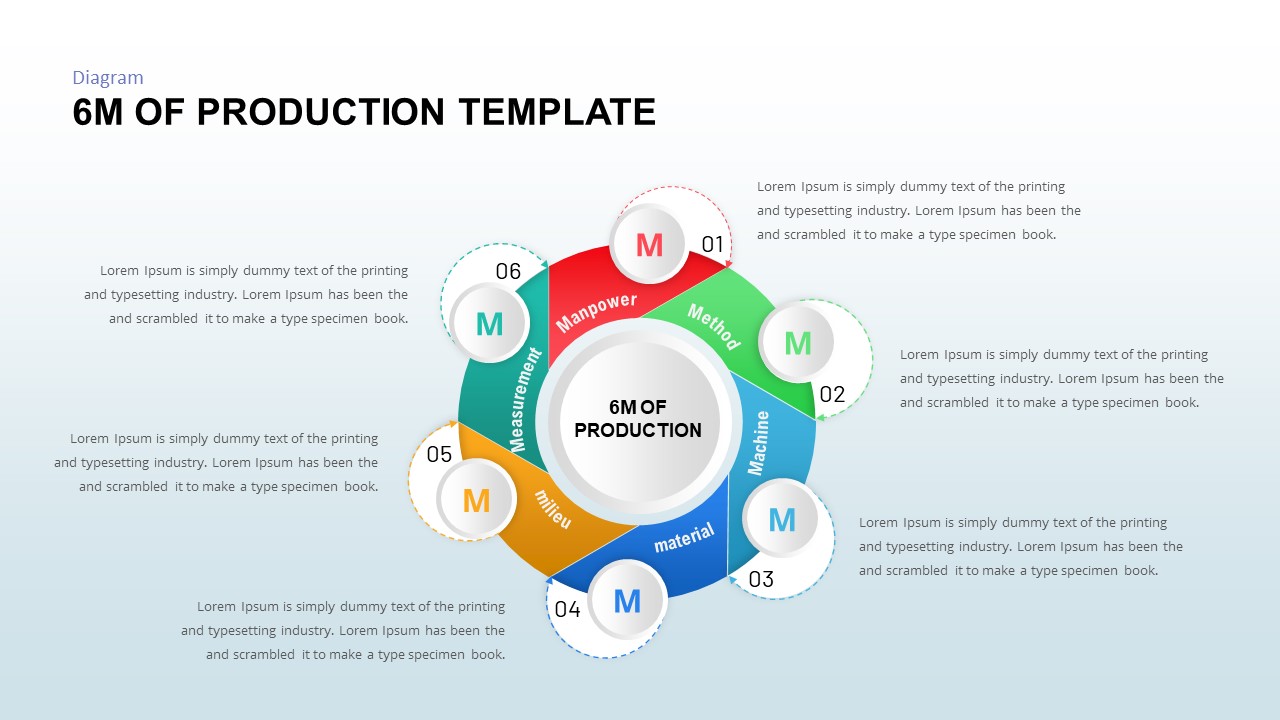
6M of Production Template for PowerPoint & Google Slides
Business Plan
-
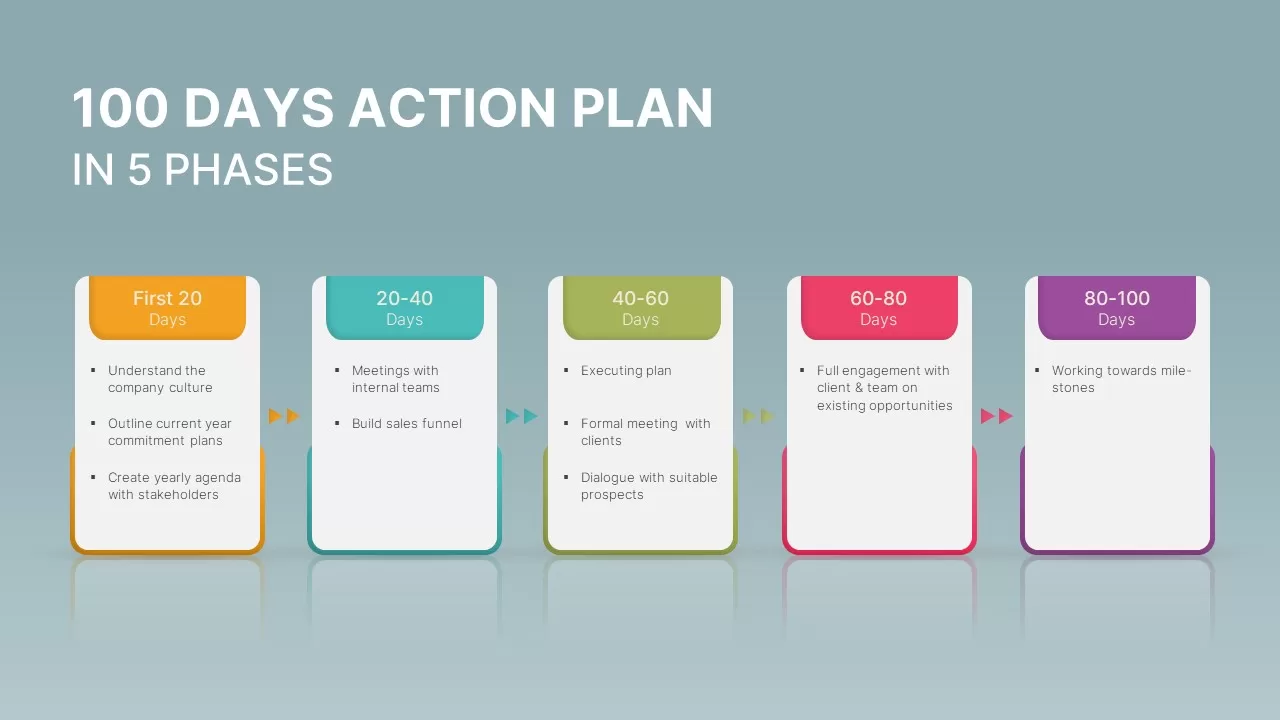
100 Days Action Plan in 5 Phases Template for PowerPoint & Google Slides
Business Plan
-
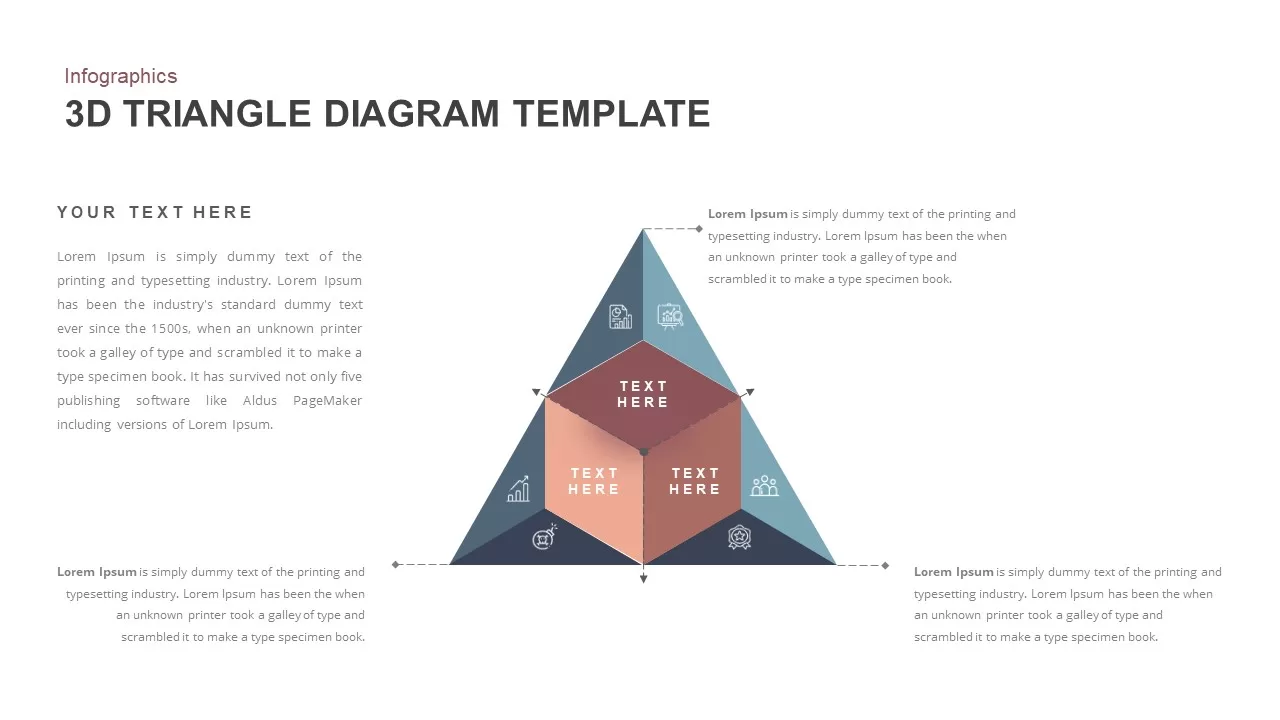
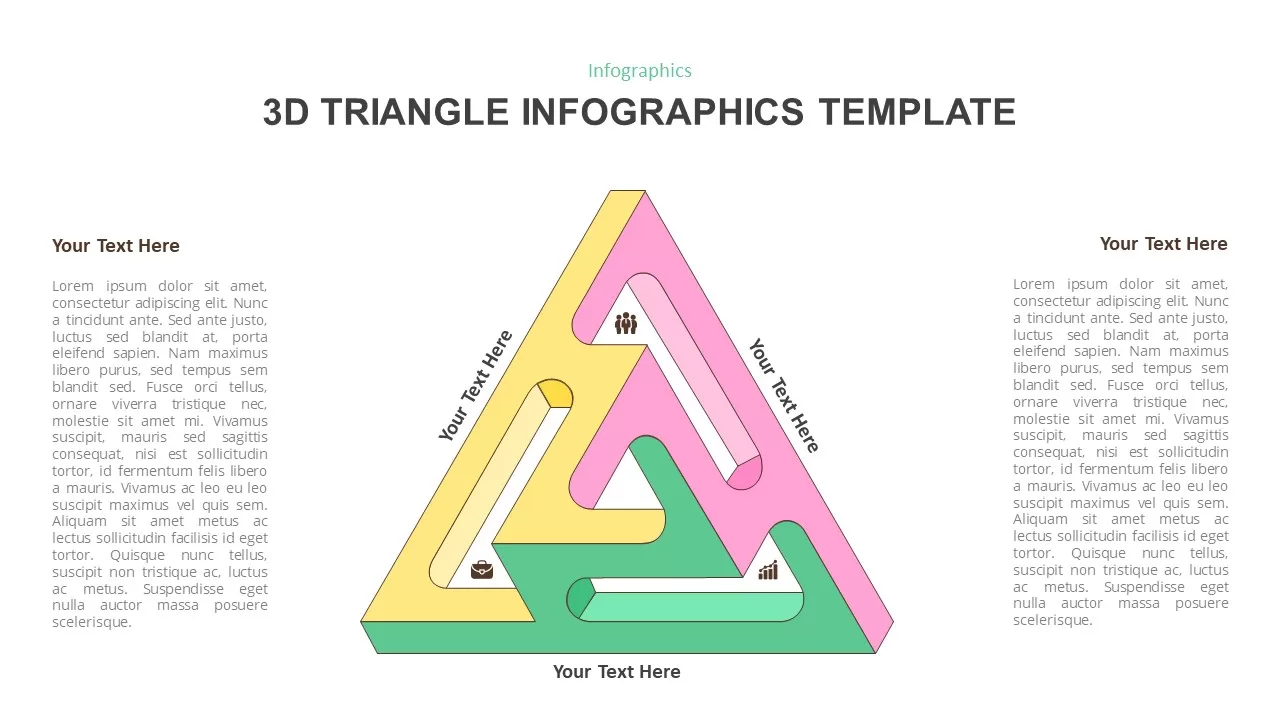
3D Triangle Diagram Infographic Template for PowerPoint & Google Slides
Pyramid
-
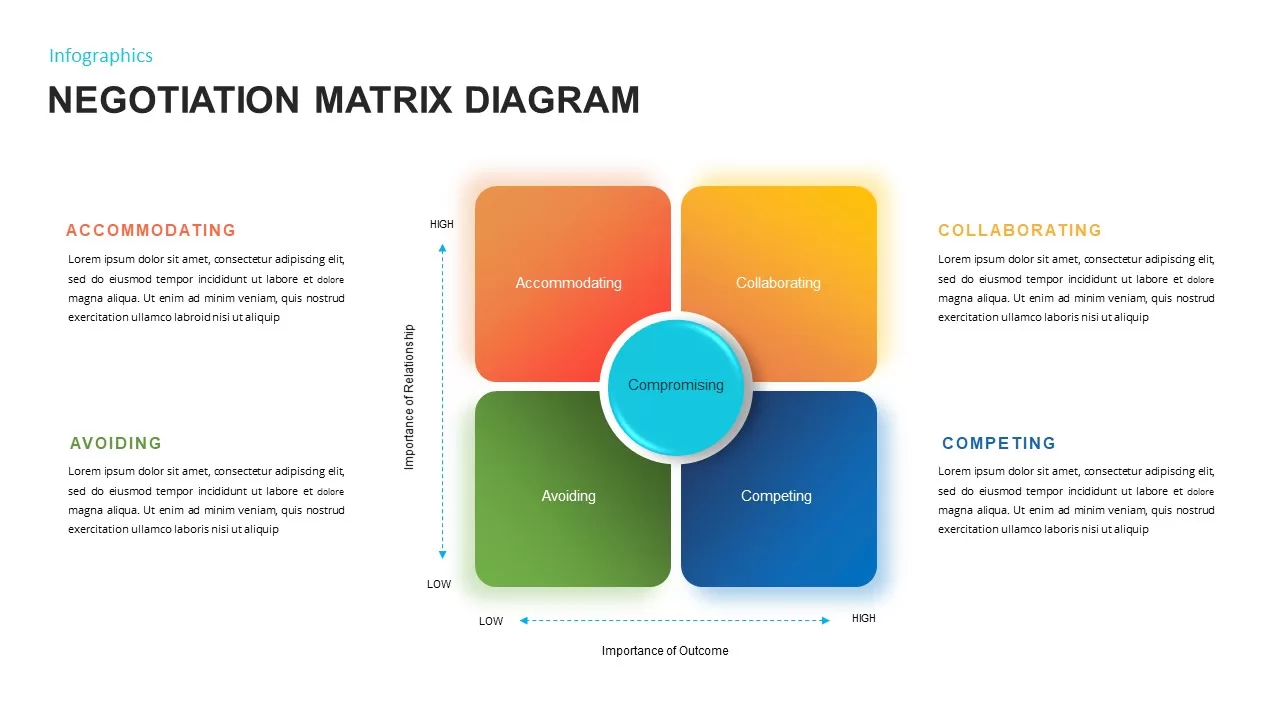
Negotiation Matrix Diagram Template for PowerPoint & Google Slides
Business
-
Versatile 3D Modular Shape Infographics Template for PowerPoint & Google Slides
Infographics
-
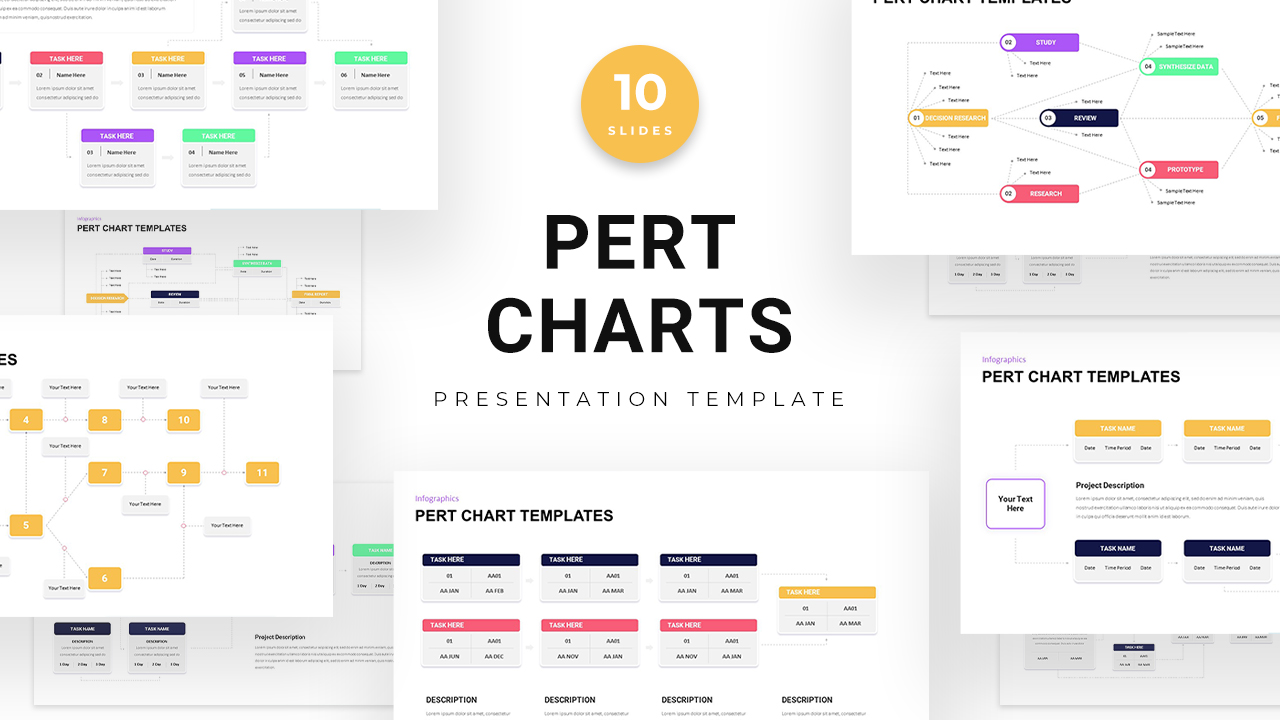
PERT Chart Project Management template for PowerPoint & Google Slides
Project Status
-
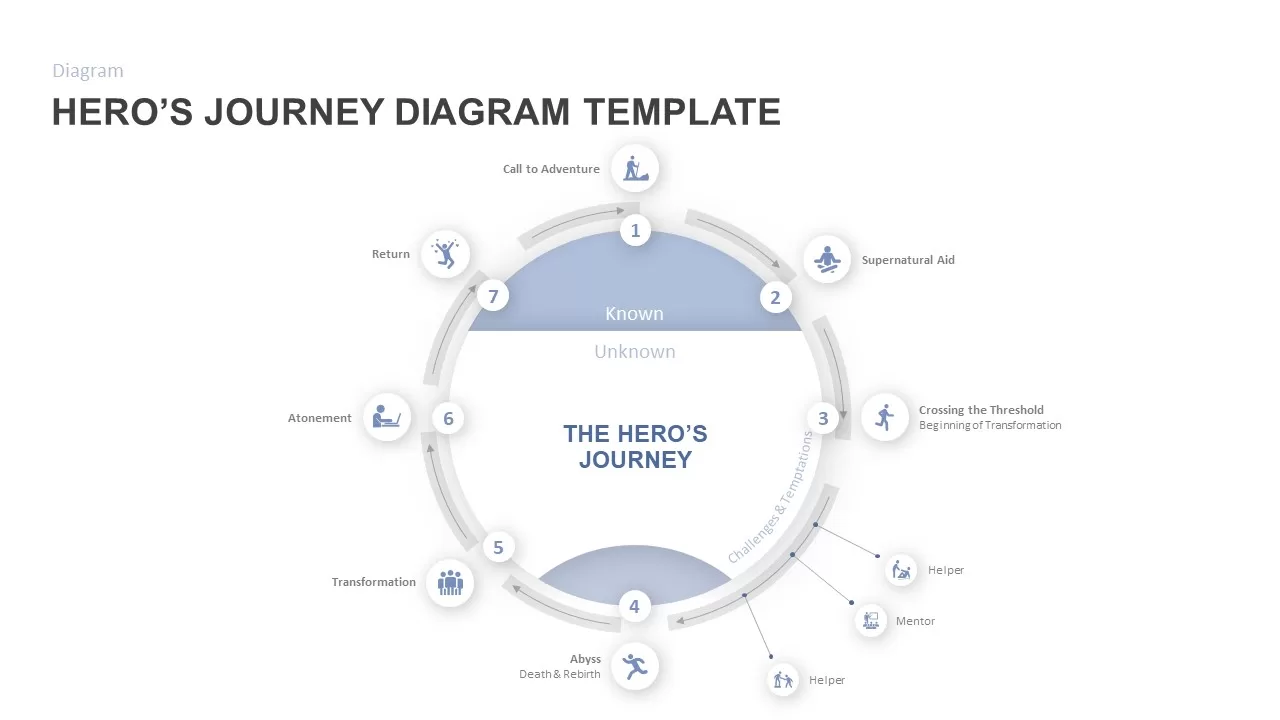
Hero’s Journey Diagram Template for PowerPoint & Google Slides
Customer Journey
-

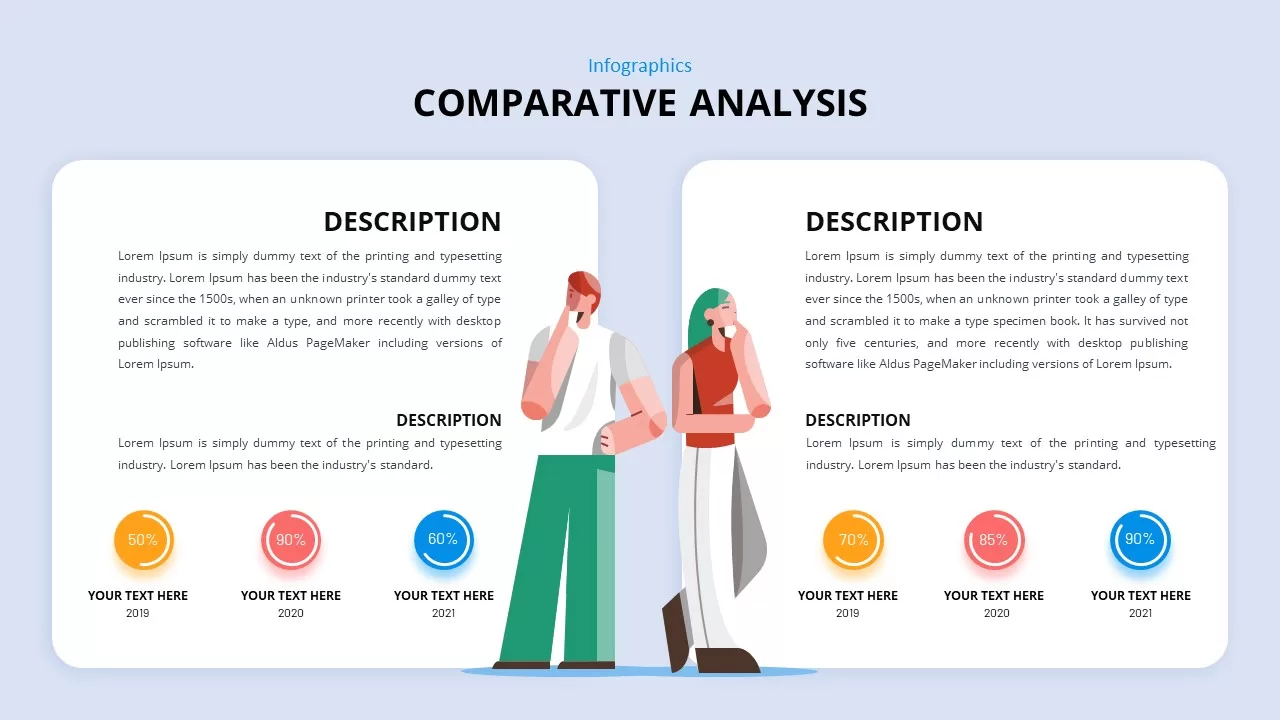
Comparative Analysis Template for PowerPoint & Google Slides
Comparison
-
IQ Scale Analysis Diagram template for PowerPoint & Google Slides
Employee Performance
-
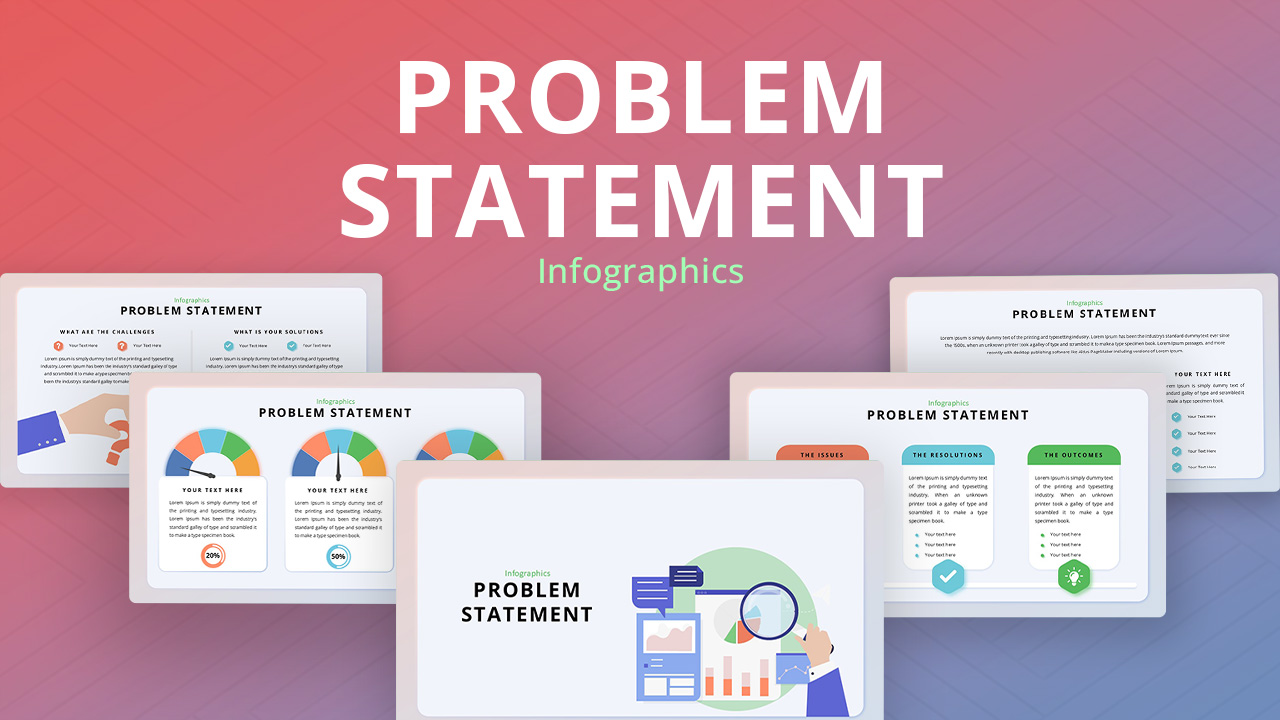
Problem Statement Analysis template for PowerPoint & Google Slides
Business Strategy
-
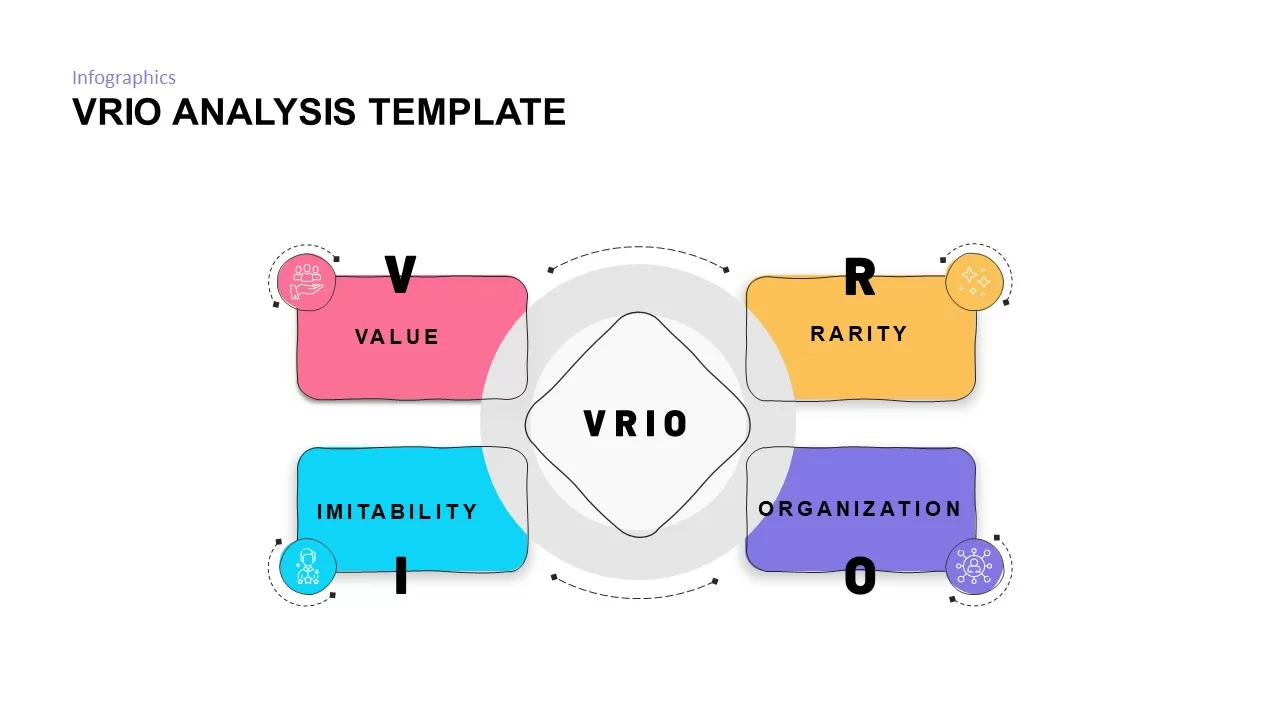
VRIO Analysis Framework template for PowerPoint & Google Slides
Business Strategy
-
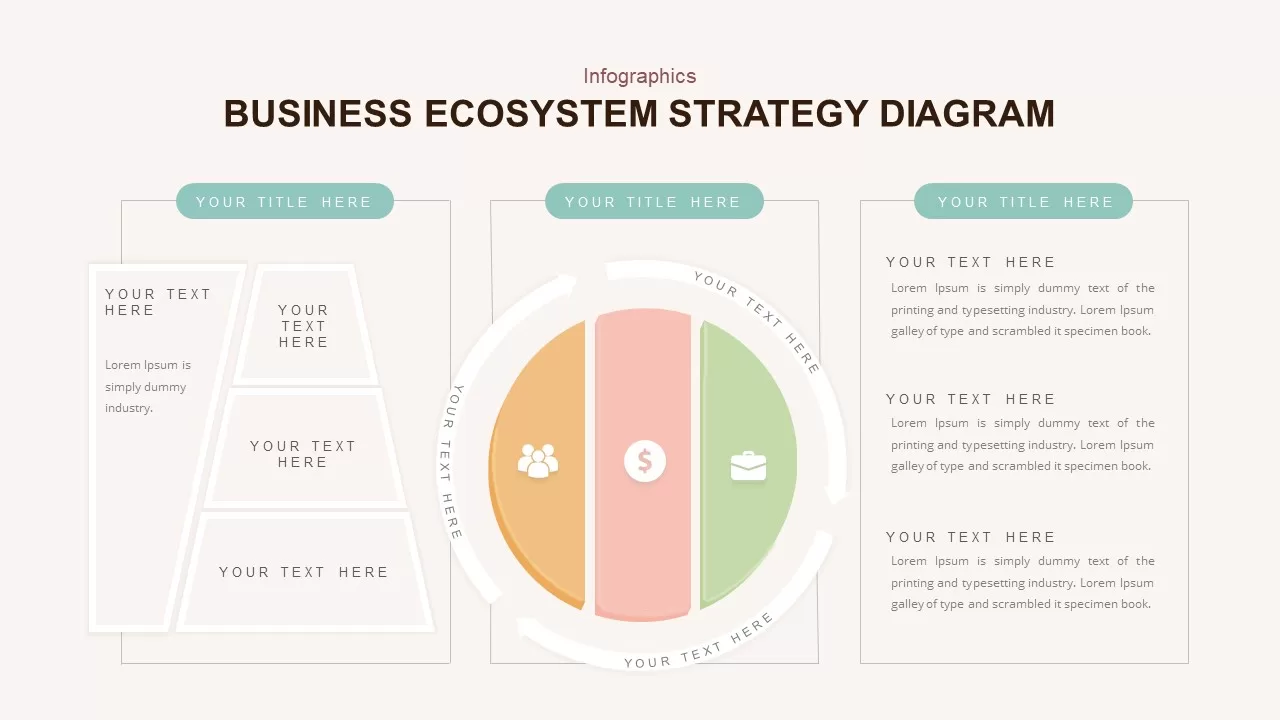
Business Ecosystem Strategy Diagram template for PowerPoint & Google Slides
Business Strategy
-
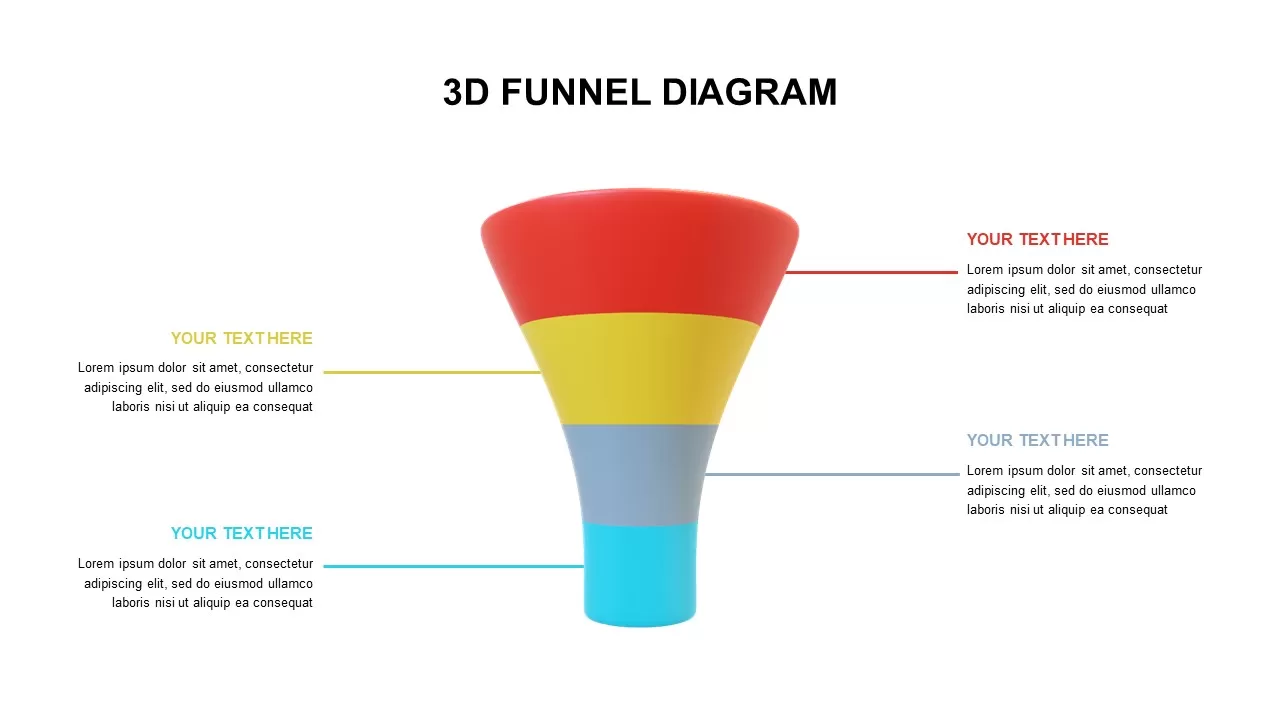
Free 4-Step 3D Funnel Diagram Template for PowerPoint & Google Slides
Funnel
Free
-
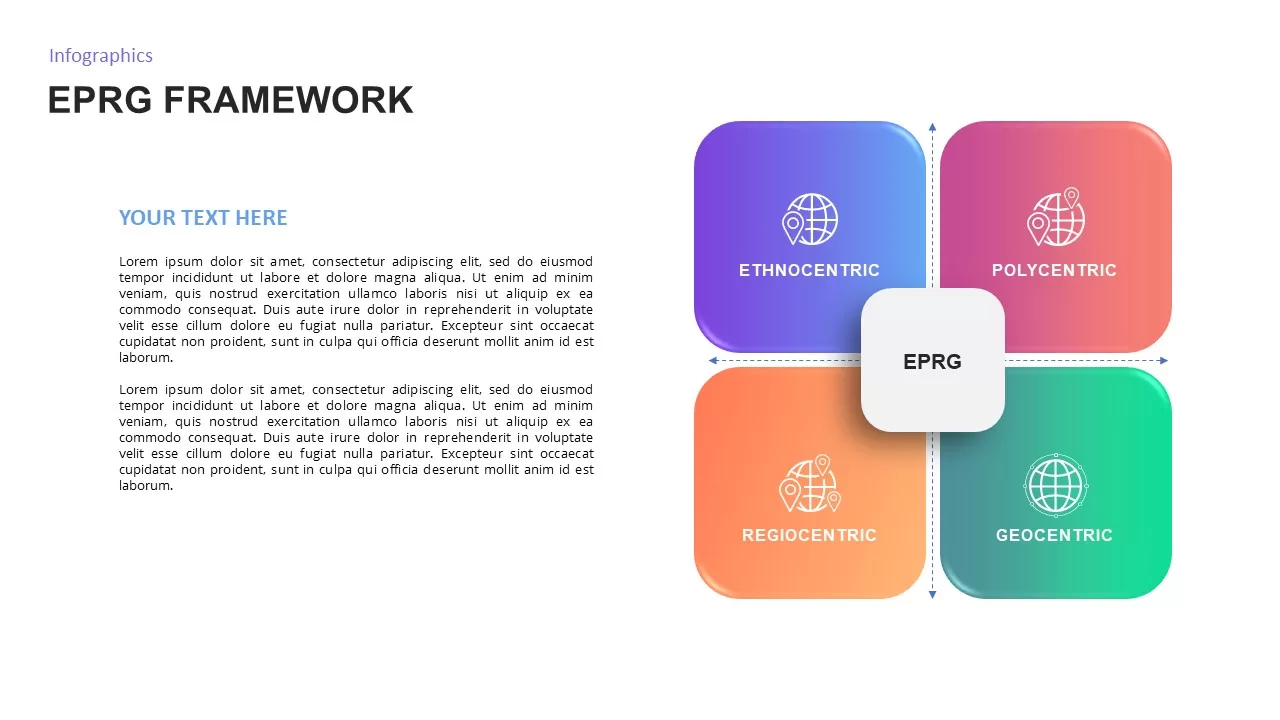
EPRG Framework Analysis template for PowerPoint & Google Slides
Business Strategy
-
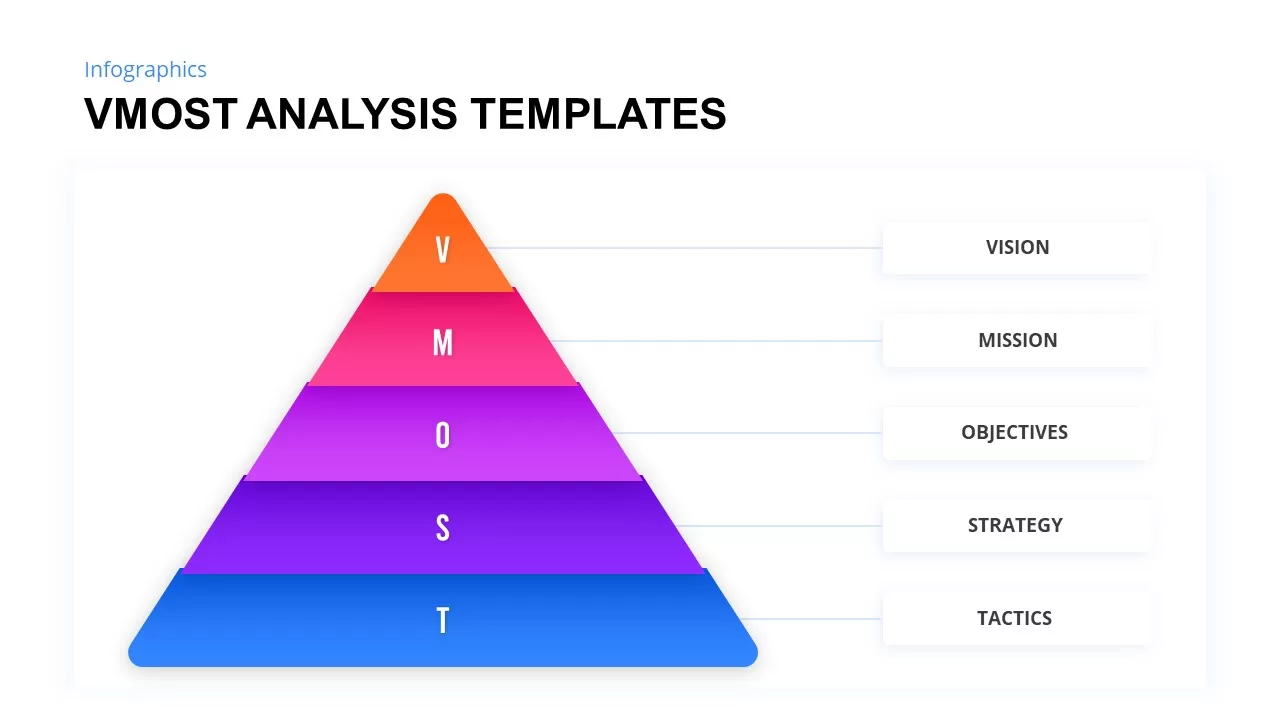
VMOST Analysis Template for PowerPoint & Google Slides
Business Strategy
-
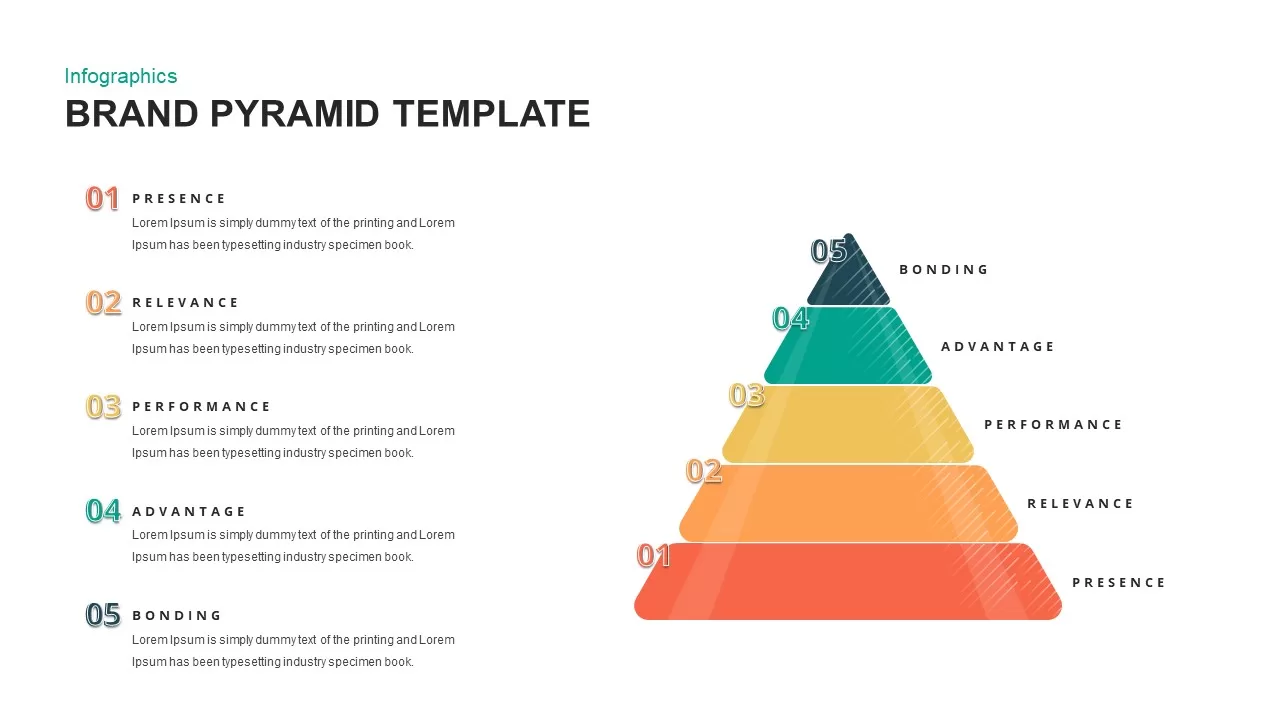
Brand Pyramid Framework template for PowerPoint & Google Slides
Pyramid
-
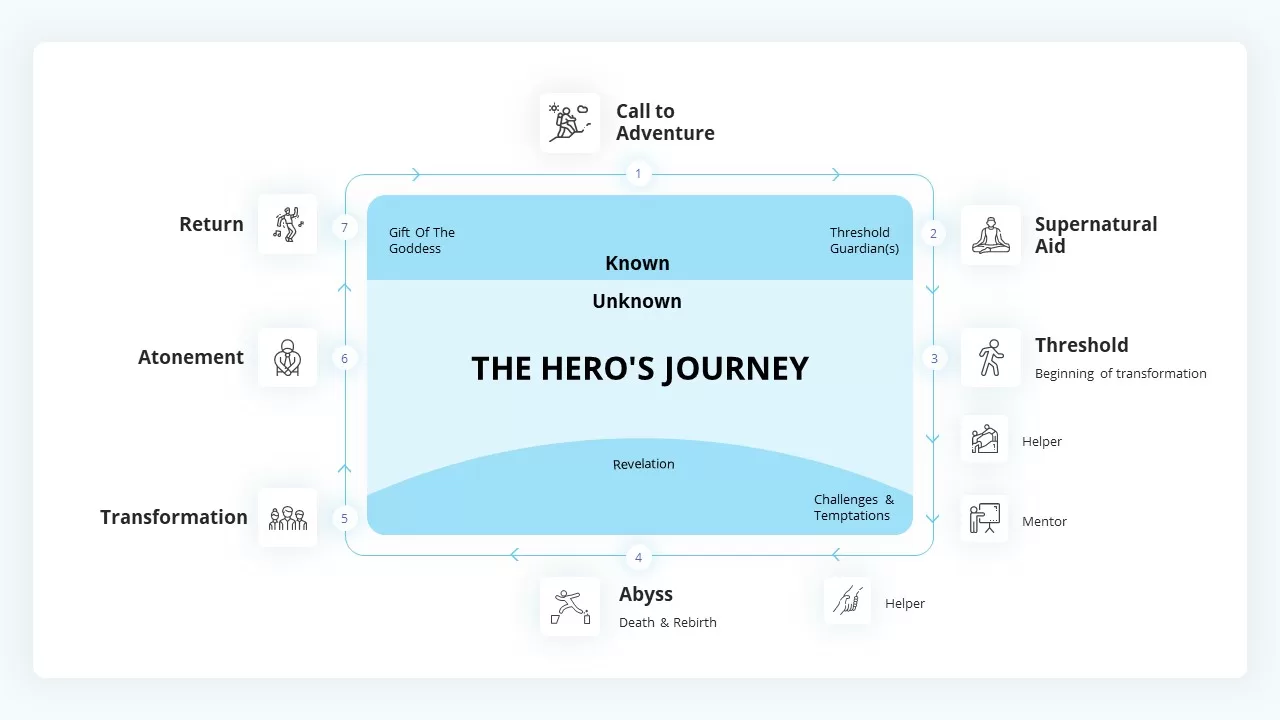
The Hero’s Journey Infographic Framework Template for PowerPoint & Google Slides
Customer Journey
-
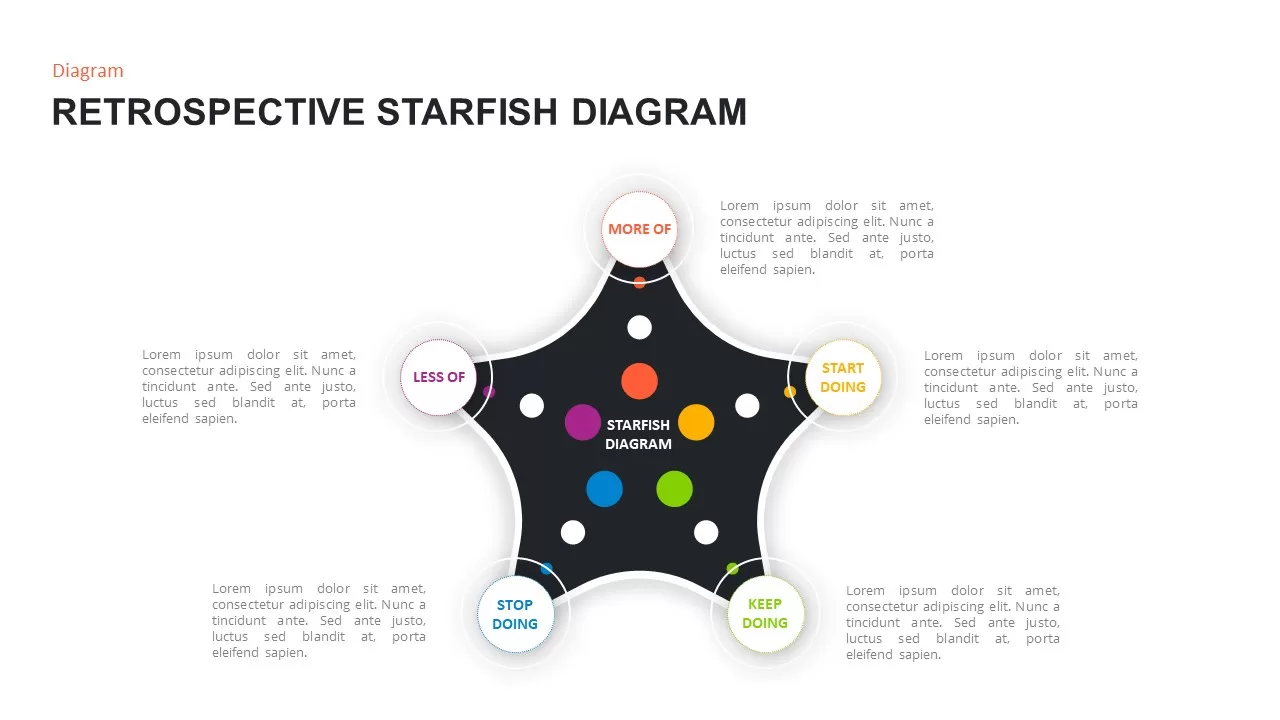
Retrospective Starfish Diagram Template for PowerPoint & Google Slides
Scrum
-
Stacked Cubes Pyramid Six-Option Diagram Template for PowerPoint & Google Slides
Pyramid
-
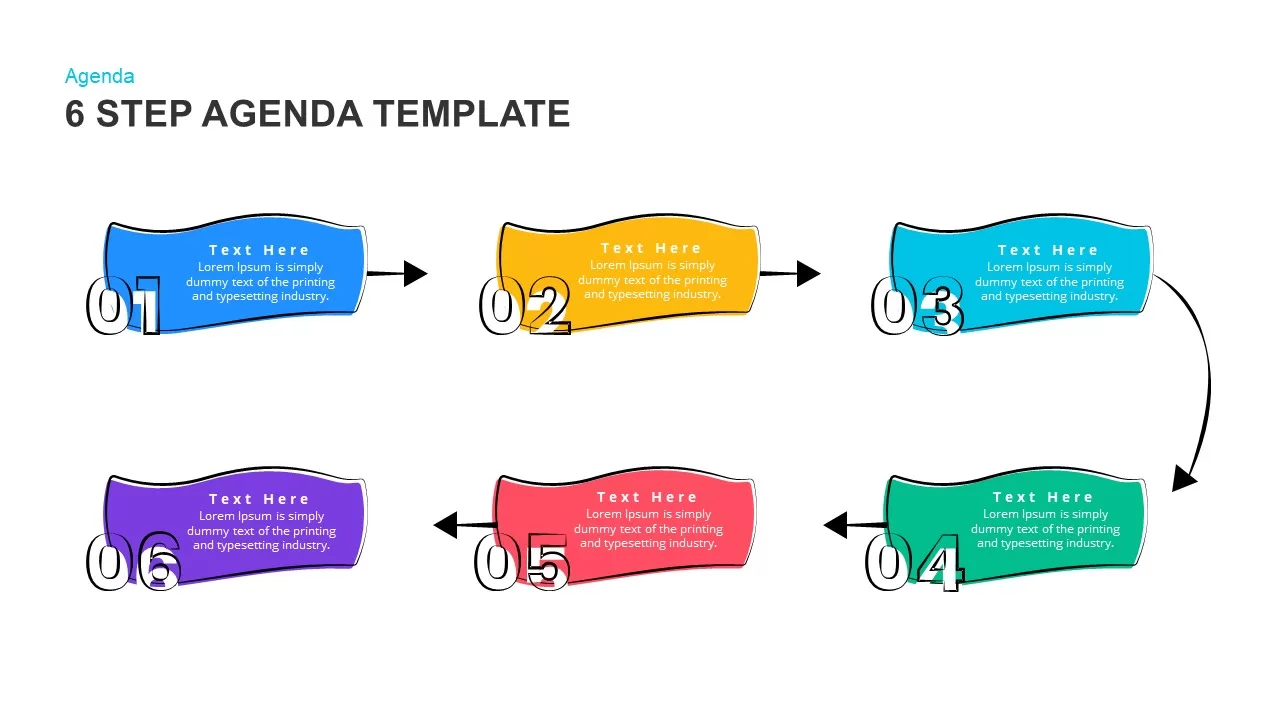
Modern & Dynamic 6-Step Agenda Sequence Template for PowerPoint & Google Slides
Agenda
-
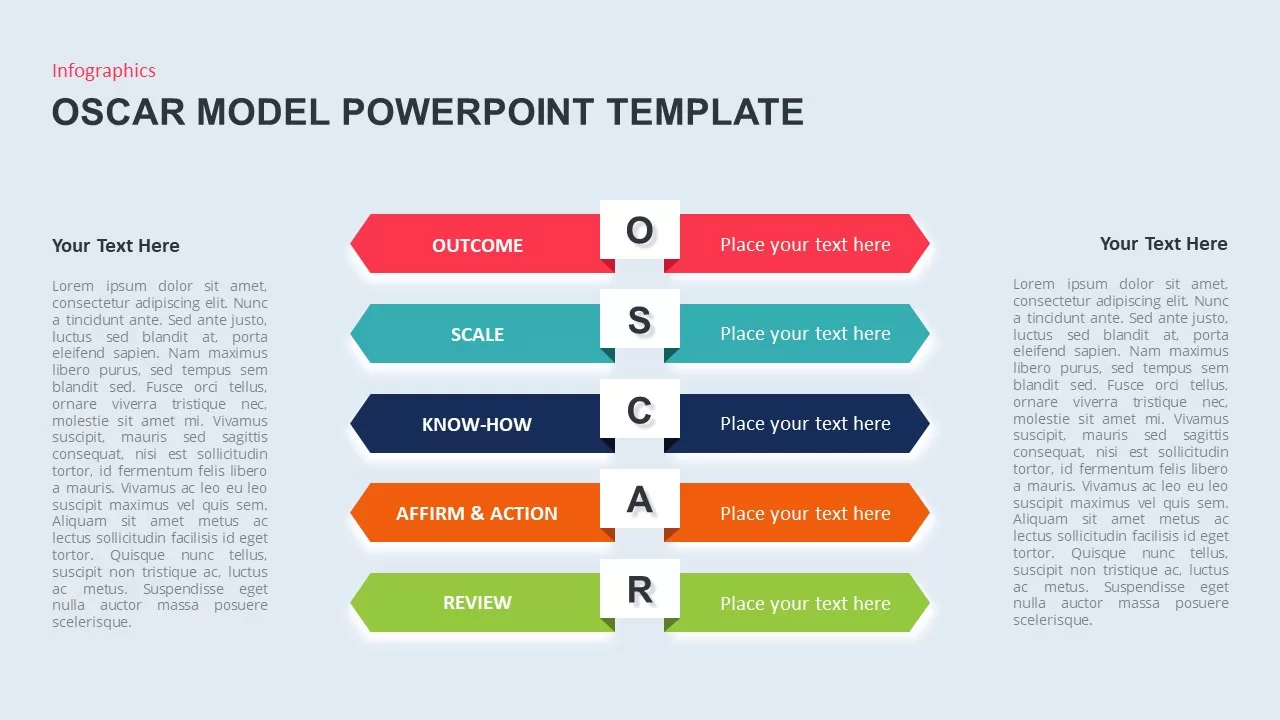
OSCAR Behavior Model Infographic Template for PowerPoint & Google Slides
HR
-
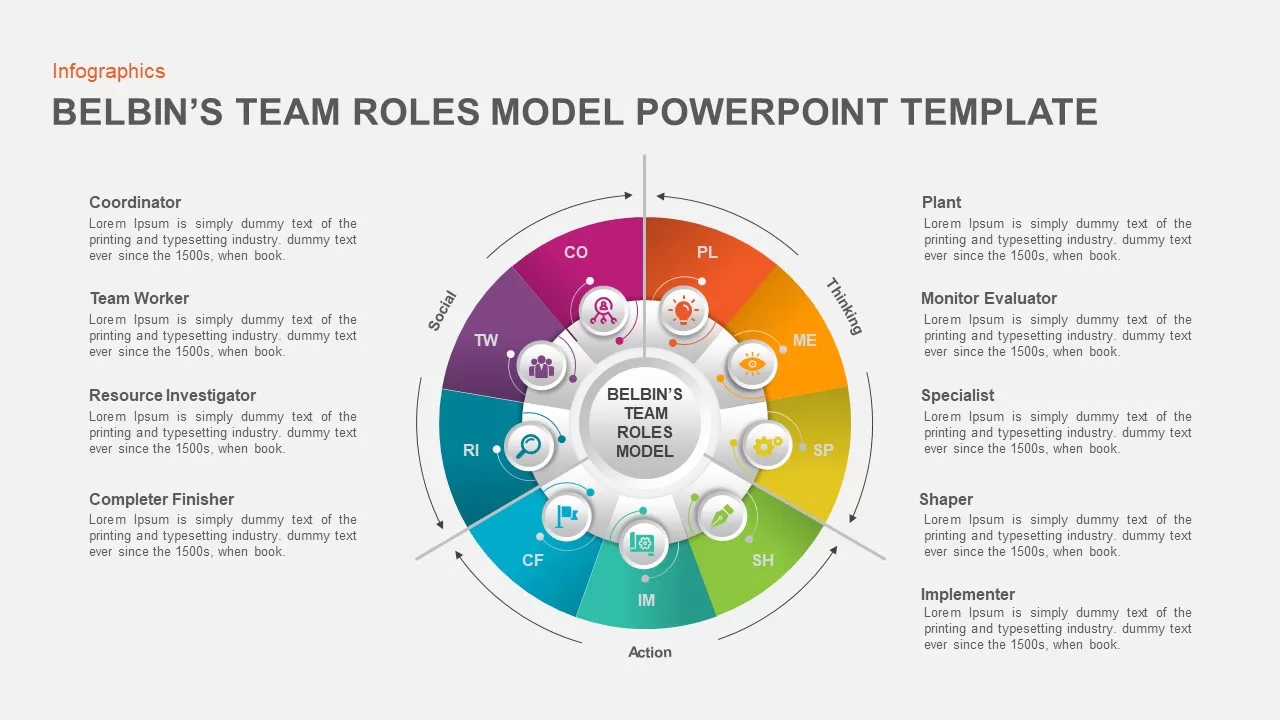
Belbin’s Team Roles Model Diagram Template for PowerPoint & Google Slides
HR
-
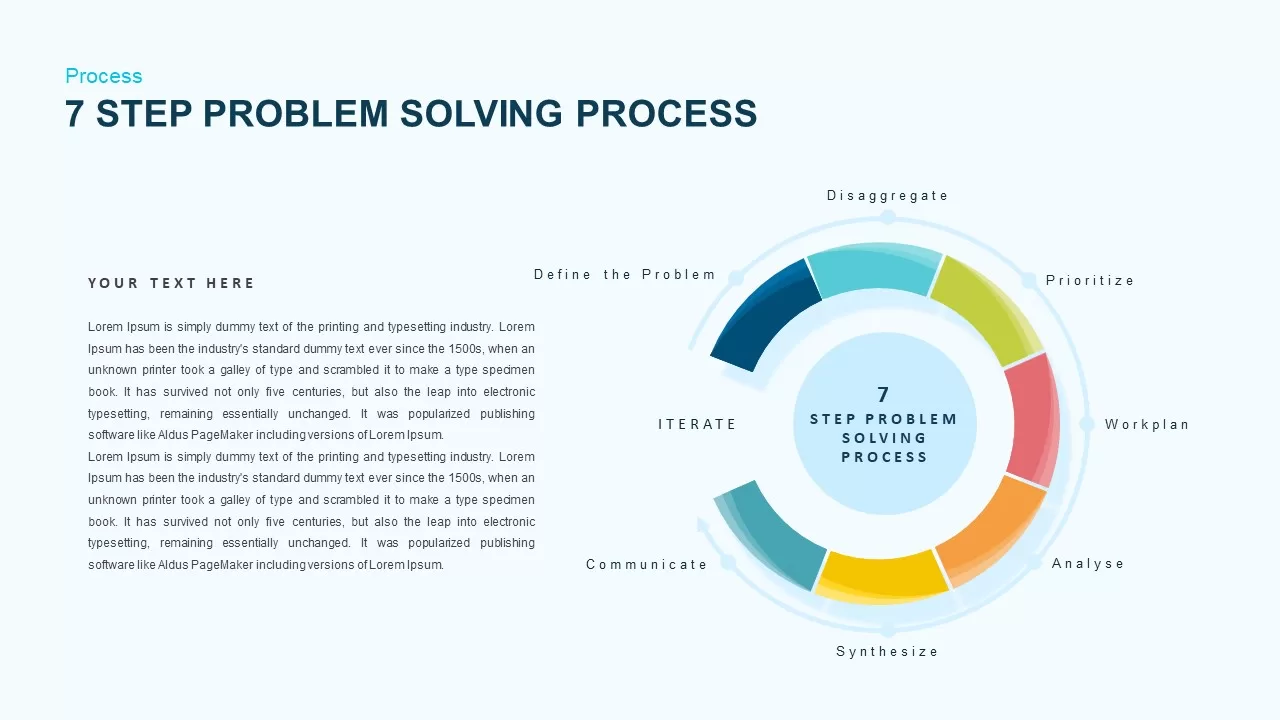
Problem Solving Process Diagram Template for PowerPoint & Google Slides
Process
-
Affinity Diagram Infographic Template for PowerPoint & Google Slides
Business
-
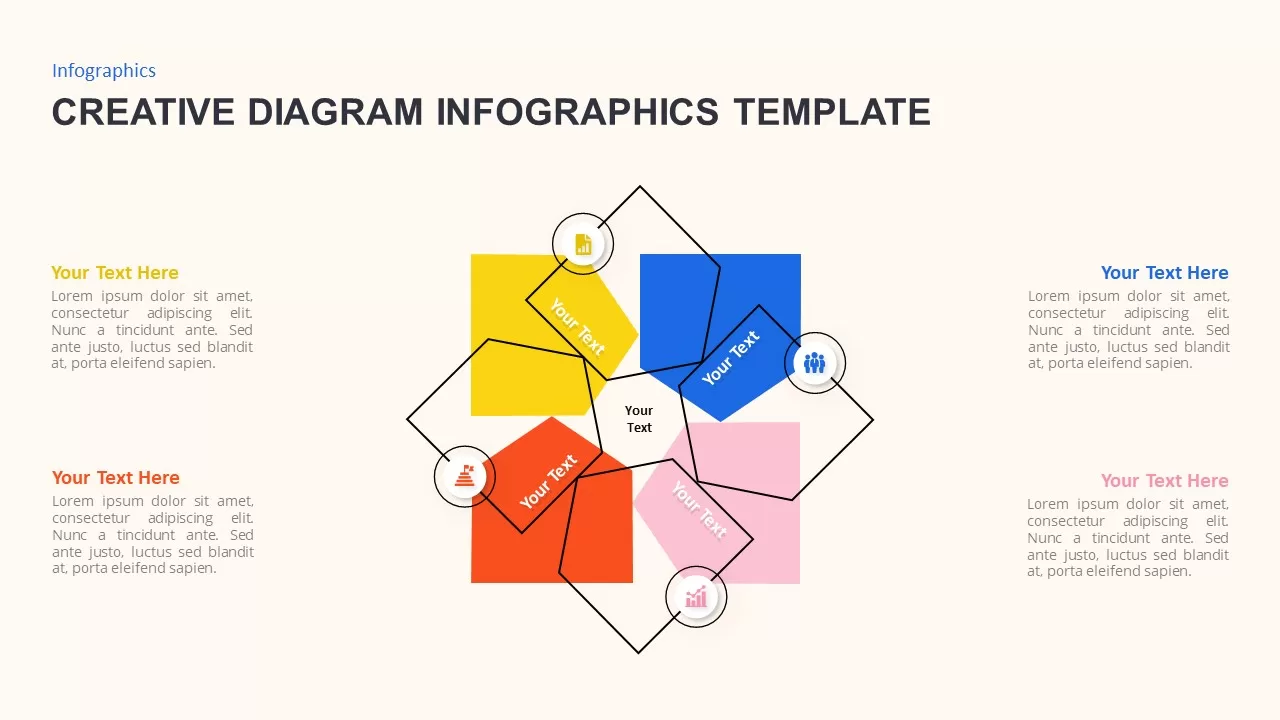
Versatile Creative Diagram Infographics Template for PowerPoint & Google Slides
Process
-
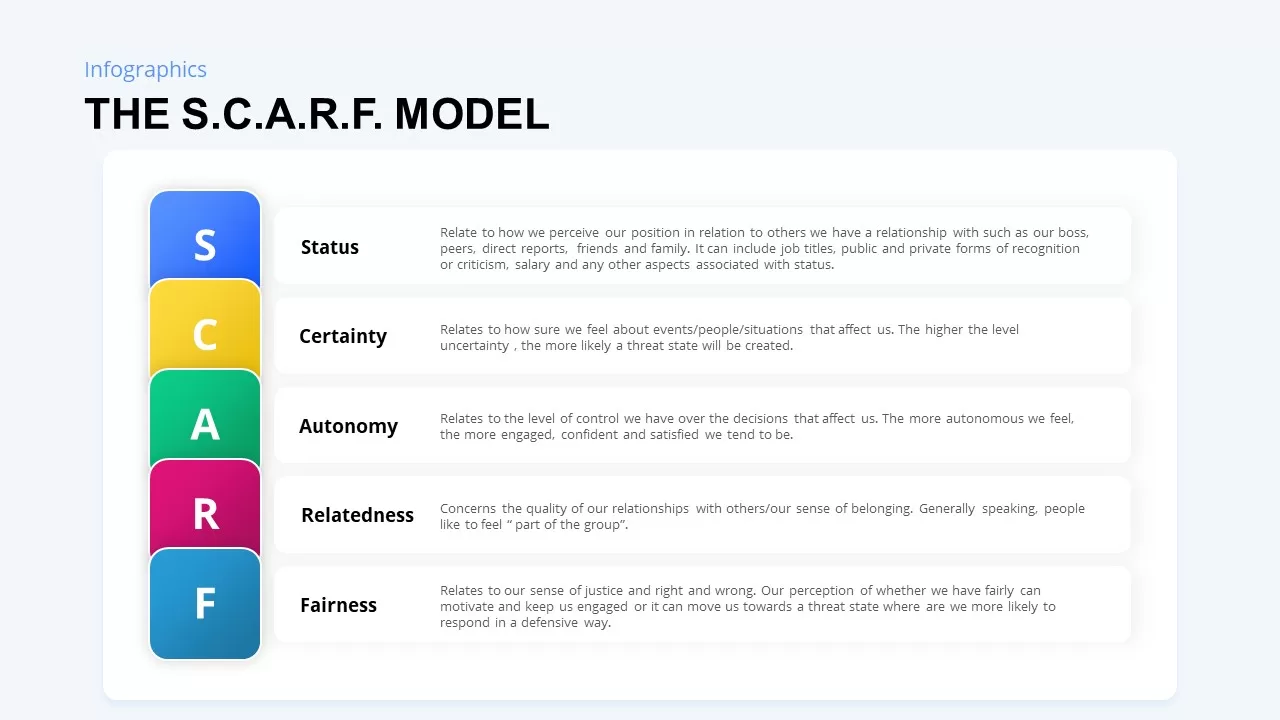
SCARF Model Social Threats & Rewards Template for PowerPoint & Google Slides
Business Strategy
-
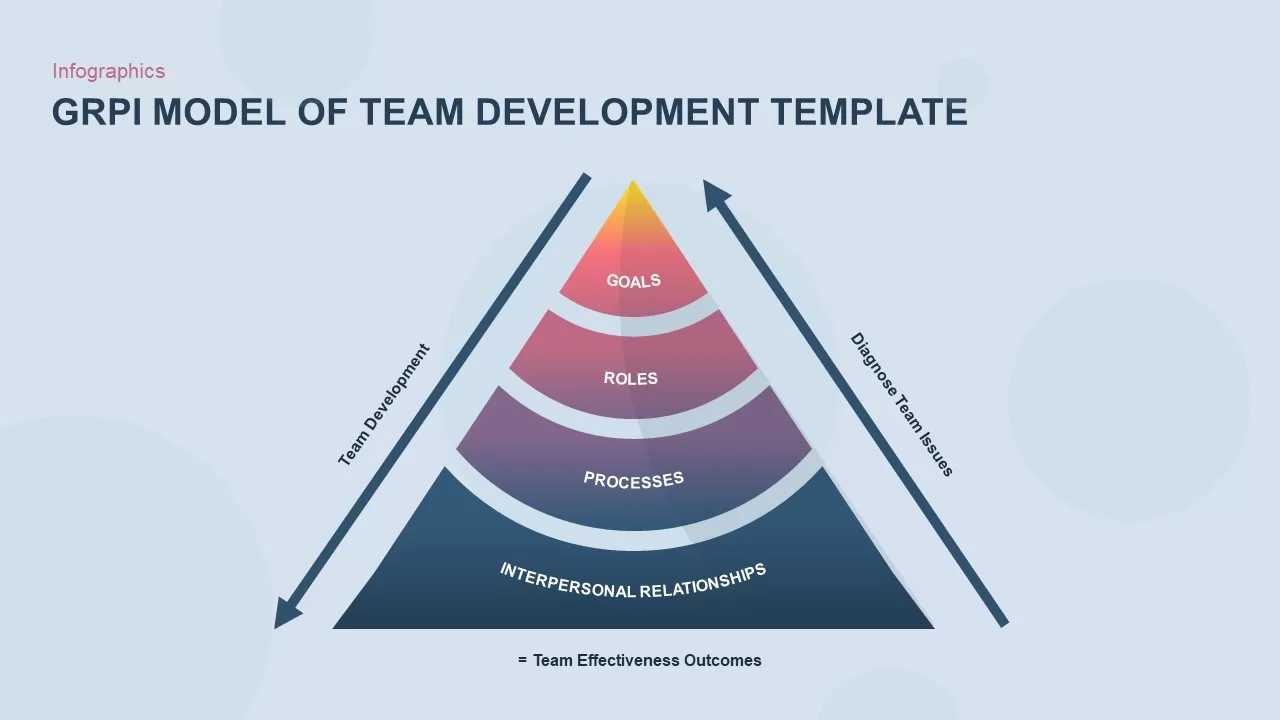
GRPI Model of Team Development Framework Template for PowerPoint & Google Slides
Leadership
-
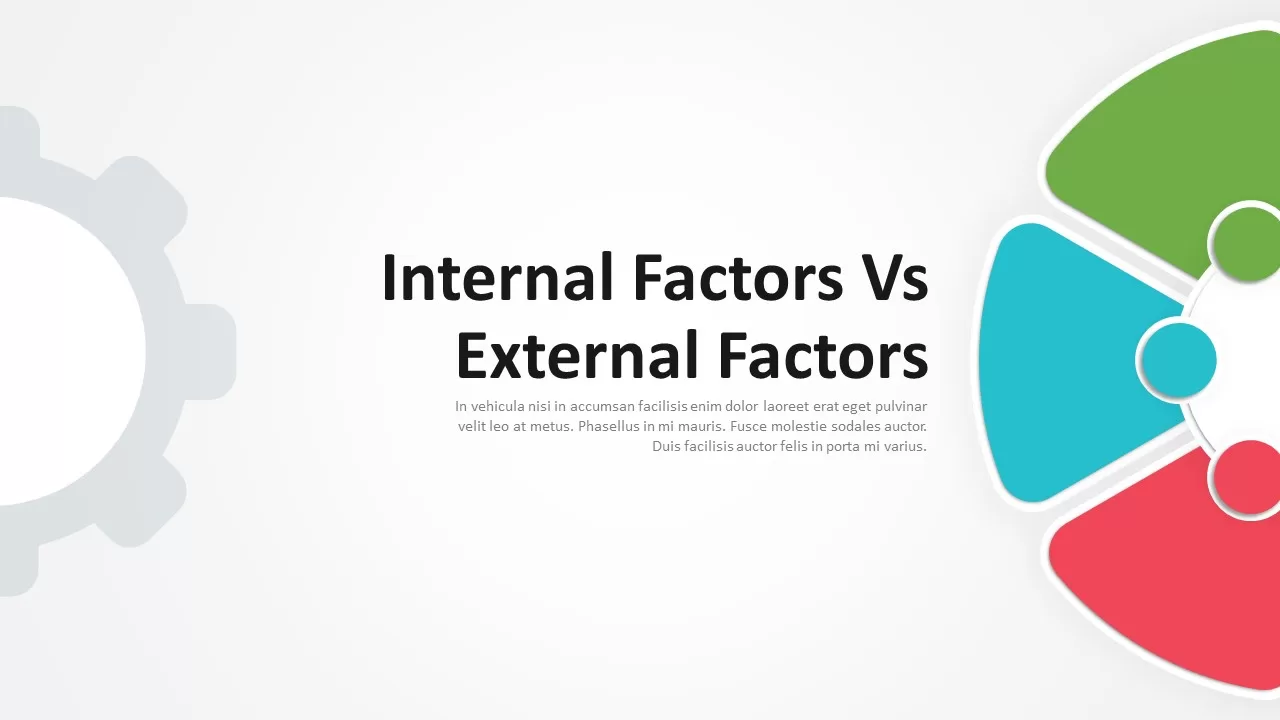
Internal vs External Factors Comparison Template for PowerPoint & Google Slides
Comparison
-
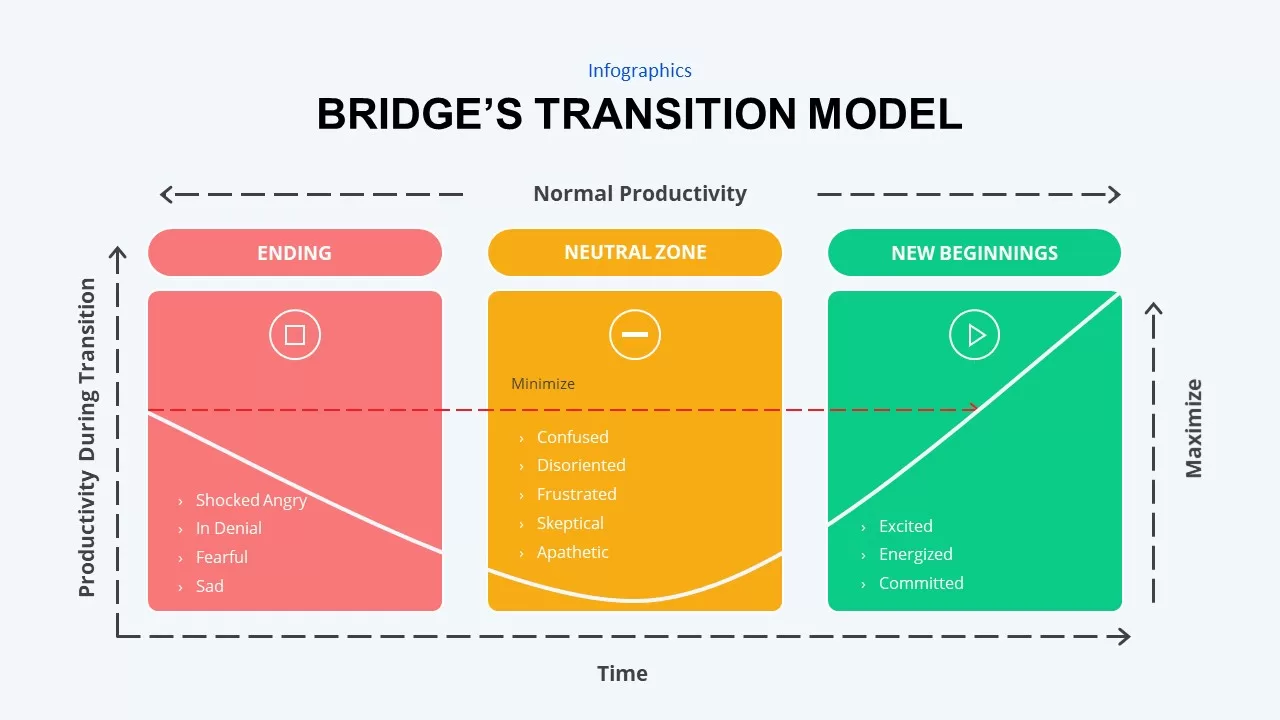
Bridge’s Transition Model Infographic Template for PowerPoint & Google Slides
HR
-
Editable Four-Quadrant TOWS Matrix Template for PowerPoint & Google Slides
Opportunities Challenges
-
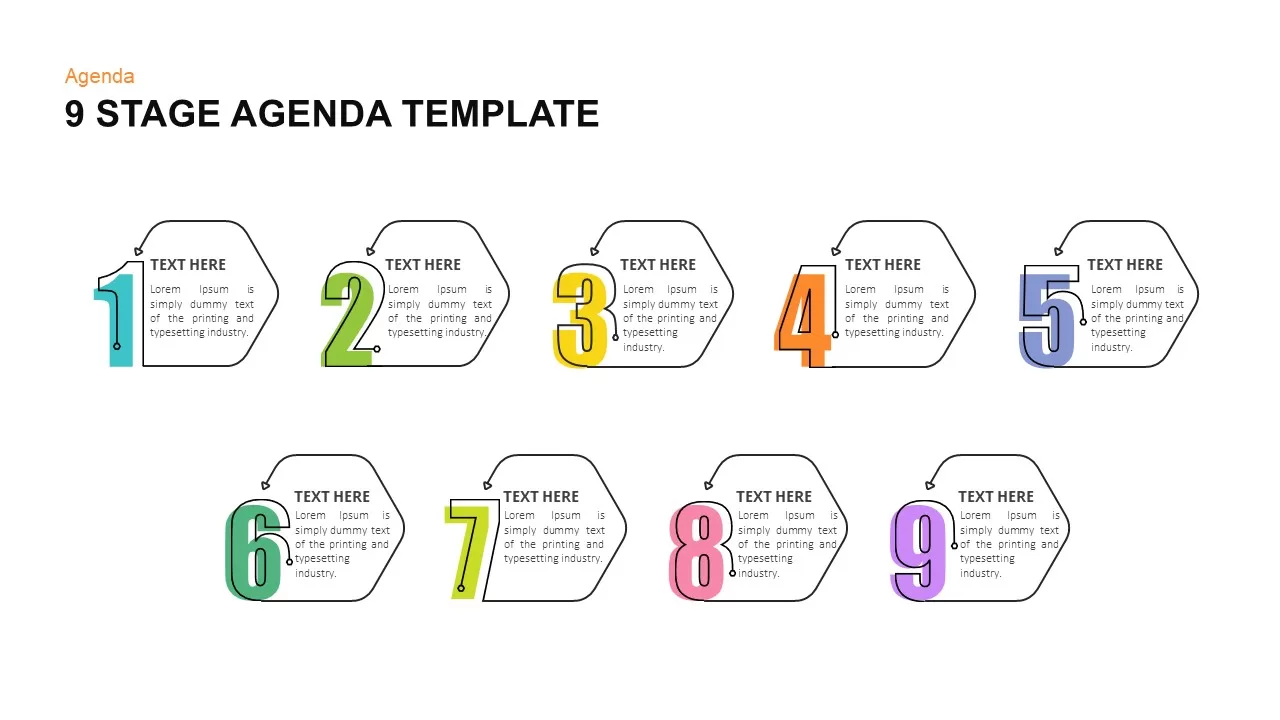
Clock-Timeline Nine-Stage Agenda Template for PowerPoint & Google Slides
Agenda
-
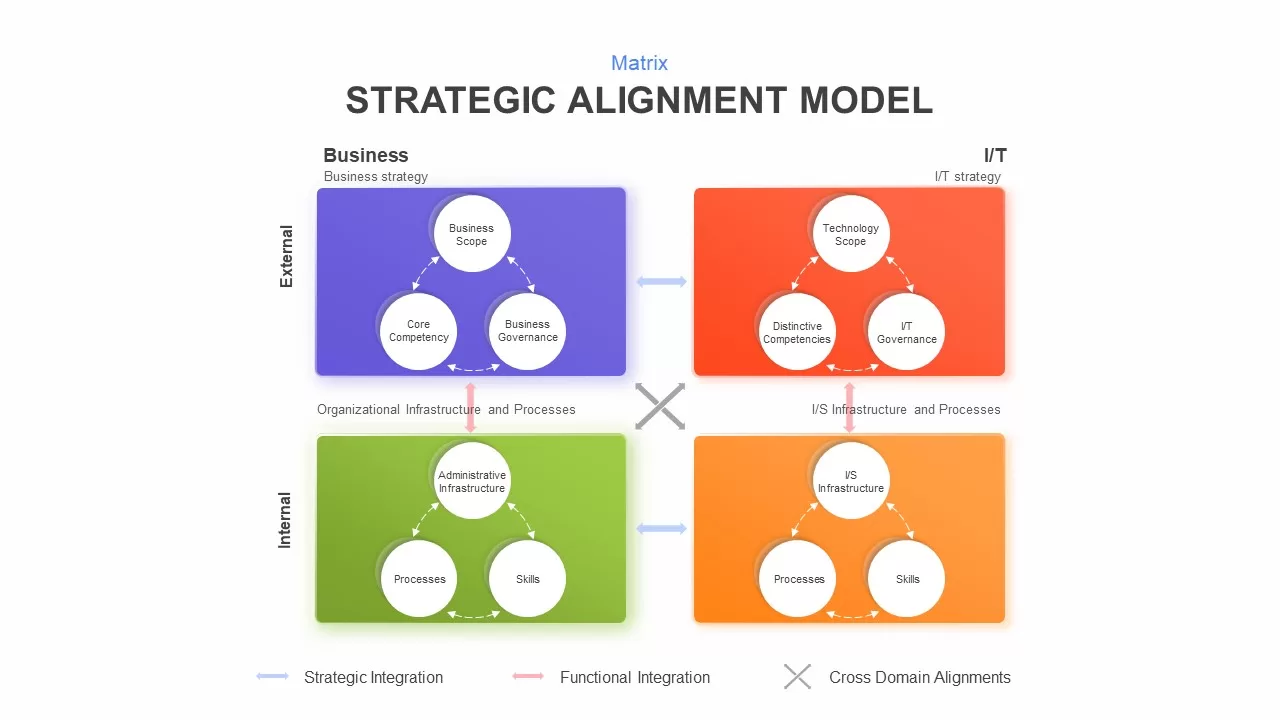
Strategic Alignment Matrix Model Template for PowerPoint & Google Slides
Project