Hourglass Time Mgmt template for PowerPoint & Google Slides


Description
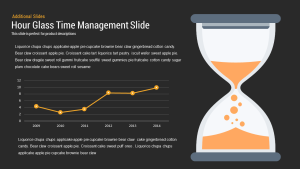
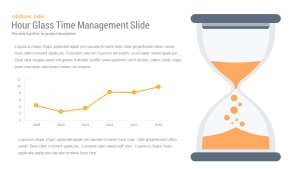
This Hourglass Time Mgmt template features a sophisticated dark background to emphasize a large, vector-based hourglass illustration on the right. The hourglass graphic includes customizable sand levels and smooth curves that reinforce the concept of time management. On the left, a clean line chart displays data points from 2009 through 2014, plotted with adjustable markers and connecting lines in the same accent hue. Above the chart, placeholders for a headline and subheadline enable contextual framing, while below, a stylized text block with a vertical highlight bar provides space for detailed commentary. All elements are built on master slides, so you can update colors, fonts, and chart styles globally with ease. The chart uses theme colors for the data series, allowing rapid adjustments to match your brand palette. Text placeholders support rich text formatting and free web fonts. Slide elements feature subtle drop shadows and rounded corners for a polished, modern aesthetic that stands out in both virtual and in-person presentations. The layout is fully responsive across 16:9 and 4:3 formats and retains clarity on HD projectors and retina displays. Replace the hourglass graphic with alternate shapes or icons to suit different themes, or swap the chart for pie, bar, or area visuals. Animate individual components with entrance effects or morph transitions to guide audience attention and enrich storytelling. A hidden layout variation offers alternate color schemes and layouts for quick theme switches. This design emphasizes the passage of time visually while presenting quantifiable data, making it ideal for time management workshops and productivity analyses. You can customize the highlight bar color to match corporate branding or training themes, and the slide supports multi-step breakdowns of tasks or milestones. The vector assets maintain crispness at any zoom level, and the chart axes and markers auto-resize when data updates to preserve visual balance.
Who is it for
Productivity coaches, project managers, time management consultants, and corporate trainers will find this slide invaluable for workshops and seminars. Data analysts and operations teams can use it to track performance trends over time. Entrepreneurs and freelancers may leverage the design to illustrate workload distribution and milestone progress. Educators and students can adapt the layout for academic presentations on time allocation and efficiency studies.
Other Uses
Beyond time management, repurpose this layout to showcase project timelines, sprint reviews, or phase-gate analyses. Swap the hourglass for other conceptual graphics—such as funnels or calendars—to suit process overviews. Convert the line chart into a sales performance dashboard or financial trend report. Use the highlighted quote block for key takeaways, testimonials, or regulatory notes, and apply the same aesthetic for quarterly reviews, client spotlights, or strategic roadmaps.
Login to download this file

Item ID
SB00058
Related Templates

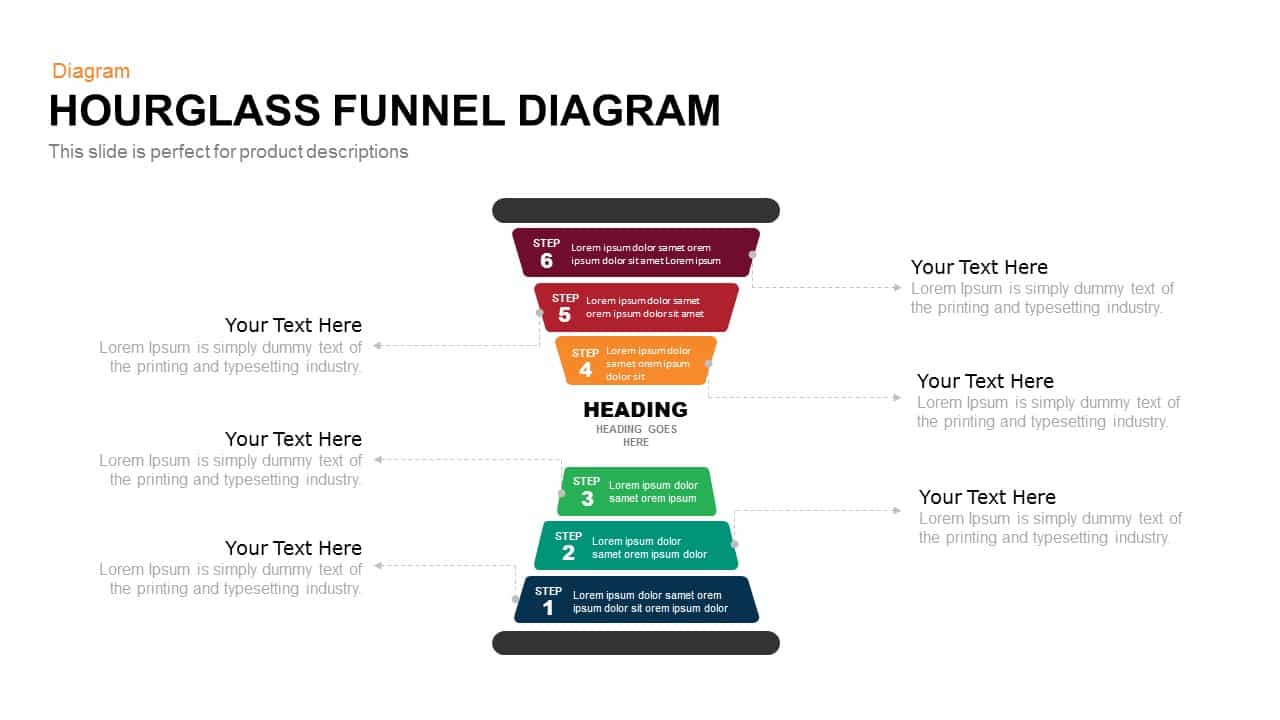
Hourglass Funnel Diagram Process Template for PowerPoint & Google Slides
Funnel

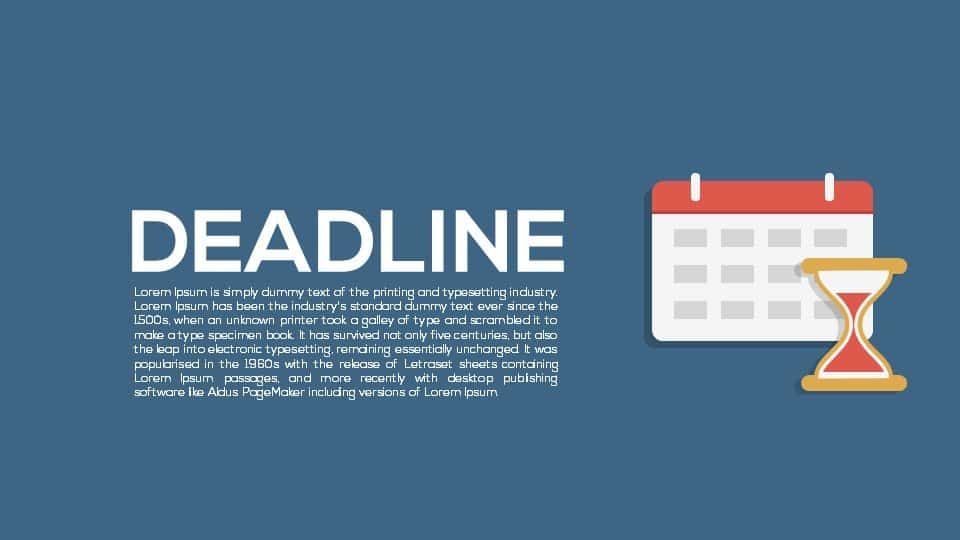
Deadline Metaphor Timeline & Hourglass Template for PowerPoint & Google Slides
Project
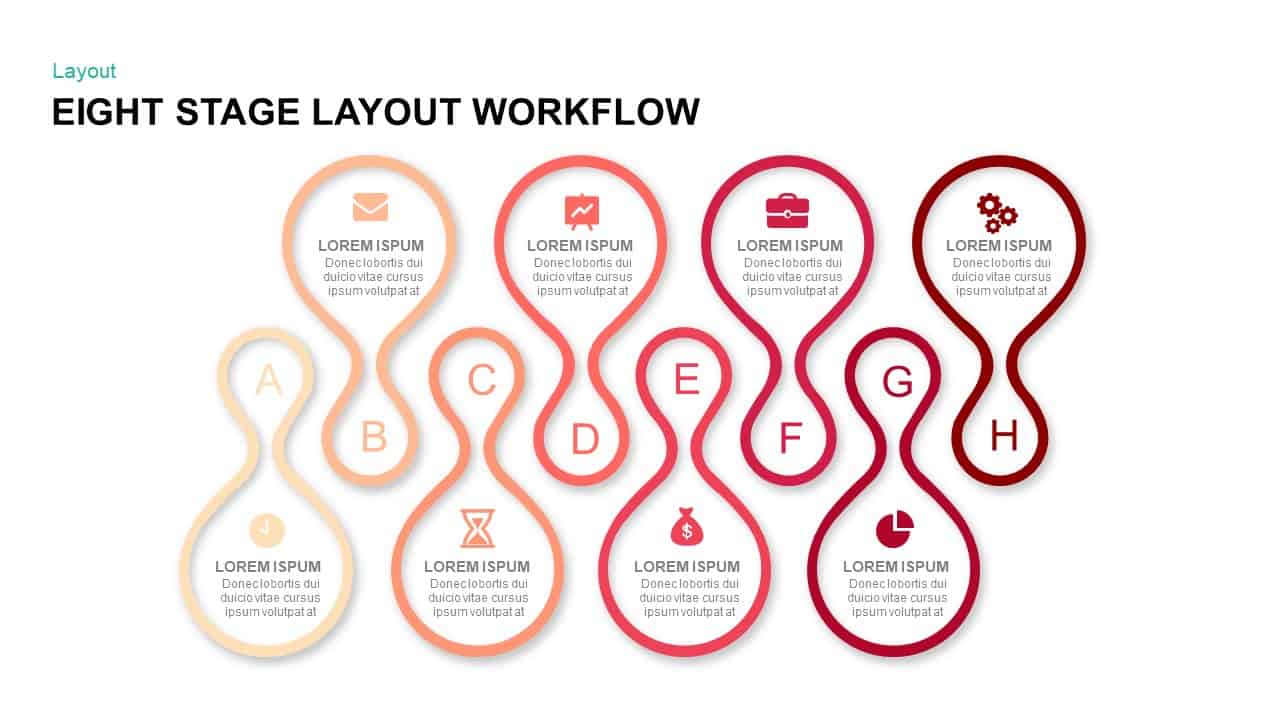
Eight Stage Hourglass Workflow Diagram Template for PowerPoint & Google Slides
Process
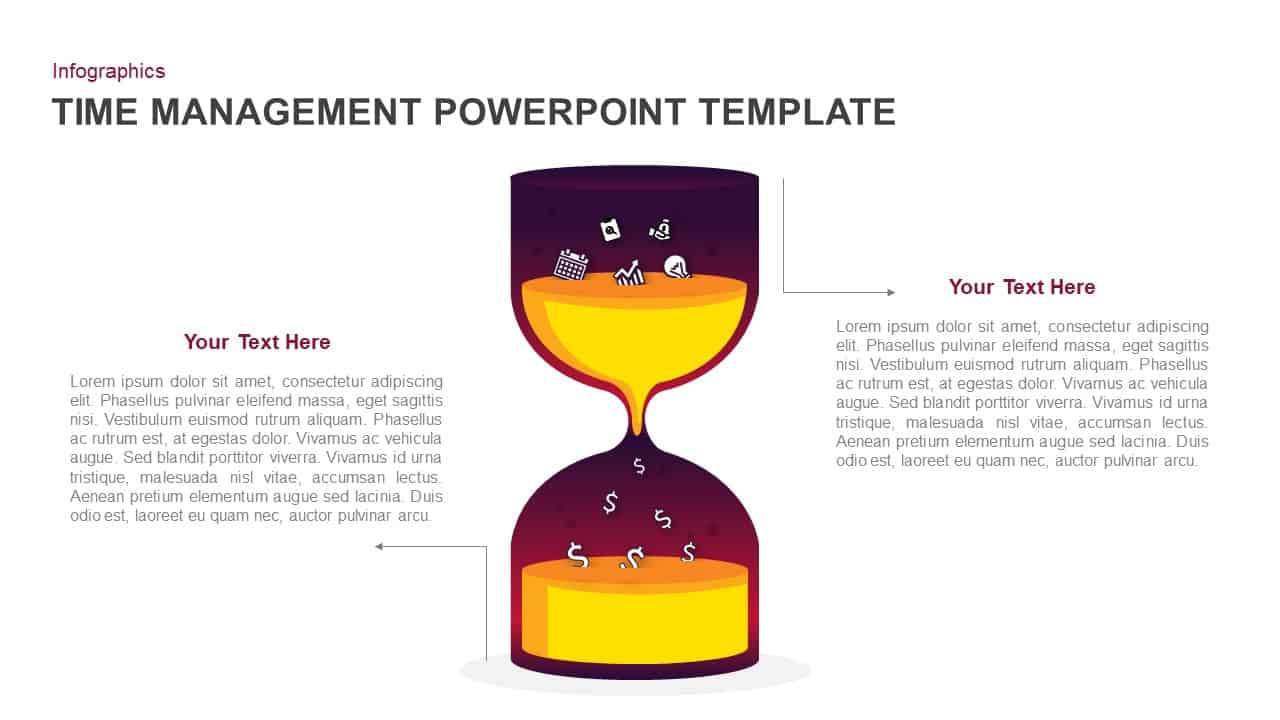
Time Management Hourglass Infographic Template for PowerPoint & Google Slides
Business
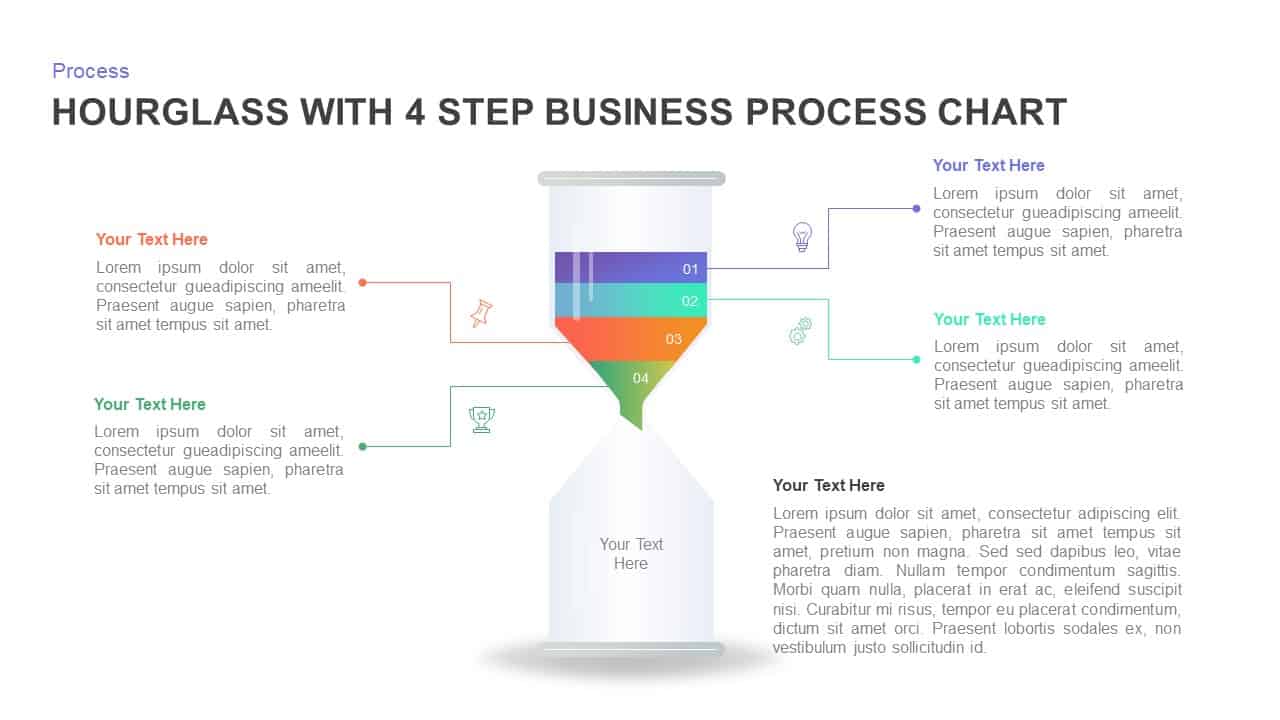
Four-Step Hourglass Business Process Template for PowerPoint & Google Slides
Process
4 Step Process PowerPoint & Google Slides Template for PowerPoint & Google Slides
Process