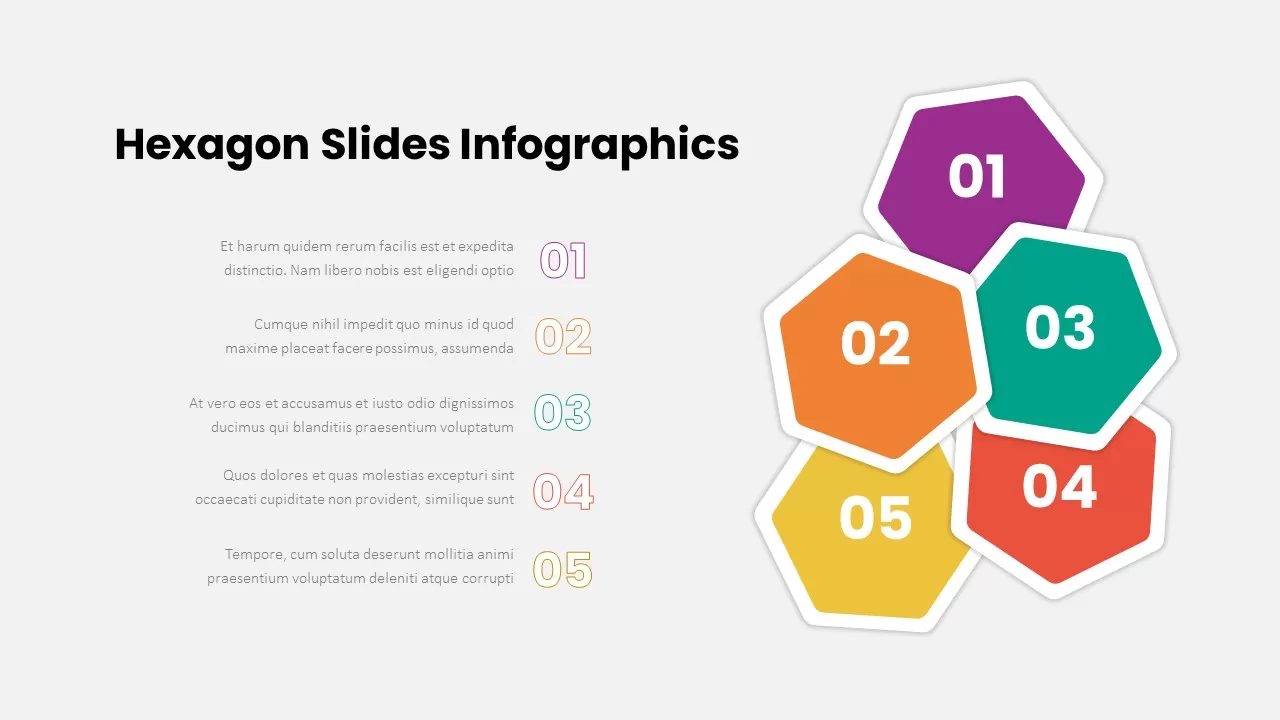
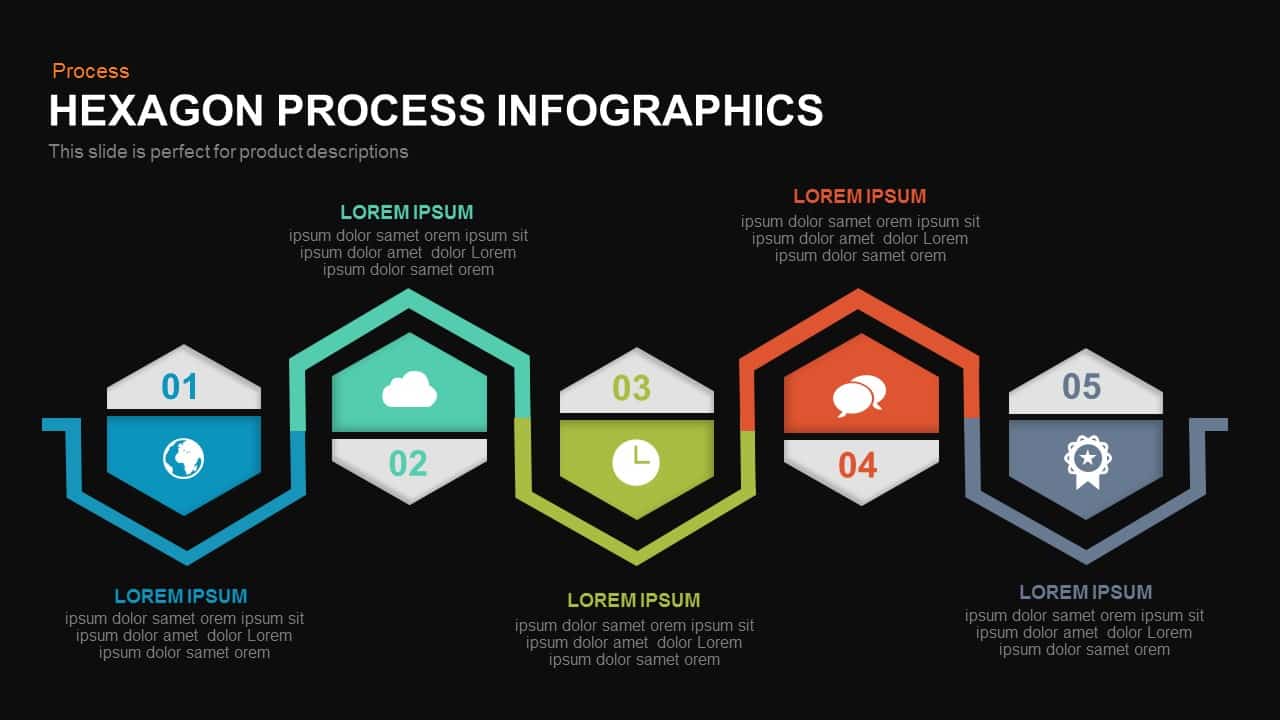
Hexagon Process Infographic Template for PowerPoint & Google Slides
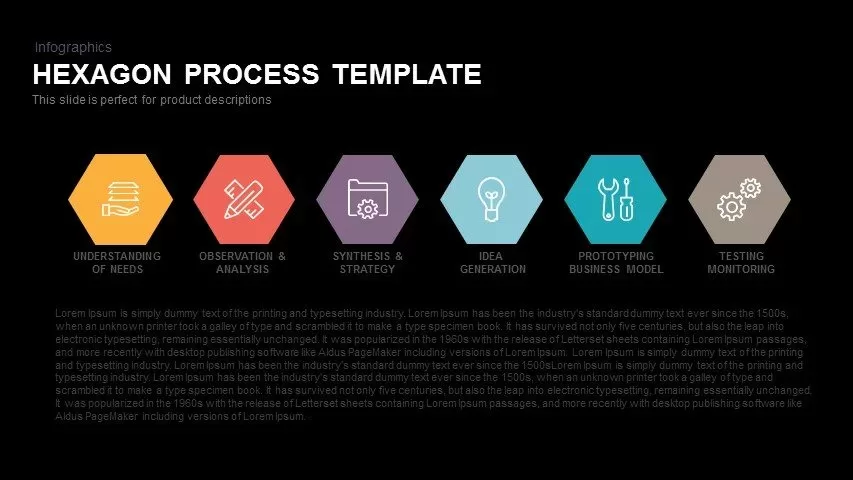
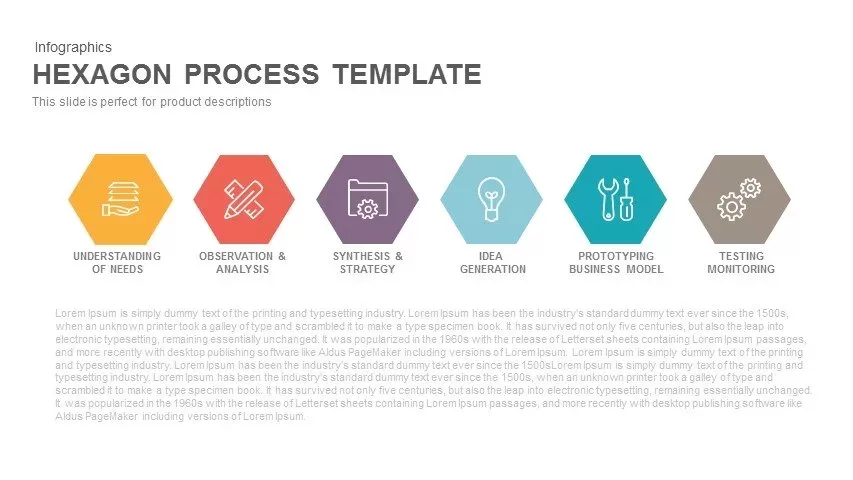


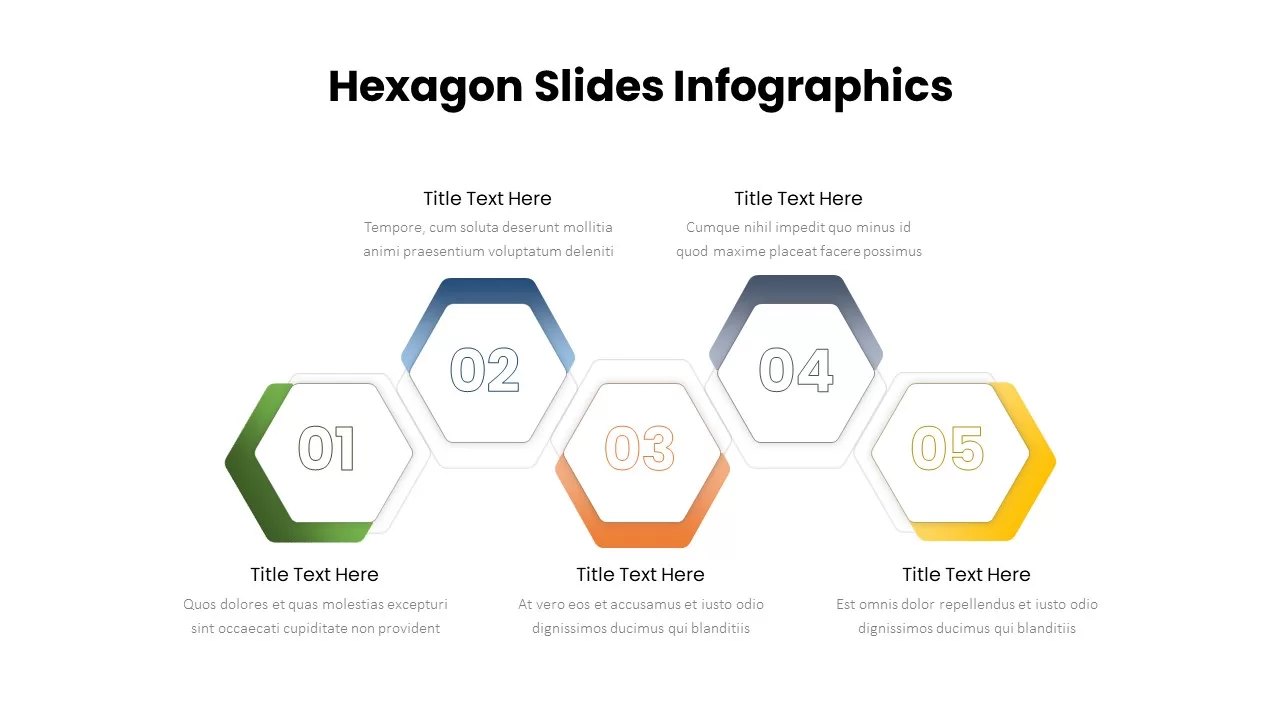
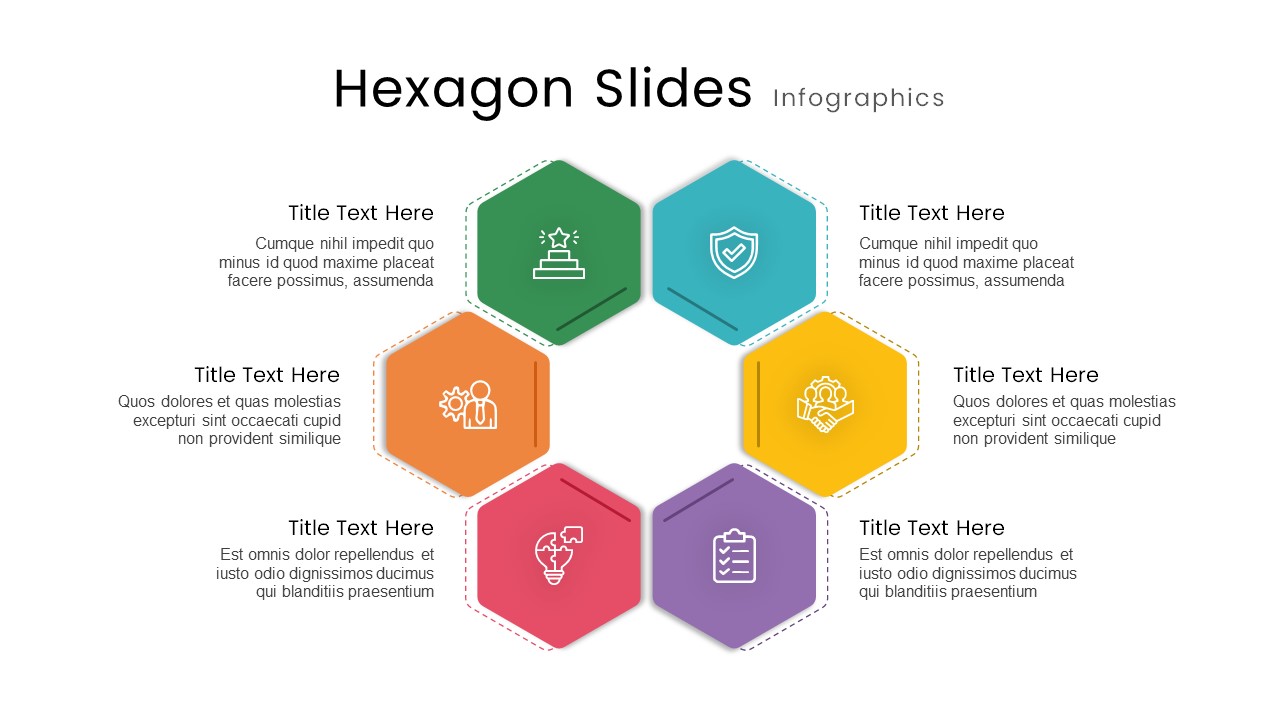
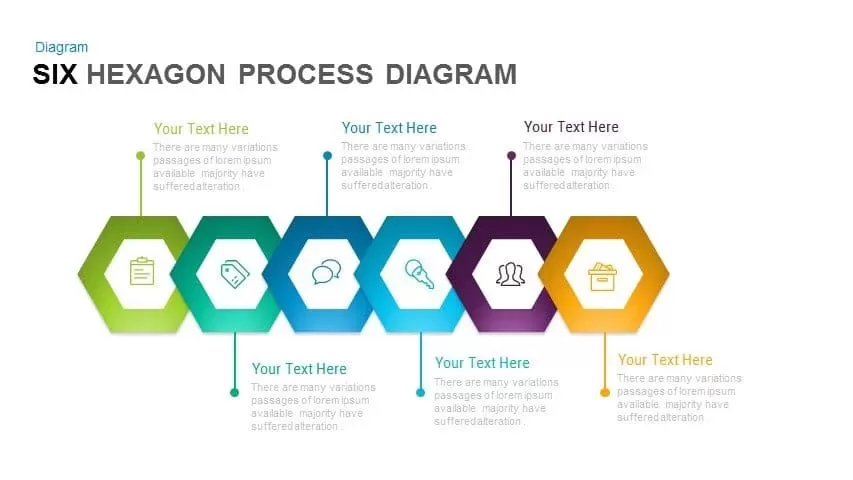
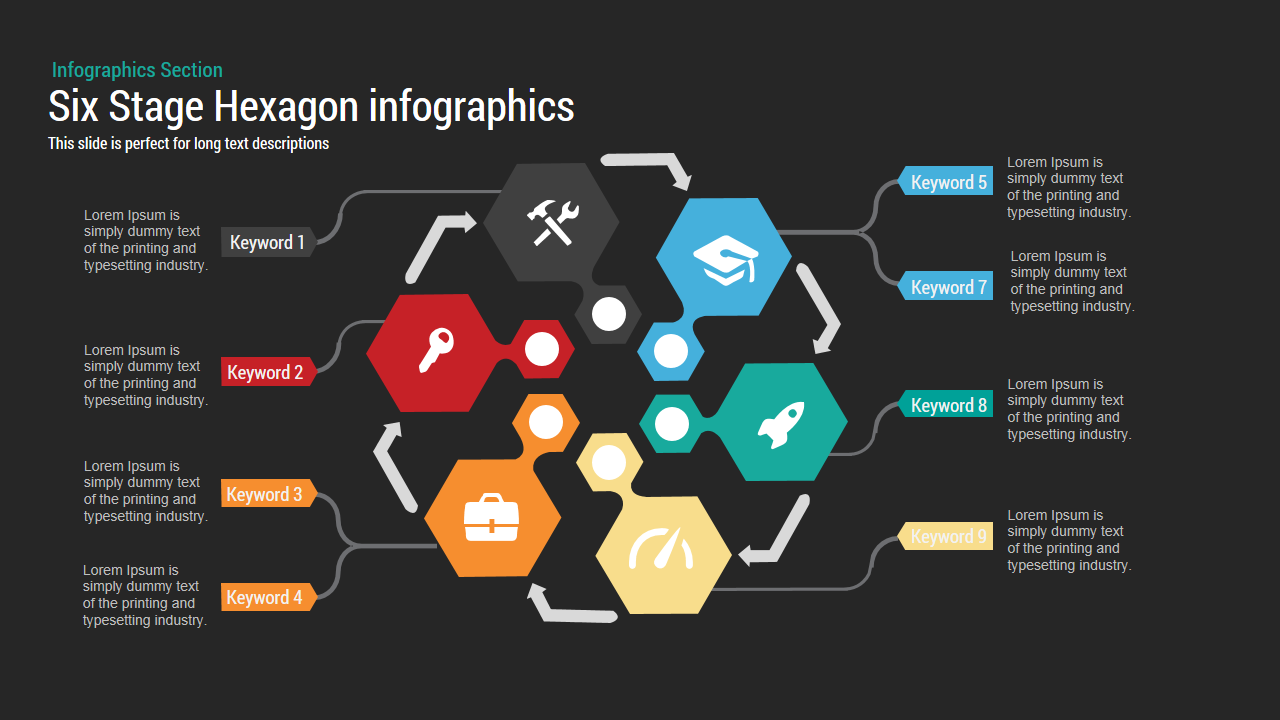
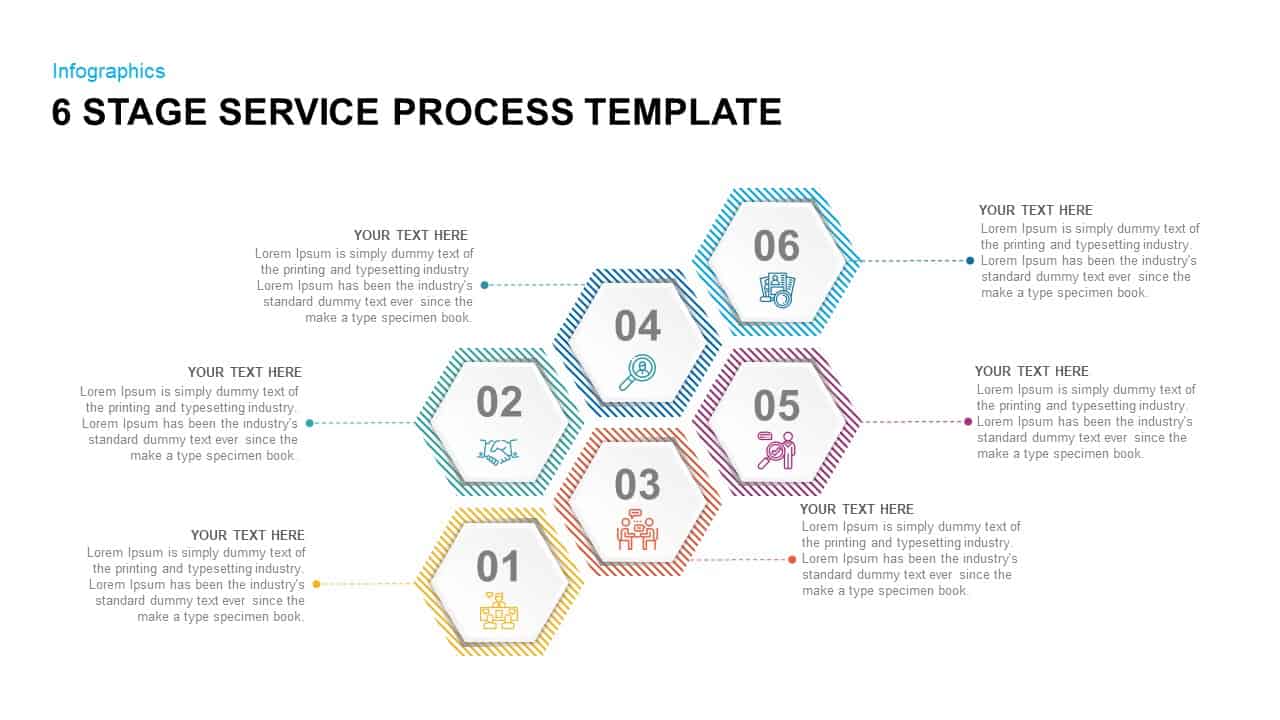
Make use of this engaging hexagon process infographic to illustrate six sequential stages with clarity and color. This fully editable slide features six hexagon shapes arranged in a horizontal sequence, each housing a minimalist icon and a concise headline. Distinct color-coding ensures each step stands out, while consistent typography and subtle drop shadows maintain a cohesive, professional aesthetic. Customize icons, colors, and text placeholders to align with your brand guidelines or presentation theme. Vector-based elements guarantee crisp visuals at any size, and intuitive master slide integration simplifies global edits across your deck.
Use connector lines or arrows to guide viewers through complex procedures, build step-by-step frameworks, or highlight key milestones. Tailor hexagon positions, adjust spacing, or duplicate shapes to expand your process beyond six steps without compromising layout integrity. Optimize the slide for both PowerPoint and Google Slides to deliver seamless formatting consistency across platforms, devices, and screen resolutions. By centralizing your process narrative into a structured, visually appealing format, you can reduce information overload and sharpen audience focus.
This asset streamlines content creation by providing clear placeholders for headline and body text beneath each hexagon, ensuring concise messaging and balanced negative space. Whether tracking product development phases, mapping customer journeys, or designing operational workflows, this infographic drives engagement and fosters understanding. Combine the hexagon process with supplemental charts or imagery to reinforce data points or embed additional context. With its modern flat design, this slide enhances your storytelling and empowers you to present processes with maximum impact.
Enhance interactivity by linking each hexagon to external resources or embedding hyperlinks for detailed documentation. Leverage this infographic to track performance indicators or progress checkpoints by replacing iconography with KPI symbols and adjusting color schemes to reflect status levels.
Who is it for
Project managers, product developers, and business analysts will appreciate this hexagon process slide for outlining roadmaps, workflow sequences, and system architectures. Marketing strategists, UX designers, and educators can also adopt this template to break down training modules or customer experience flows.
Other Uses
Repurpose this infographic to visualize life cycle stages, operational protocols, quality assurance checks, or compliance procedures. Adapt color schemes to denote risk levels or priority ranking. Extend the sequence for timeline representations or incorporate icons to depict KPIs and performance metrics.
Login to download this file

Item ID
SB00361
Related Templates

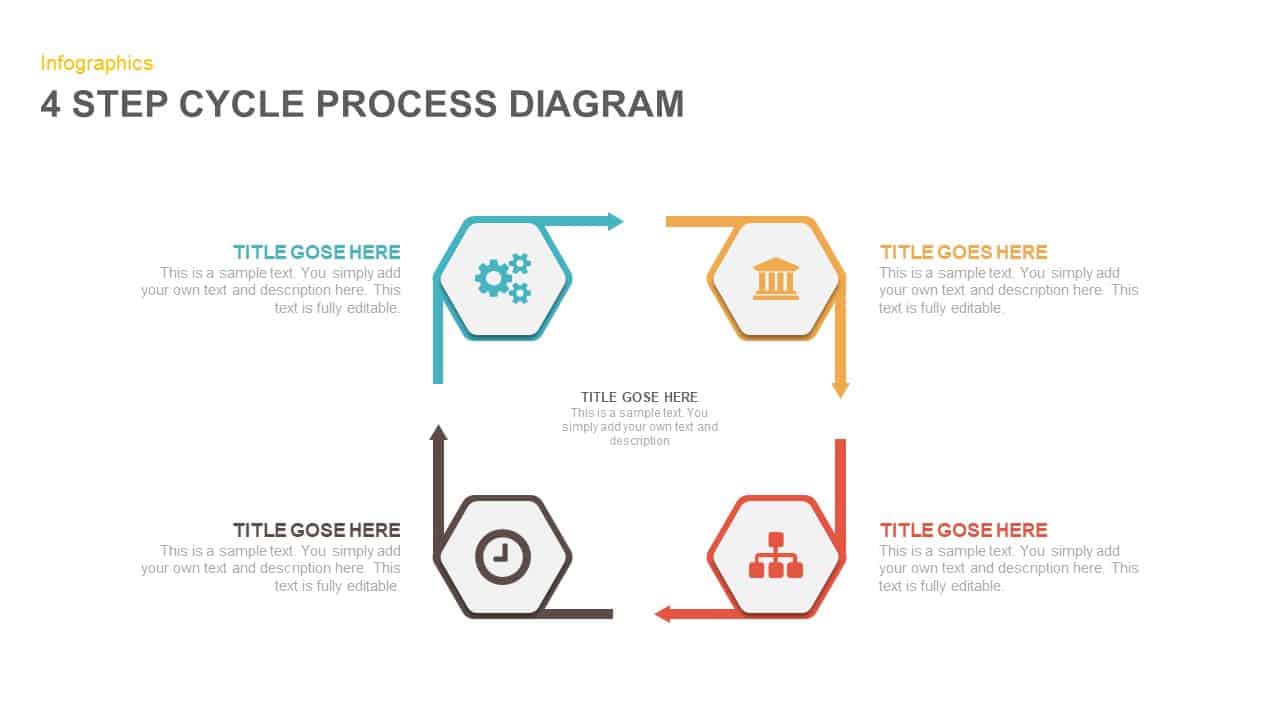
Four-Step Hexagon Process Infographic Template for PowerPoint & Google Slides
Process
Five-Step Hexagon Infographic Process Template for PowerPoint & Google Slides
Process
Three-Step Hexagon Infographic Process Template for PowerPoint & Google Slides
Process
Hexagon Infographic template for PowerPoint & Google Slides
Infographics
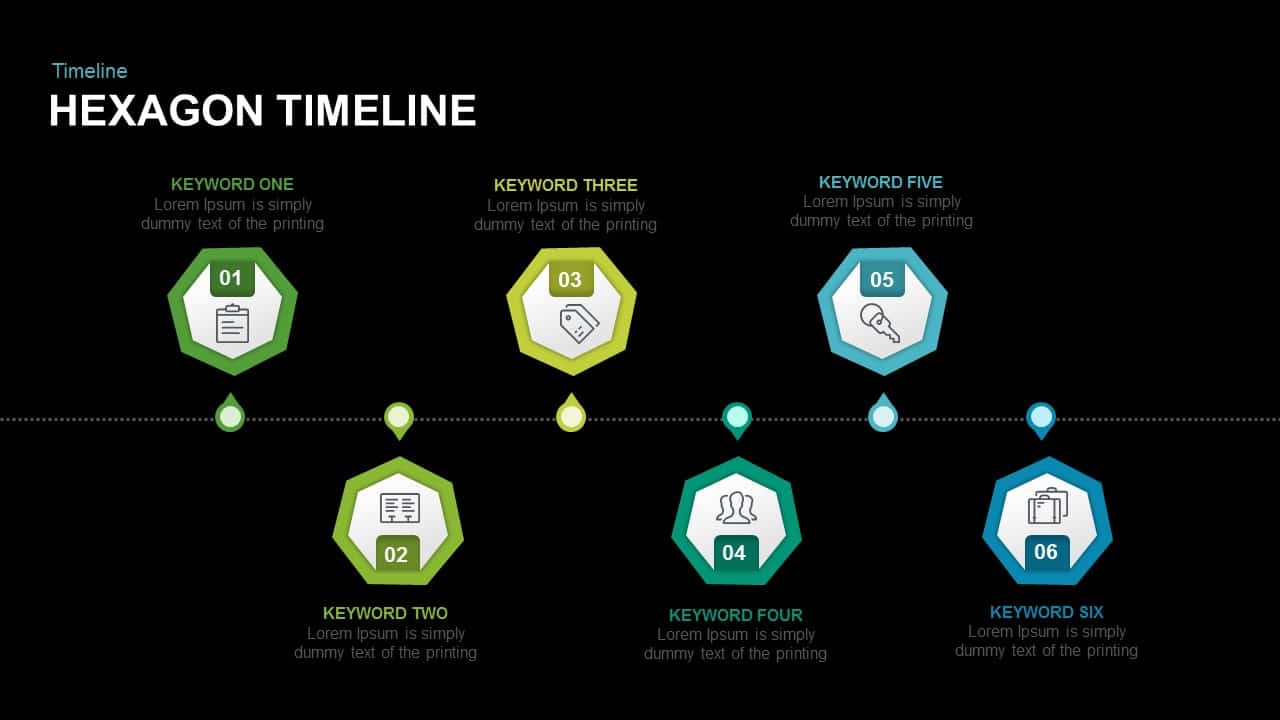
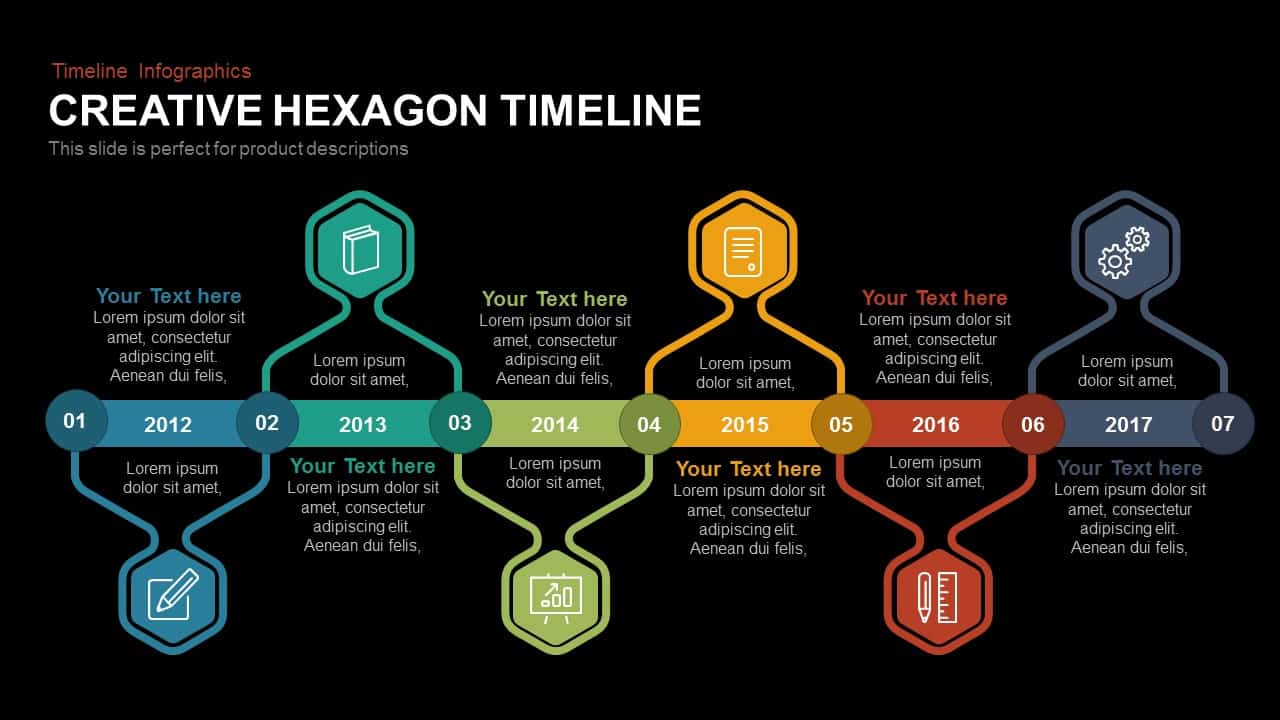
Six-Stage Hexagon Timeline Infographic Template for PowerPoint & Google Slides
Timeline
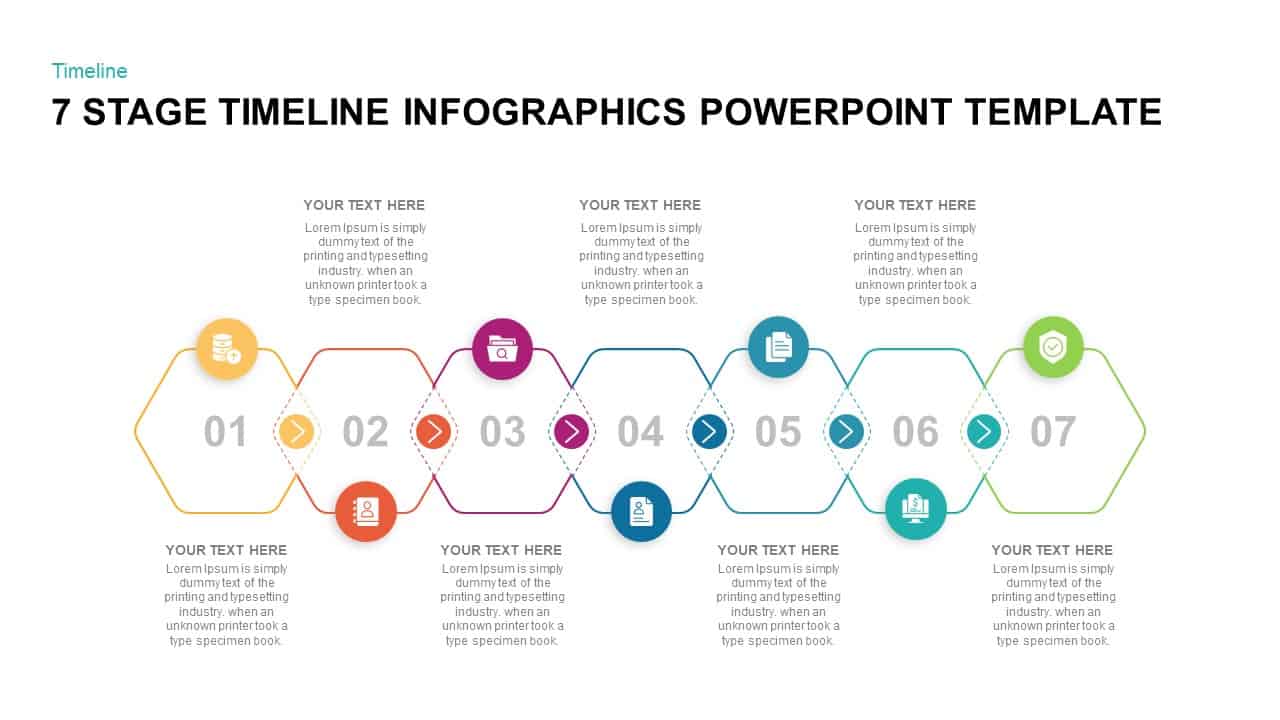
Seven-Stage Hexagon Timeline Infographic Template for PowerPoint & Google Slides
Timeline
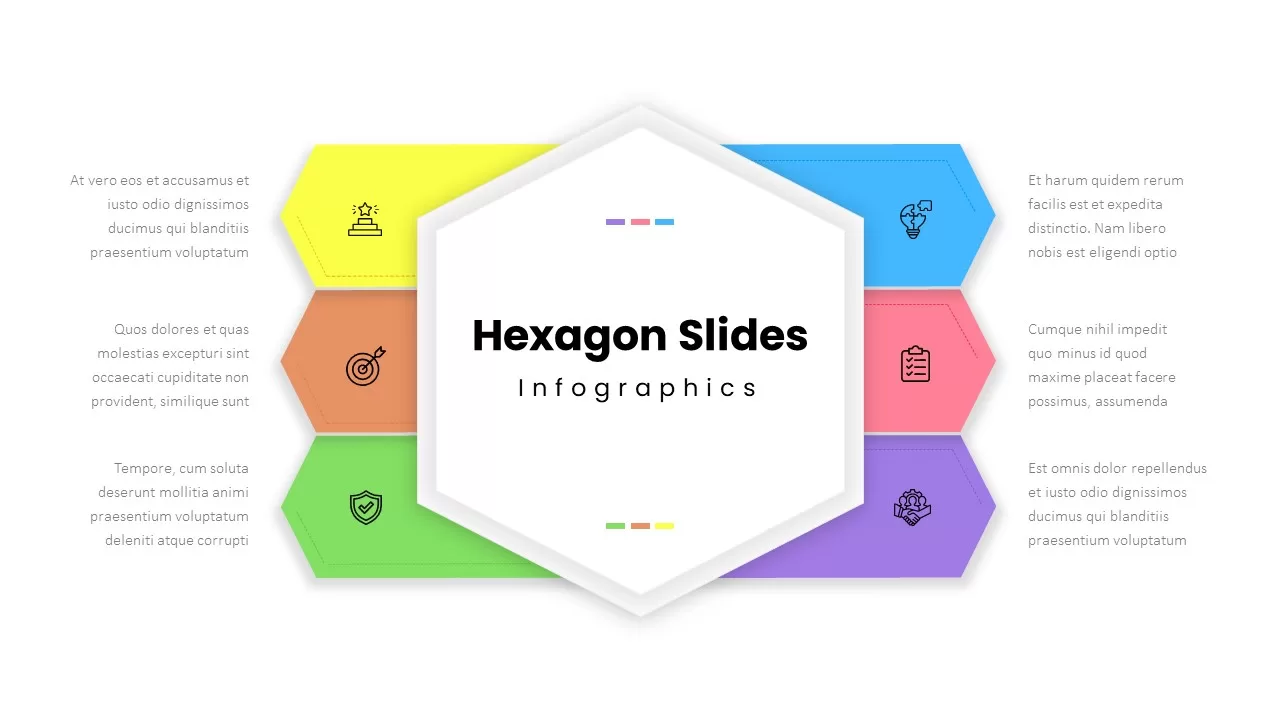
Six-Step Hexagon Infographic Layout Template for PowerPoint & Google Slides
Infographics
Six-Part Hexagon Infographic Layout Template for PowerPoint & Google Slides
Infographics
Free Five-Part Hexagon Infographic Cluster Template for PowerPoint & Google Slides
Infographics
Free
Six Hexagon Stages Process Flow Diagram Template for PowerPoint & Google Slides
Process
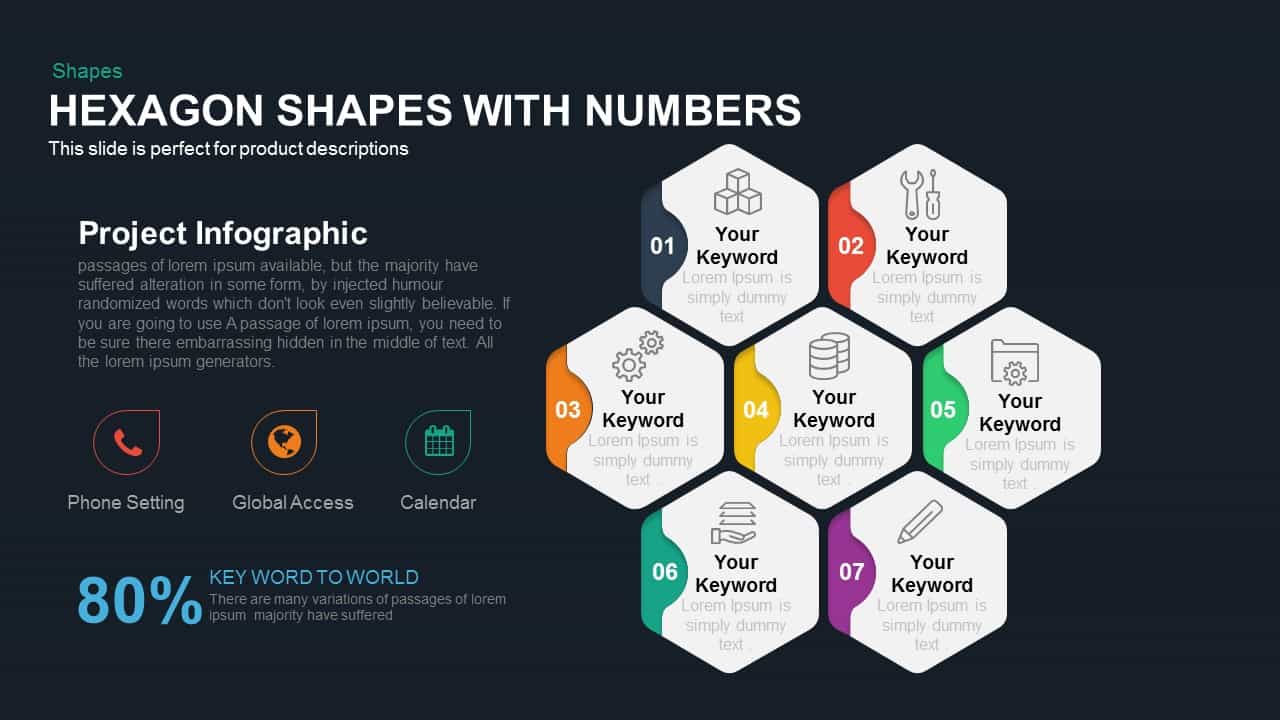
Hexagon Shapes with Numbers Process Template for PowerPoint & Google Slides
Process
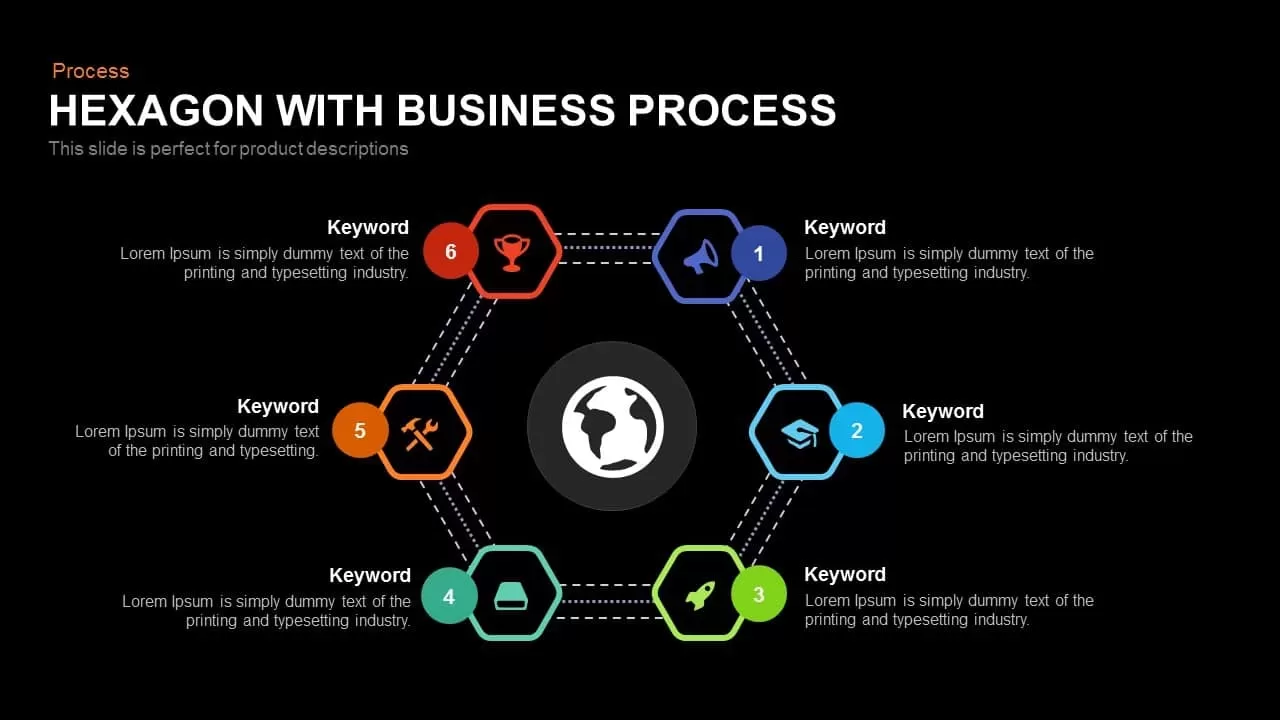
Global Hexagon Six-Step Business Process Template for PowerPoint & Google Slides
Process
Five-Stage Hexagon Process Infographics template for PowerPoint & Google Slides
Process

Six-Step Hexagon Process Diagram Template for PowerPoint & Google Slides
Process

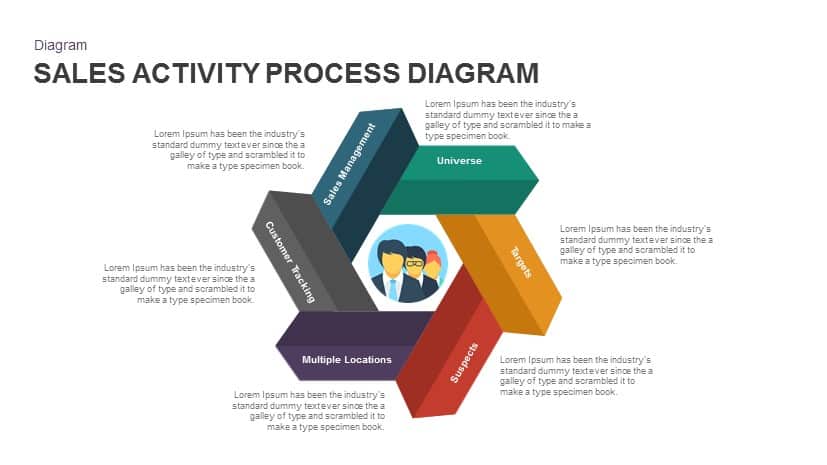
Sales Activity Hexagon Process Diagram Template for PowerPoint & Google Slides
Process
Six-Step Hexagon Process Flow Diagram Template for PowerPoint & Google Slides
Process
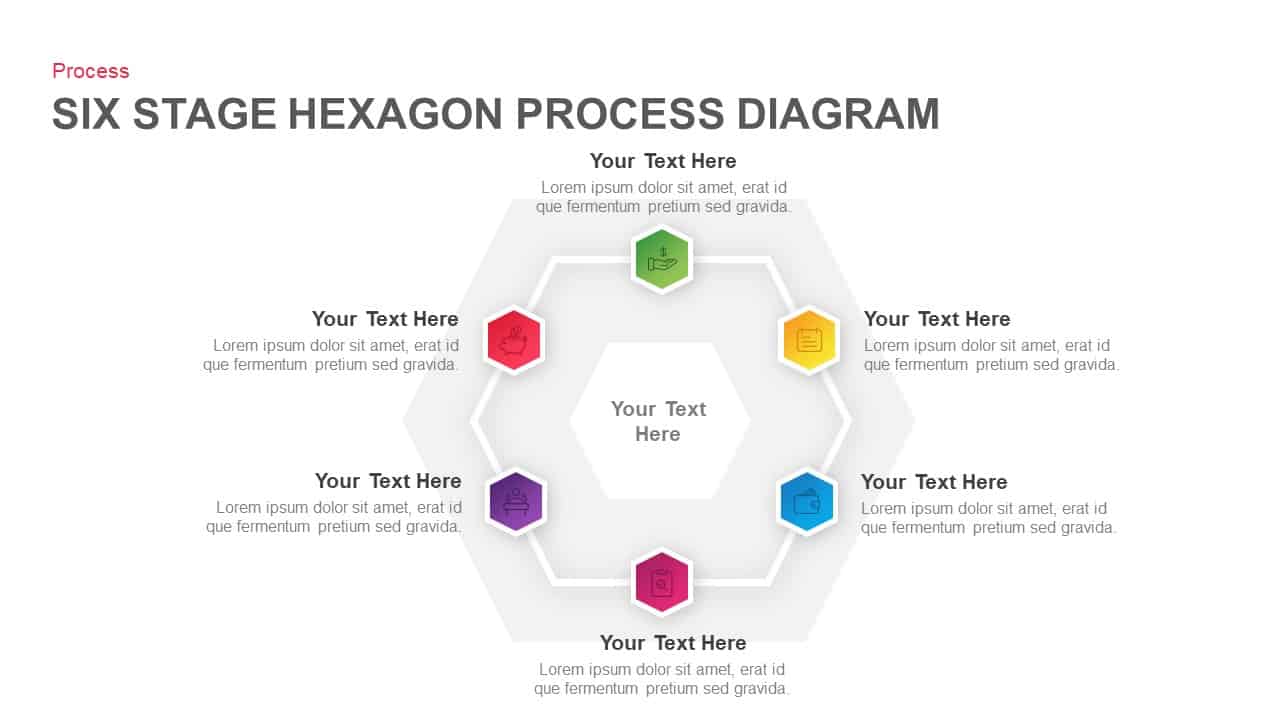
Six Stage Hexagon Process Diagram Template for PowerPoint & Google Slides
Process
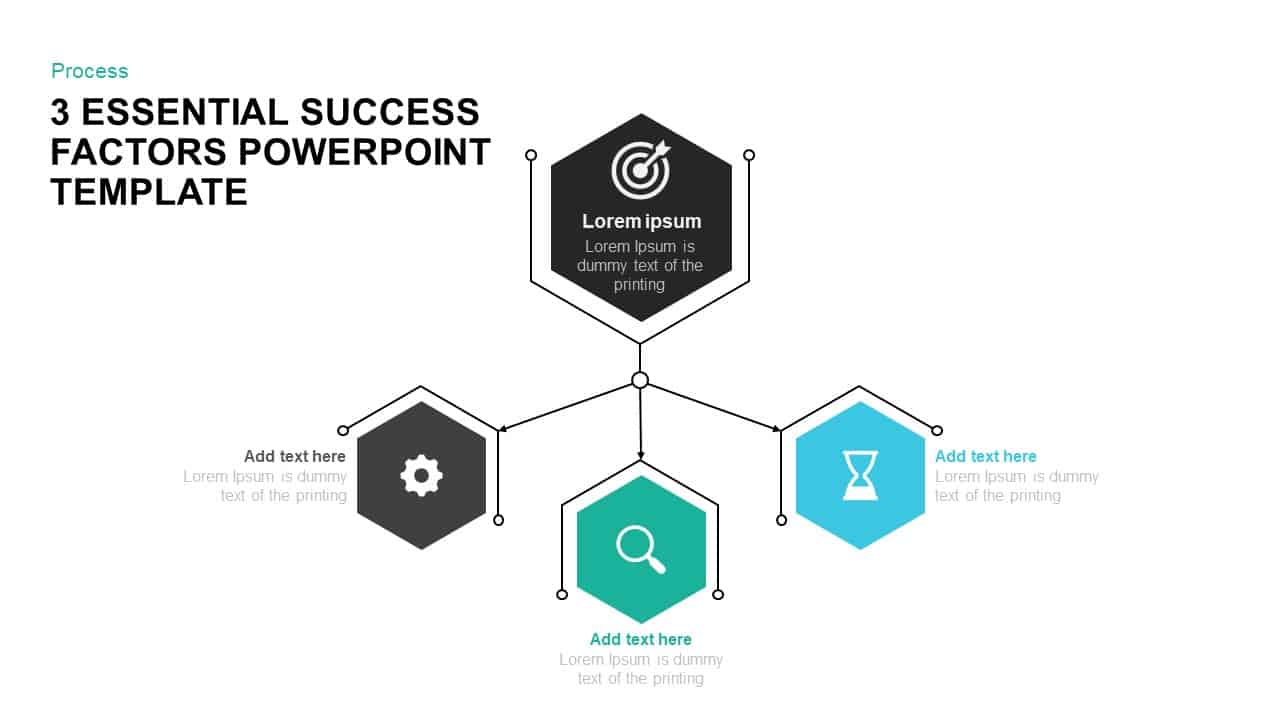
3 Success Factors Hexagon Process Template for PowerPoint & Google Slides
Process
Six-Stage Hexagon template for PowerPoint & Google Slides
Process
Annual Creative Hexagon Timeline Diagram Template for PowerPoint & Google Slides
Timeline
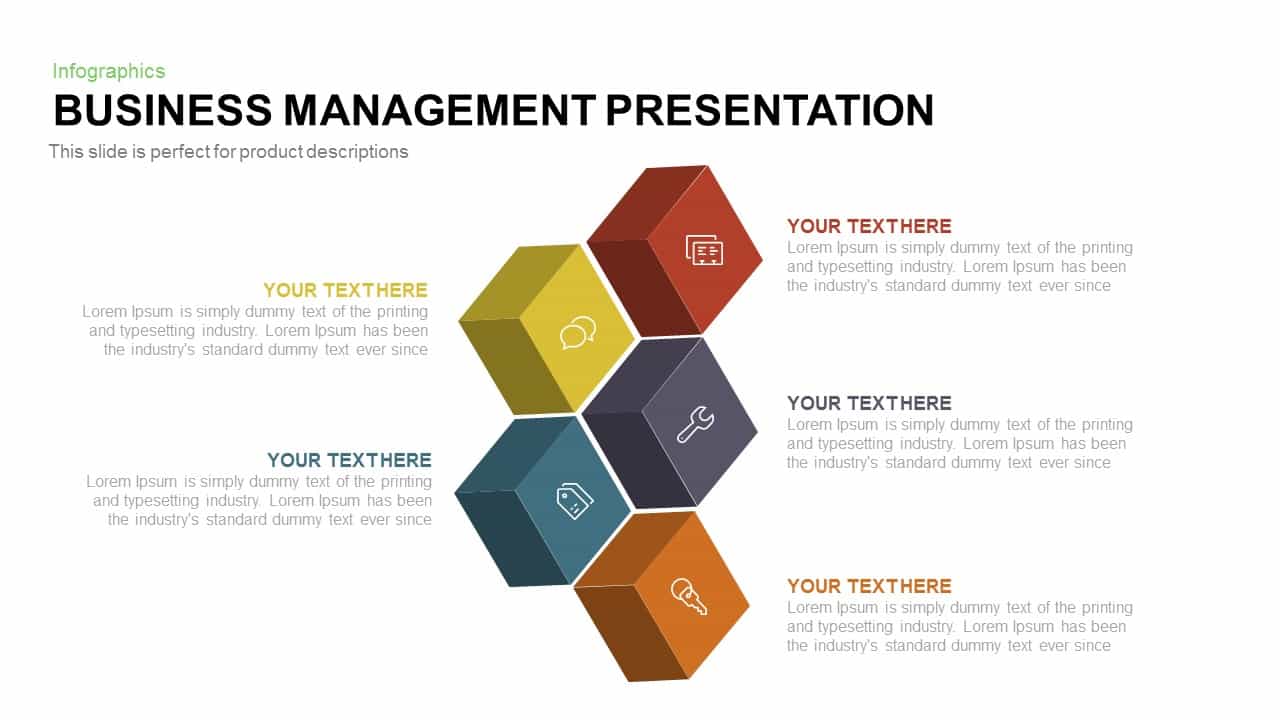
Business Management Hexagon Diagram Template for PowerPoint & Google Slides
Comparison
Six Hexagon Hub-and-Spoke Diagram Template for PowerPoint & Google Slides
Process
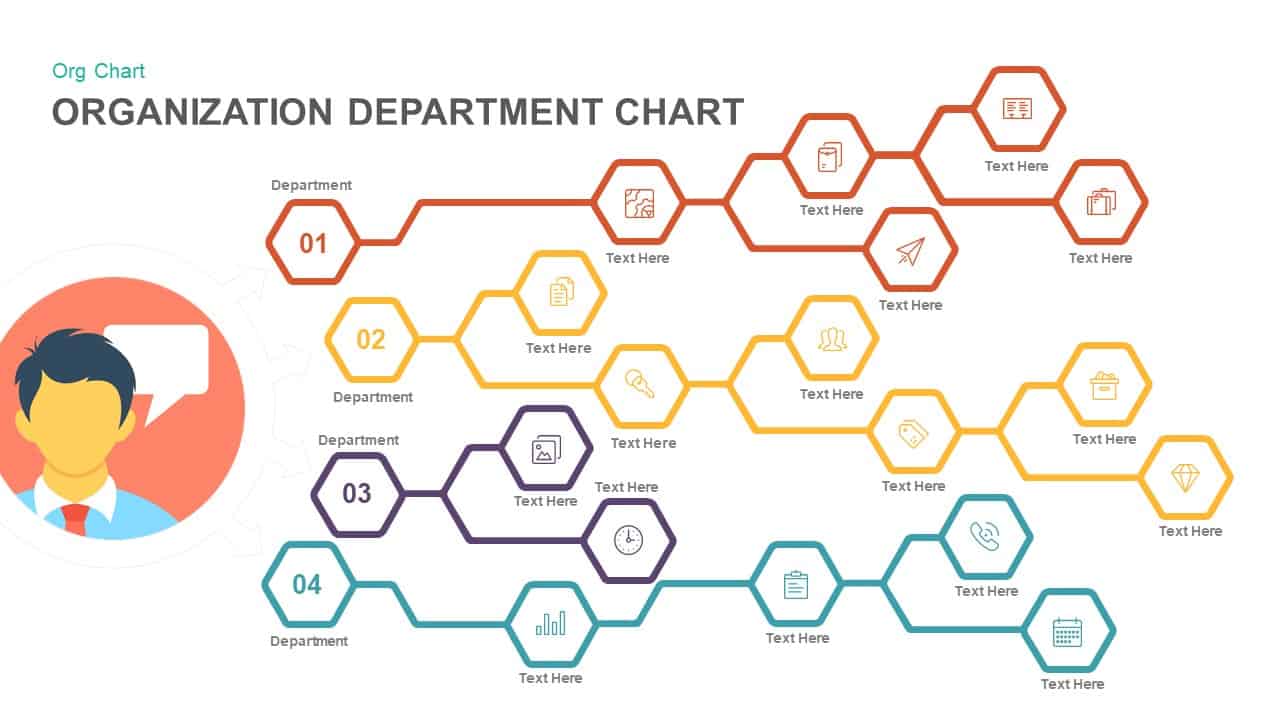
Organization Department Hexagon Chart Template for PowerPoint & Google Slides
Org Chart
Six Segment Hexagon Circular Diagram Template for PowerPoint & Google Slides
Circular
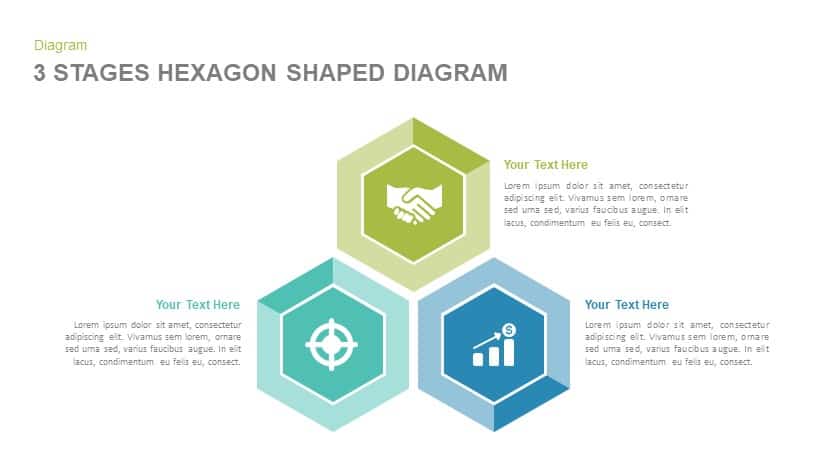
3 Stages Hexagon Shaped Diagram template for PowerPoint & Google Slides
Infographics
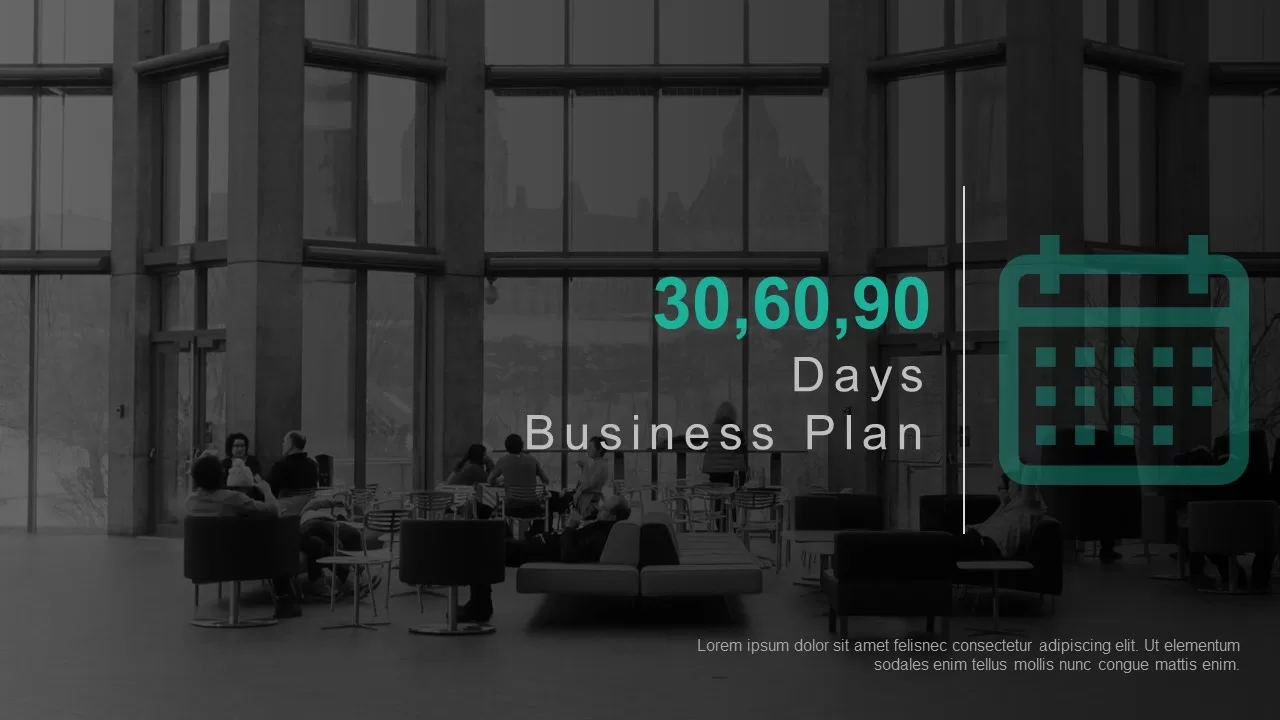
30-60-90 Day Plan with Hexagon Icons Template for PowerPoint & Google Slides
Timeline
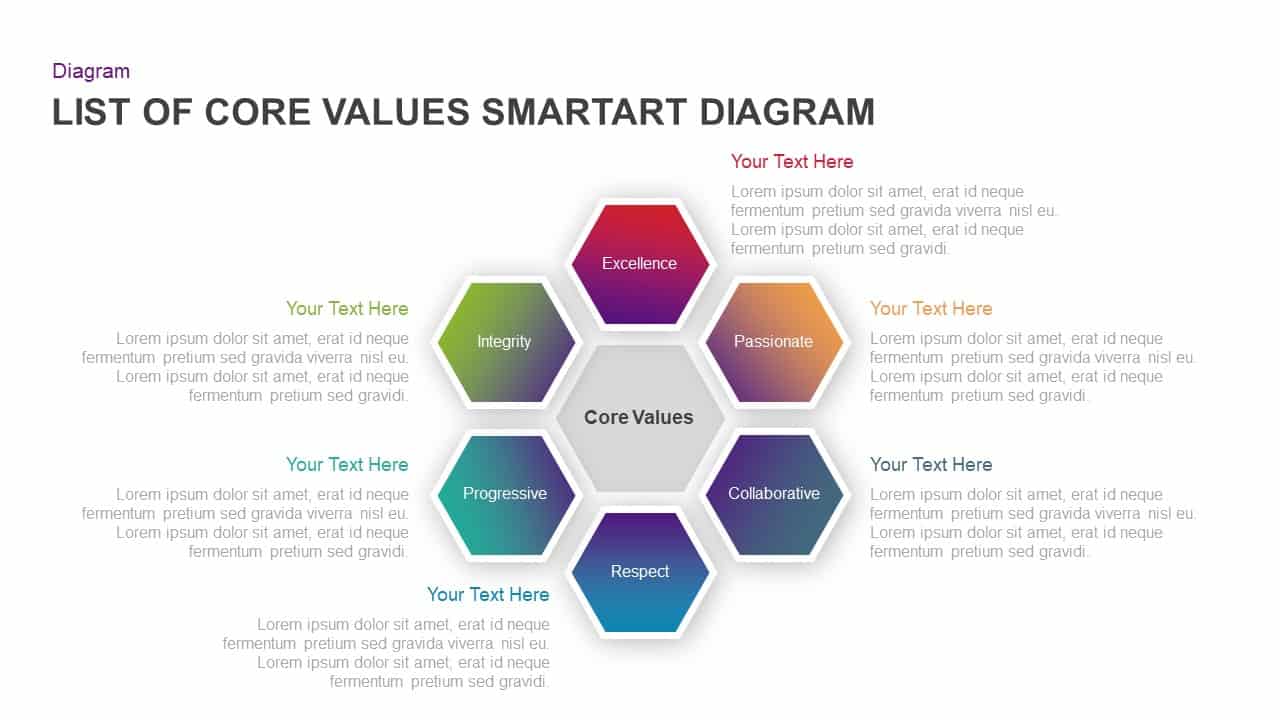
Core Values SmartArt Hexagon Diagram Template for PowerPoint & Google Slides
Circular
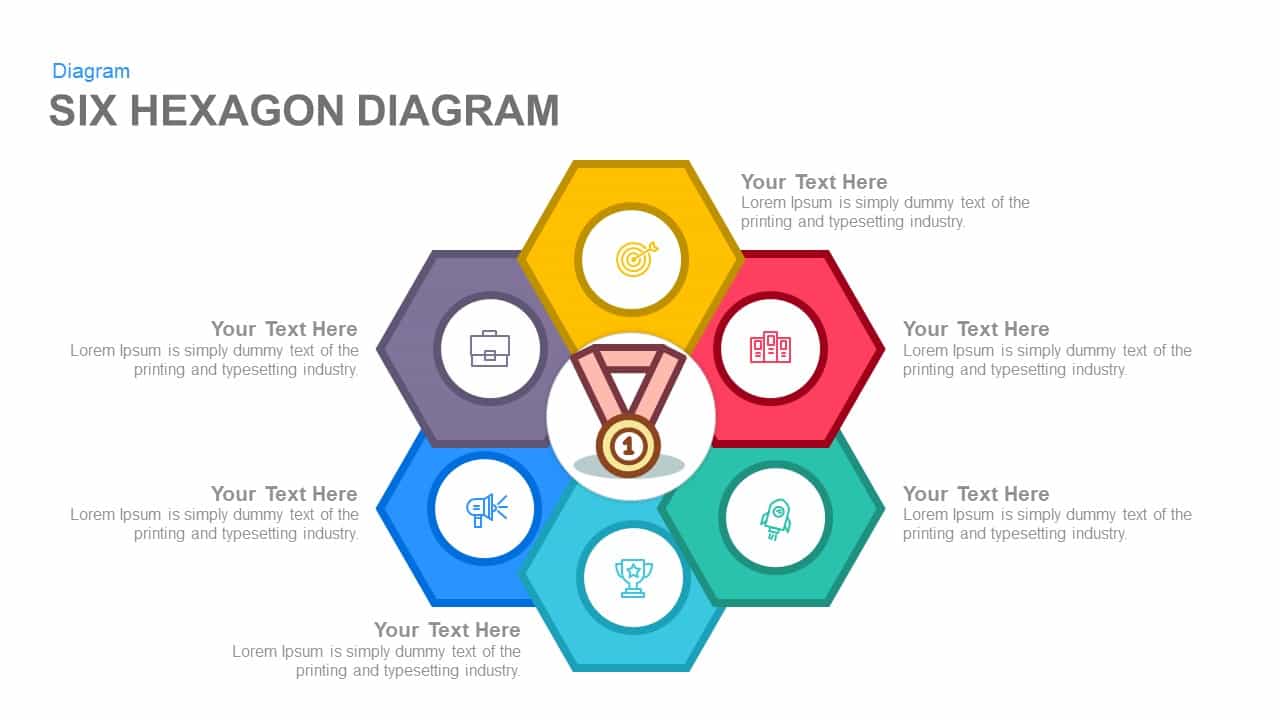
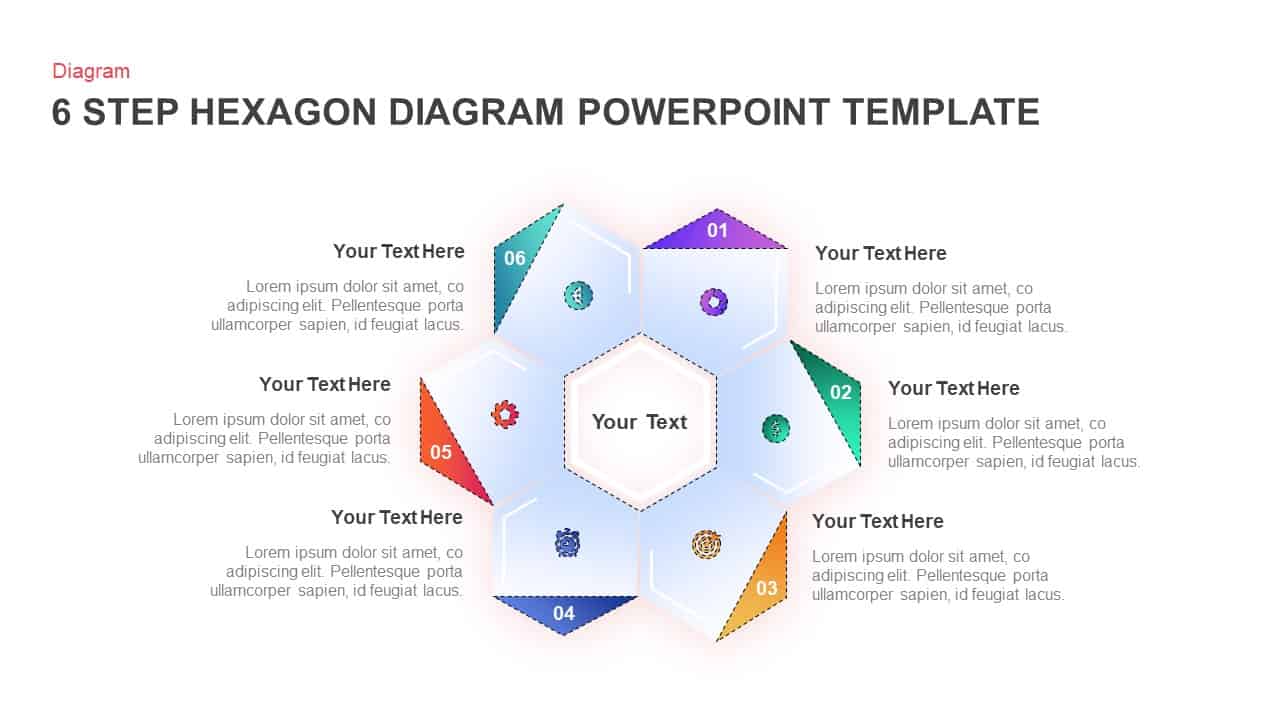
6 Step Hexagon Diagram template for PowerPoint & Google Slides
Process
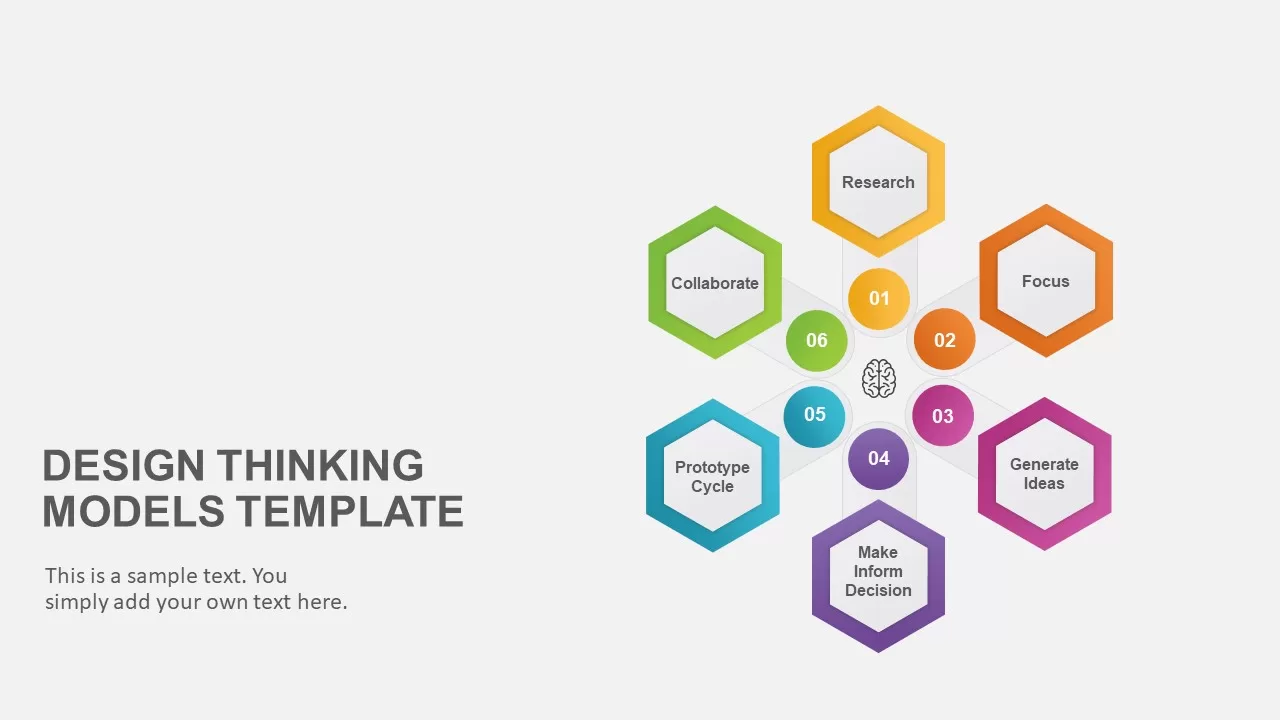
Six-Step Hexagon Design Thinking Models Template for PowerPoint & Google Slides
Circular
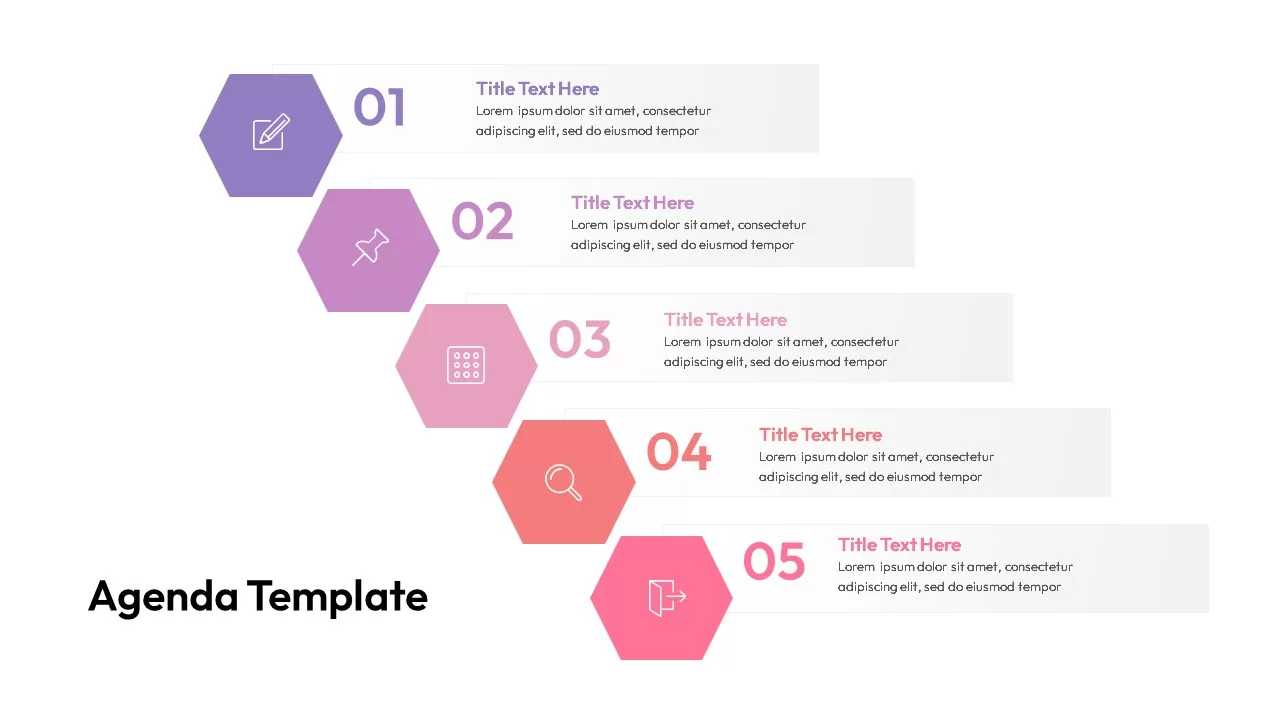
Staggered Five-Hexagon Agenda Layout Template for PowerPoint & Google Slides
Agenda
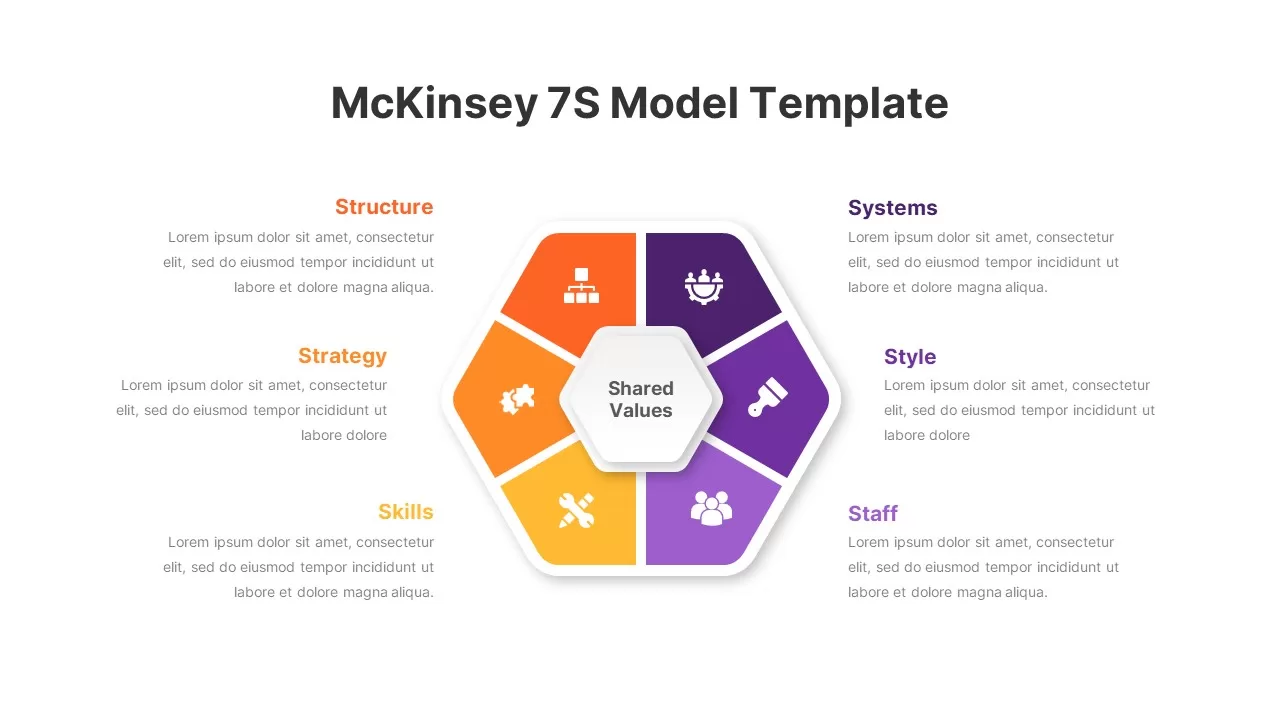
Hexagon 7S Strategic Alignment Model Template for PowerPoint & Google Slides
Business Strategy
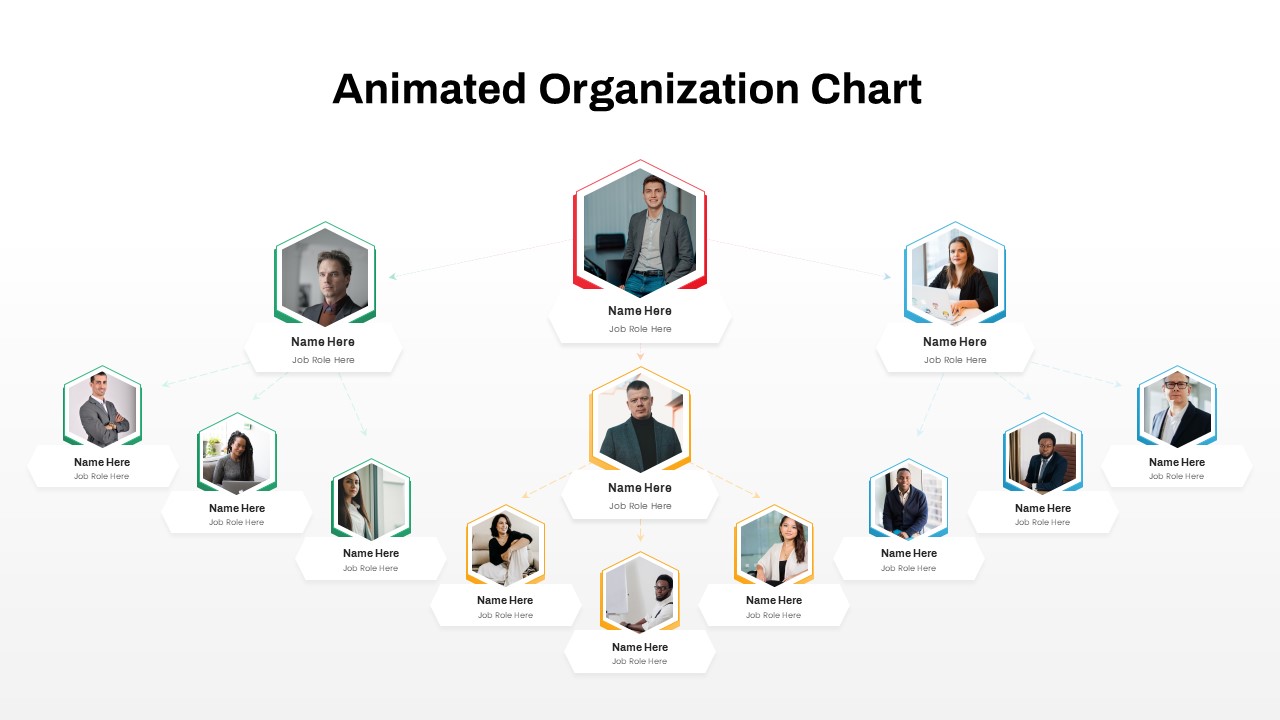
Animated Hexagon Org Chart Diagram Template for PowerPoint & Google Slides
Org Chart

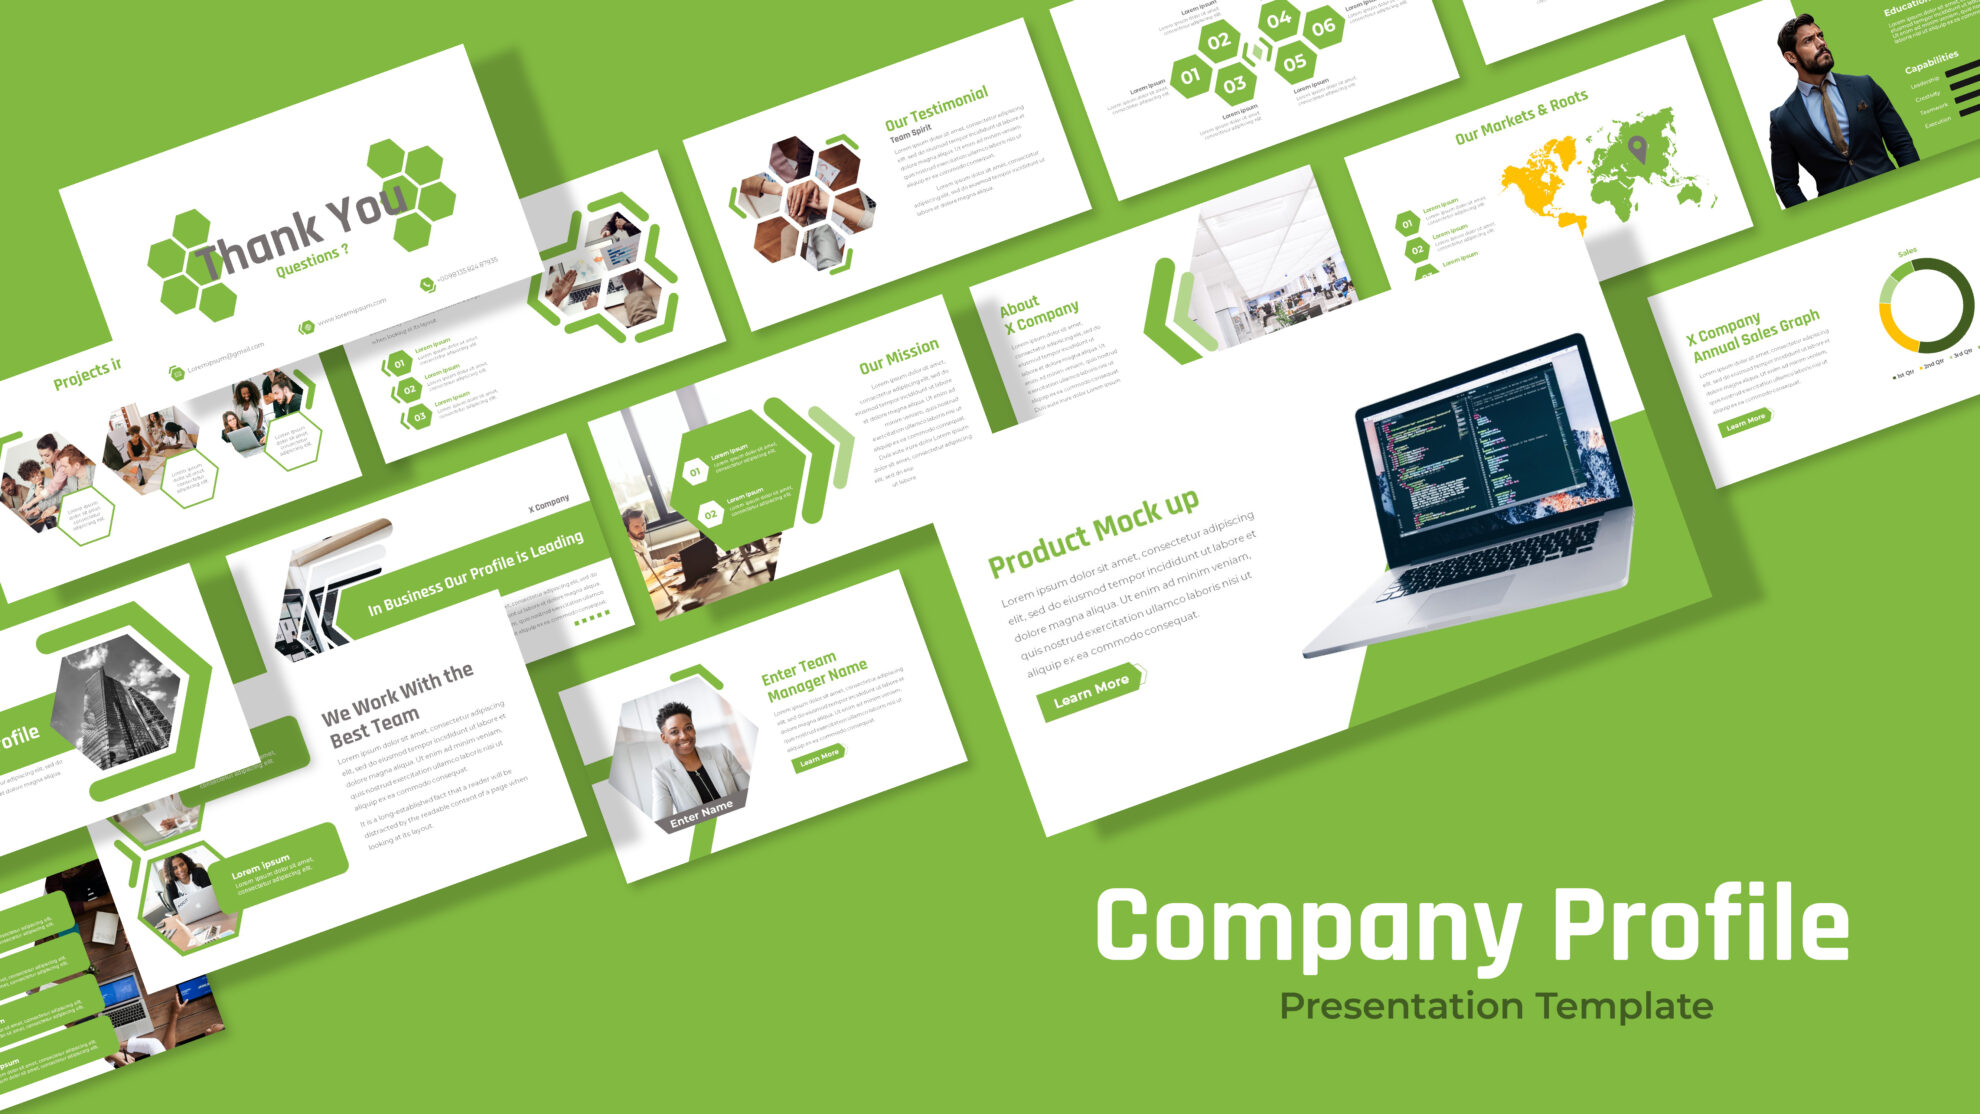
Free Green Hexagon Company Profile Template for PowerPoint & Google Slides
Company Profile
Free

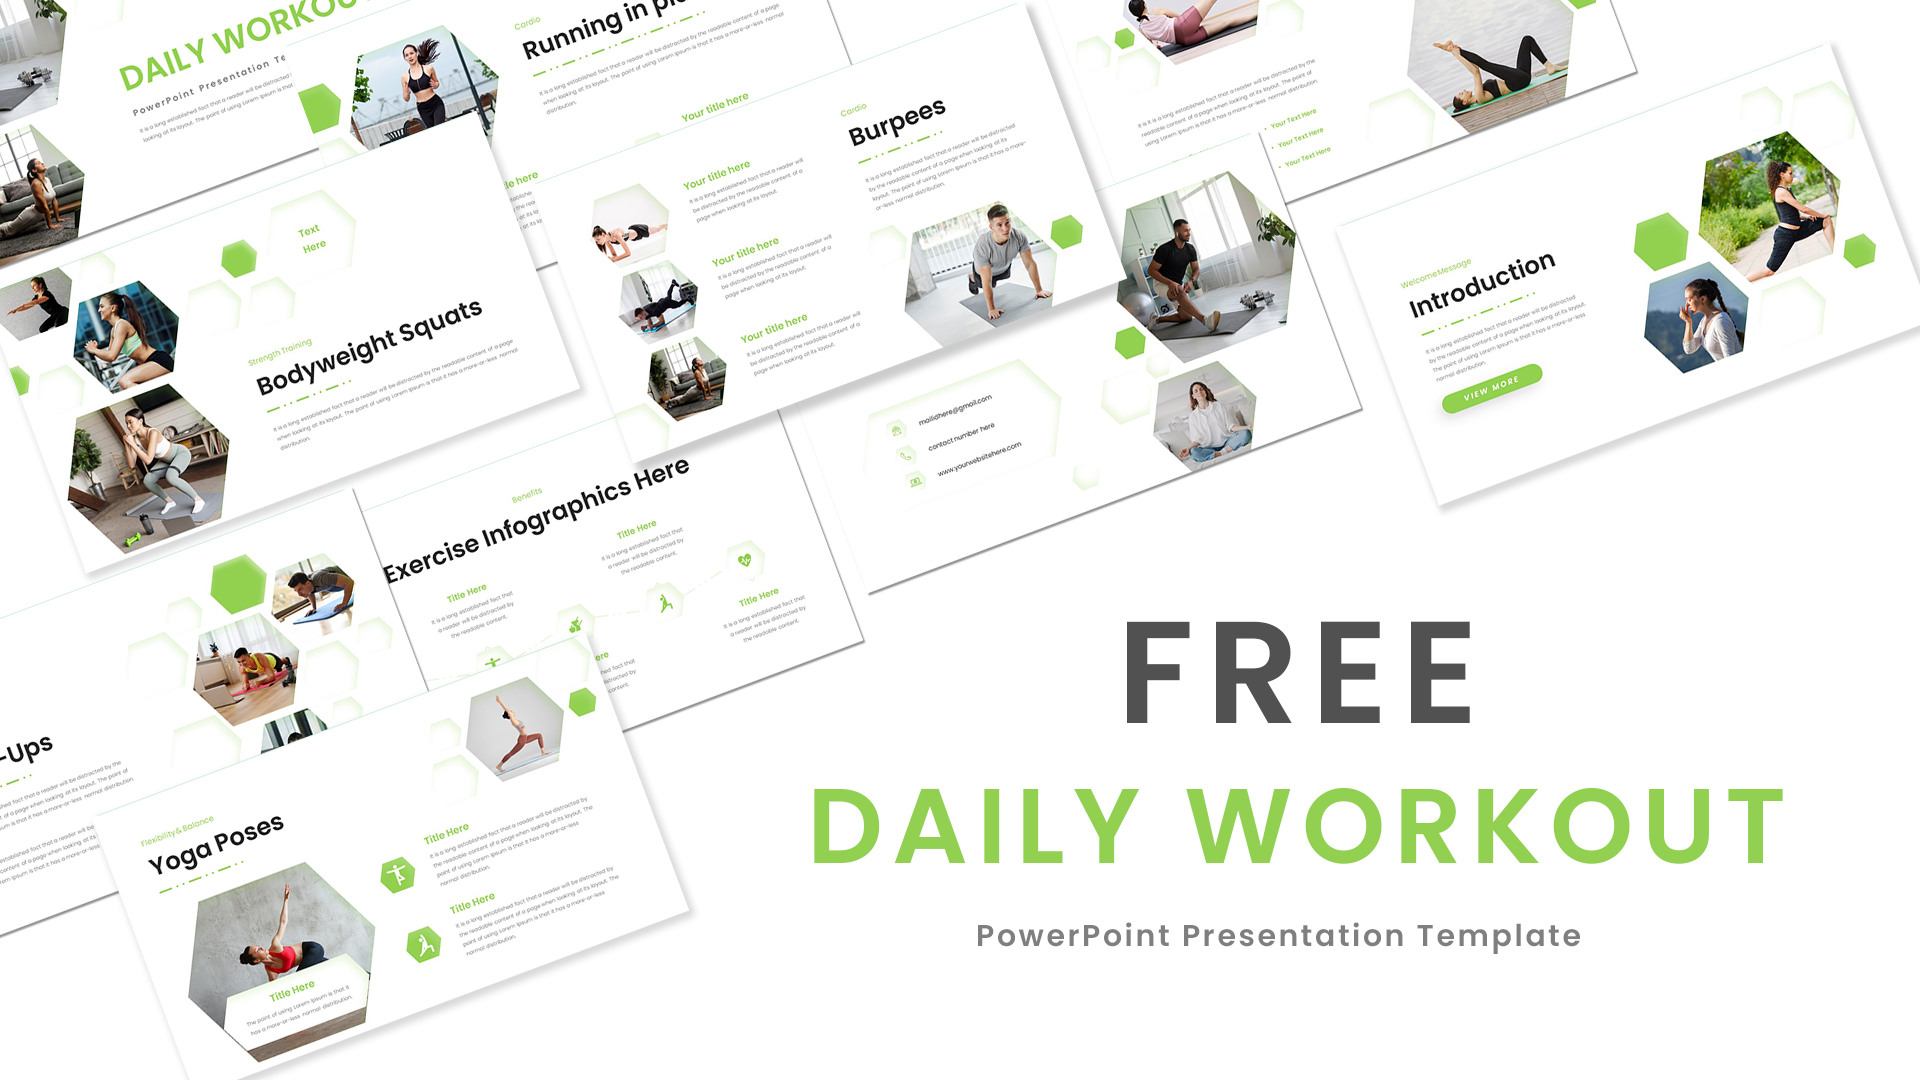
Free Green Hexagon Daily Workout Routine Template for PowerPoint & Google Slides
Pitch Deck
Free
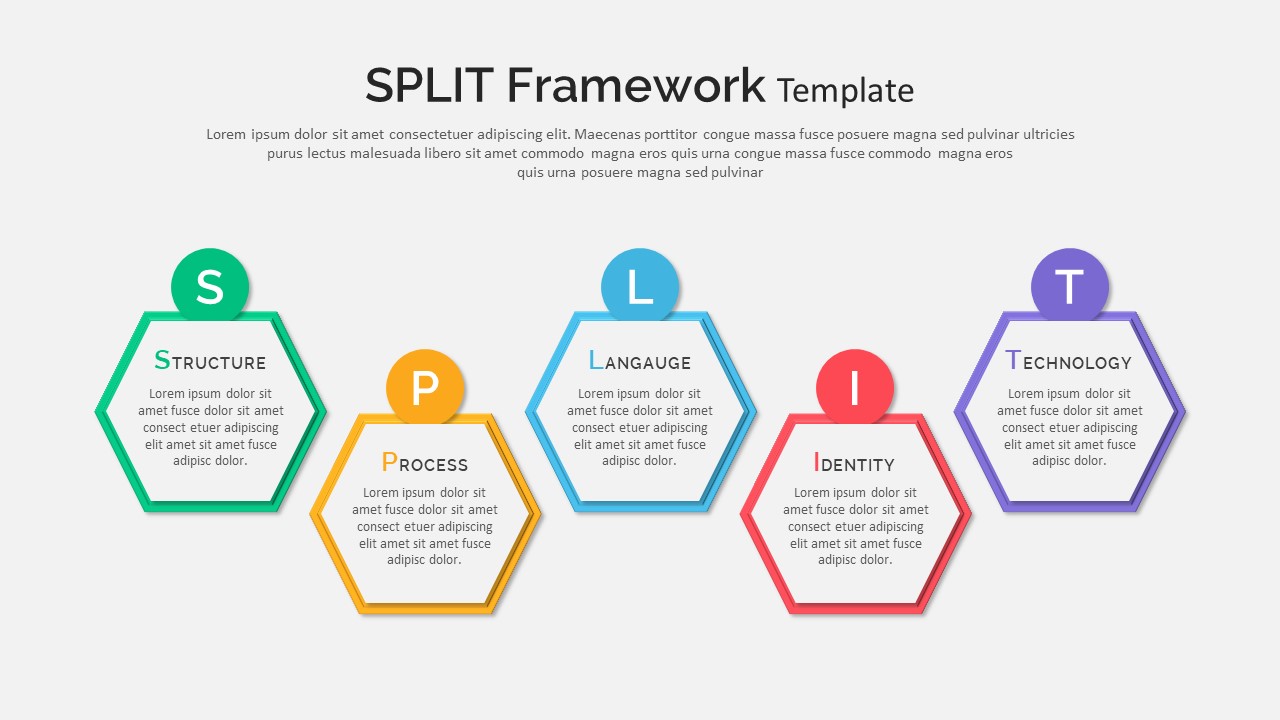
Split Framework Hexagon Diagram Slide Template for PowerPoint & Google Slides
Process
Cybersecurity Shield Hexagon Tech Template for PowerPoint & Google Slides
Information Technology
Medical Hexagon Layout Presentation Template for PowerPoint & Google Slides
Health
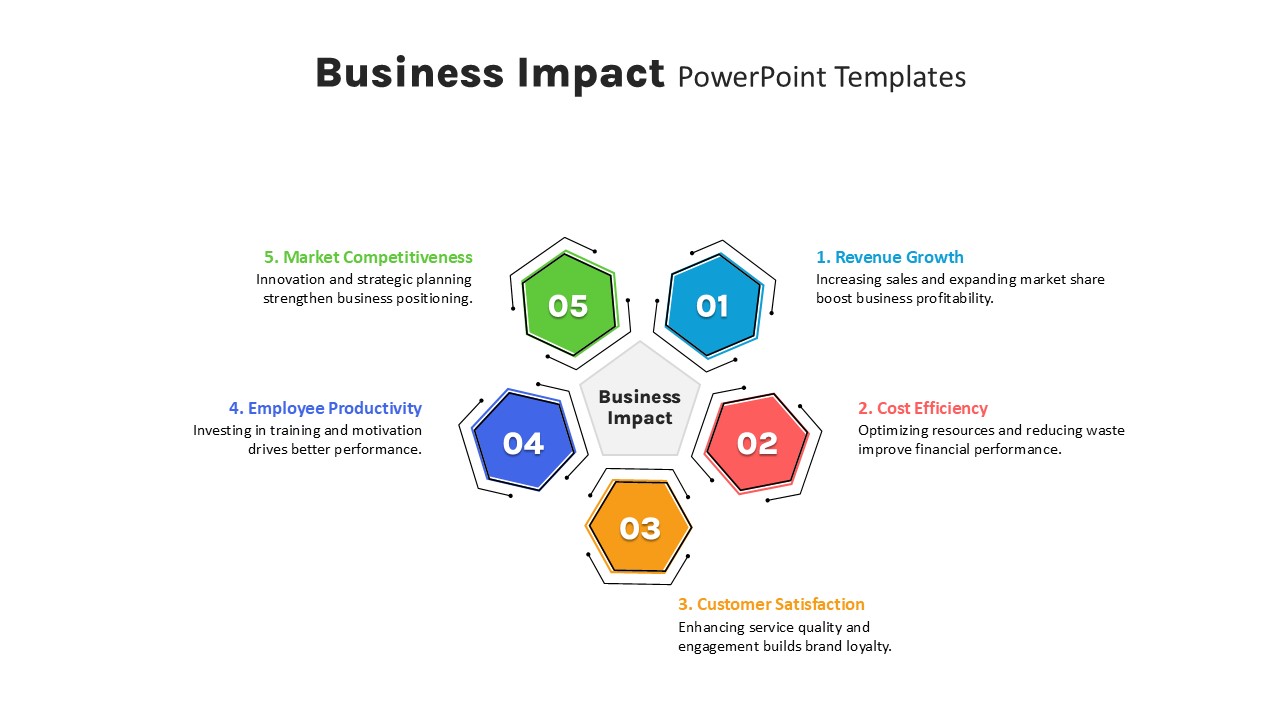
Five-Step Hexagon Business Impact Template for PowerPoint & Google Slides
Circular
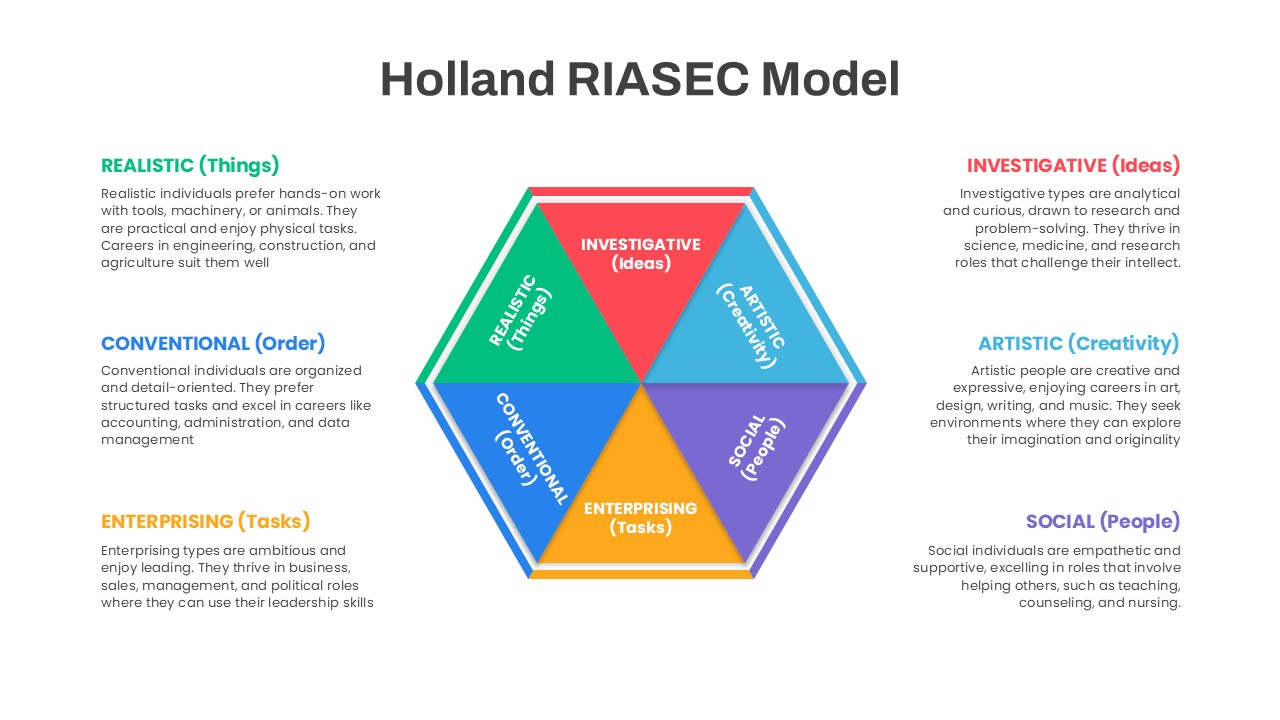
Holland RIASEC Hexagon Diagram Template for PowerPoint & Google Slides
Circular
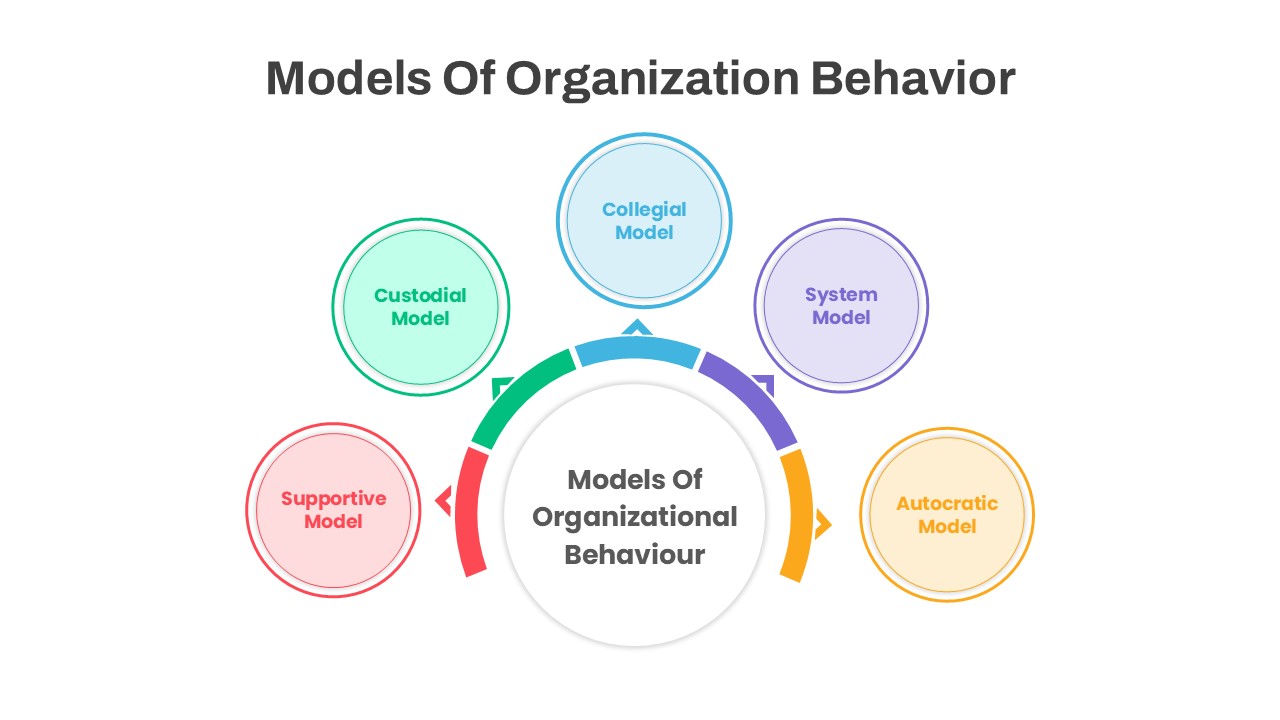
Organizational Behavior Hexagon Diagram Template for PowerPoint & Google Slides
Circular
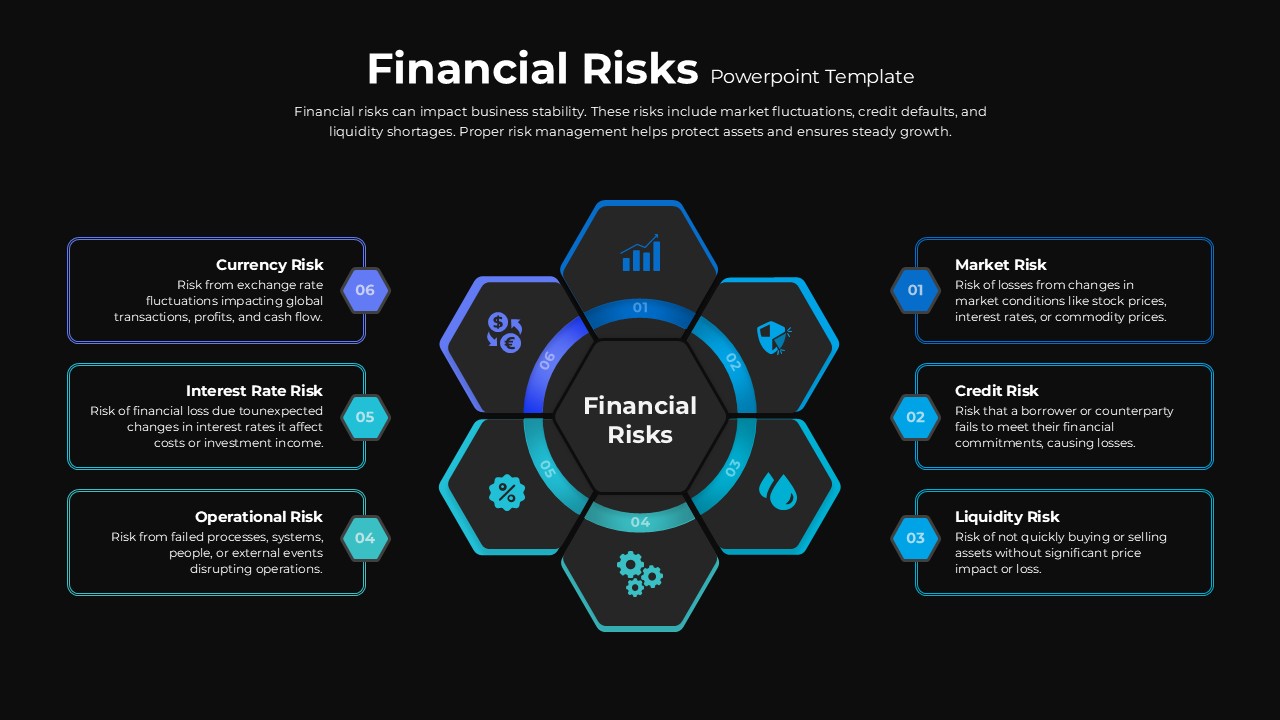
Financial Risks Hexagon Diagram Template for PowerPoint & Google Slides
Risk Management
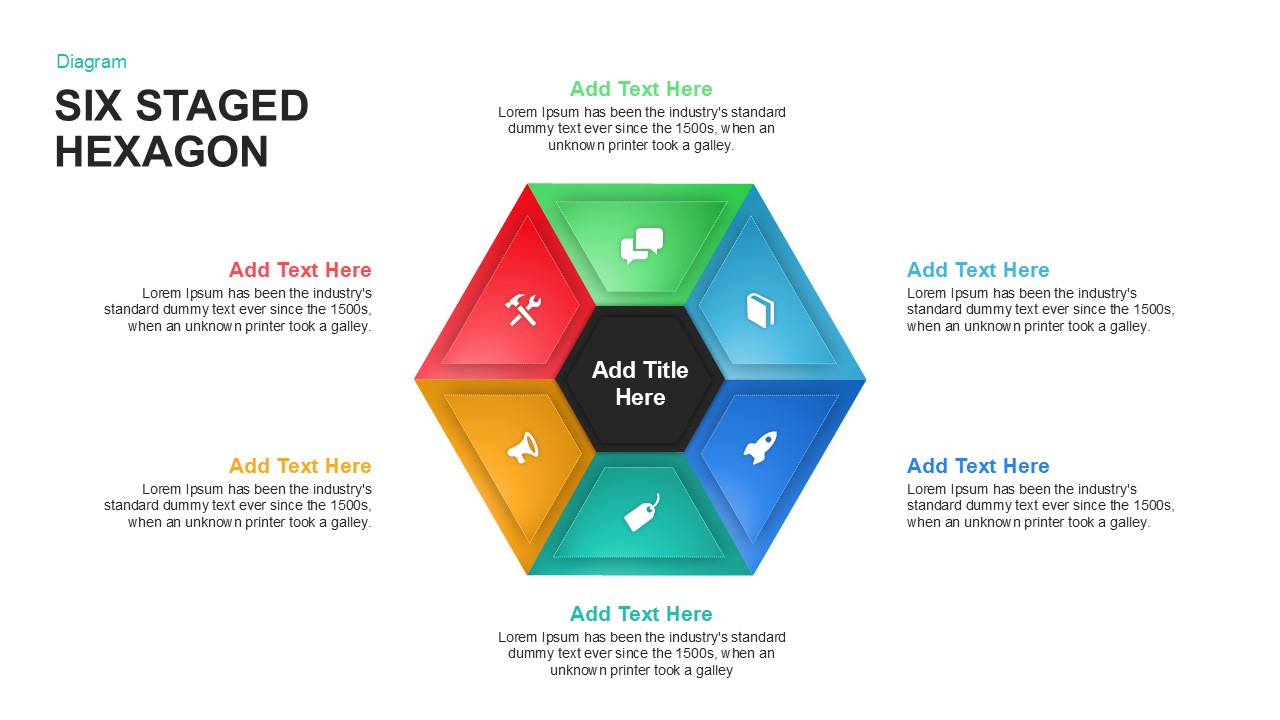
Six Staged Hexagon Diagram for PowerPoint & Google Slides
Process
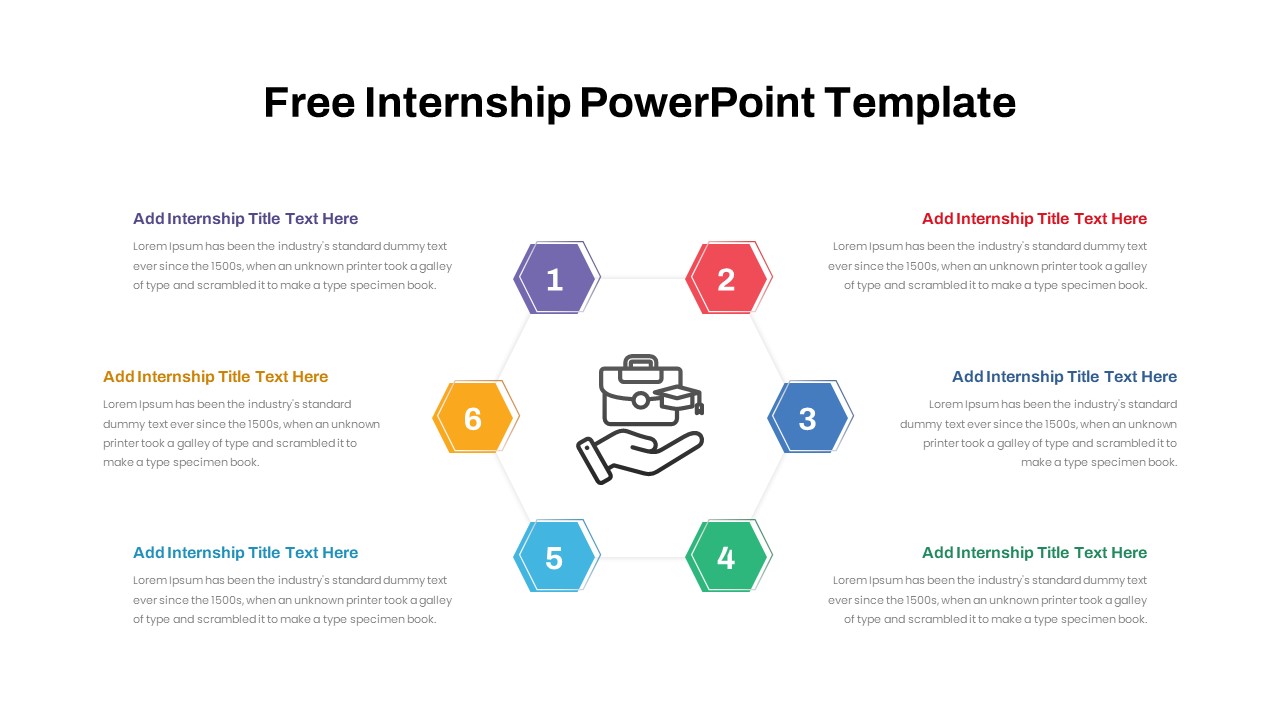
Free Internship Program Hexagon Layout for PowerPoint & Google Slides
Recruitment
Free
Sales Process Infographic Slides Pack Template for PowerPoint & Google Slides
Process
Workflow PowerPoint Process infographic for PowerPoint & Google Slides
Process
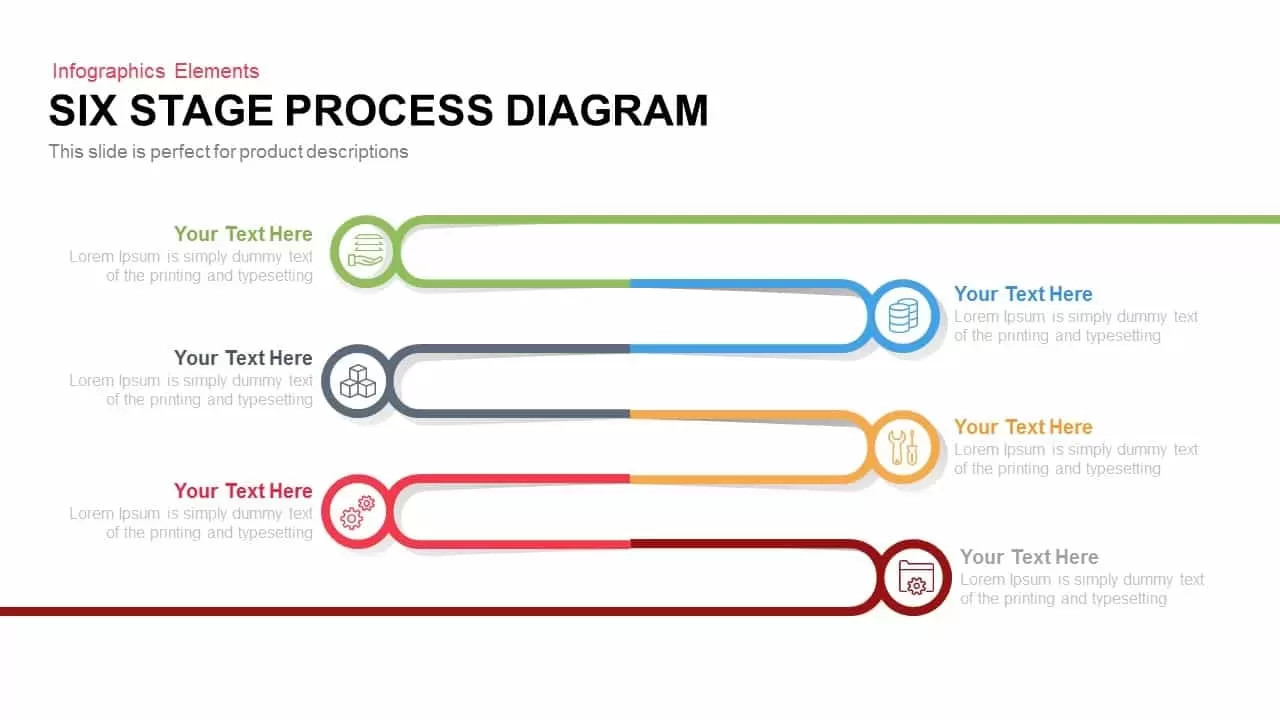
6 Stage Process Diagram Infographic Template for PowerPoint & Google Slides
Process
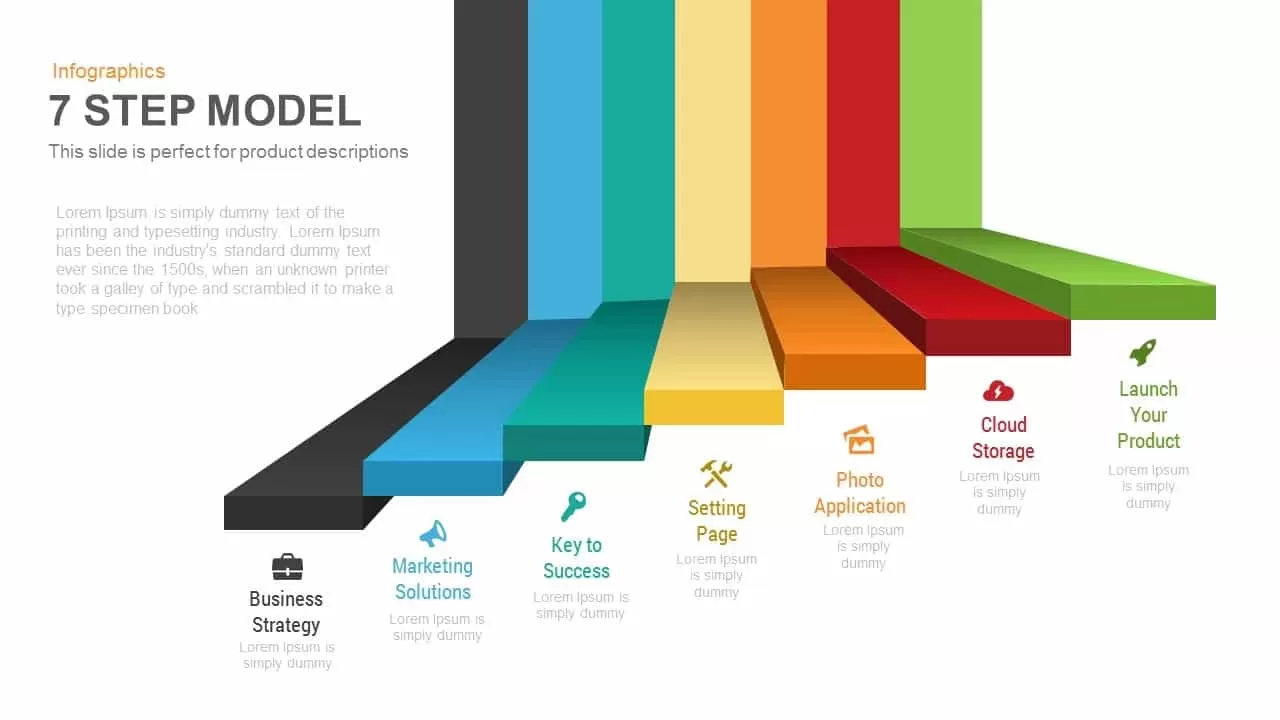
7-Step 3D Process Infographic Model template for PowerPoint & Google Slides
Process
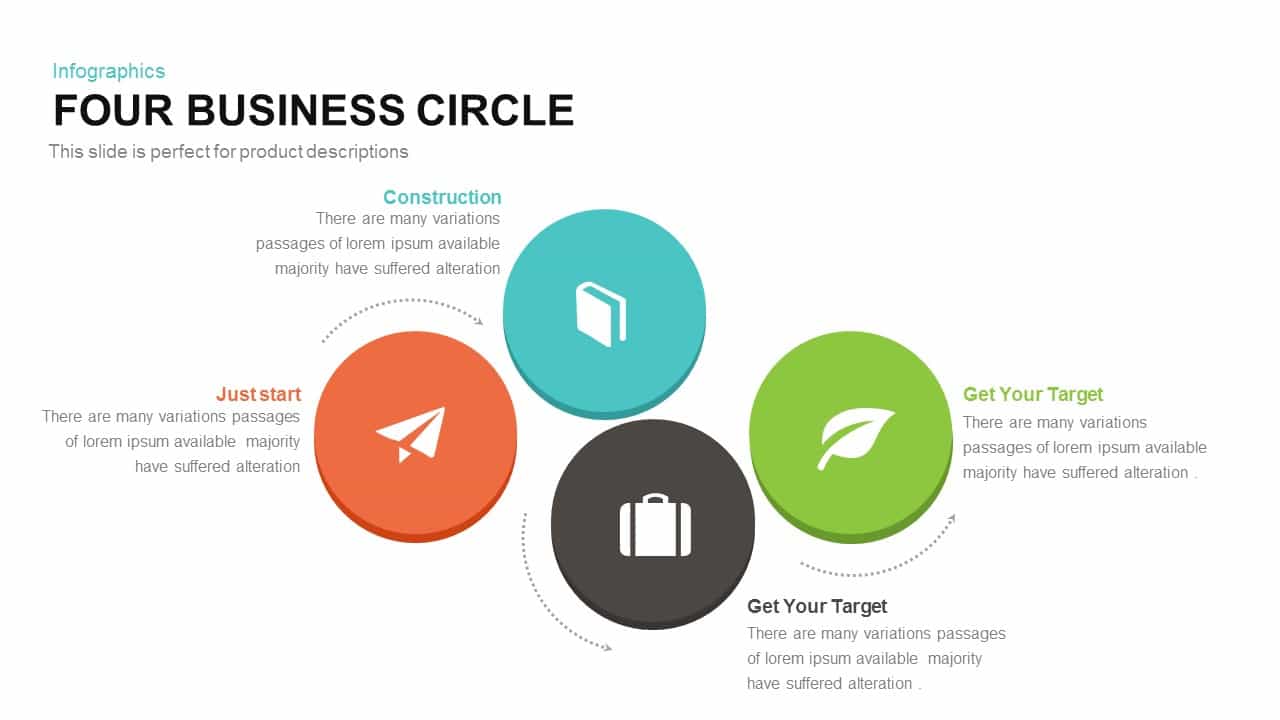
Four-Circle Business Process Infographic Template for PowerPoint & Google Slides
Circular
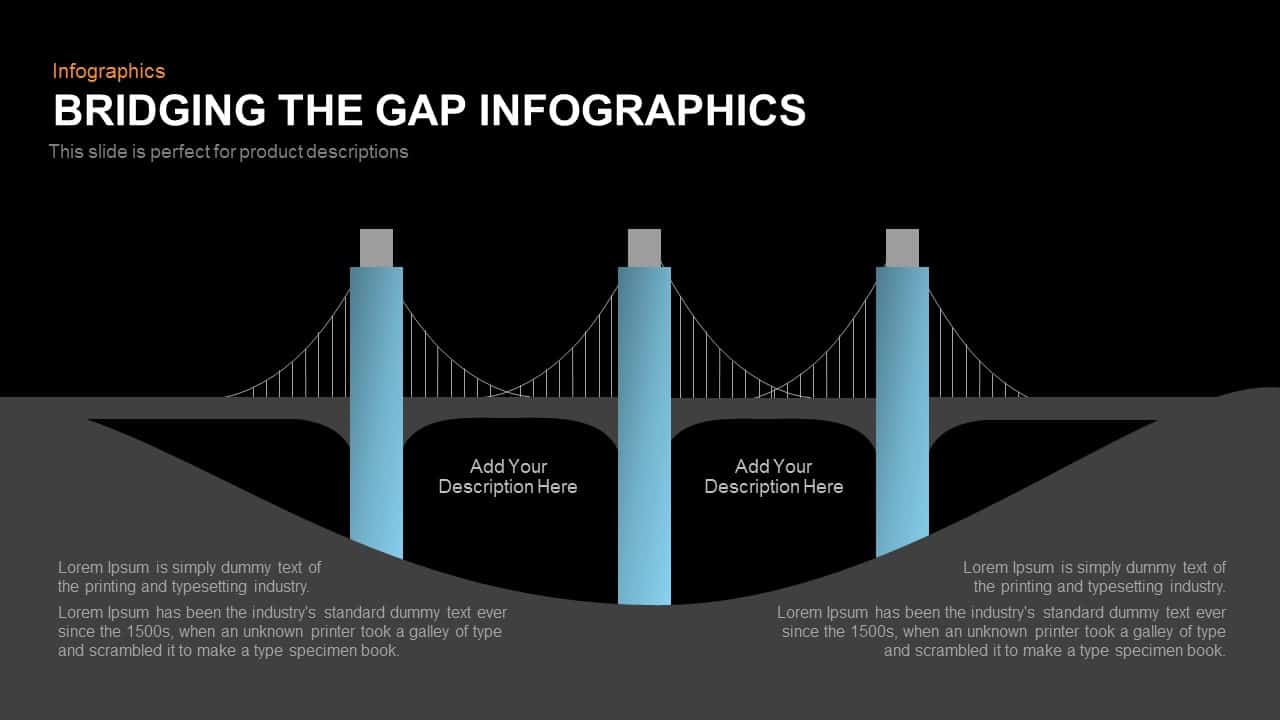
Bridging the Gap Infographic Process template for PowerPoint & Google Slides
Process
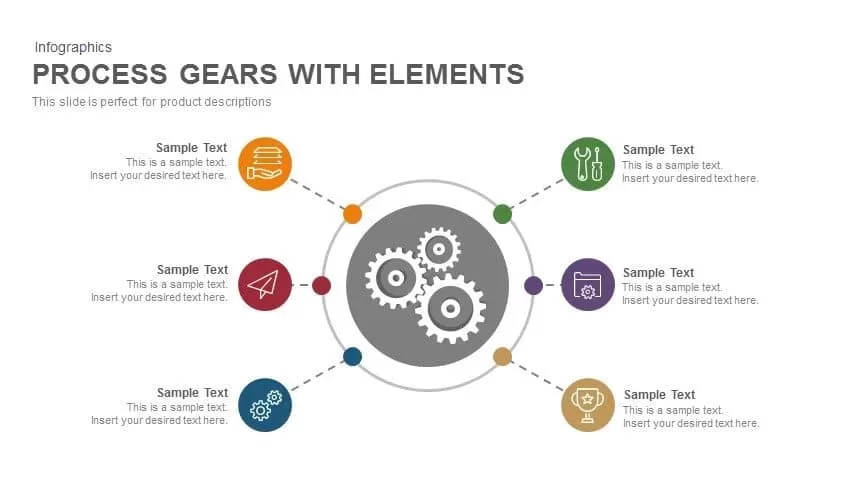
Process Gears with Elements Infographic Template for PowerPoint & Google Slides
Process
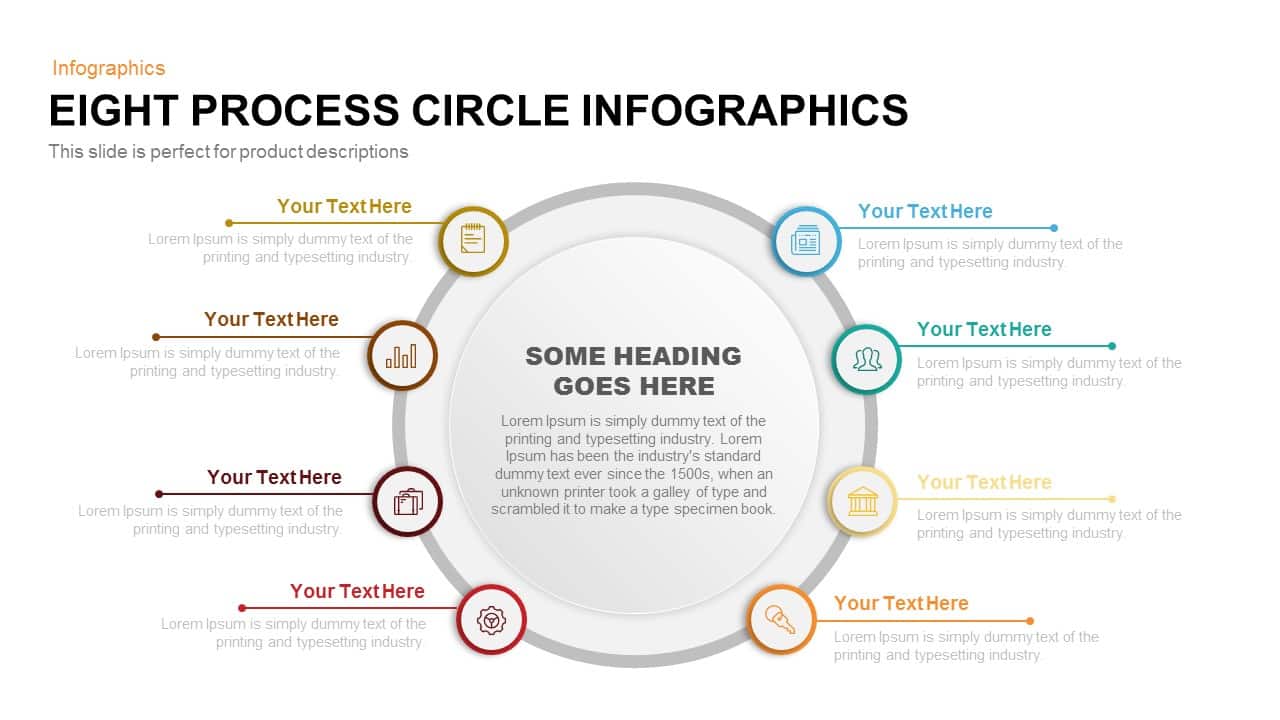
Eight-Stage Circular Process Infographic Template for PowerPoint & Google Slides
Circular
Five Stage Process Diagram Infographic Template for PowerPoint & Google Slides
Process

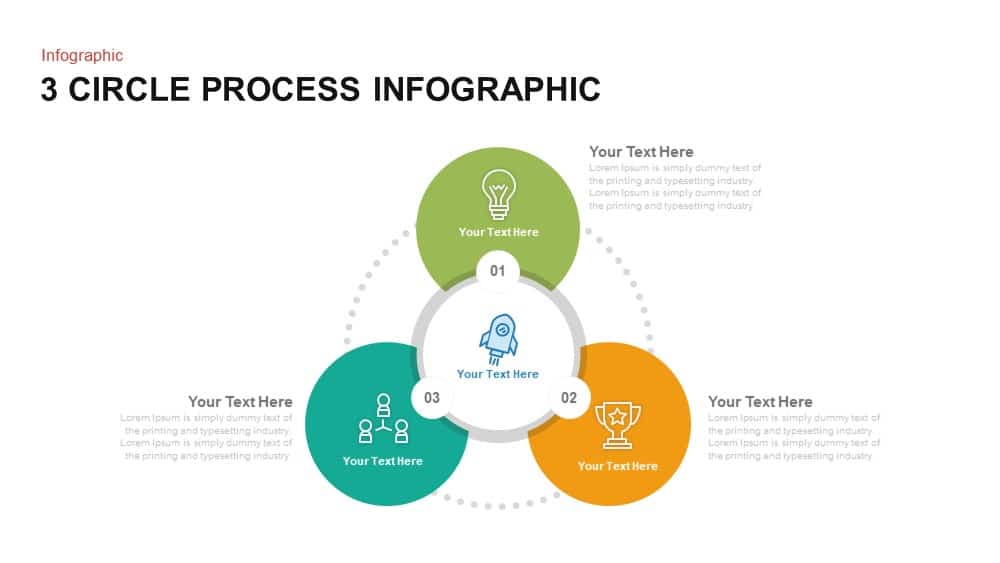
Three-Circle Process Infographic Template for PowerPoint & Google Slides
Circular
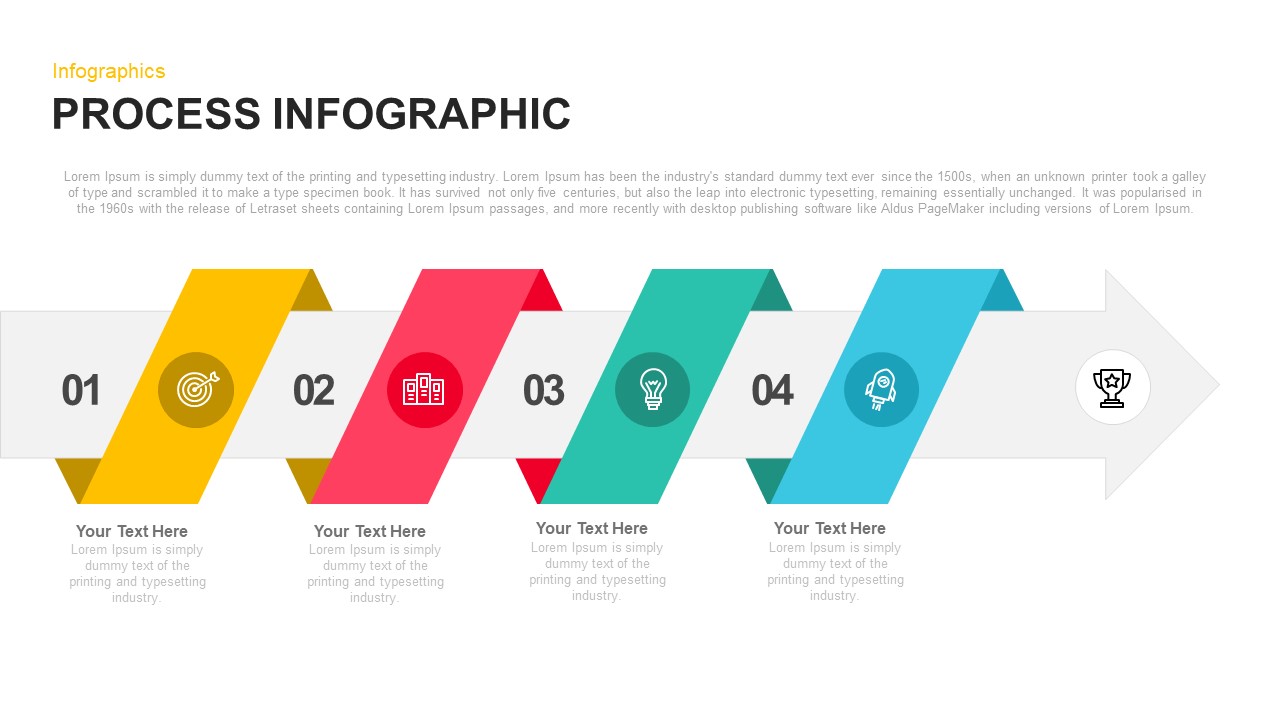
Four-Step Arrow Process Infographic Template for PowerPoint & Google Slides
Arrow
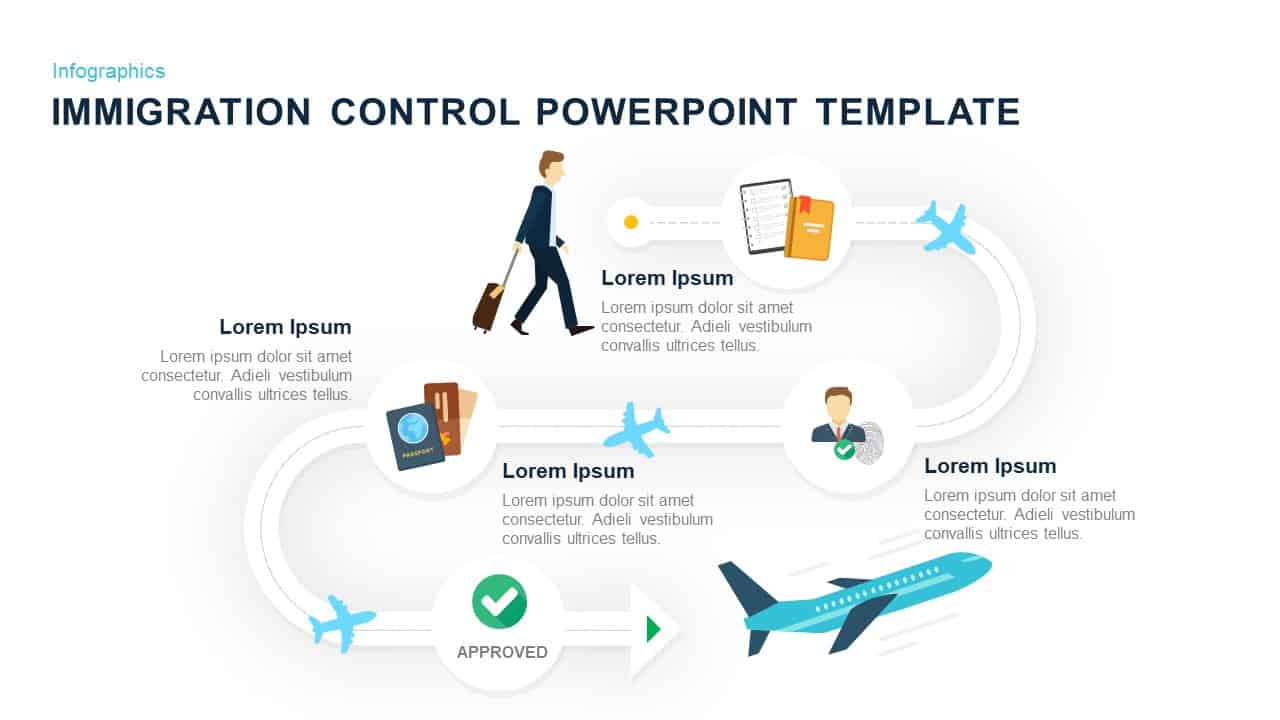
Immigration Control Process Infographic Template for PowerPoint & Google Slides
Process
Vertical Stacked Process Infographic Template for PowerPoint & Google Slides
Process
Four-Step Pencil Infographic Process Template for PowerPoint & Google Slides
Process
Water Cycle Process Infographic Template for PowerPoint & Google Slides
Process
Circular CRM Process Diagram Infographic Template for PowerPoint & Google Slides
Circular
Vertical Four-Step Process Infographic Template for PowerPoint & Google Slides
Process
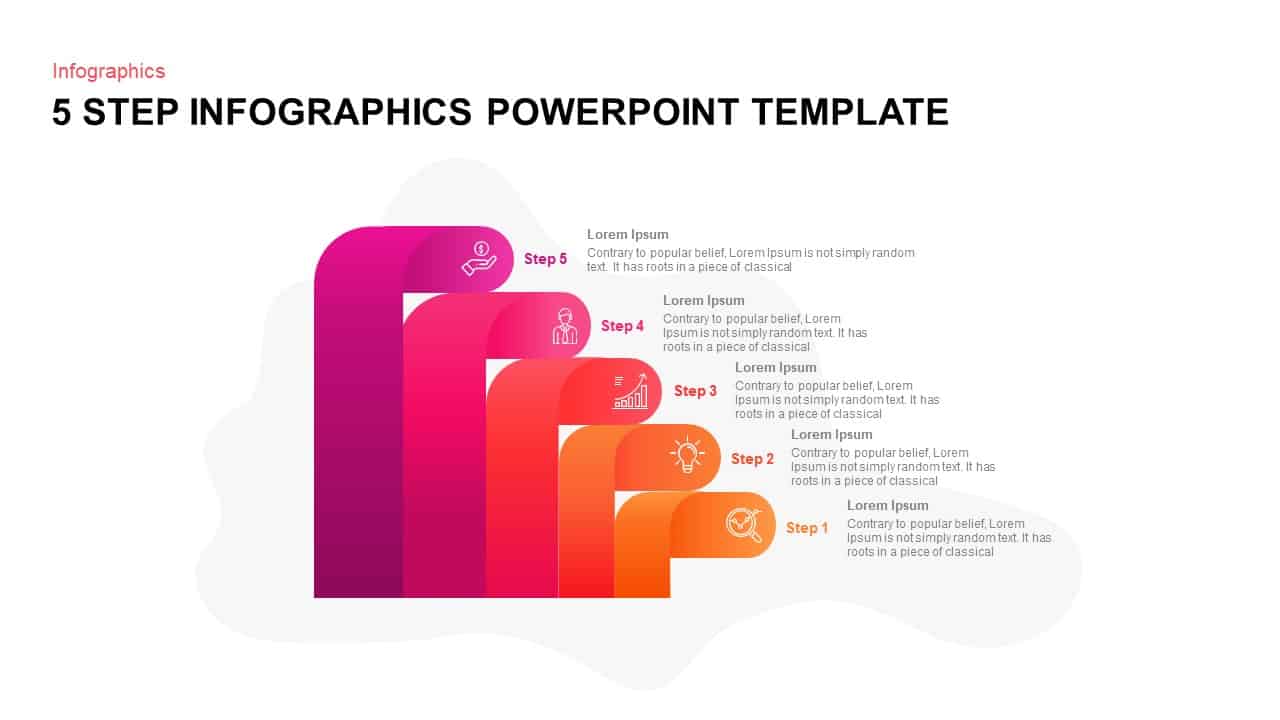
Gradient 5-Step Infographic Process Template for PowerPoint & Google Slides
Process
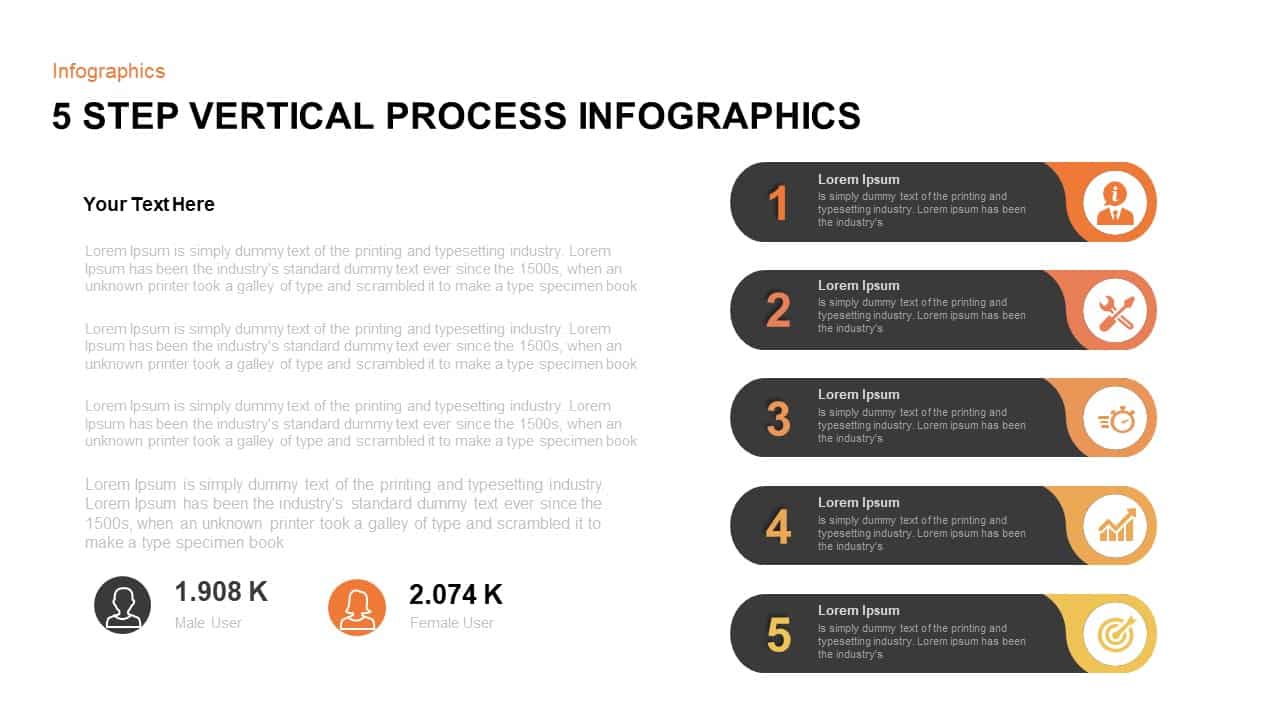
Five-Step Vertical Process Infographic Template for PowerPoint & Google Slides
Process
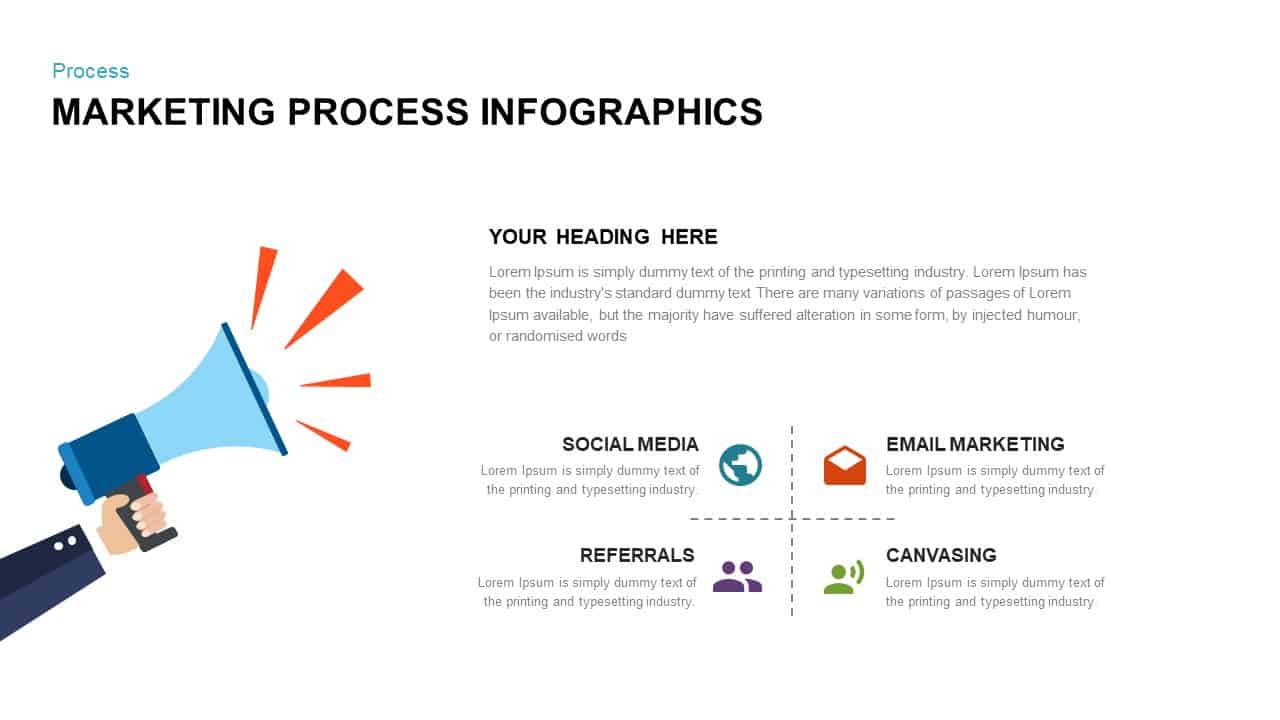
Marketing Process Channels Infographic template for PowerPoint & Google Slides
Process
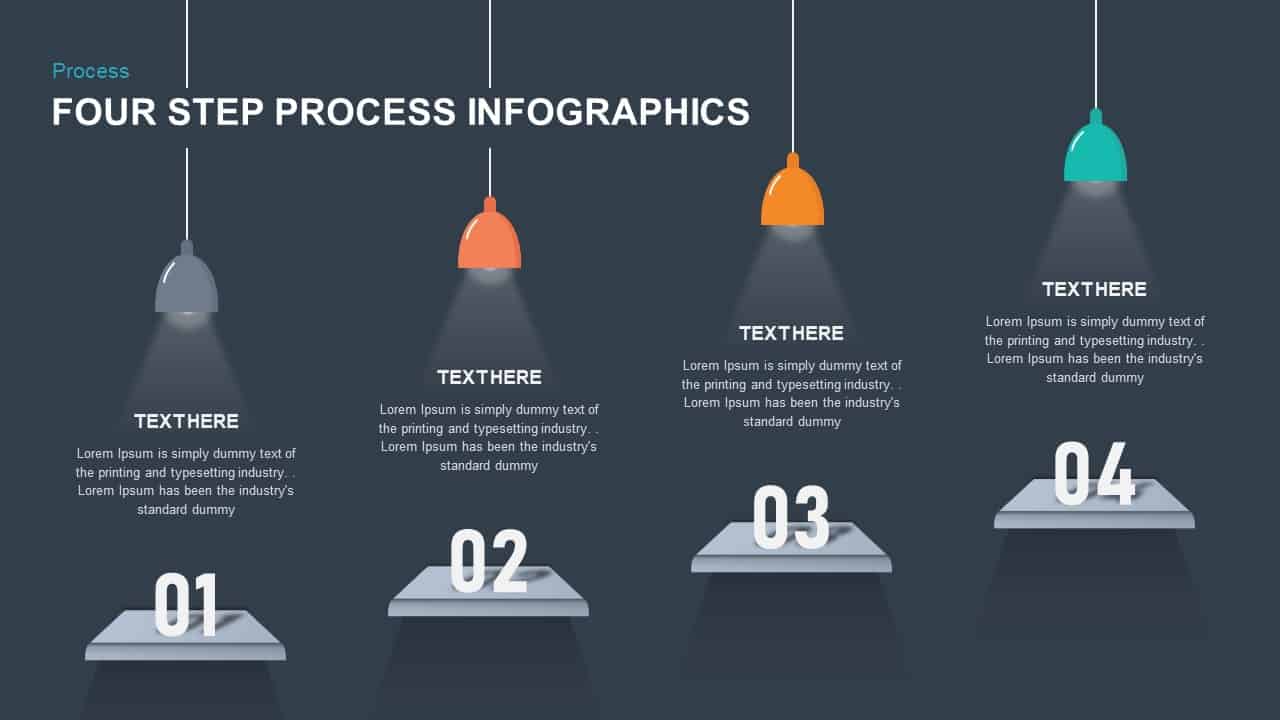
Four Step Process Infographic Slide Template for PowerPoint & Google Slides
Process
Goal Planning Ribbon Process Infographic Template for PowerPoint & Google Slides
Goals
Six Sigma 6S Process Infographic Diagram Template for PowerPoint & Google Slides
Process
6 Stage Service Process Infographic Template for PowerPoint & Google Slides
Process

DMAIC Process Improvement Infographic Template for PowerPoint & Google Slides
Process
Five-Step Infographic Process and Agenda Template for PowerPoint & Google Slides
Process
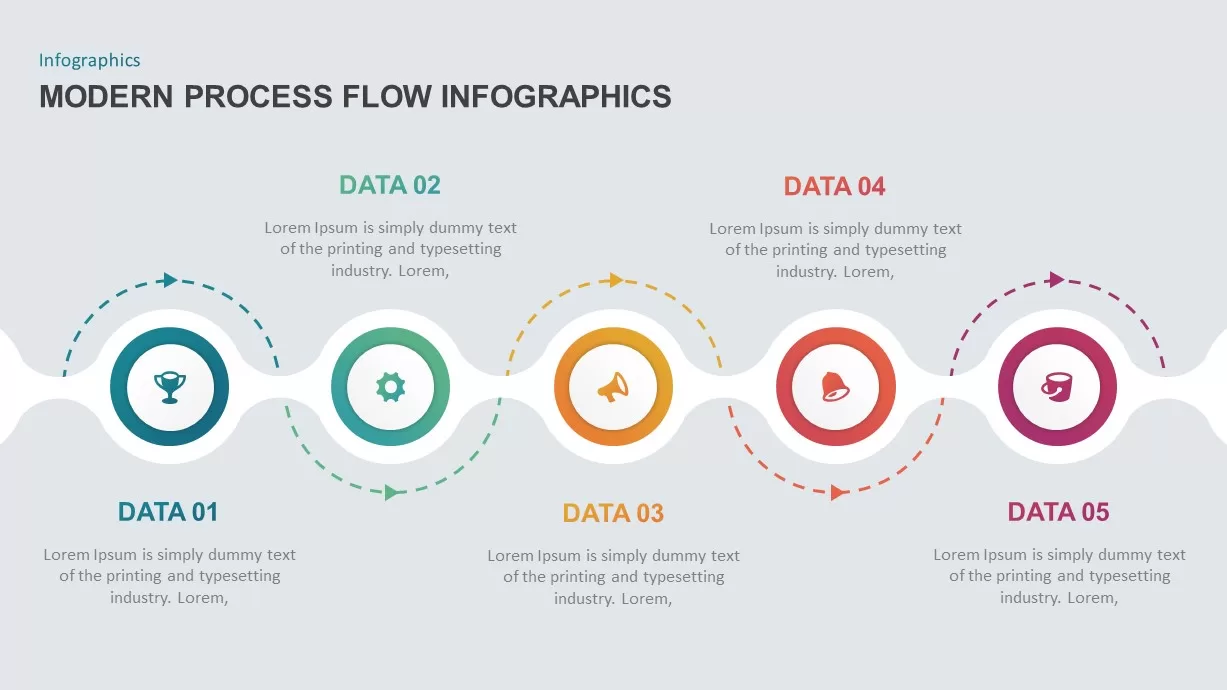
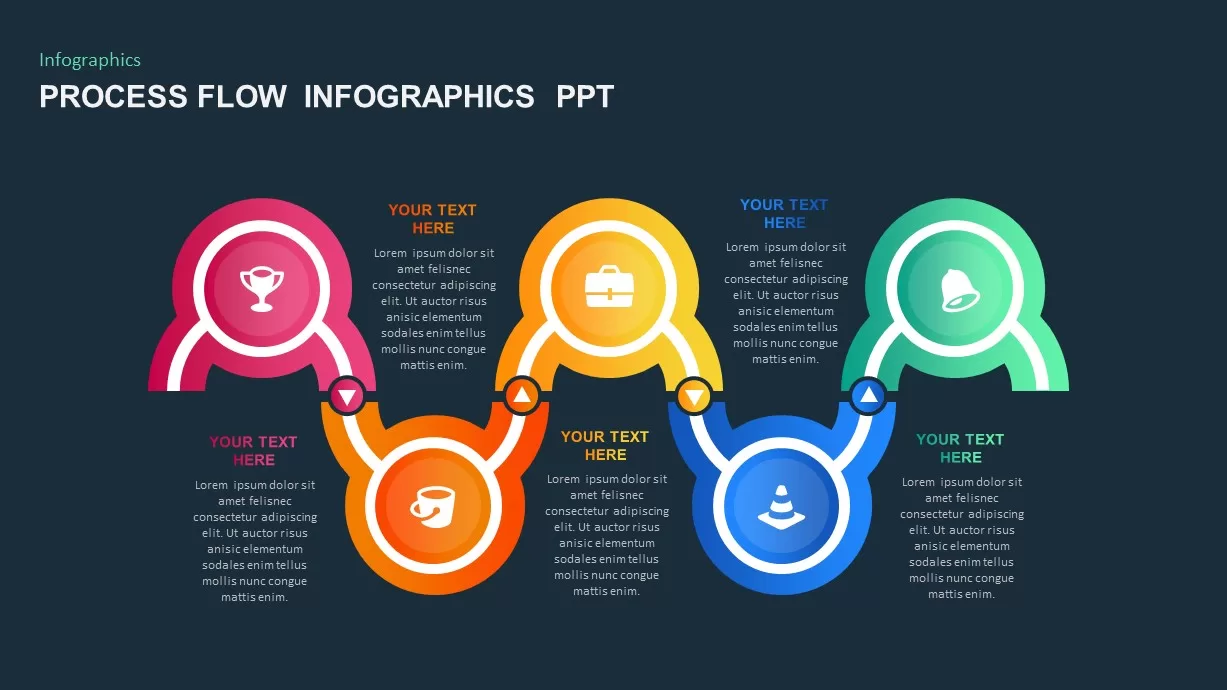
Modern 5-Step Process Flow Infographic Template for PowerPoint & Google Slides
Process
Five-Step Process Flow Infographic Template for PowerPoint & Google Slides
Process
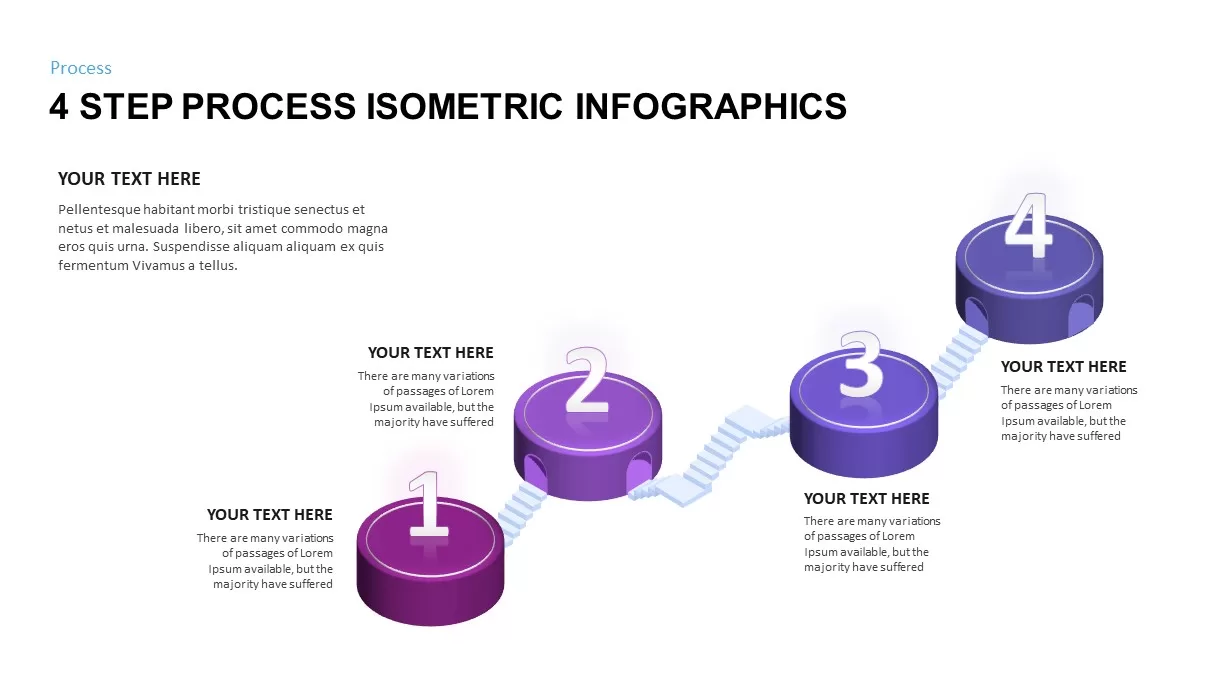
Four-Step Isometric Process Infographic Template for PowerPoint & Google Slides
Process
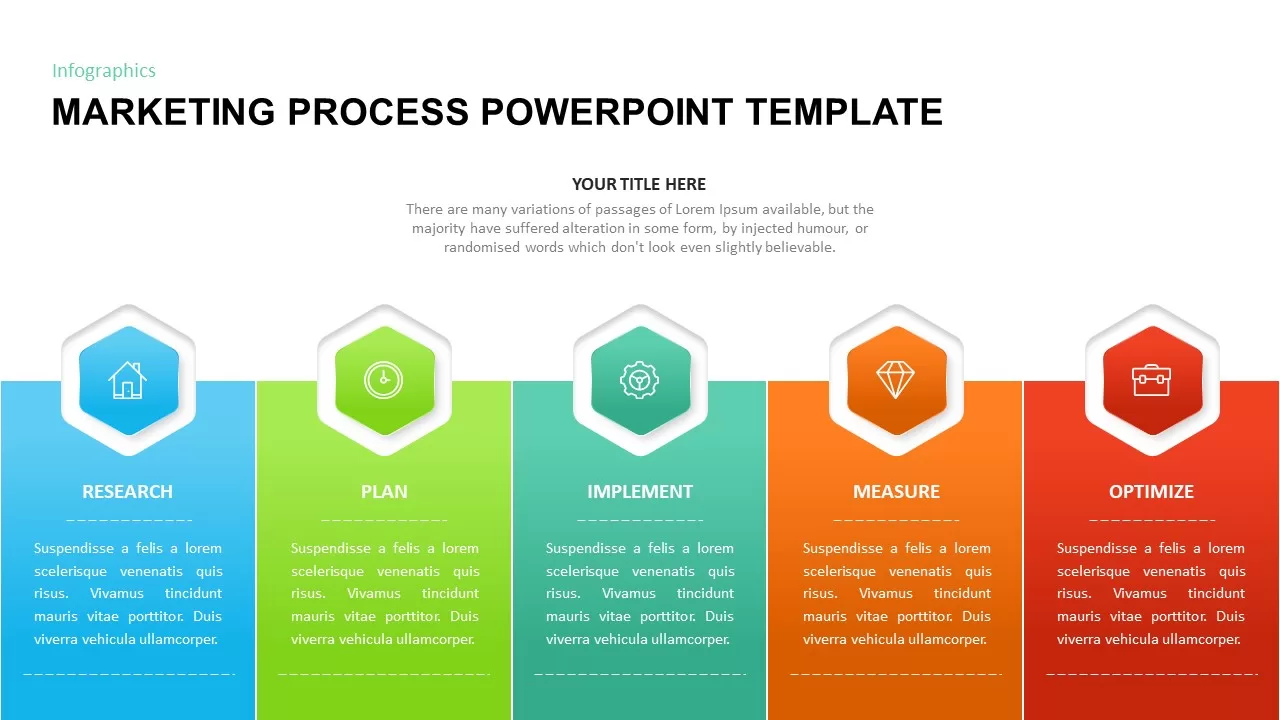
Five-Step Marketing Process Infographic Template for PowerPoint & Google Slides
Process
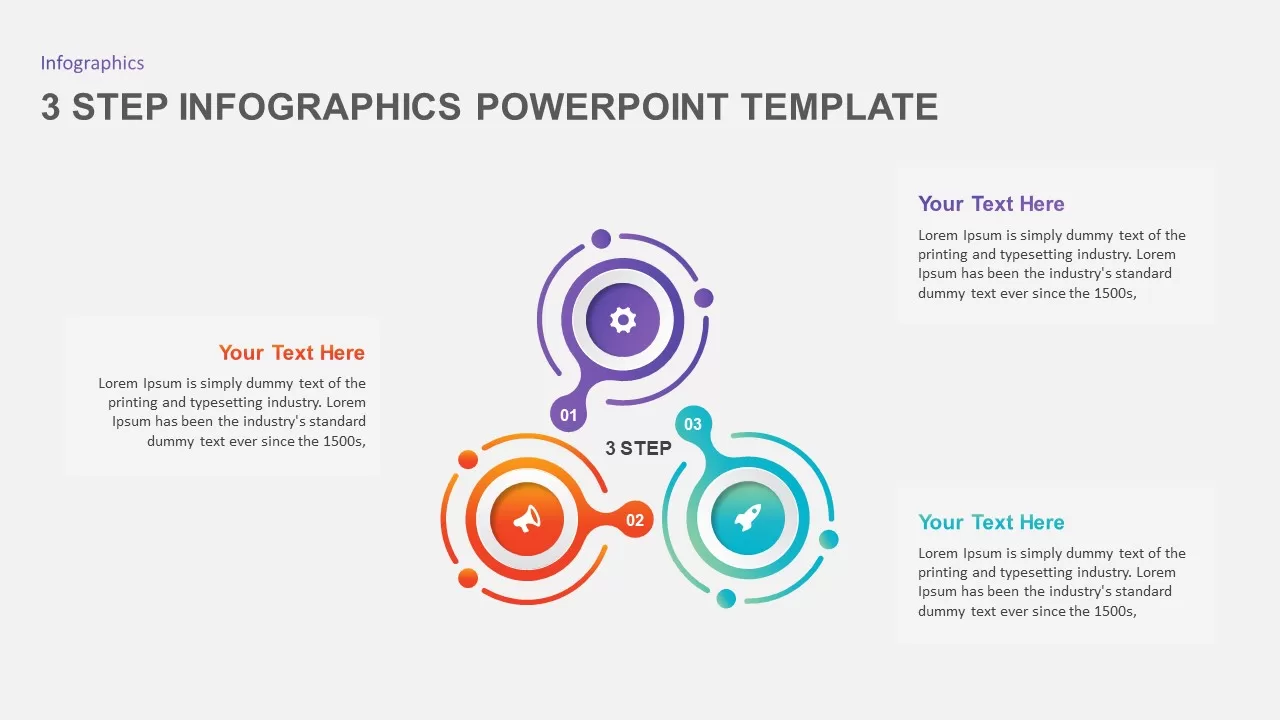
3 & 4 Step Circular Process Infographic Template for PowerPoint & Google Slides
Process
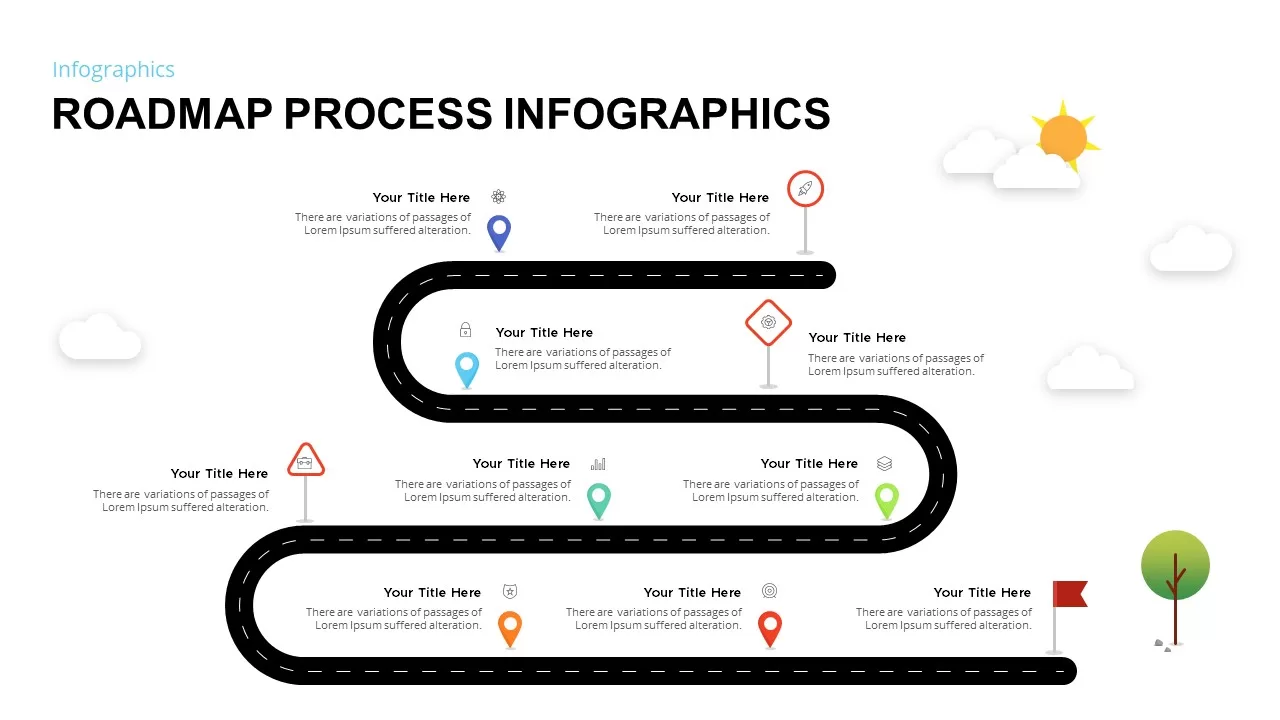
Roadmap Process Infographic Template for PowerPoint & Google Slides
Roadmap
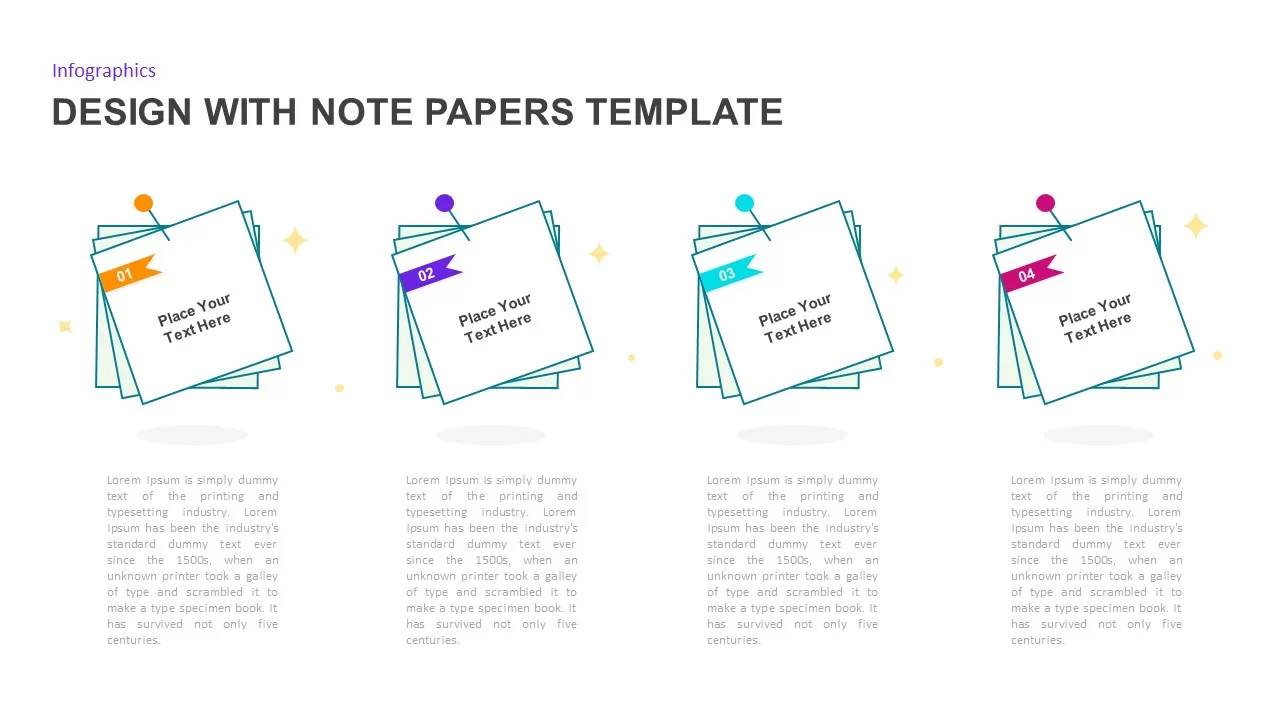
Pinnable Note-Paper Process Infographic Template for PowerPoint & Google Slides
Process
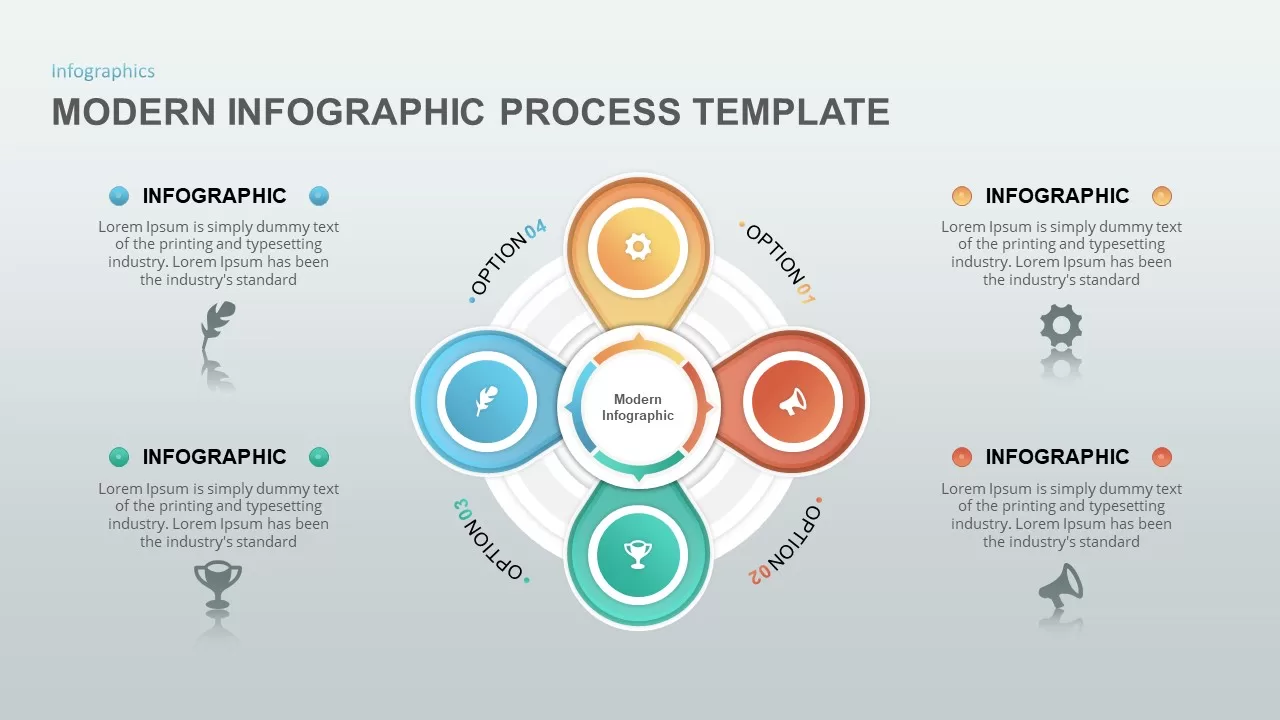
Modern Infographic Process template for PowerPoint & Google Slides
Infographics
Minimal Process Flow Diagram Infographic Template for PowerPoint & Google Slides
Process
People-Process-Technology Infographic Template for PowerPoint & Google Slides
Process
Multi-Step Infographic Process Layout Template for PowerPoint & Google Slides
Process
Curved Arrow Process Flow Infographic Template for PowerPoint & Google Slides
Process
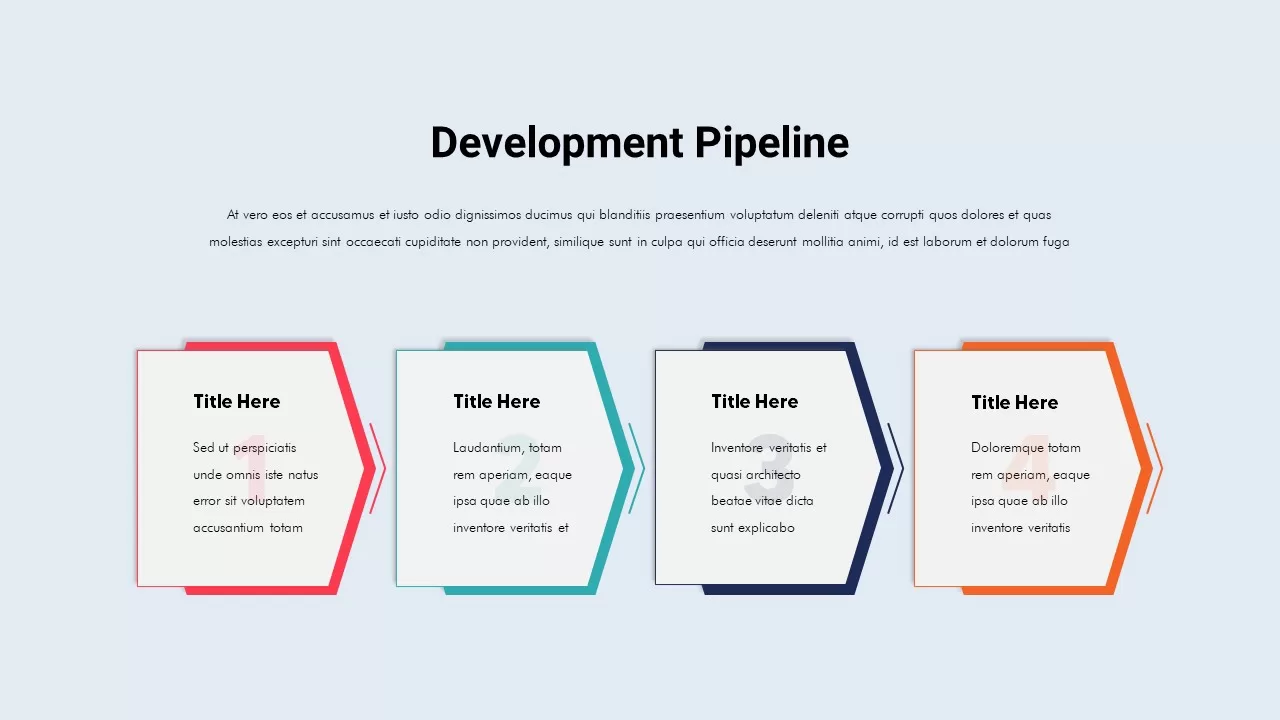
Development Pipeline Process Infographic Template for PowerPoint & Google Slides
Process
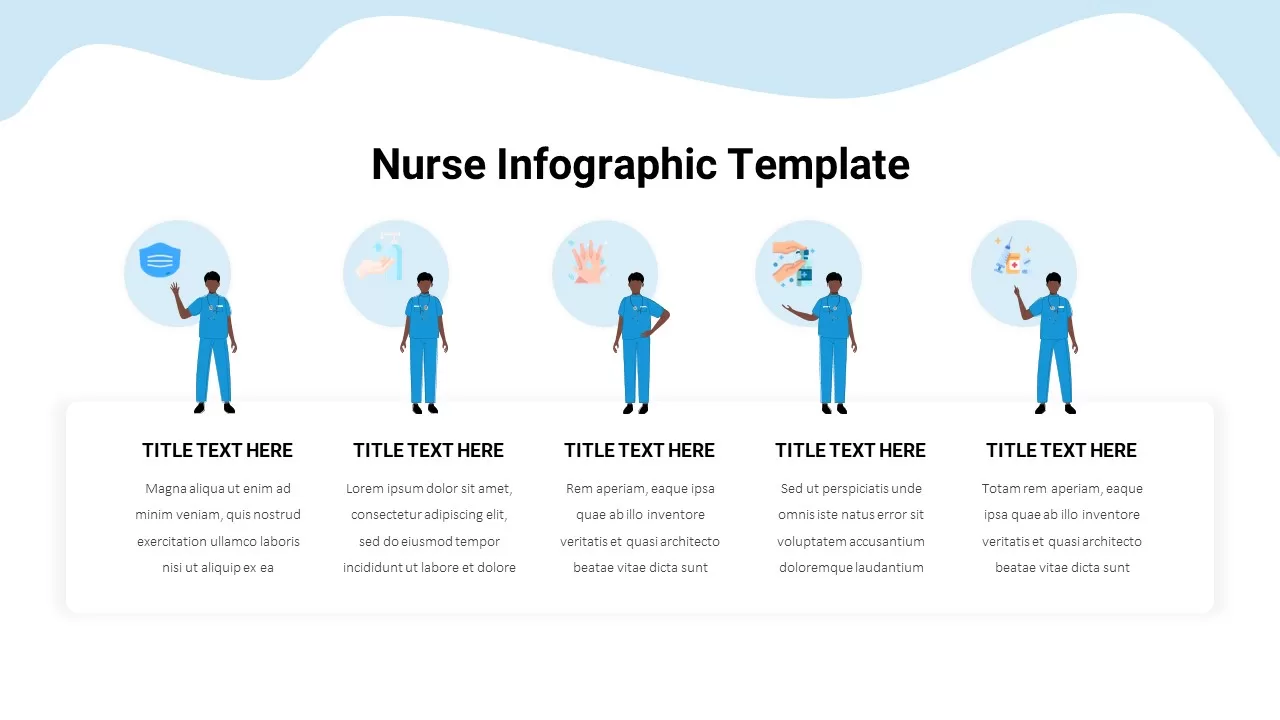
Nursing Process Infographic Template for PowerPoint & Google Slides
Nursing
Ten Step Circular Process Infographic Template for PowerPoint & Google Slides
Process
Chain Link Process Infographic Diagram Template for PowerPoint & Google Slides
Process
Chain Link Process Infographic Diagram Template for PowerPoint & Google Slides
Process
Chain Link Process Infographic Diagram Template for PowerPoint & Google Slides
Process
Five-Step Chain Link Process Infographic Template for PowerPoint & Google Slides
Process
Ten-Step Circular Process Infographic Template for PowerPoint & Google Slides
Circular
Conveyor Belt Infographic Process Flow Template for PowerPoint & Google Slides
Process
Robotics Process Cycle Infographic Template for PowerPoint & Google Slides
Process
Apple Four-Step Process Infographic Template for PowerPoint & Google Slides
Process
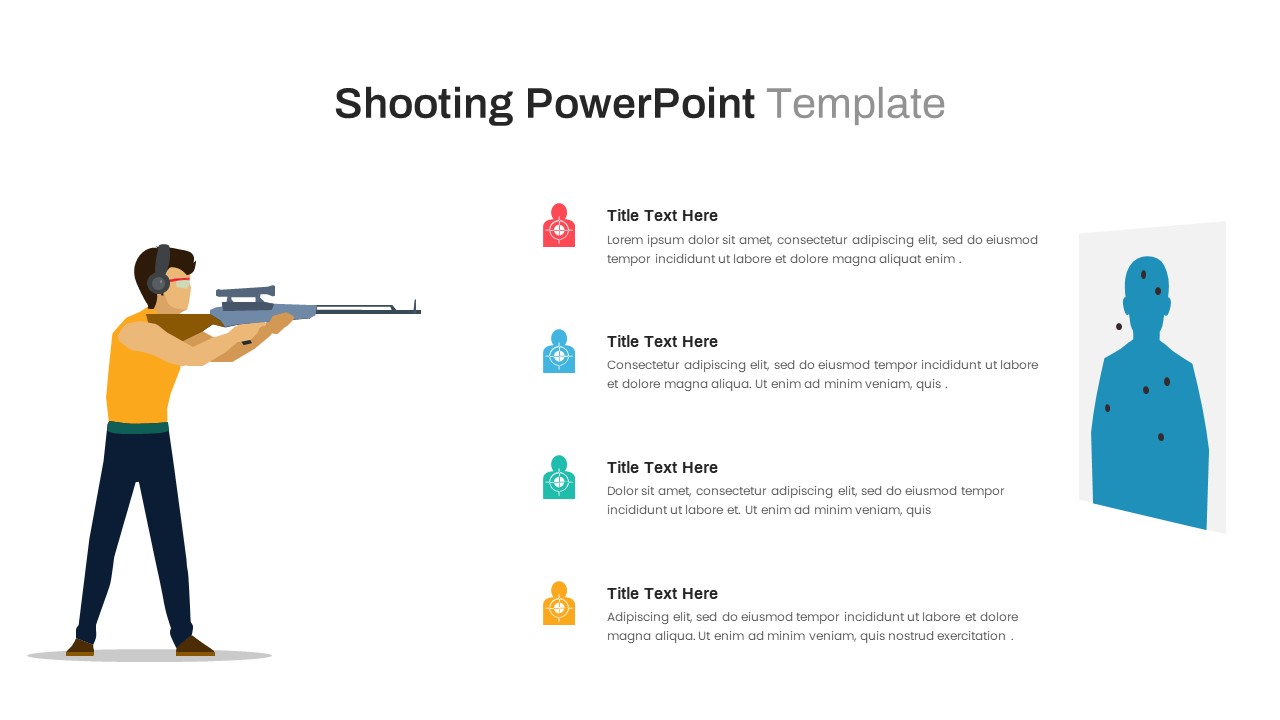
Shooting Target Process Infographic Template for PowerPoint & Google Slides
Process
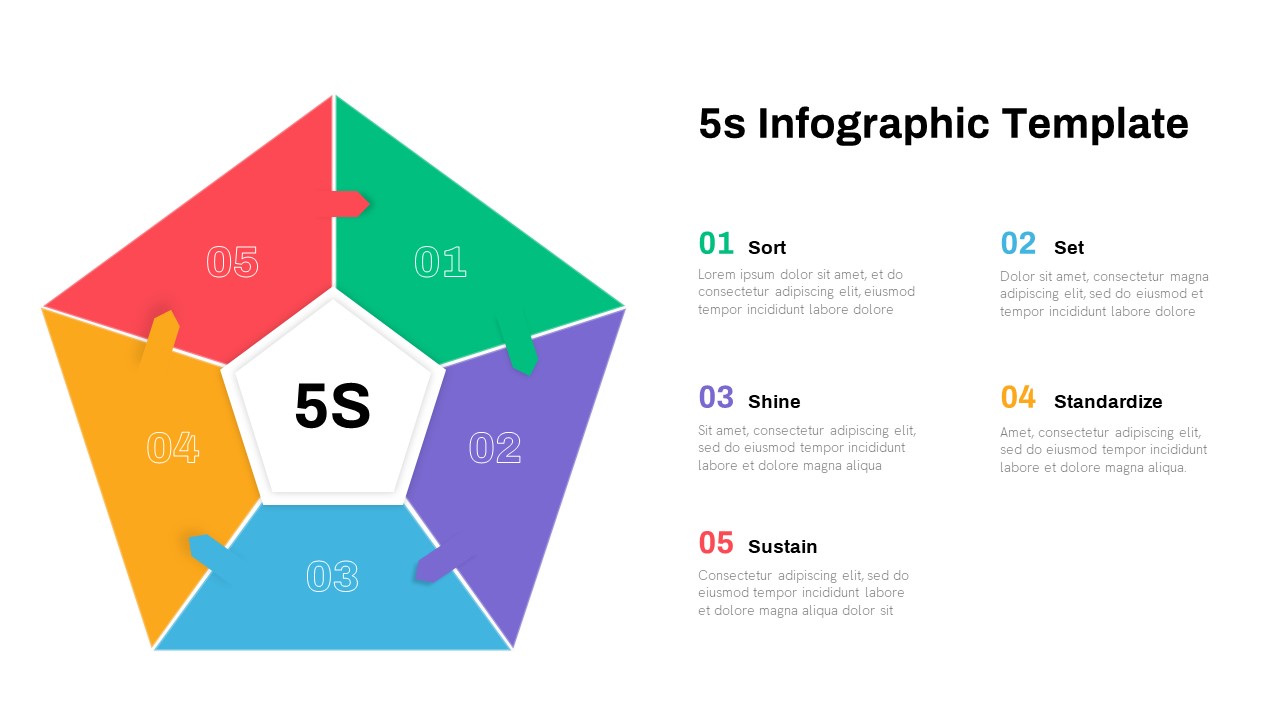
5S Lean Process Improvement Infographic Template for PowerPoint & Google Slides
Business Strategy
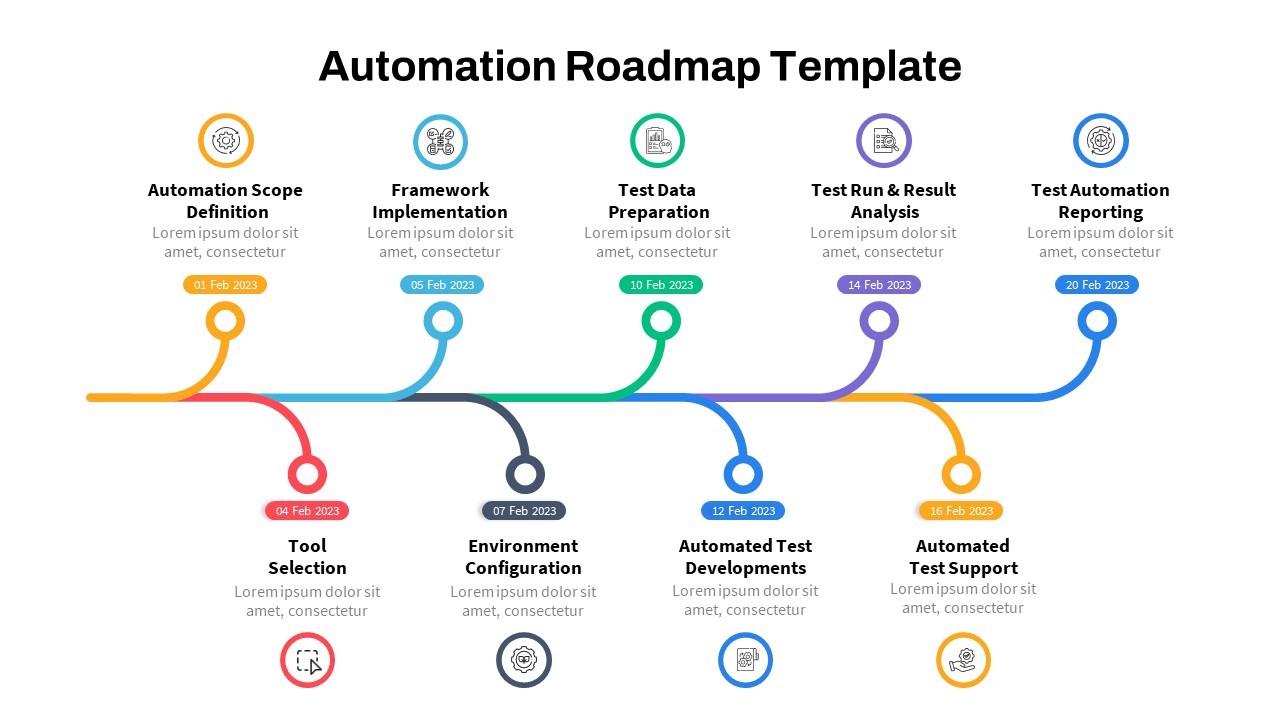
Automation Process Roadmap Infographic Template for PowerPoint & Google Slides
Roadmap
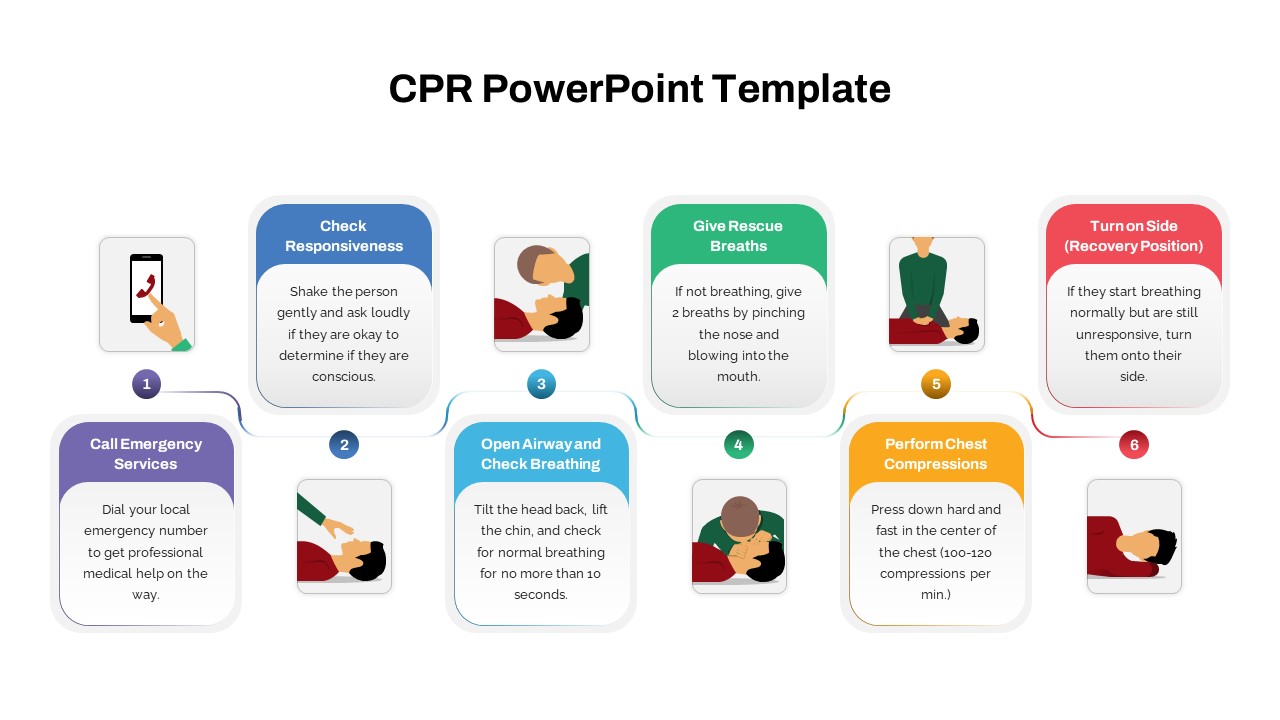
CPR Training Process Infographic Template for PowerPoint & Google Slides
Process
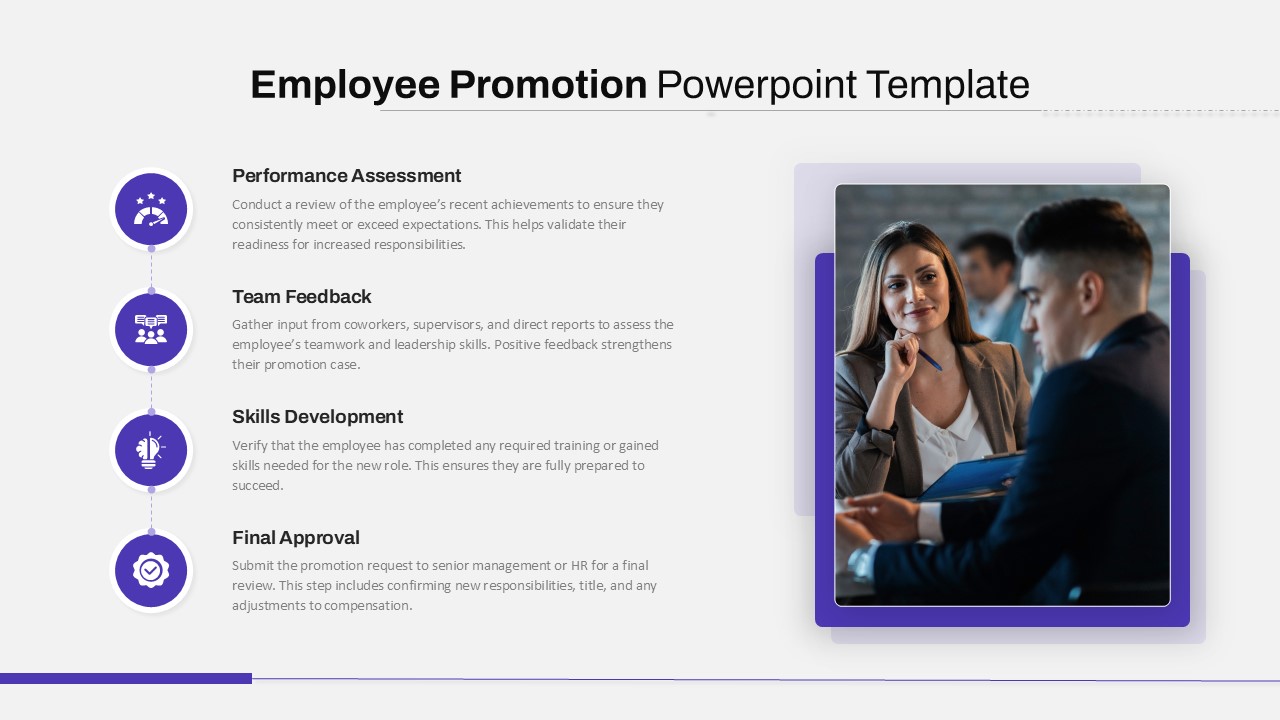
Employee Promotion Process Infographic Template for PowerPoint & Google Slides
Employee Performance
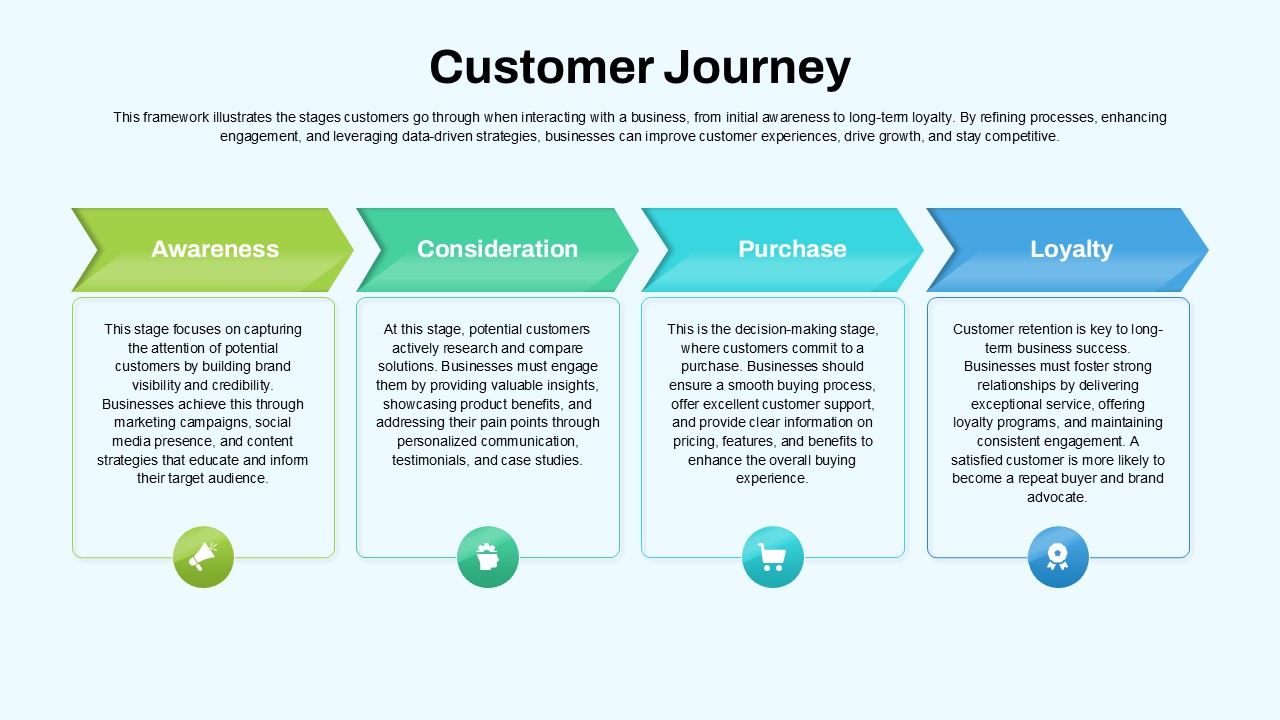
Customer Journey Process Map Infographic Template for PowerPoint & Google Slides
Customer Journey
Mortgage Process Infographic Template for PowerPoint & Google Slides
Finance
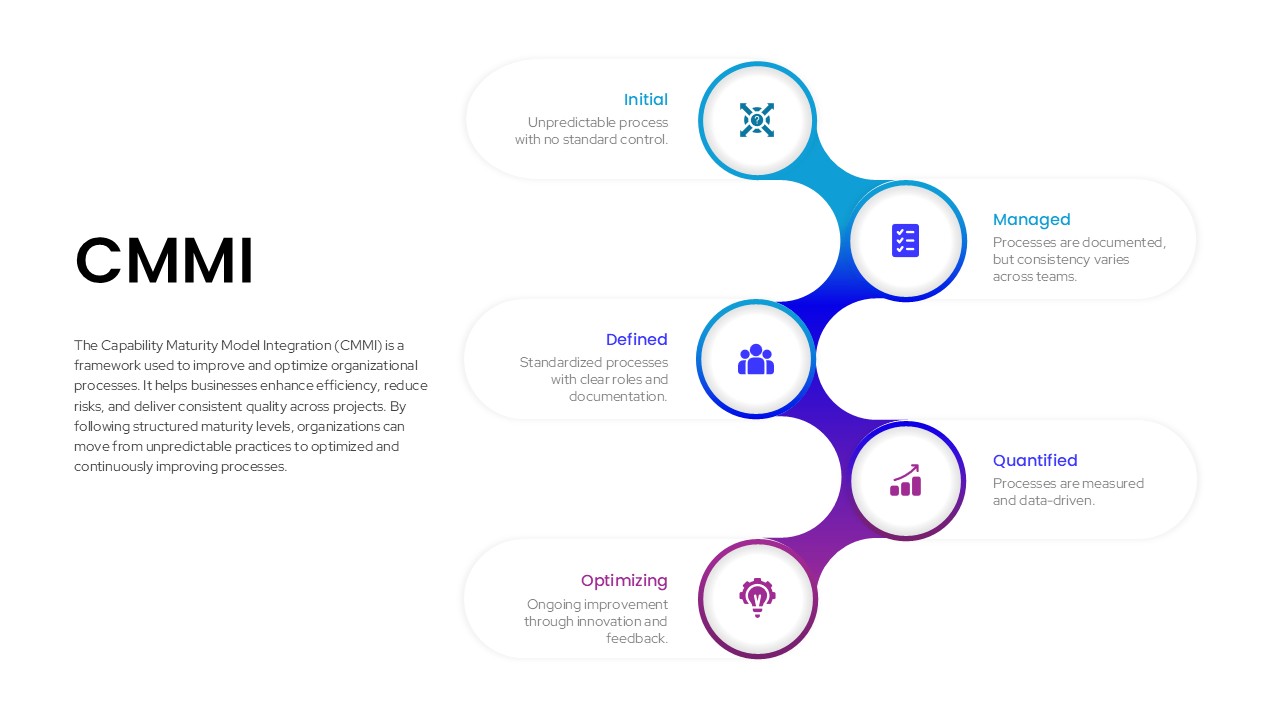
CMMI Process Maturity Model Infographic Template for PowerPoint & Google Slides
Process