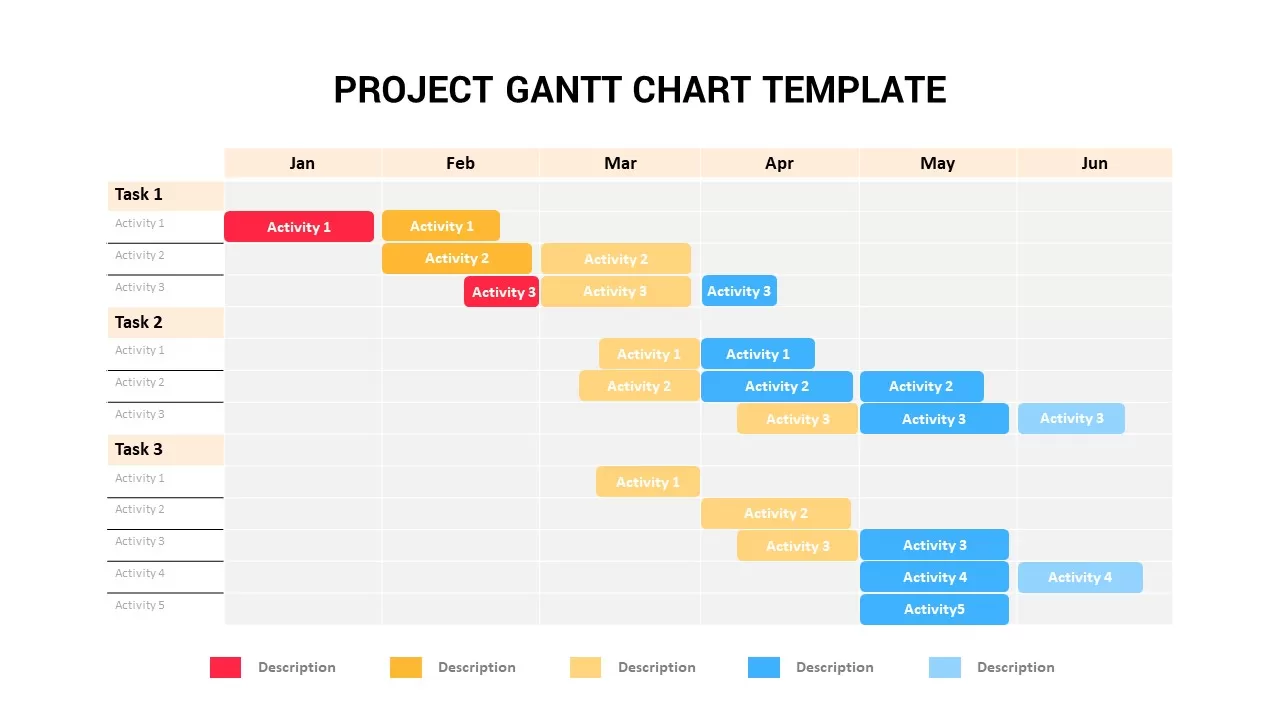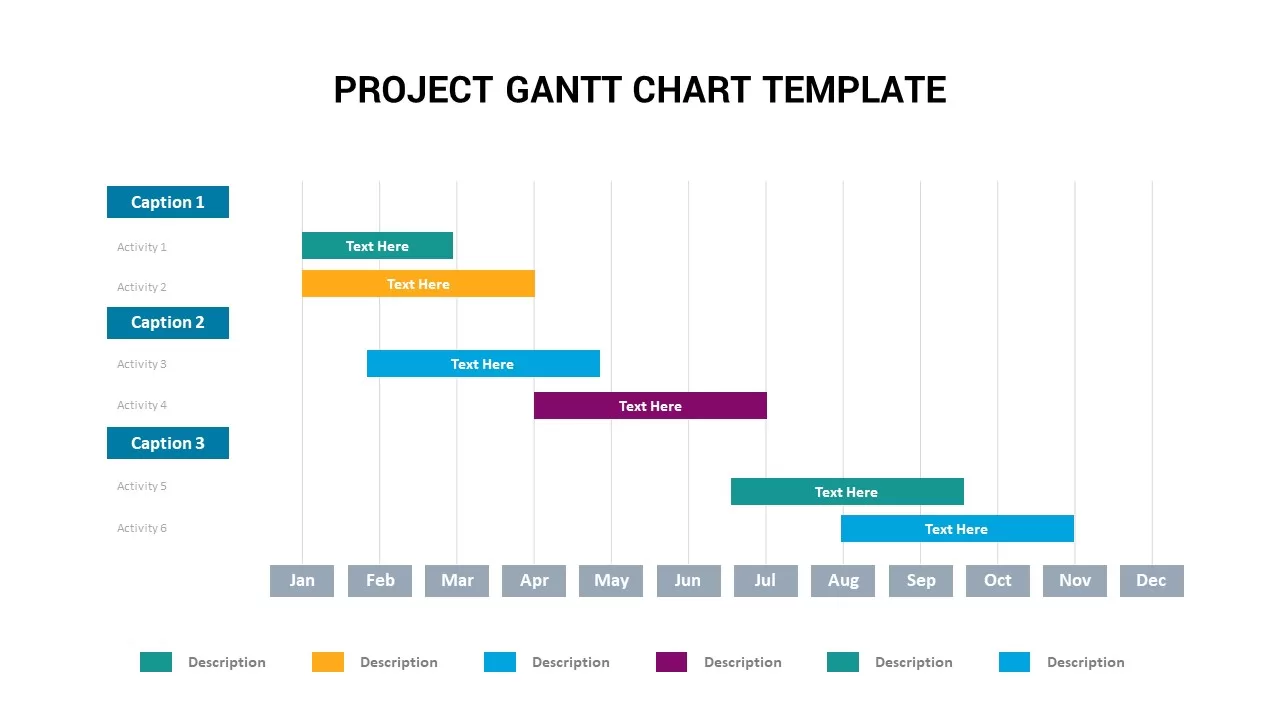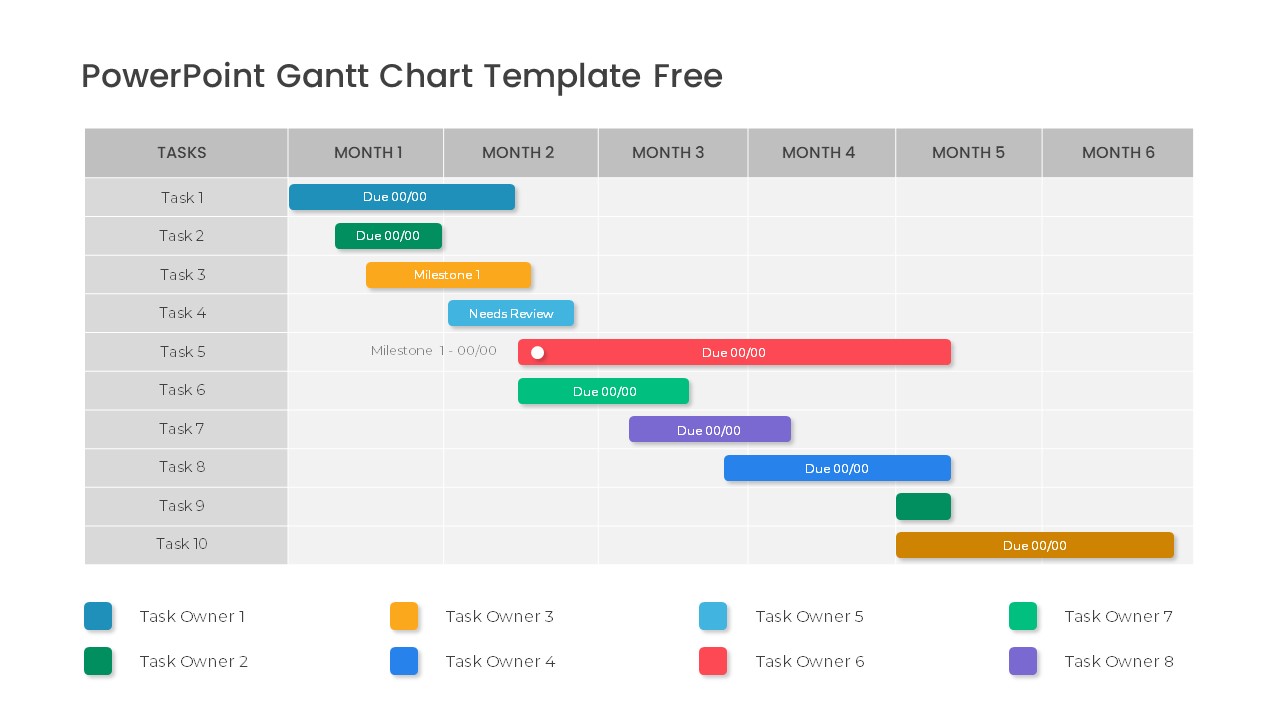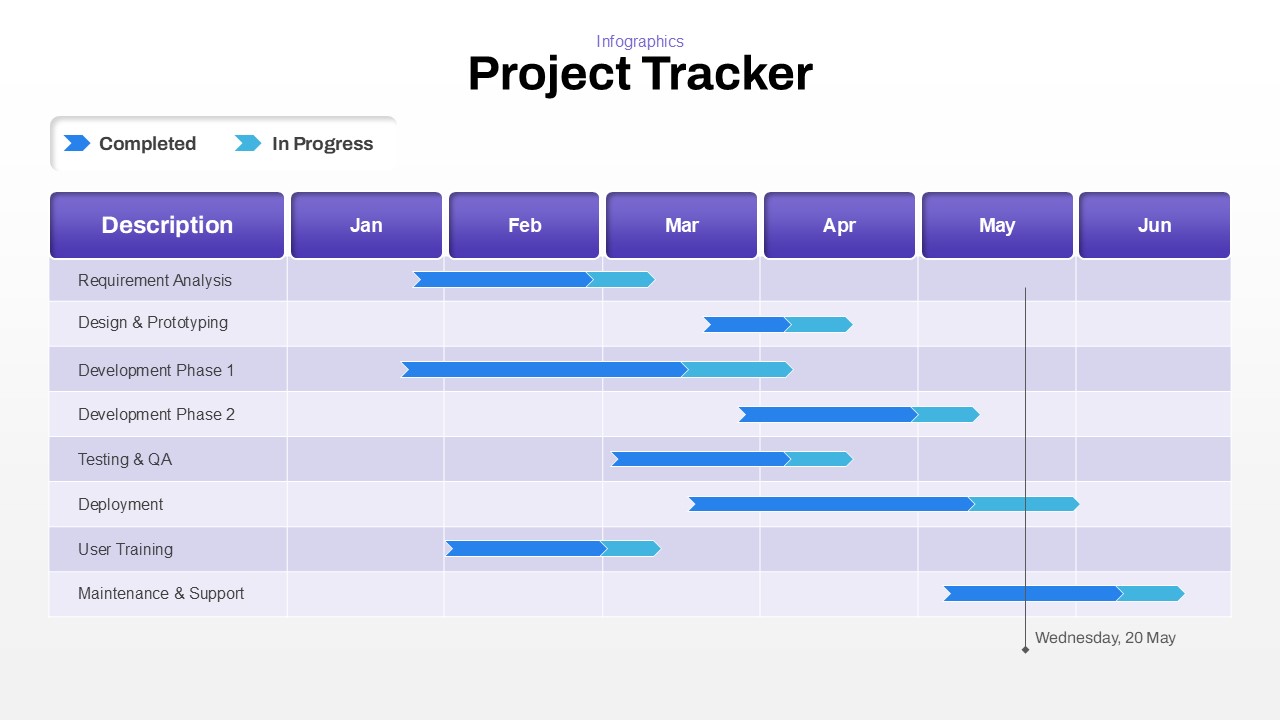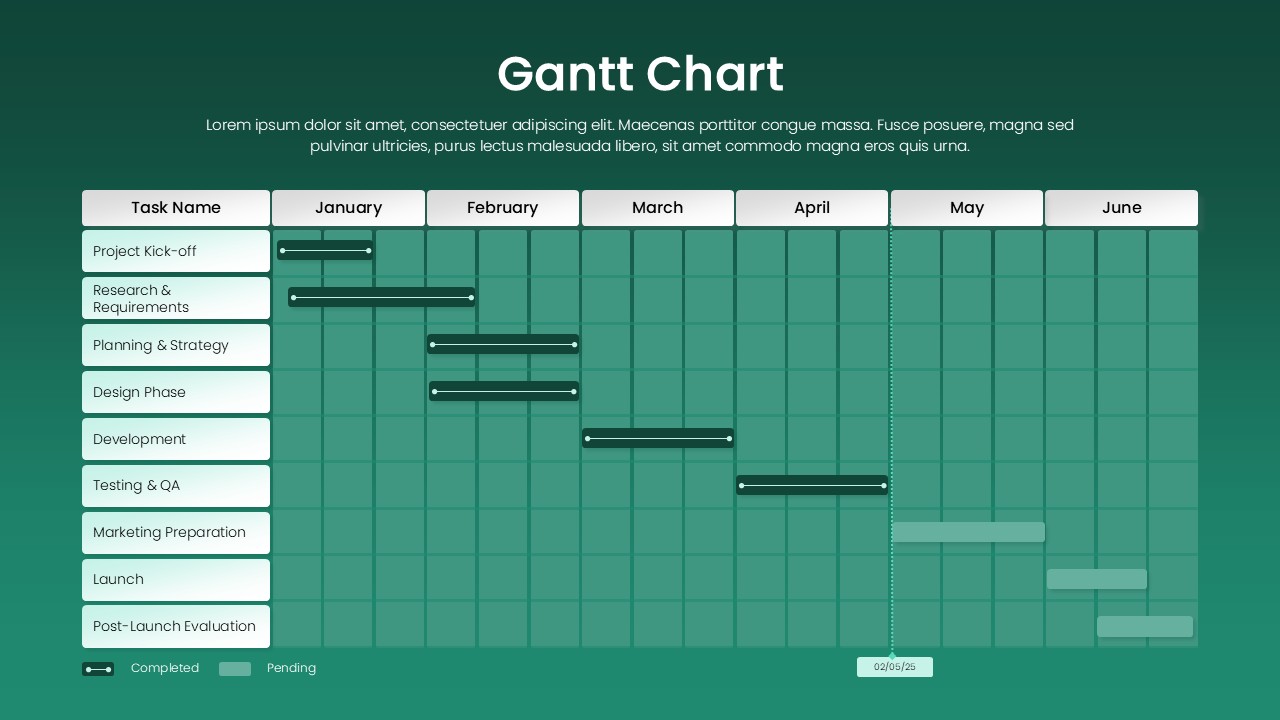










Half Year Gantt Chart PowerPoint Template
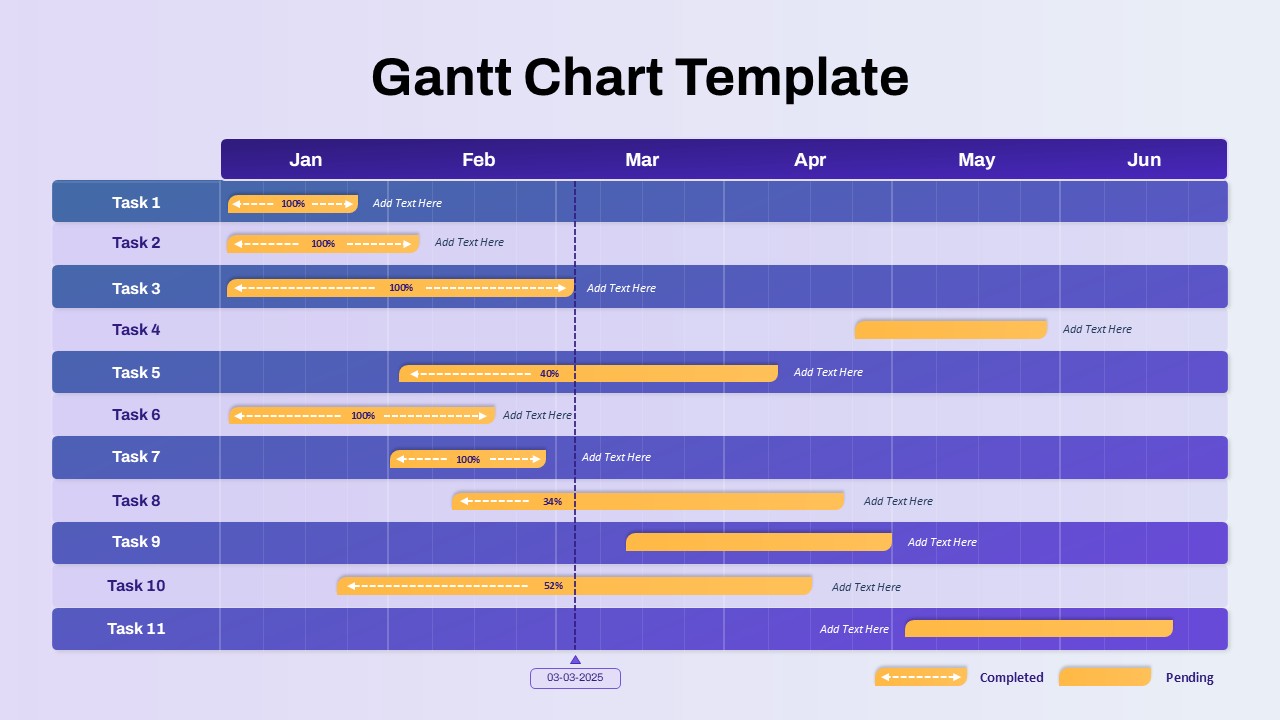


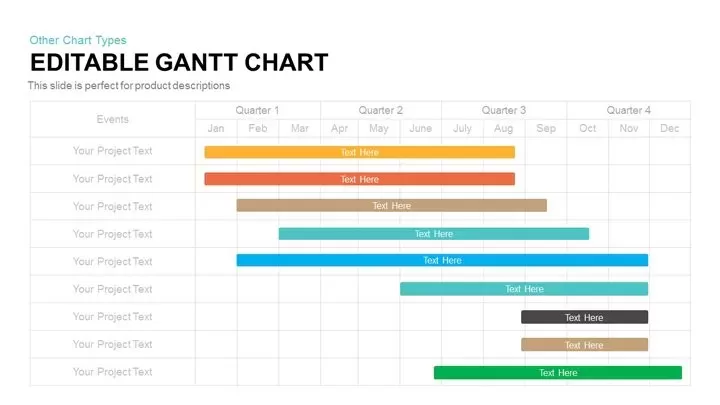
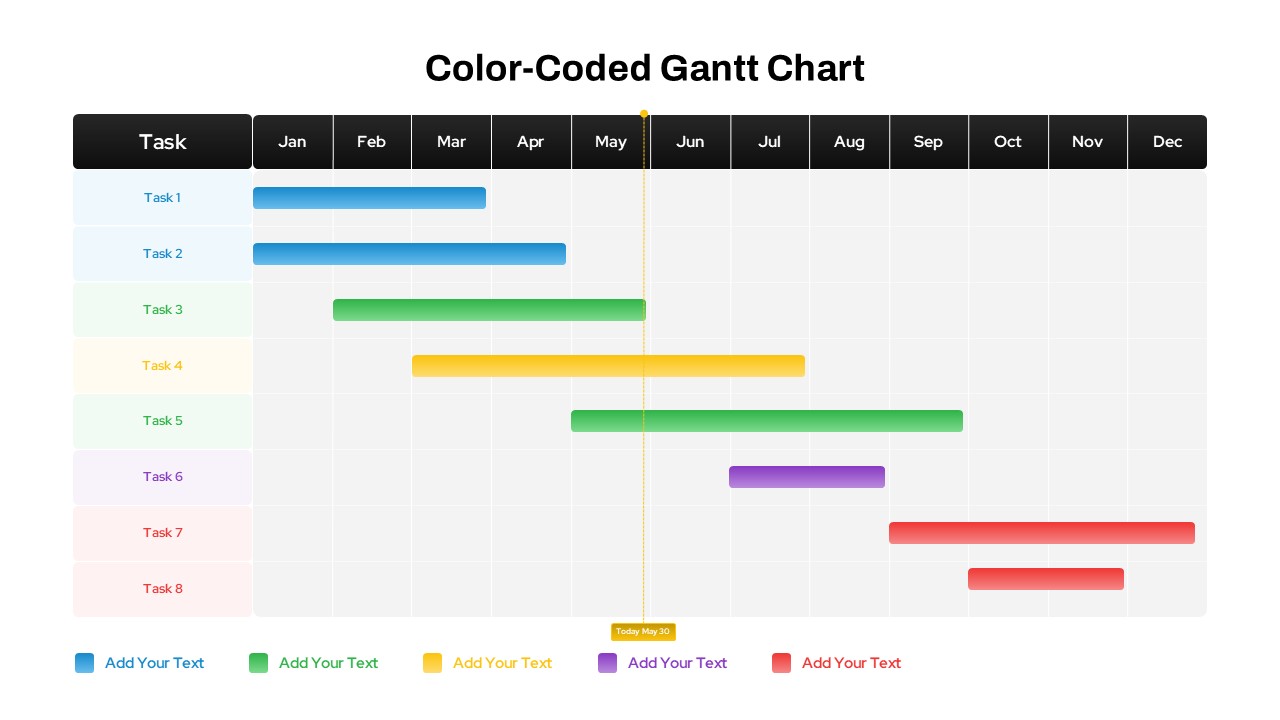
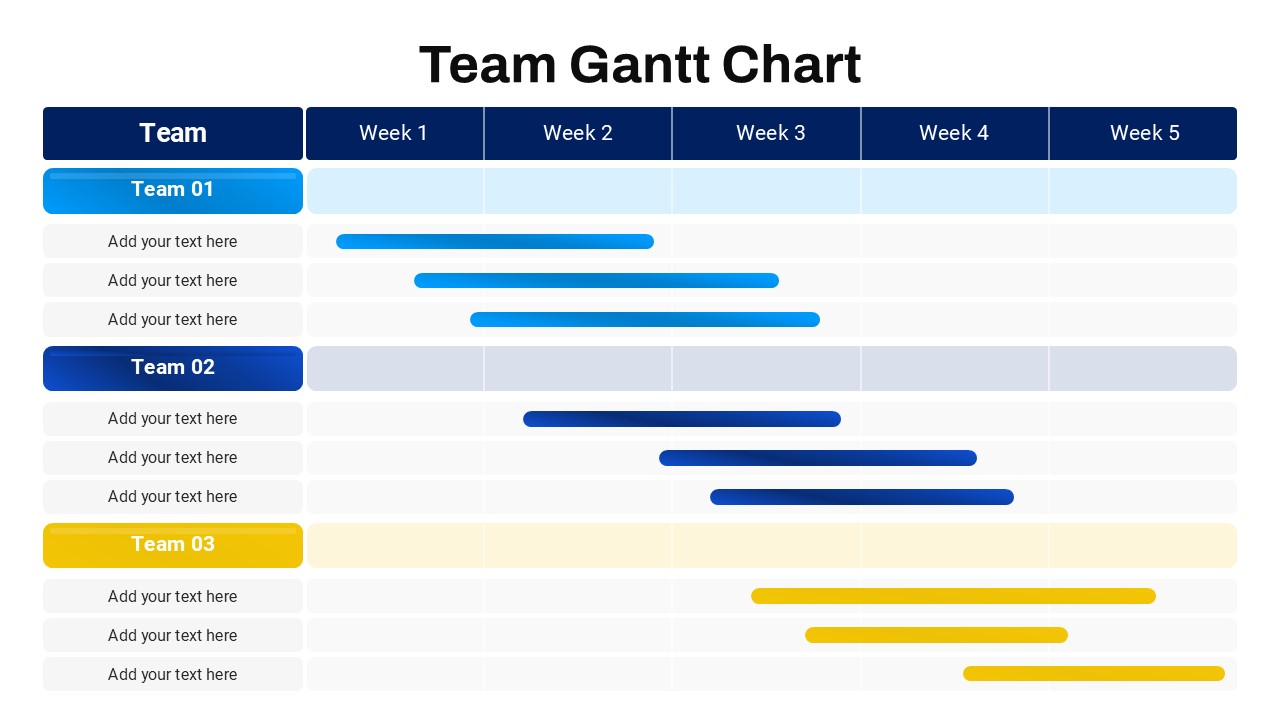
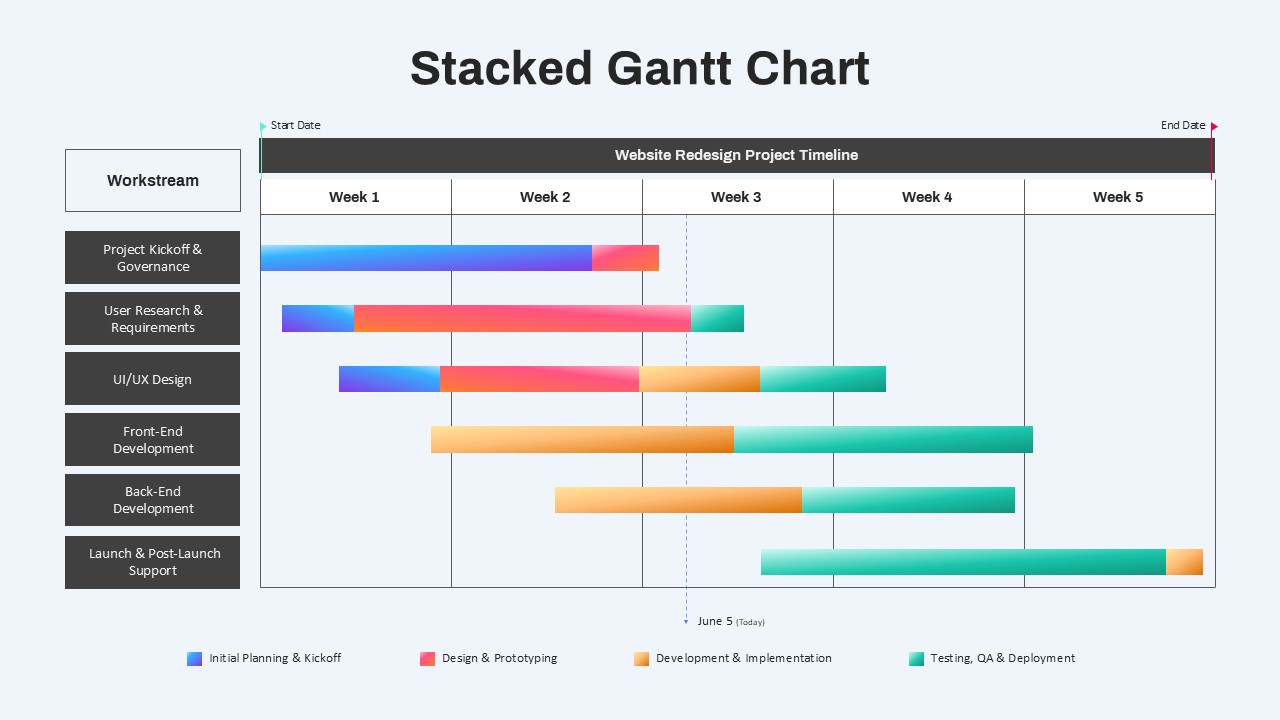
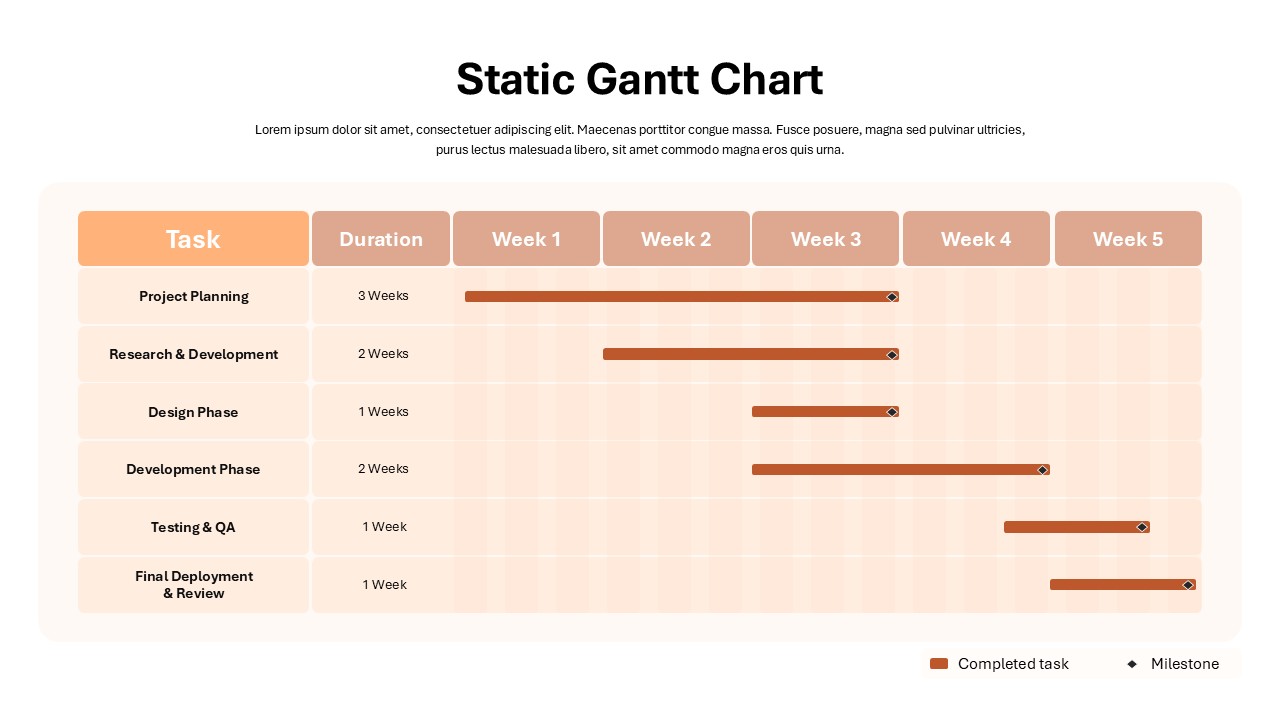
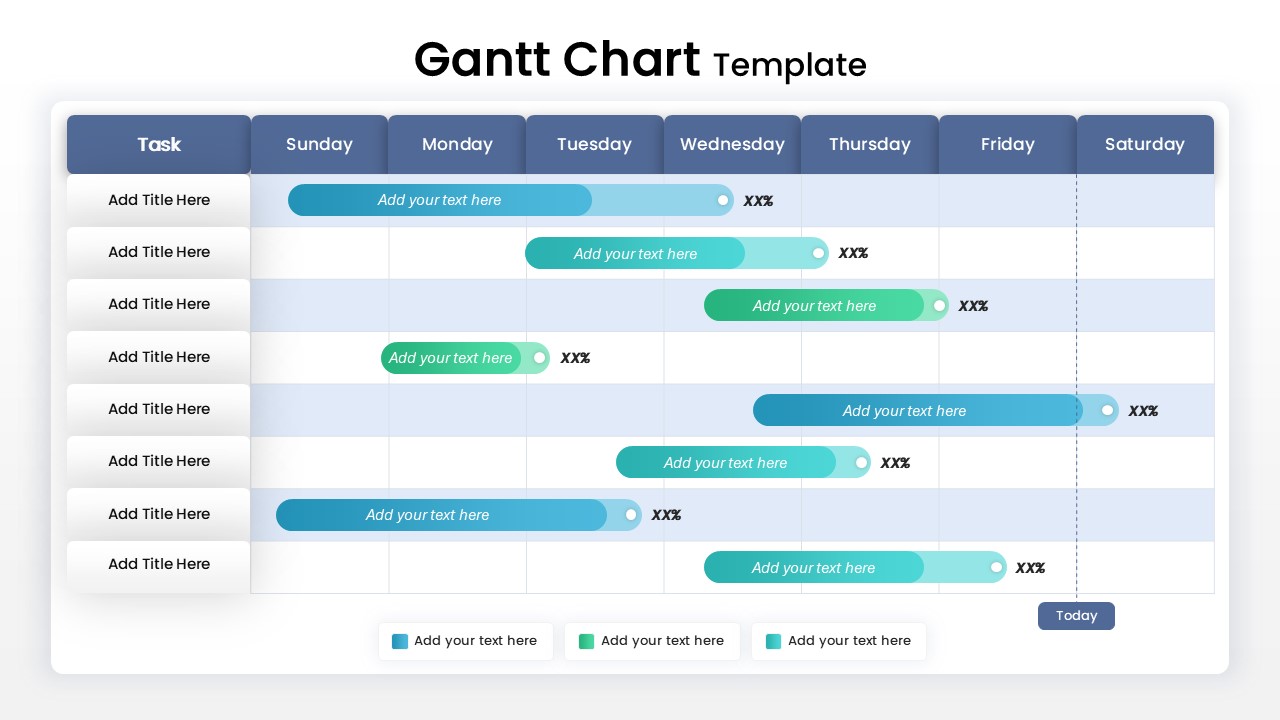
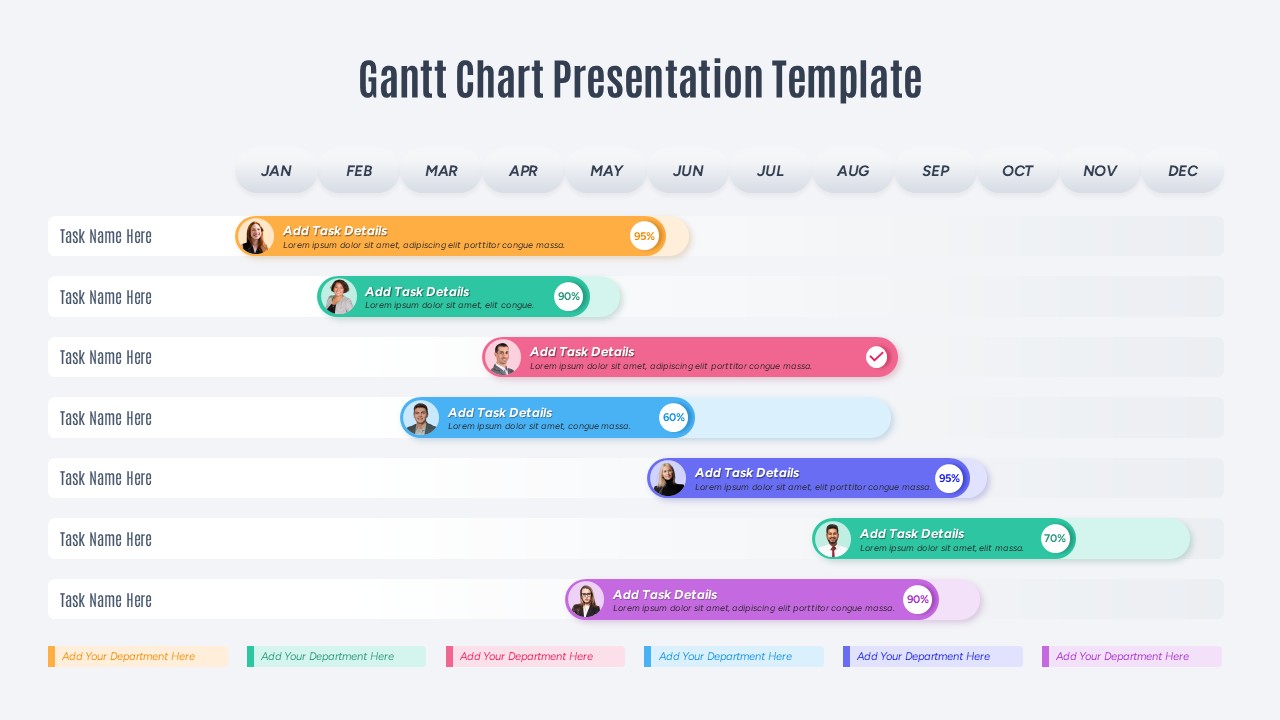
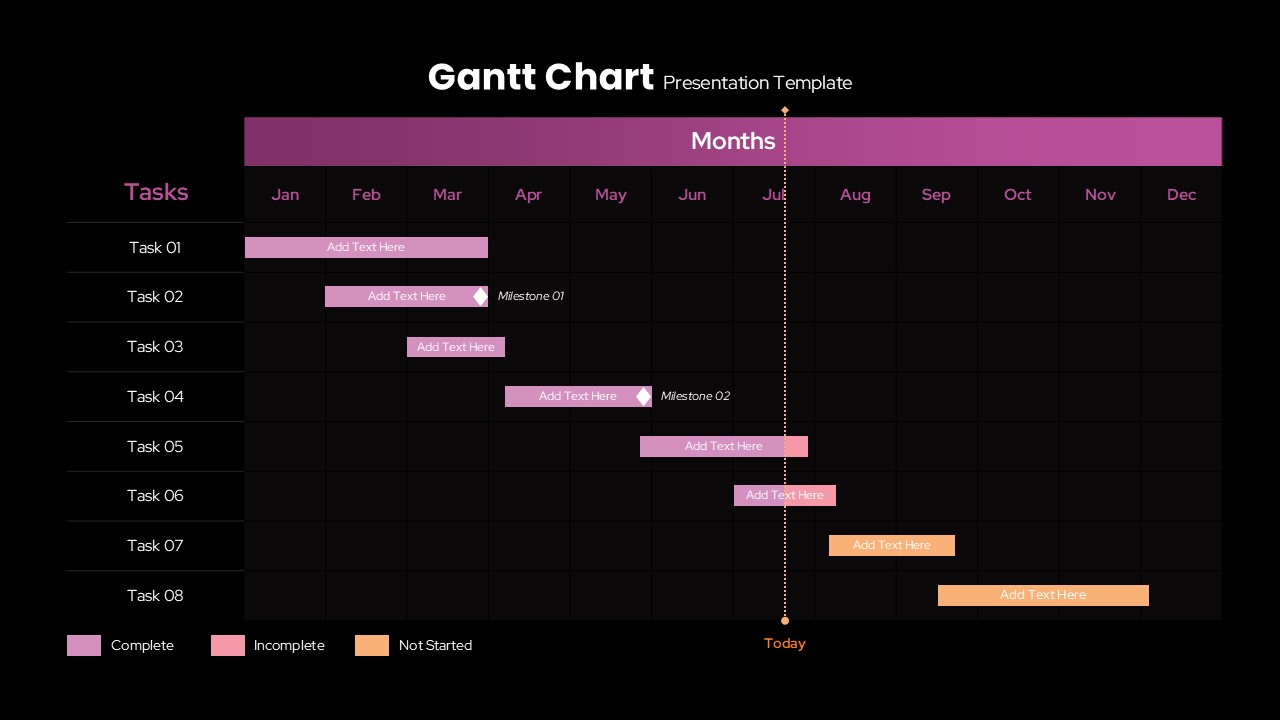
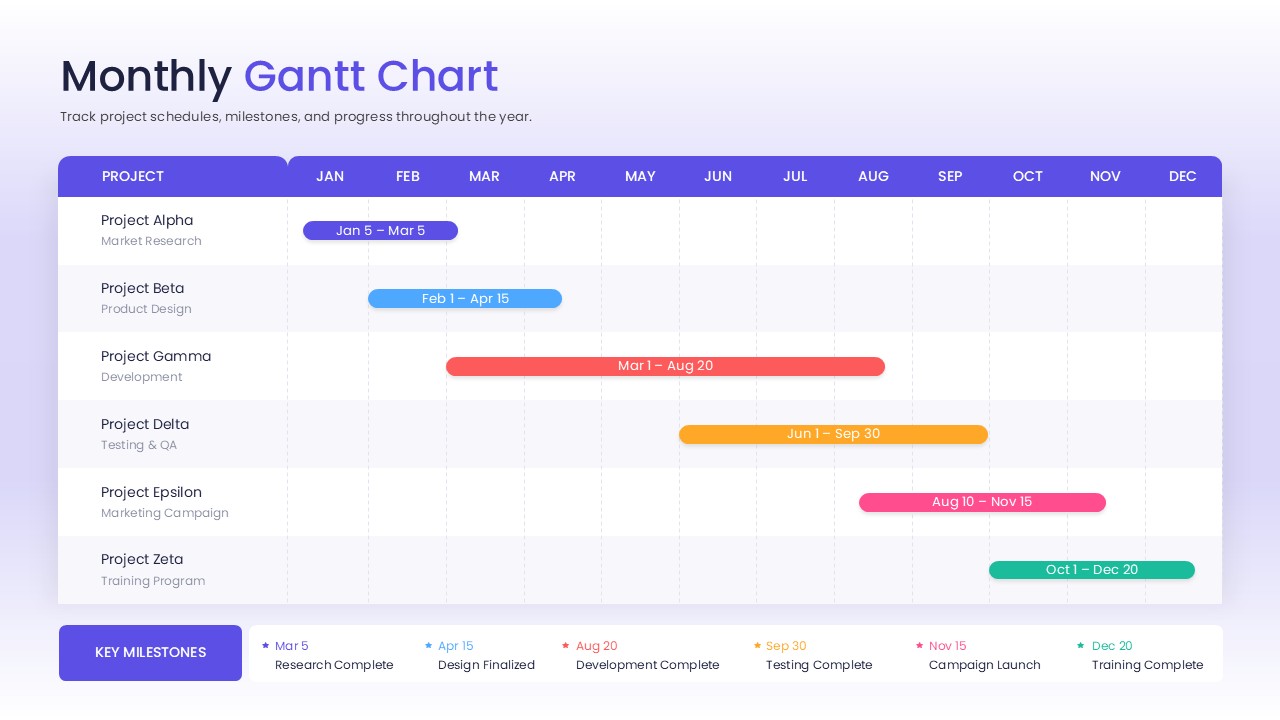
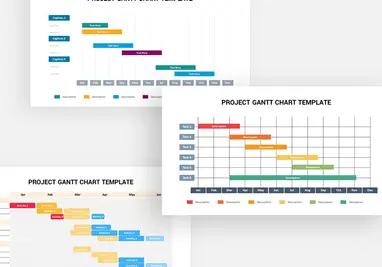
Track project schedules, task progress, and deadlines with this Colorful Gantt Chart Template. The timeline-based layout maps tasks from January to June, using progress bars and percentage indicators to show completed and ongoing work. A current-date marker provides a quick reference for monitoring whether activities are on schedule.
Key Features
- Six-month project timeline
- Editable task rows and progress bars
- Percentage indicators for completed work
- Visual distinction between completed and pending tasks
- Current-date marker for schedule tracking
- Customizable colors, text, dates, and shapes
- Suitable for PowerPoint and Google Slides
The Colorful Gantt Chart Template is ideal for project managers, team leaders, PMO professionals, consultants, and business teams. Use it for project planning, product launches, event schedules, marketing campaigns, Agile sprints, HR onboarding, academic projects, and weekly or quarterly progress reviews.
Login to download this file

Item ID
SB05442Designed By
Naseeba


Related Templates

Year-over-Year Performance Comparison Template
Comparison Chart
Creative Dynamic Gantt Chart Timeline Template for PowerPoint & Google Slides
Timeline

Gantt Chart PowerPoint Template
Gantt Chart

Product Roadmap Gantt Chart Timeline template for PowerPoint & Google Slides
Gantt Chart
Project Gantt Chart Template PowerPoint & Google Slides
Gantt Chart
Project Gantt Chart Infographics PowerPoint Template
Gantt Chart
Free Professional Gantt Chart Pack – 4 Slides Template for PowerPoint & Google Slides
Gantt Chart
Free
Project Tracker Timeline Gantt Chart Template for PowerPoint & Google Slides
Project Status
Color Coded Gantt Chart for PowerPoint and Google Slides
Business
Team Gantt Chart PowerPoint Template
Project Status
Stacked Gantt Chart PowerPoint Template
Gantt Chart
Static Gantt Chart Overview template for PowerPoint & Google Slides
Project Status
Bar Gantt Chart PowerPoint Template
Gantt Chart
Project Gantt Chart Template for PowerPoint & Google Slides
Gantt Chart
6 Month Gantt Chart Template for PowerPoint
Gantt Chart
Project Gantt Chart PowerPoint Template
Gantt Chart
Weekly Gantt Chart with Milestones Template for PowerPoint & Google Slides
Gantt Chart
Gantt Chart with Presentation Template for PPT
Gantt Chart
Colorful Annual Gantt Chart Timeline Template for PPT & Google Slides Themes
Gantt Chart
Monthly Gantt Chart PowerPoint Template
Timeline