Population Infographic Template for PowerPoint & Google Slides

Description
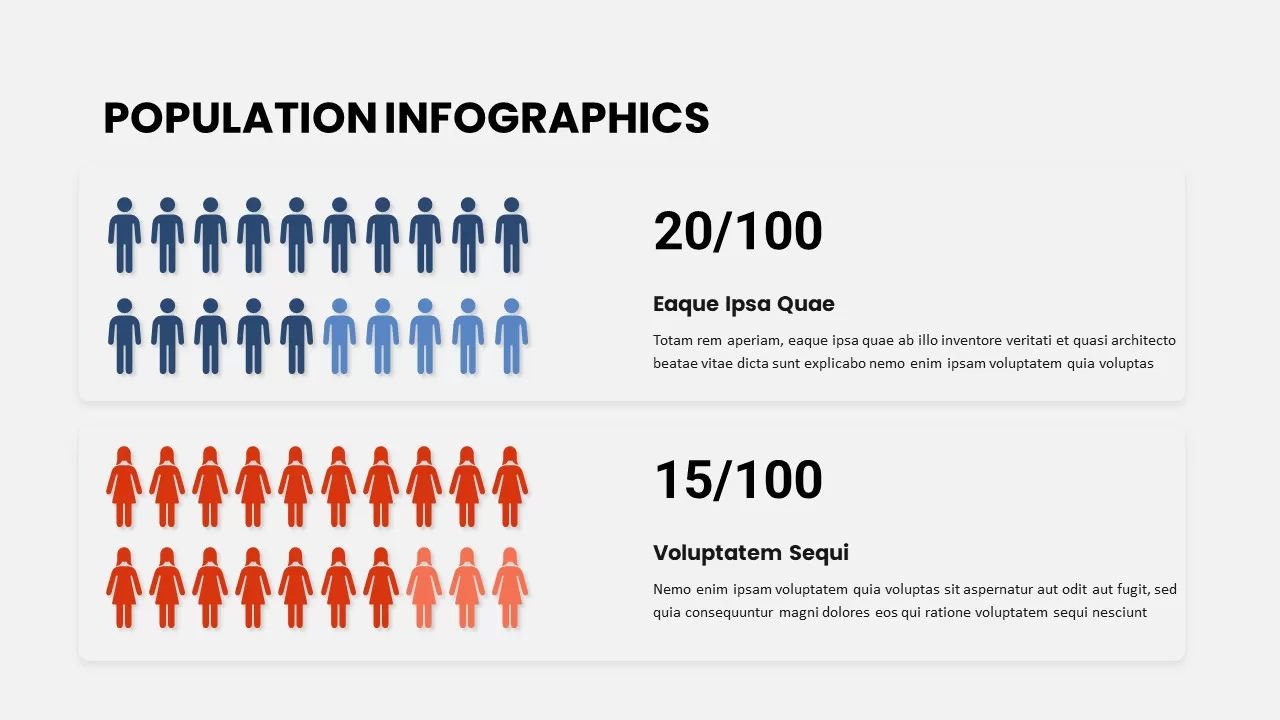
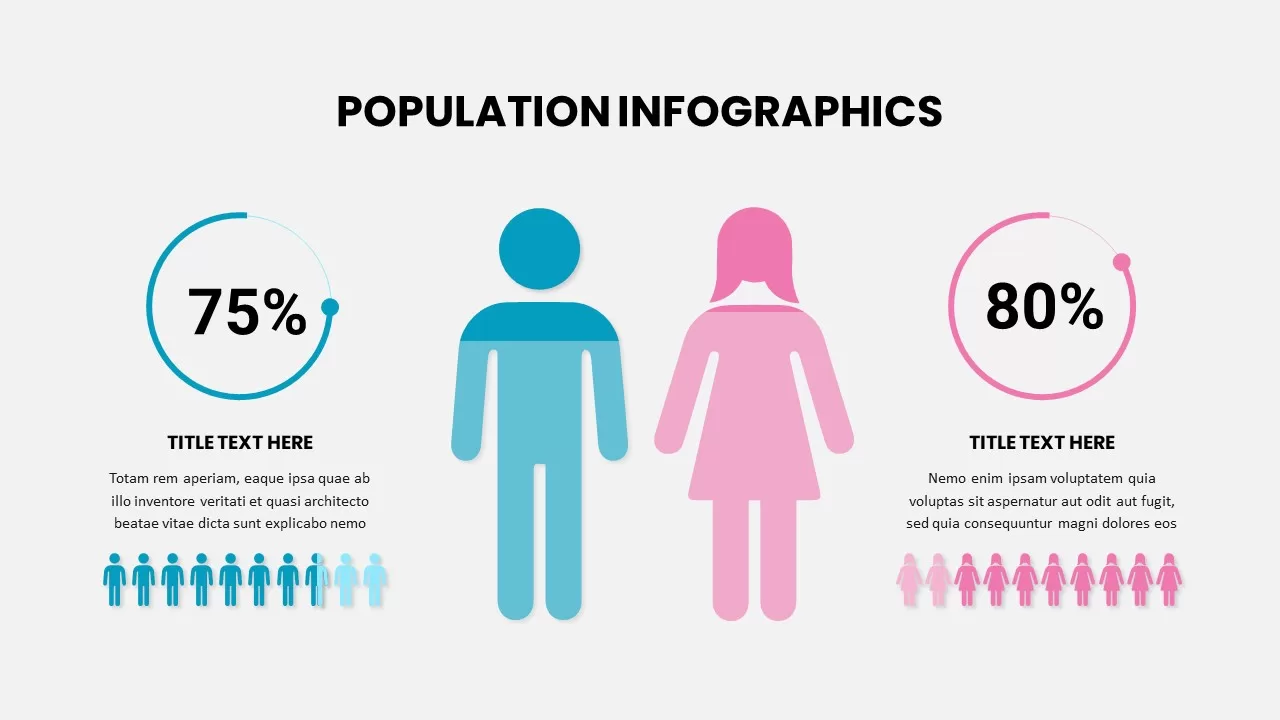
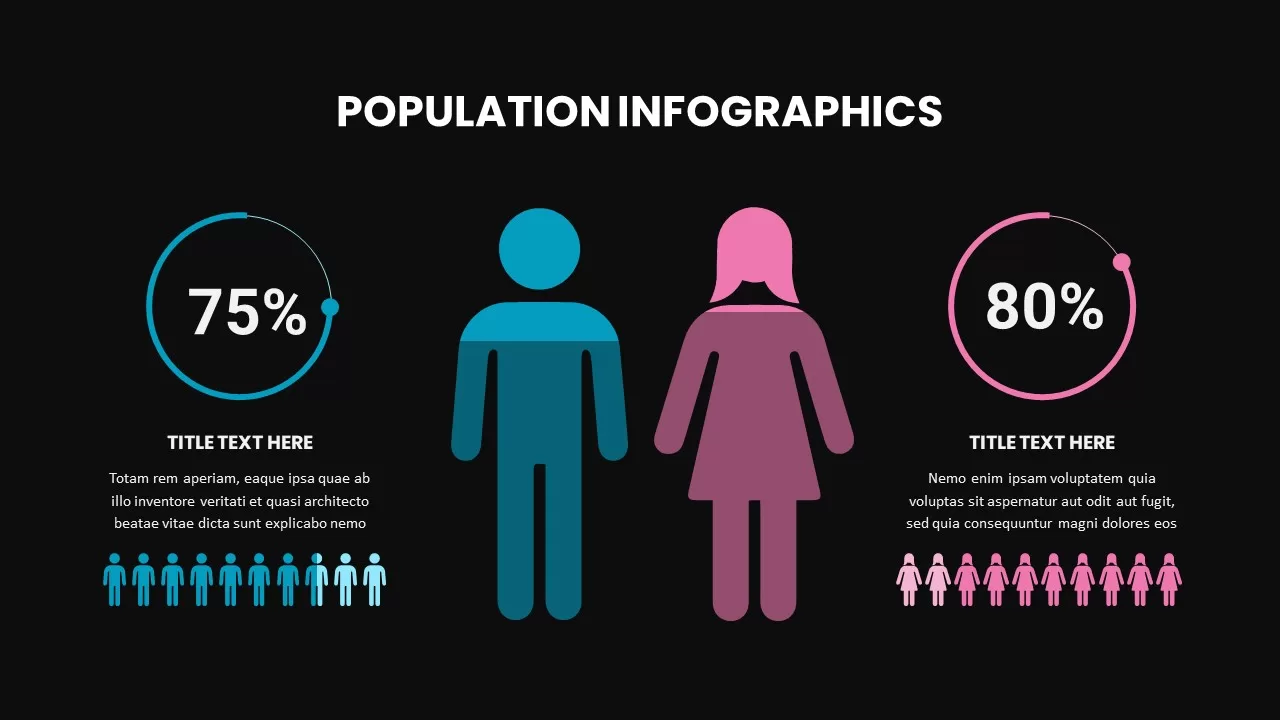
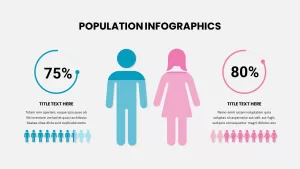
Leverage this dynamic population infographic to present gender distribution with clarity and visual impact. Two side-by-side donut charts, one in vibrant teal and the other in soft pink, illustrate customizable percentage values (default at 75% and 80%) above each icon row. Beneath the circular progress indicators, a linear array of male and female silhouettes highlights proportional ratios in a straightforward icon-based format. Centered between the charts, large stylized male and female figures reinforce demographic focus and create a balanced composition that effortlessly guides viewer attention. The clean, modern aesthetic—featuring crisp typography, minimalist icons, and ample white space—ensures legibility across devices and screen sizes.
Optimized for both PowerPoint and Google Slides, this fully editable template employs master slides, vector shapes, and easy-to-use placeholders for quick updates. Simply adjust the donut fills to reflect real-time data, swap colors to match corporate branding, or modify icon sets to represent additional categories. Ideal for HR reports, marketing analyses, academic presentations, and stakeholder briefings, this slide streamlines demographic comparisons and supports data-driven storytelling. Whether you’re showcasing survey results, workforce composition, or audience segmentation, this adaptable layout enhances communication efficiency and elevates your presentation’s professional polish.
Beyond gender breakdowns, this versatile slide supports any demographic or segmented data visualization—whether age cohorts, regional distributions, or product adoption rates. Replace silhouette icons with custom shapes or industry-specific symbols to tailor the slide to your niche. Built-in animation placeholders and transition-friendly objects let you animate chart fills and icons for engaging storytelling, while locked grid guidelines maintain design consistency. Leverage this asset in board presentations, investor updates, educational workshops, or community outreach programs to illustrate key statistics with professionalism and ease.
Who is it for
Marketing analysts, HR managers, and business consultants will appreciate this slide for communicating workforce demographics and market segmentation. Researchers, educators, and non-profit professionals can also leverage the clear icon-based design to present survey findings, audience profiles, and program evaluation data.
Other Uses
Beyond gender metrics, repurpose this template to illustrate age cohorts, regional distributions, sales performance segments, or customer satisfaction rates. Simply swap icons and adjust chart values for healthcare presentations, educational reports, NGO outreach, or investor pitch decks, making complex data immediately comprehensible.
Login to download this file

Item ID
SB02631
Related Templates

Interactive US Population Data Map Slide Template for PowerPoint & Google Slides
World Maps
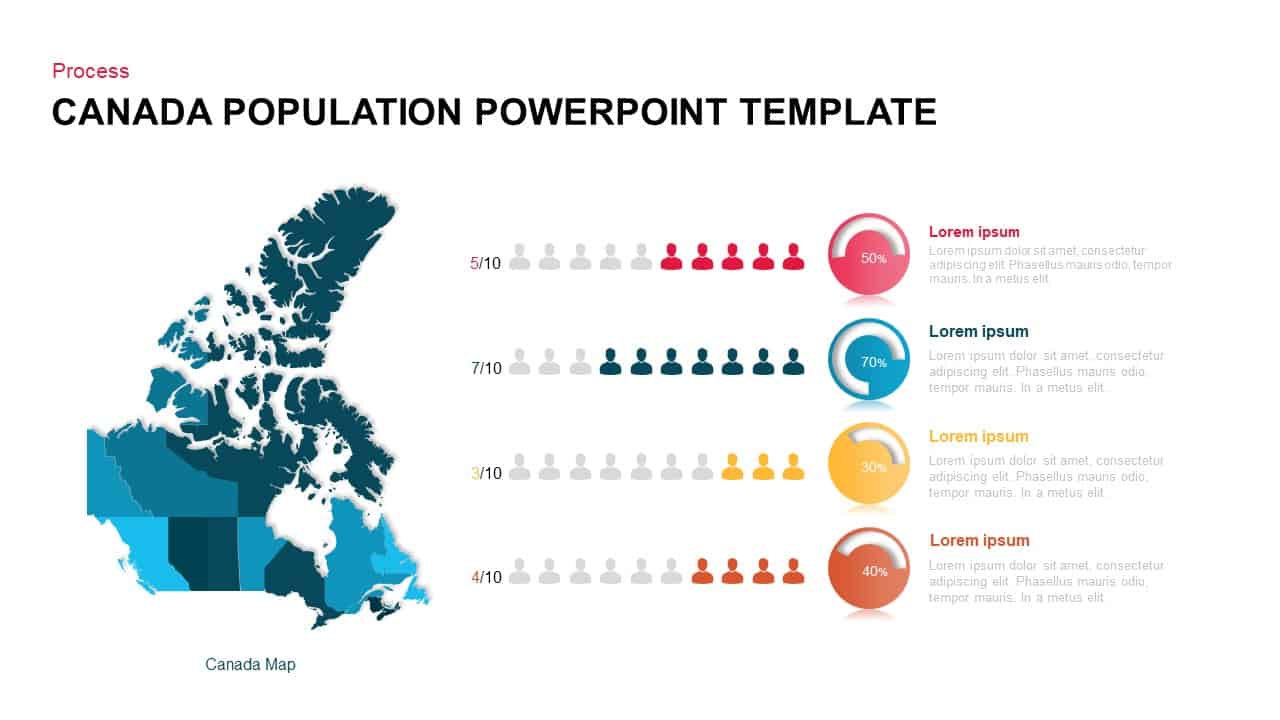
Canada Population Infographics Template for PowerPoint & Google Slides
World Maps
Global Population Demographics & Map Template for PowerPoint & Google Slides
Bar/Column
Population Infographics template for PowerPoint & Google Slides
Comparison
Population Pyramid Chart Analysis Template for PowerPoint & Google Slides
Bar/Column
Population Age Distribution Pyramid Chart Template for PowerPoint & Google Slides
Pyramid
Google Ads Optimization & Performance Infographic Template for PowerPoint & Google Slides
Digital Marketing
SQ3R Study Strategy Infographic Slides Template for PowerPoint & Google Slides
Business Strategy
Six Double Diamond Infographic Slides Template for PowerPoint & Google Slides
Process

Sales Process Infographic Slides Pack Template for PowerPoint & Google Slides
Process
Casino/Poker Chips Infographic Slides template for PowerPoint & Google Slides
Business Strategy
Agenda Infographic Pack of 2 Slides Template for PowerPoint & Google Slides
Agenda
Quad Chart Infographic Pack of 8 Slides Template for PowerPoint & Google Slides
Comparison Chart
Four Options Infographic Slides Template for PowerPoint & Google Slides
Comparison
Game Plan Infographic Slides Pack Template for PowerPoint & Google Slides
Infographics
Teamwork PowerPoint Infographic Template for PowerPoint & Google Slides
Leadership
Kite Infographic PowerPoint Template for PowerPoint & Google Slides
Process
Cladogram Infographic Di Template for PowerPoint & Google Slides Template
Decision Tree
Workflow PowerPoint Process infographic for PowerPoint & Google Slides
Process
Free Infographic Deck PowerPoint Pack for PowerPoint & Google Slides
Infographics
Free
Different Directional Arrow Infographic Template for PowerPoint & Google Slides
Arrow
Eight Section Lab Infographic with Icons Template for PowerPoint & Google Slides
Circular
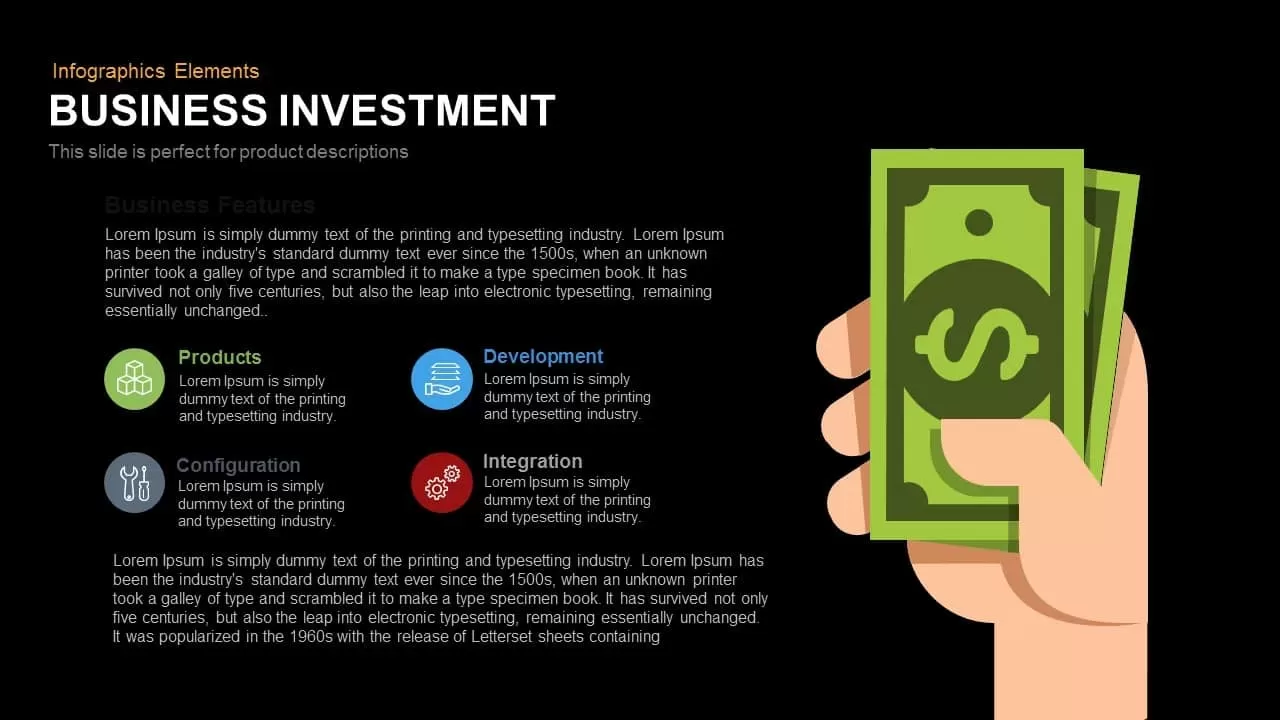
Business Investment Features Infographic Template for PowerPoint & Google Slides
Finance
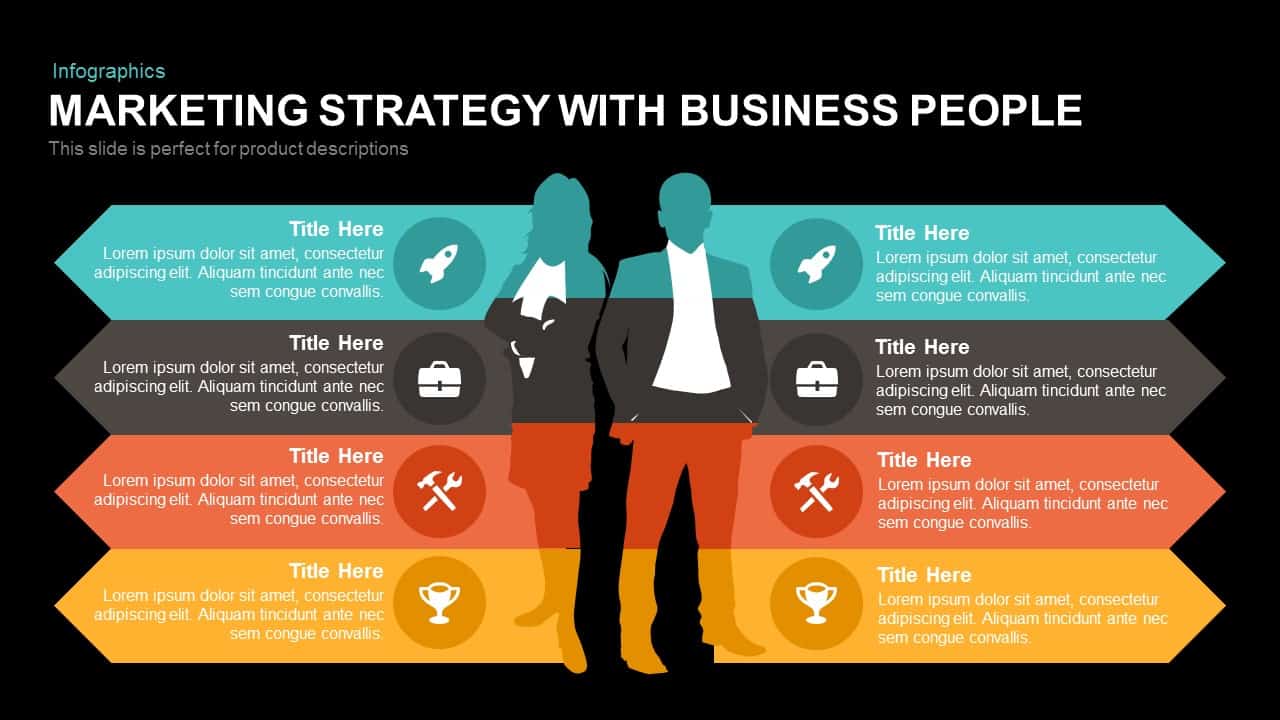
Marketing Strategy Arrow Infographic Template for PowerPoint & Google Slides
Comparison

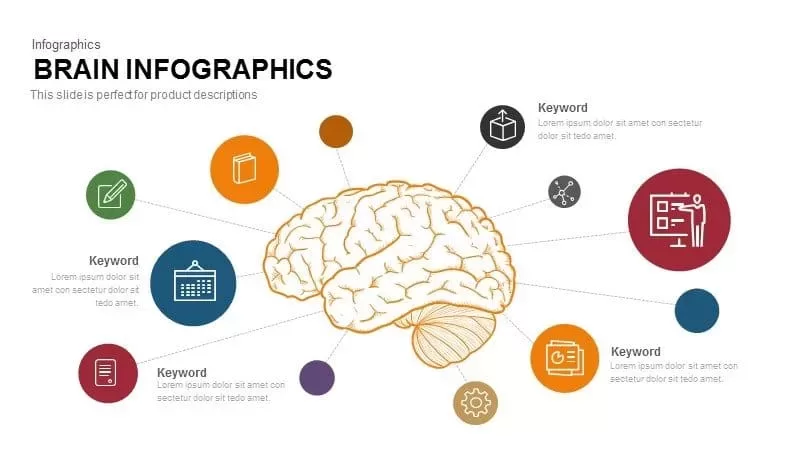
Brain Hub-and-Spoke Infographic template for PowerPoint & Google Slides
Org Chart

A/B Testing Comparison Infographic template for PowerPoint & Google Slides
Comparison
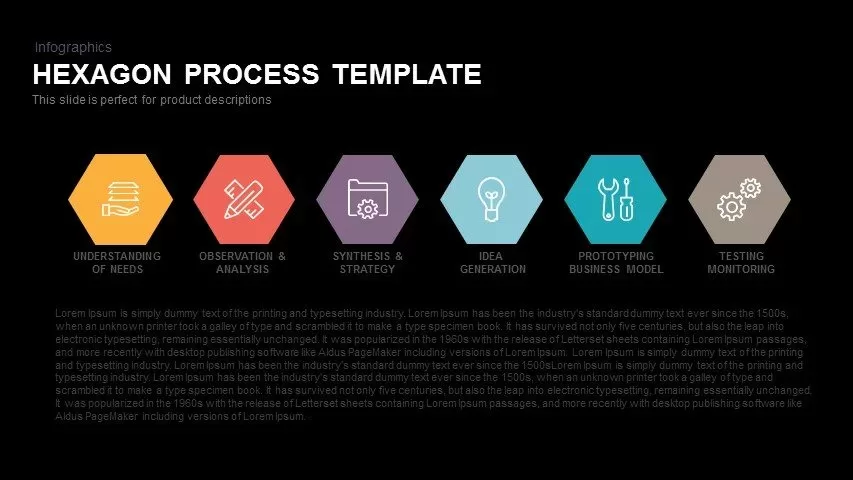
Hexagon Process Infographic Template for PowerPoint & Google Slides
Process
Cause and Effect Diagram Infographic Template for PowerPoint & Google Slides
Bar/Column

Direction Signpost Infographic Template for PowerPoint & Google Slides
Arrow
Four-Tag Section Ribbon Infographic Template for PowerPoint & Google Slides
Comparison
Colorful Four-Stage Infographic Process Template for PowerPoint & Google Slides
Process
North Korea Map with Provinces Infographic Pack Template for PowerPoint & Google Slides
Maps
Timeline Infographic Design Seven Stage template for PowerPoint & Google Slides
Timeline
Five-Stage Growth Arrow Infographic Template for PowerPoint & Google Slides
Arrow

Timeline Roadmap Milestones Infographic Template for PowerPoint & Google Slides
Roadmap

Multi-Cluster Mind Map Infographic Template for PowerPoint & Google Slides
Mind Maps
Logistics Truck Illustration Infographic Template for PowerPoint & Google Slides
Process
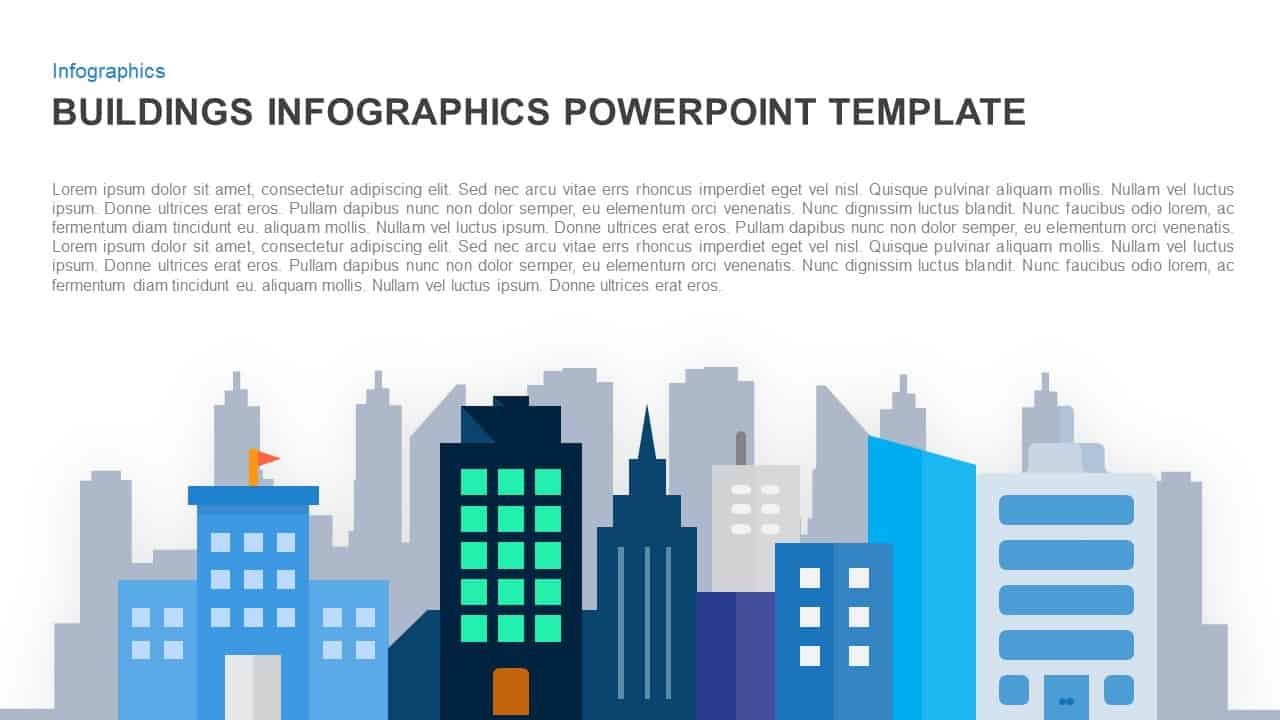
Urban Skyline Buildings Infographic Template for PowerPoint & Google Slides
Infographics
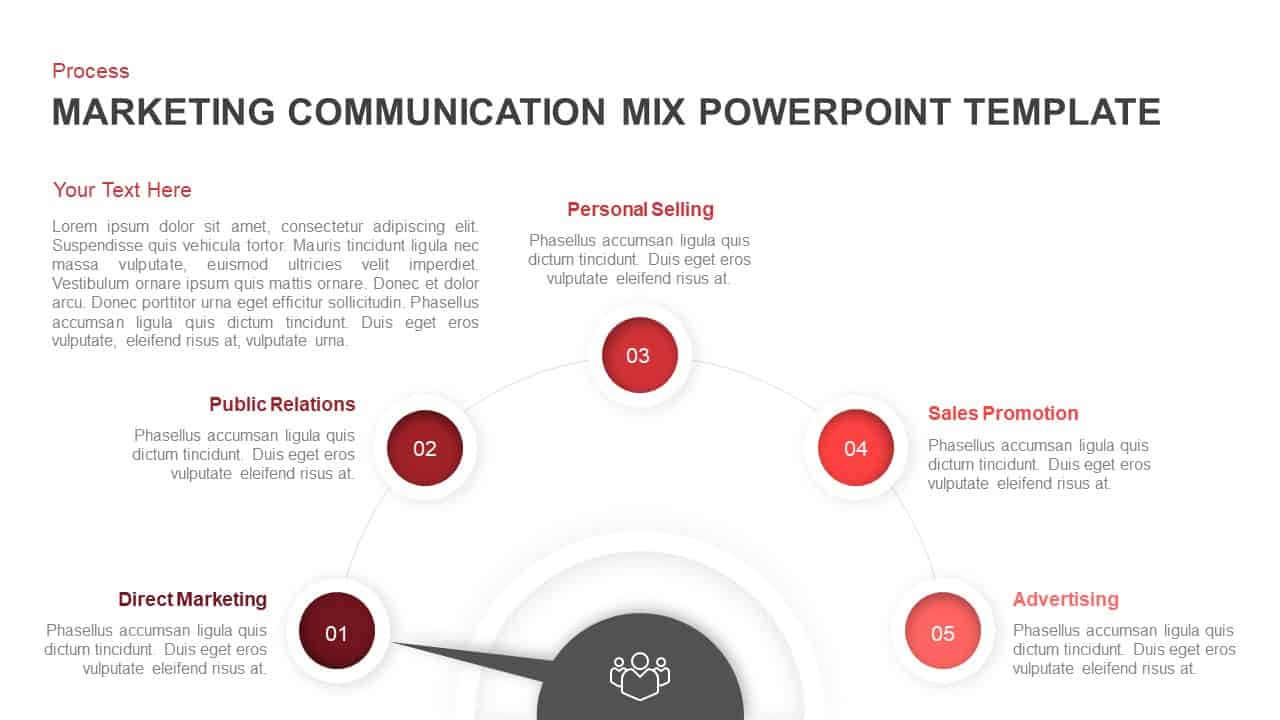
Marketing Communication Mix Infographic Template for PowerPoint & Google Slides
Marketing
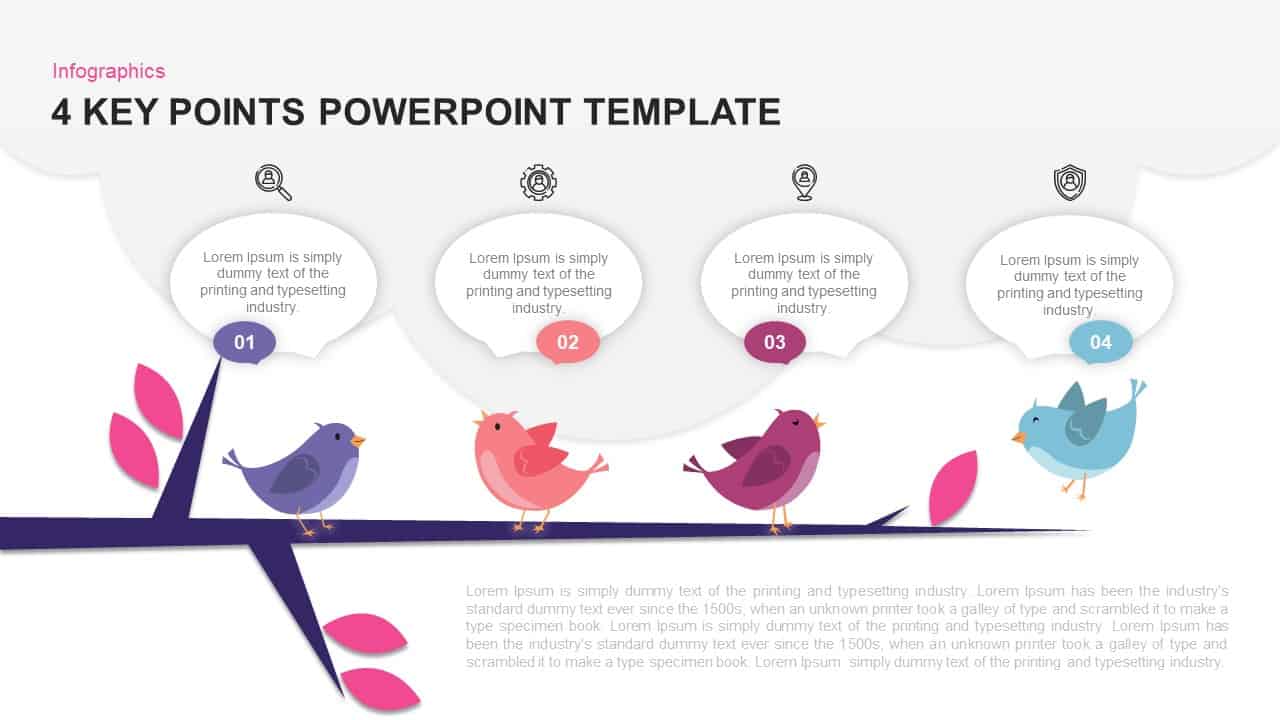
Bird Branch Four Key Points Infographic Template for PowerPoint & Google Slides
Agenda
Plant Growth Lifecycle Infographic Template for PowerPoint & Google Slides
Process
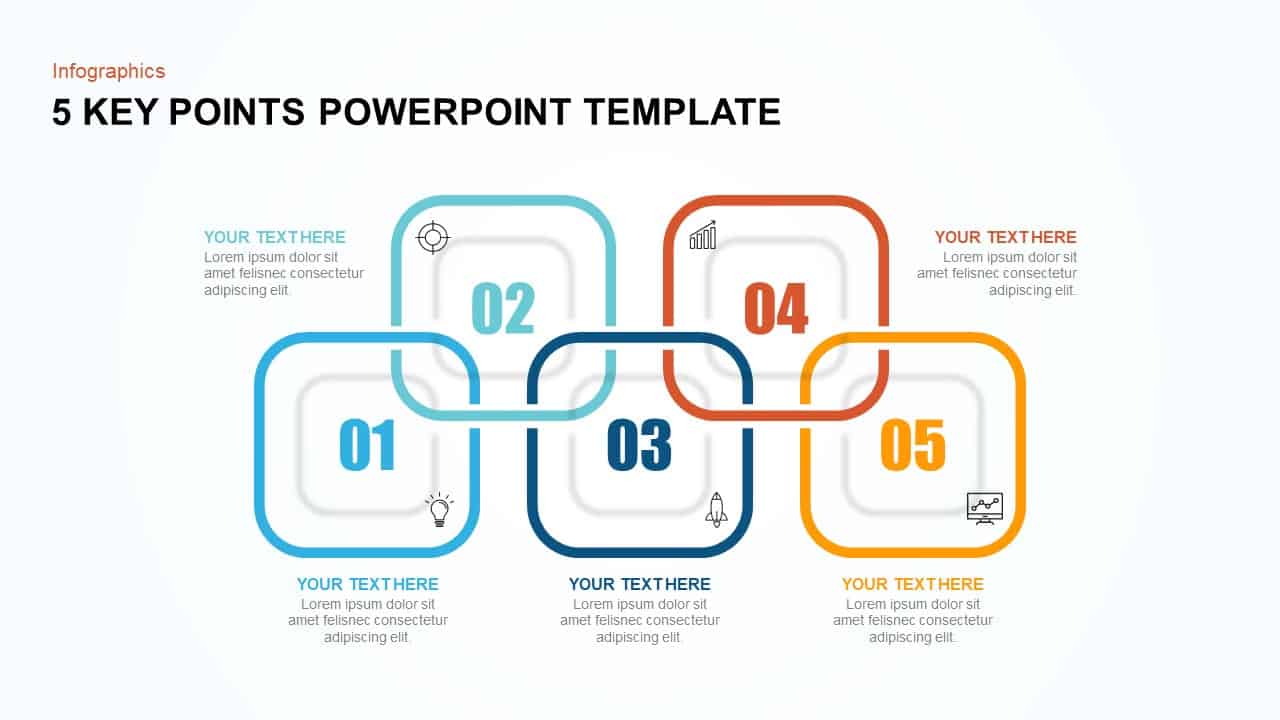
5 Key Points Infographic Diagram Template for PowerPoint & Google Slides
Process
Circular Three-Step Infographic Diagram Template for PowerPoint & Google Slides
Circular
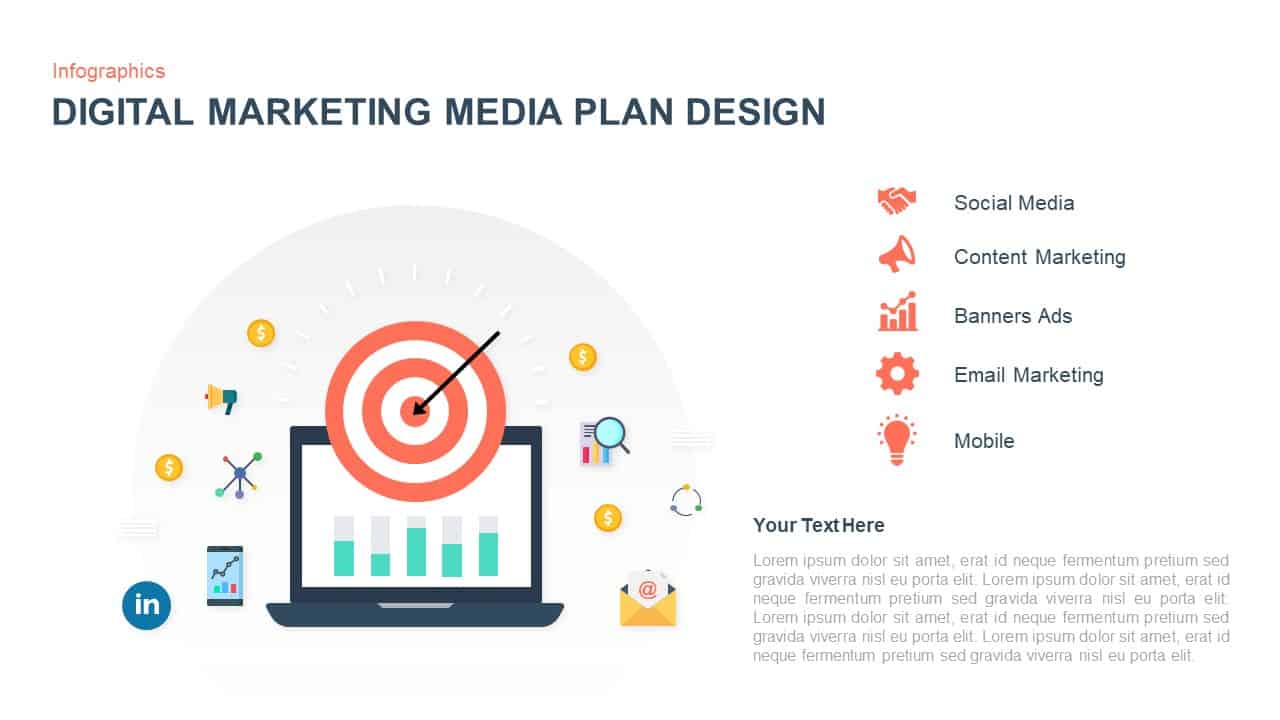
Digital Marketing Media Plan Infographic Template for PowerPoint & Google Slides
Digital Marketing
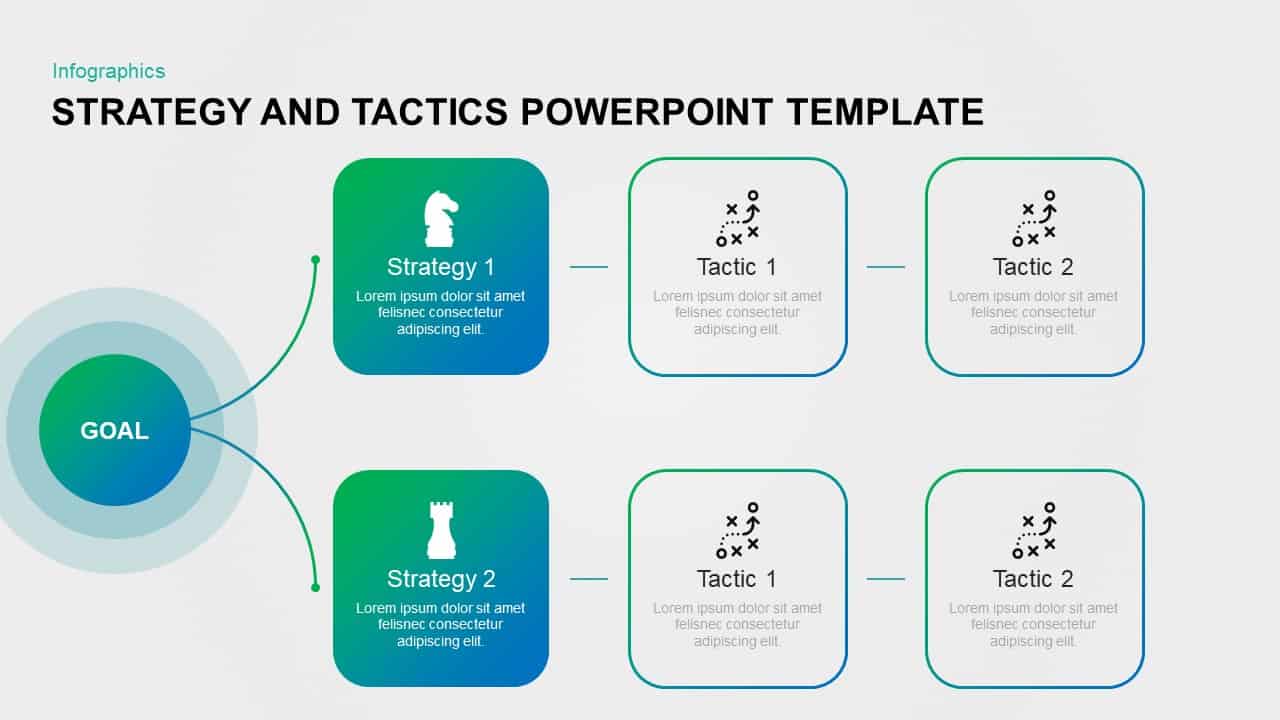
Strategy and Tactics Infographic Template for PowerPoint & Google Slides
Process
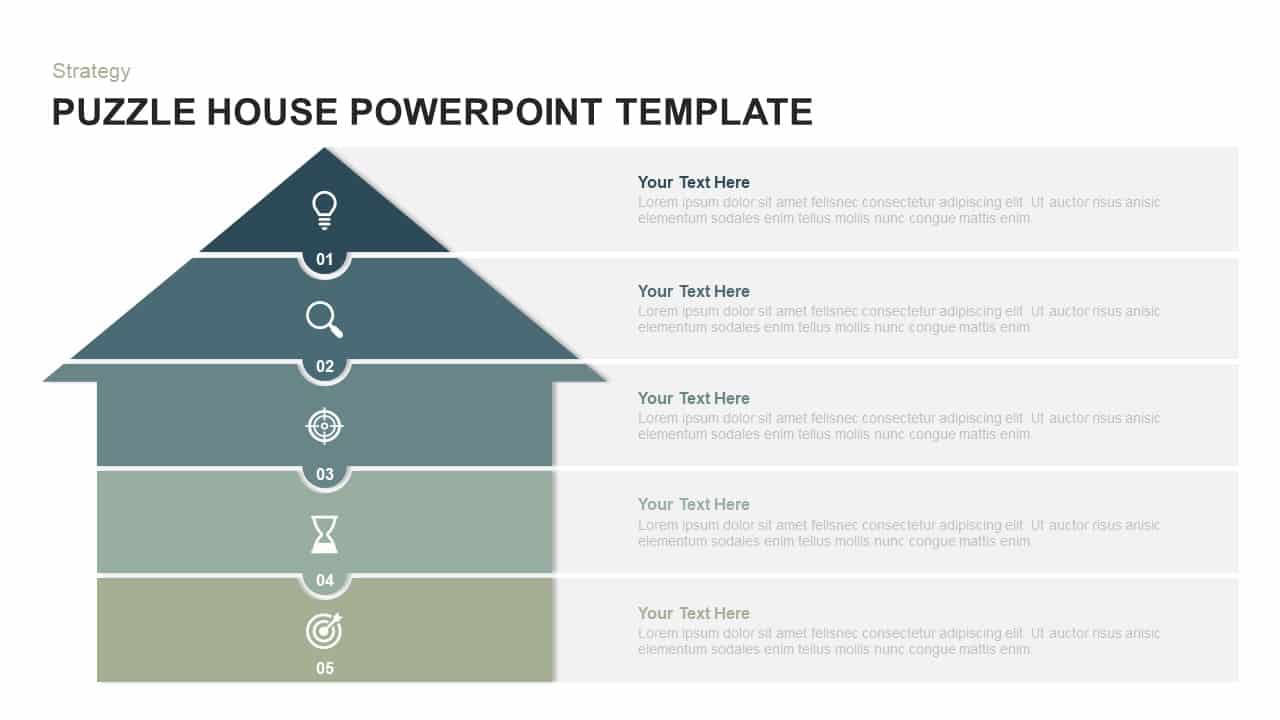
Five-Level Puzzle House Infographic Template for PowerPoint & Google Slides
Pyramid
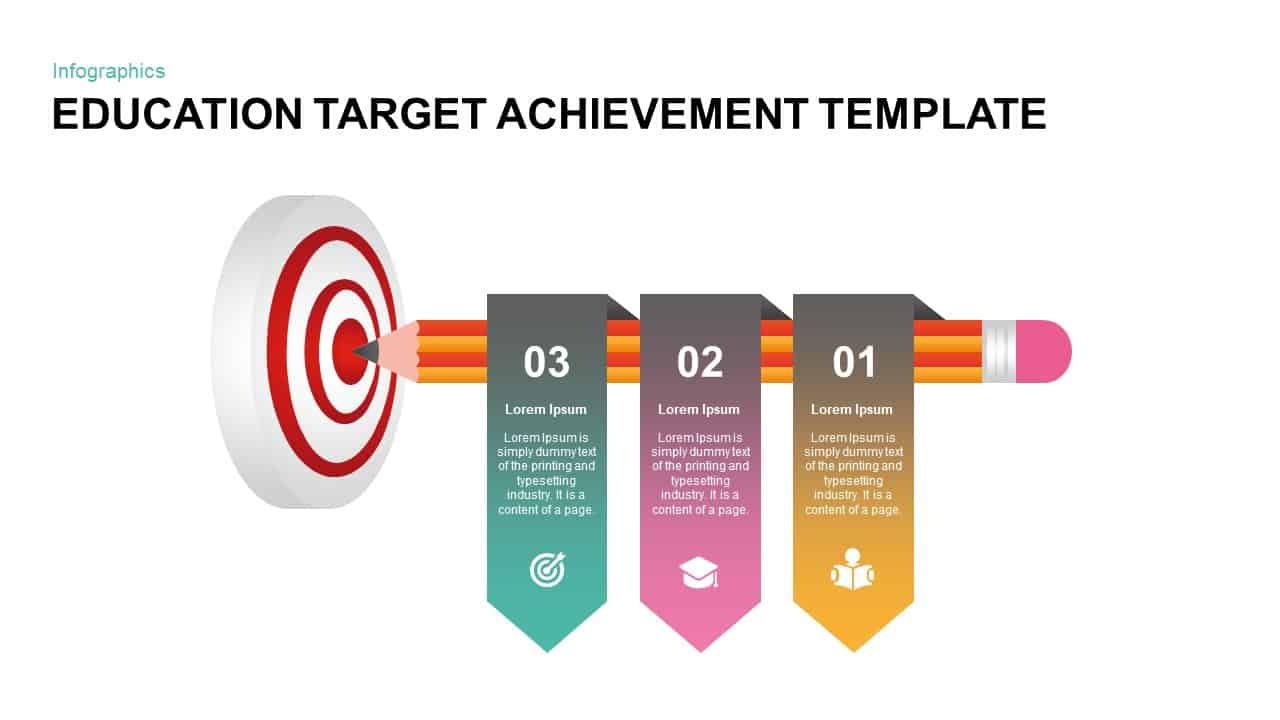
Education Target Achievement Infographic Template for PowerPoint & Google Slides
Goals
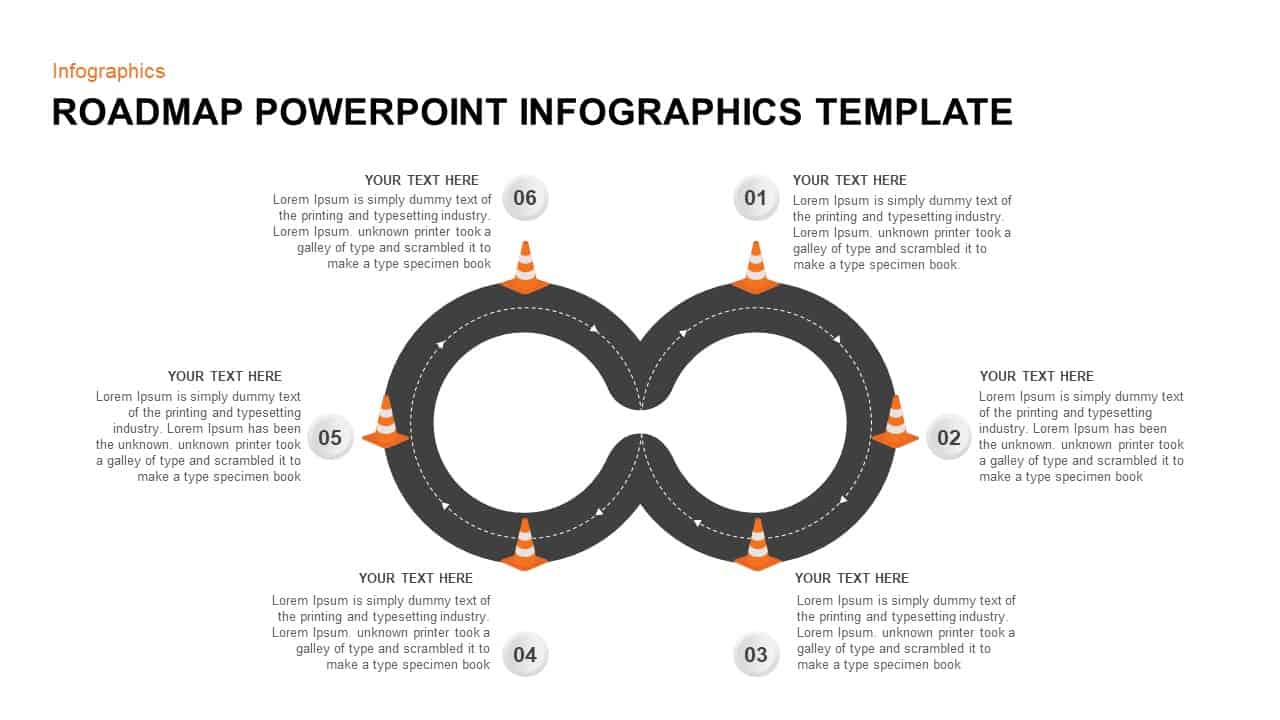
Six-Step Roadmap Infographic Template for PowerPoint & Google Slides
Roadmap
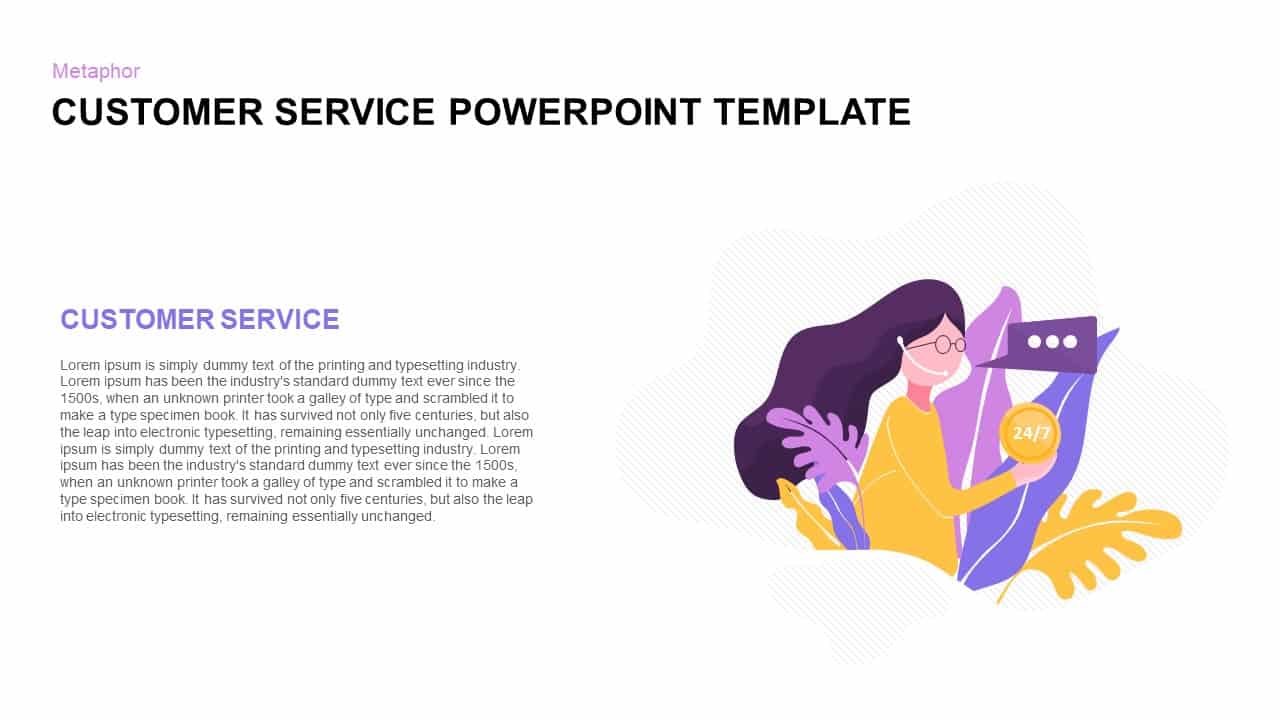
Customer Service Metaphor Infographic Template for PowerPoint & Google Slides
Customer Experience
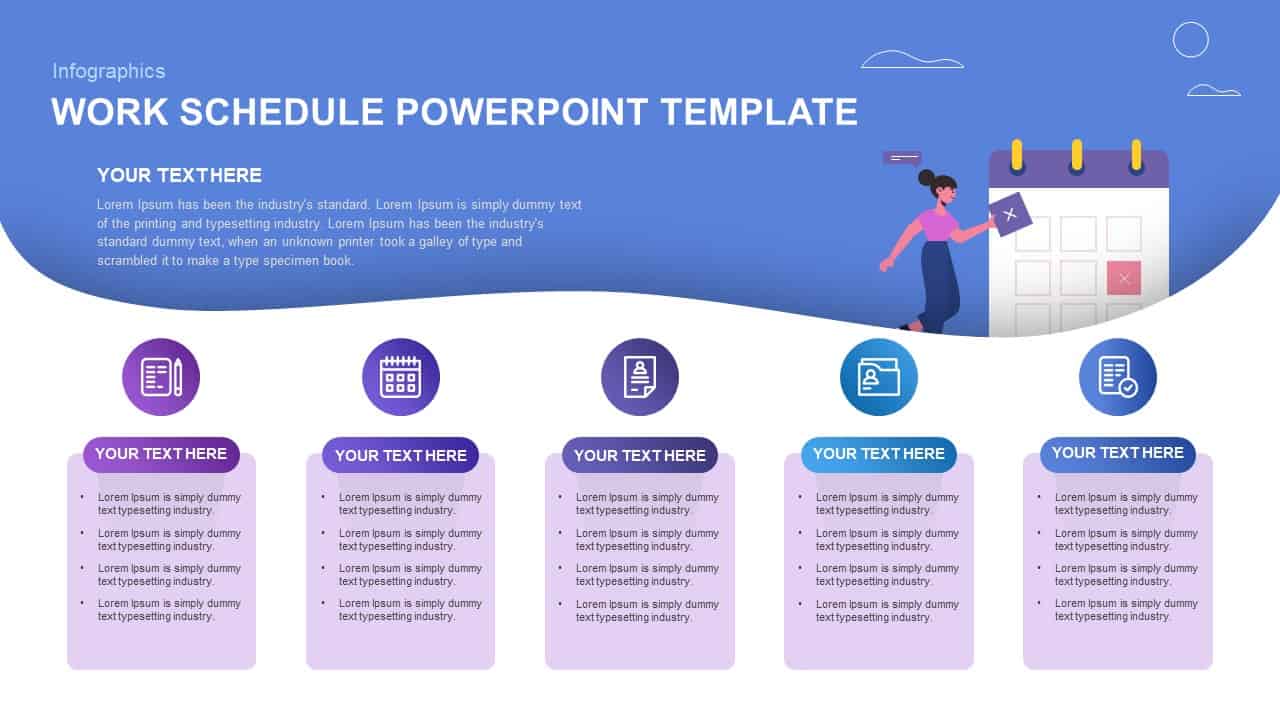
Work Schedule Agenda Infographic Template for PowerPoint & Google Slides
Agenda
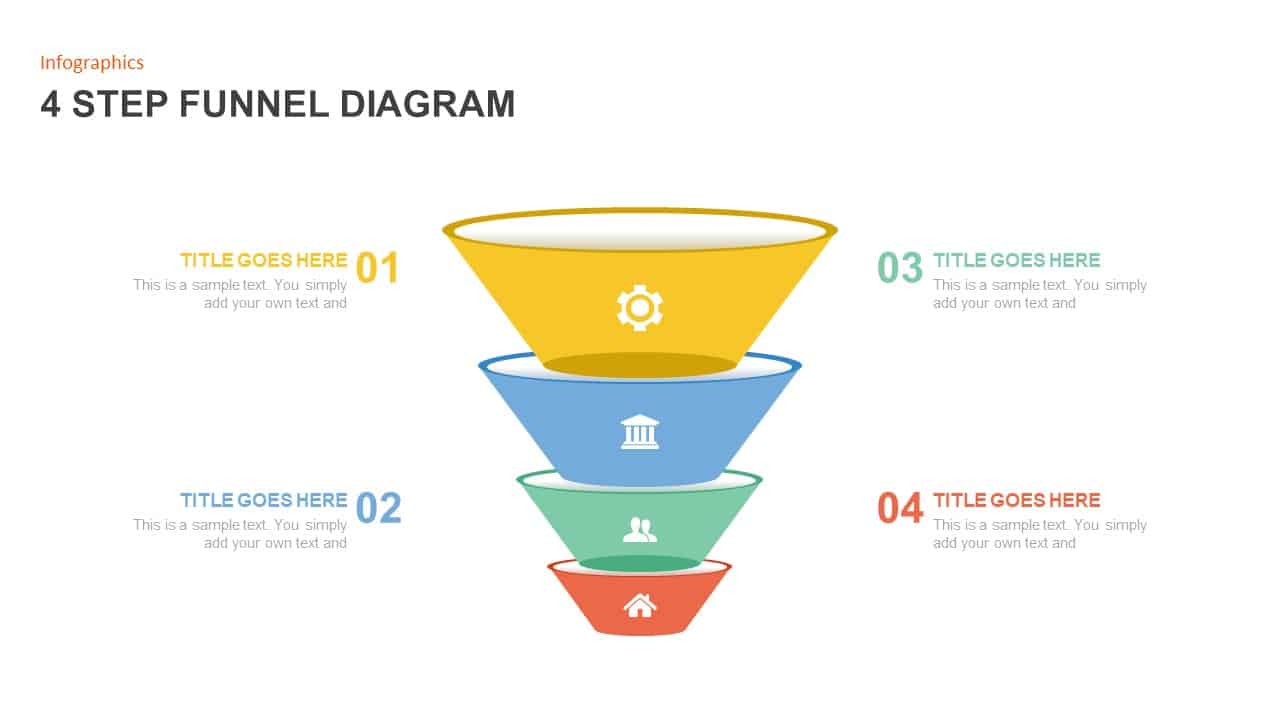
Four-Step Funnel Infographic Pack Template for PowerPoint & Google Slides
Funnel
Four-Stage Funnel Diagram Infographic Template for PowerPoint & Google Slides
Funnel
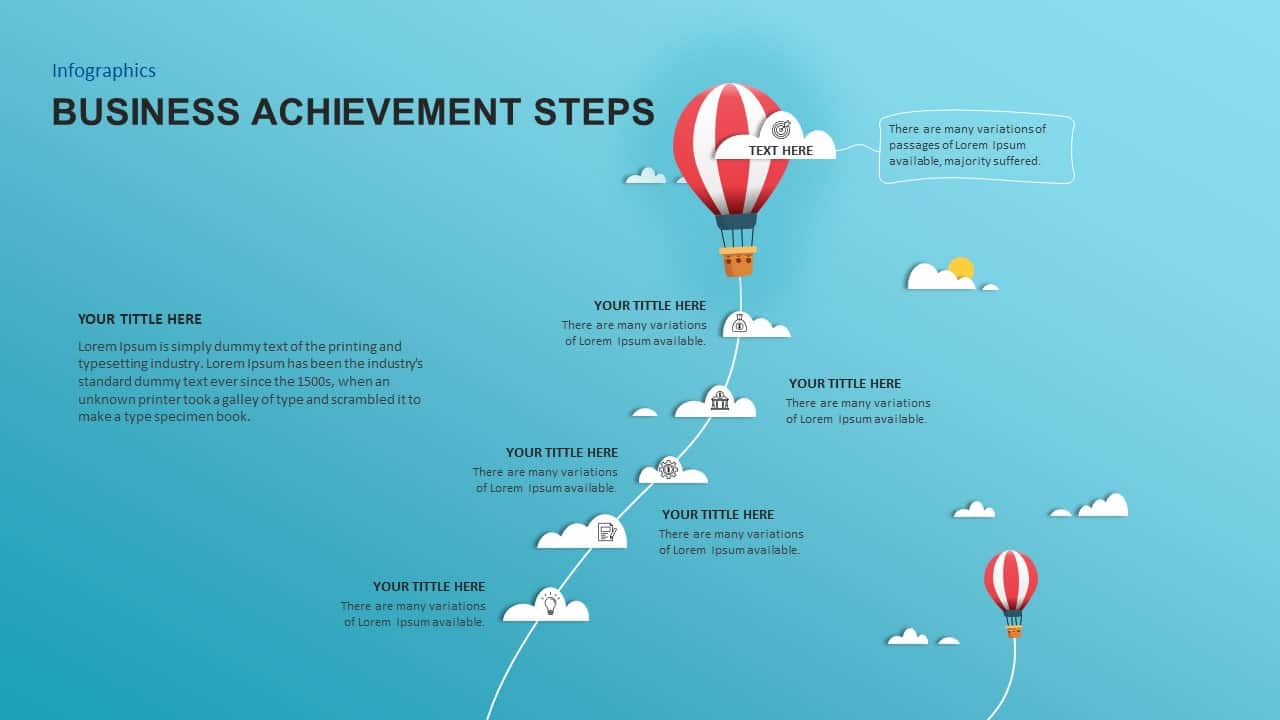
Business Achievement Steps Infographic template for PowerPoint & Google Slides
Process

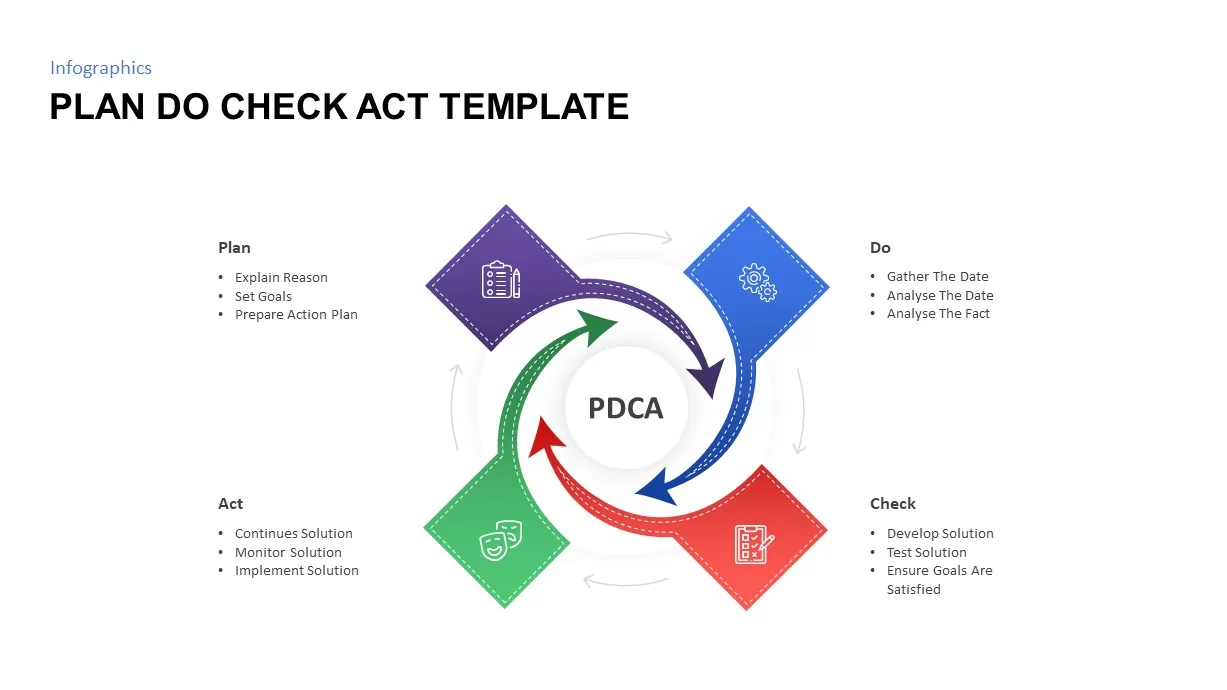
Plan Do Check Act PDCA Cycle Infographic Template for PowerPoint & Google Slides
Process
3, 4, 5 Step Infographic Template for PowerPoint & Google Slides
Business Proposal
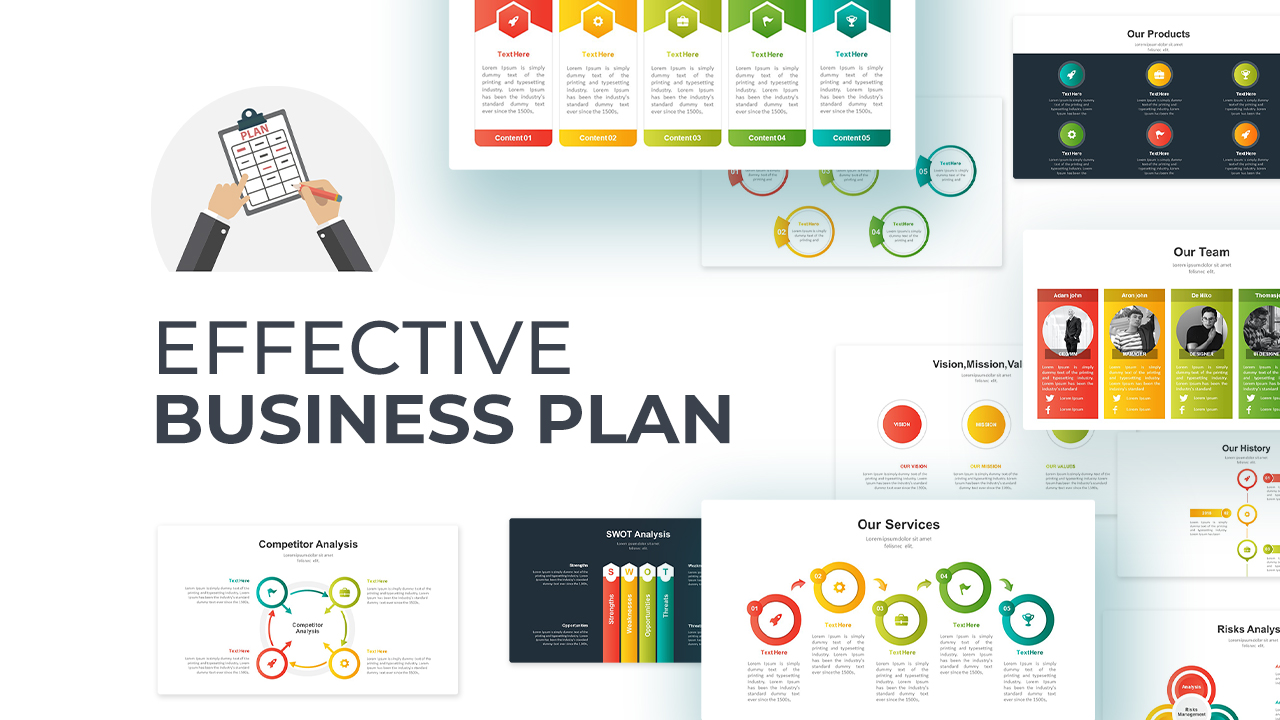
Effective Business Plan Infographic Template for PowerPoint & Google Slides
Pitch Deck
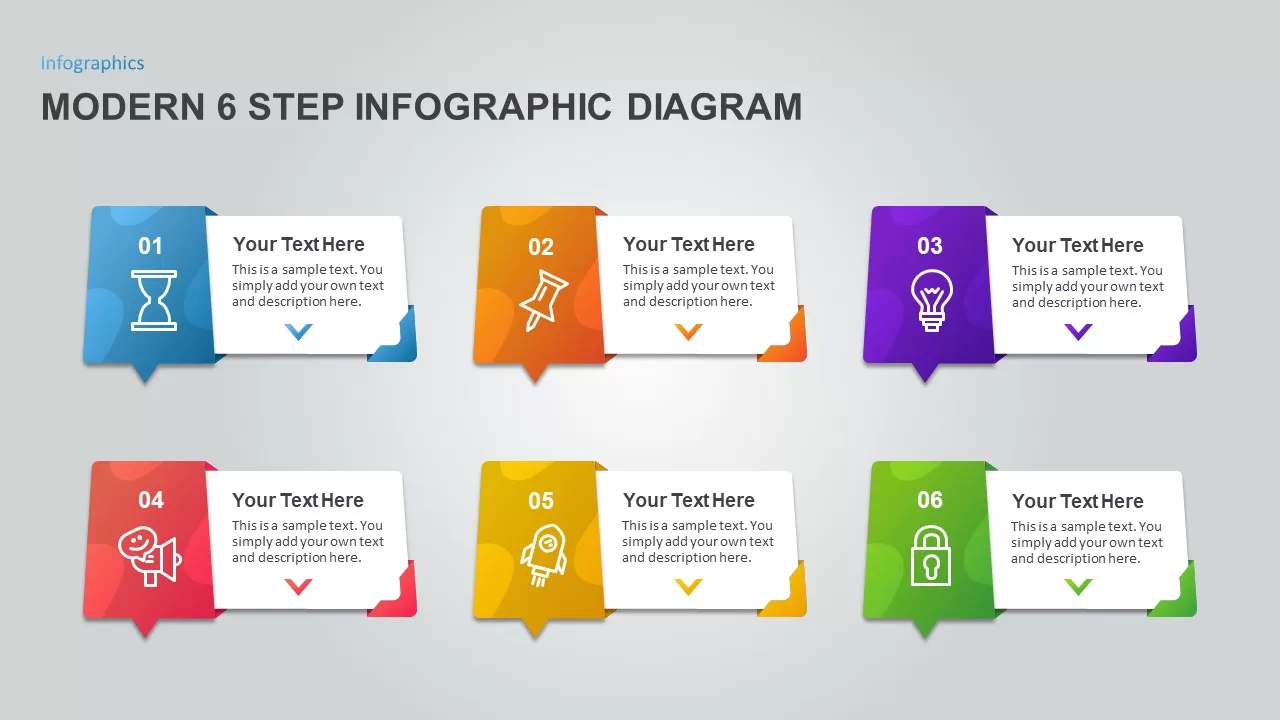
Modern 6 Step Infographic Diagram template for PowerPoint & Google Slides
Process
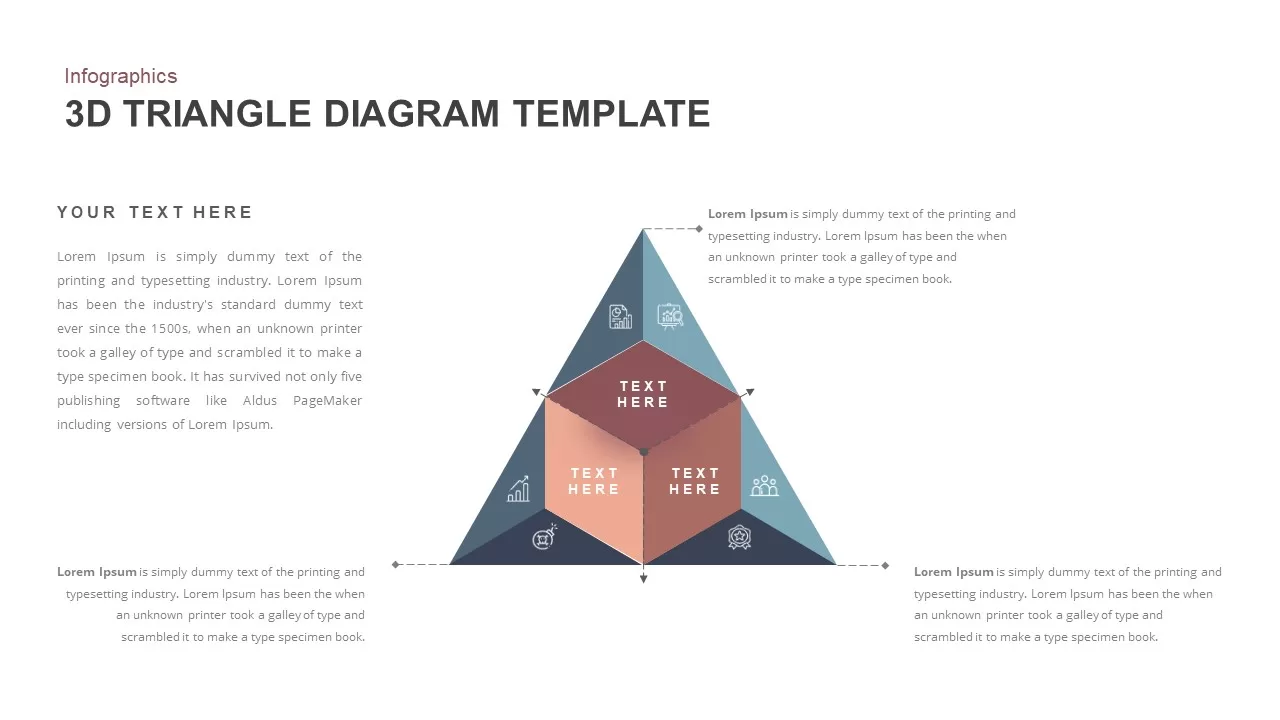
3D Triangle Diagram Infographic Template for PowerPoint & Google Slides
Pyramid
Upward Arrow infographic template for PowerPoint & Google Slides
Infographics
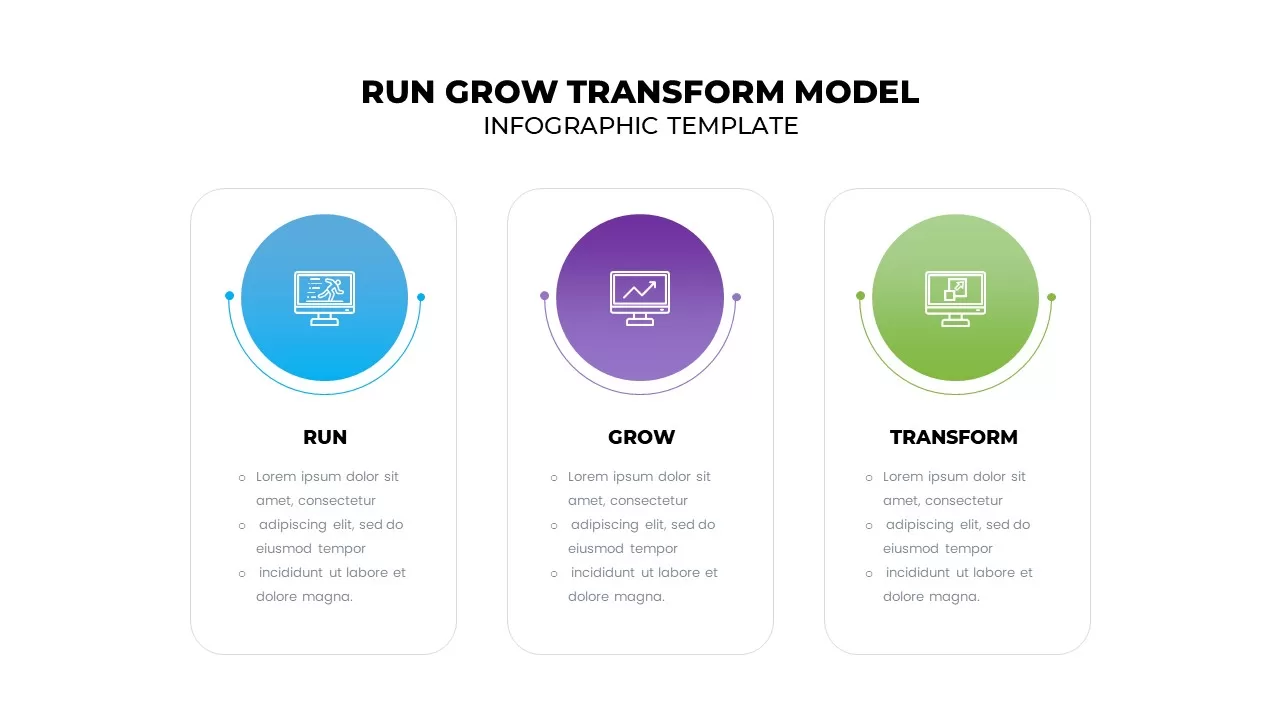
Run Grow Transform Model Infographic Template for PowerPoint & Google Slides
Business
30-60-90 Day Donut Chart Plan Infographic Template for PowerPoint & Google Slides
Timeline
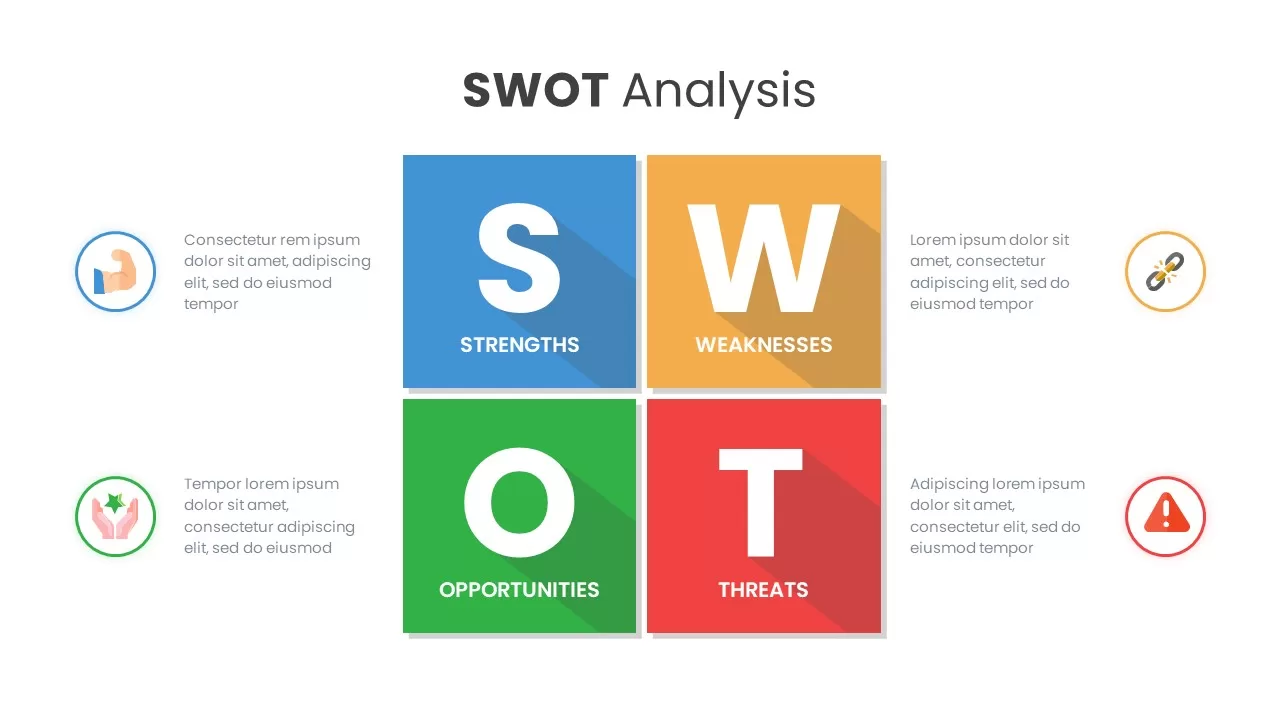
SWOT Analysis Grid Infographic Template for PowerPoint & Google Slides
SWOT
Editable World Map Callout Infographic Template for PowerPoint & Google Slides
World Maps
Editable World Map Callout Infographic Template for PowerPoint & Google Slides
World Maps
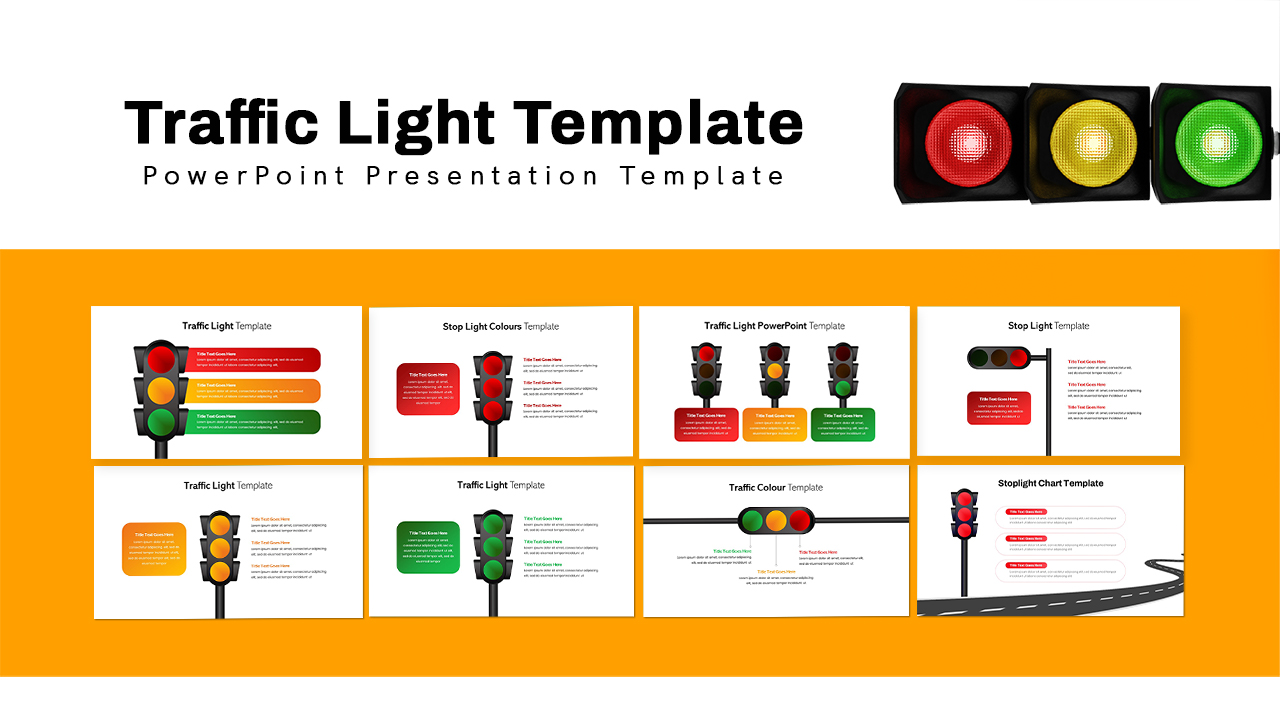
Traffic Light Infographic Pack Template for PowerPoint & Google Slides
Pitch Deck
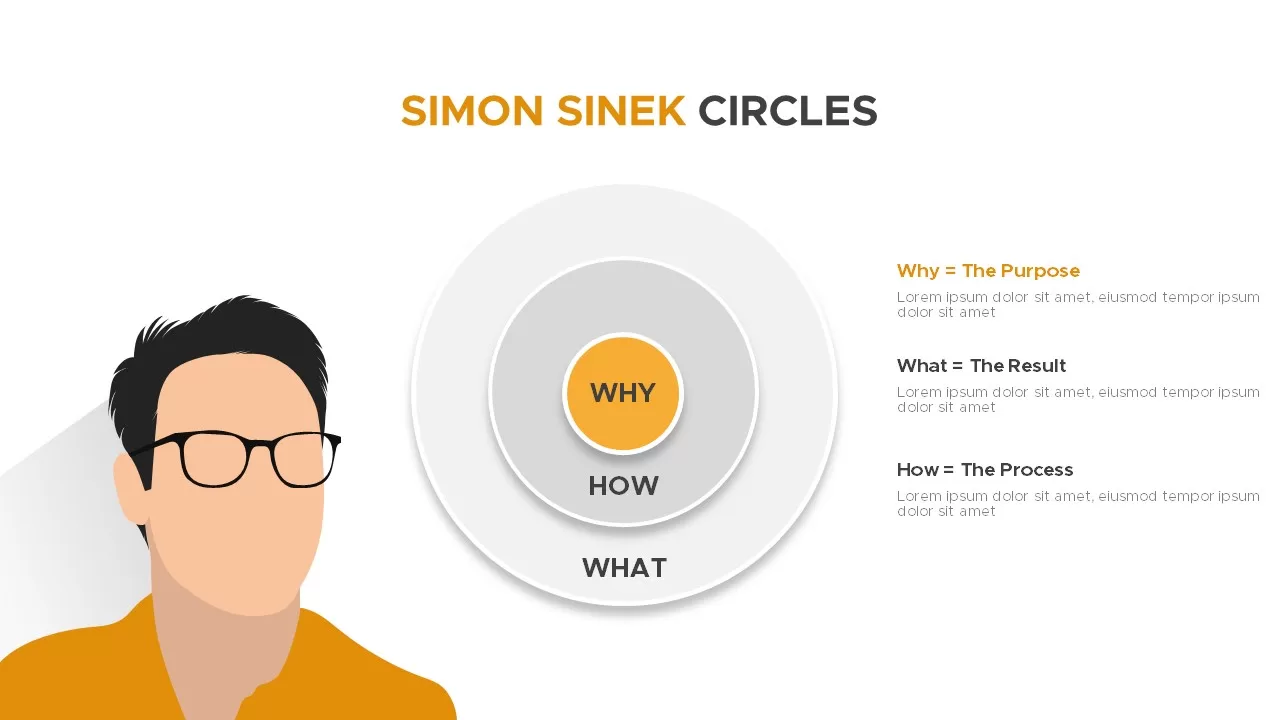
Simon Sinek Circles Model Infographic template for PowerPoint & Google Slides
Business Strategy
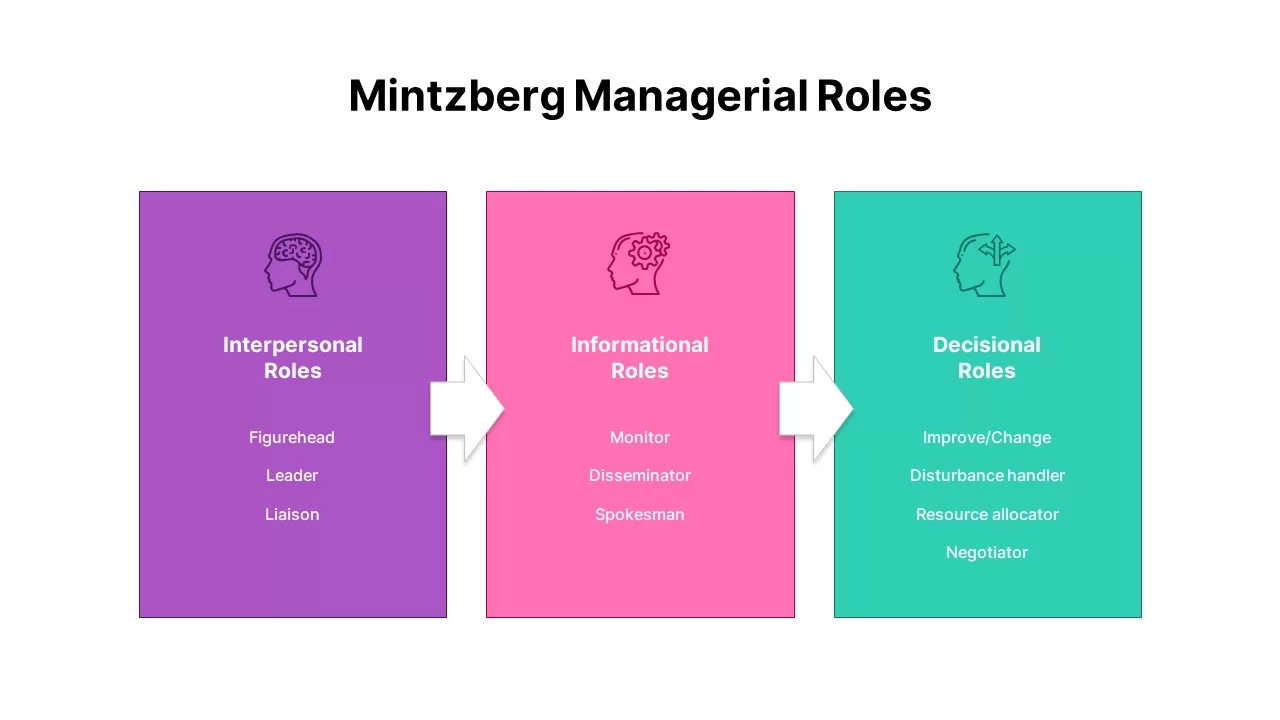
Mintzberg Managerial Roles Infographic Template for PowerPoint & Google Slides
Comparison Chart
Data-driven GDP Growth Infographic Pack Template for PowerPoint & Google Slides
Infographics
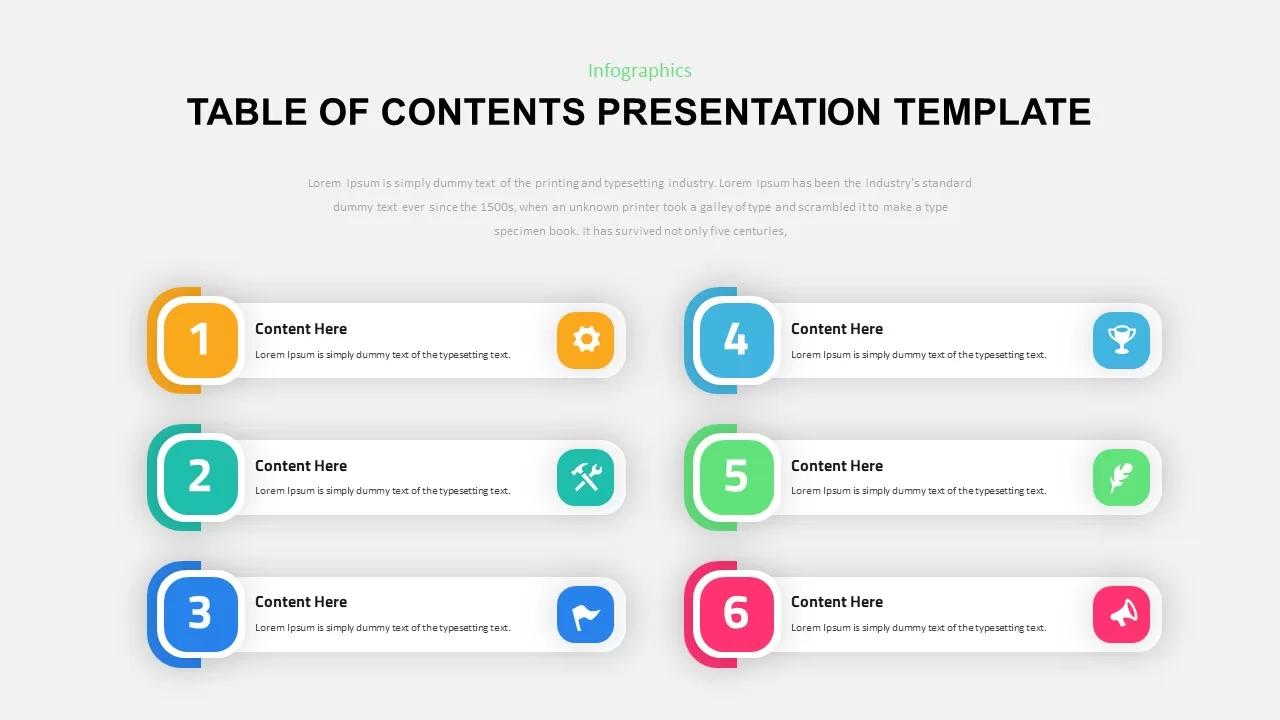
Six-Step Table of Contents Infographic Template for PowerPoint & Google Slides
Agenda
Multi-Style Flow Infographic Slide template for PowerPoint & Google Slides
Process
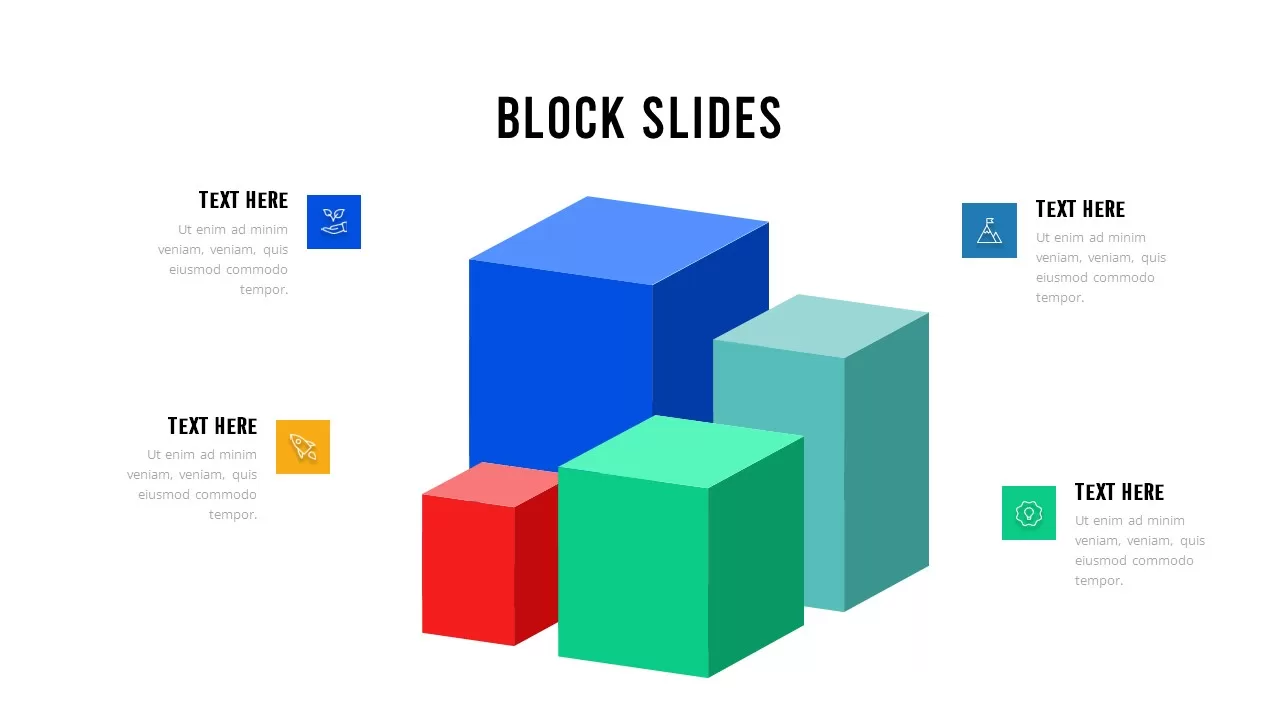
Isometric Block Steps Infographic Template for PowerPoint & Google Slides
Process
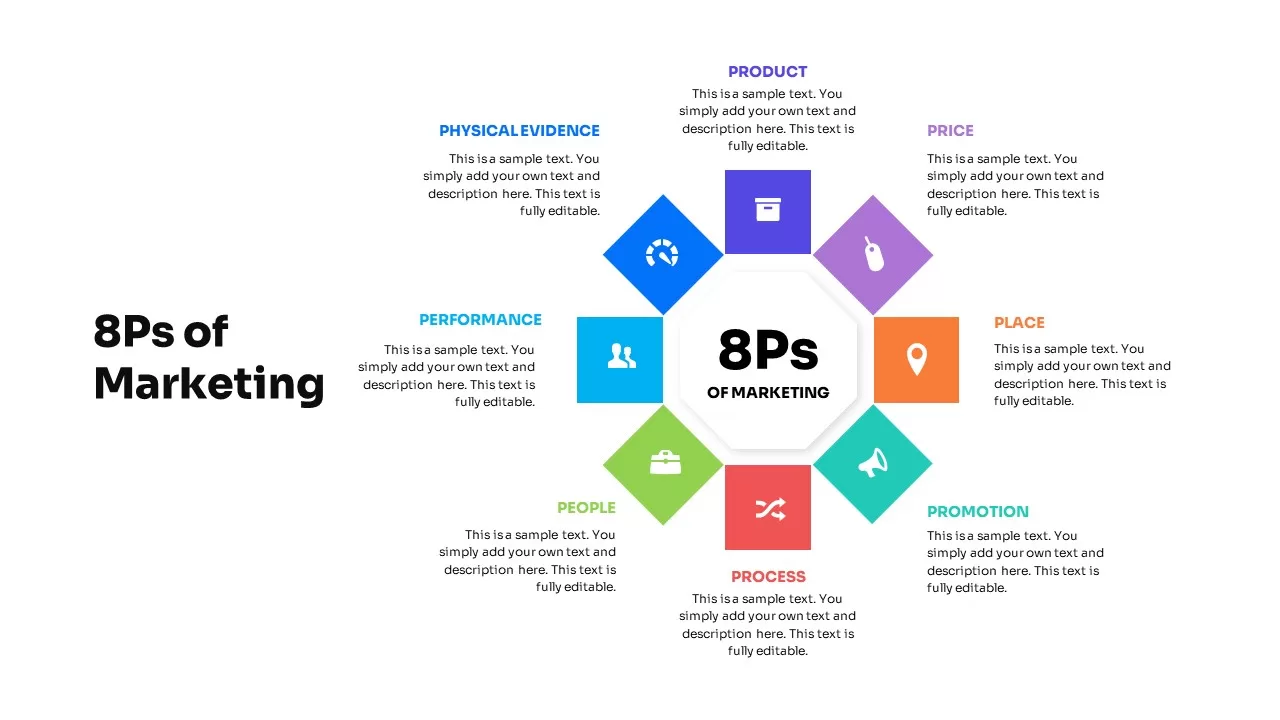
8Ps of Marketing Strategy Infographic Template for PowerPoint & Google Slides
Marketing
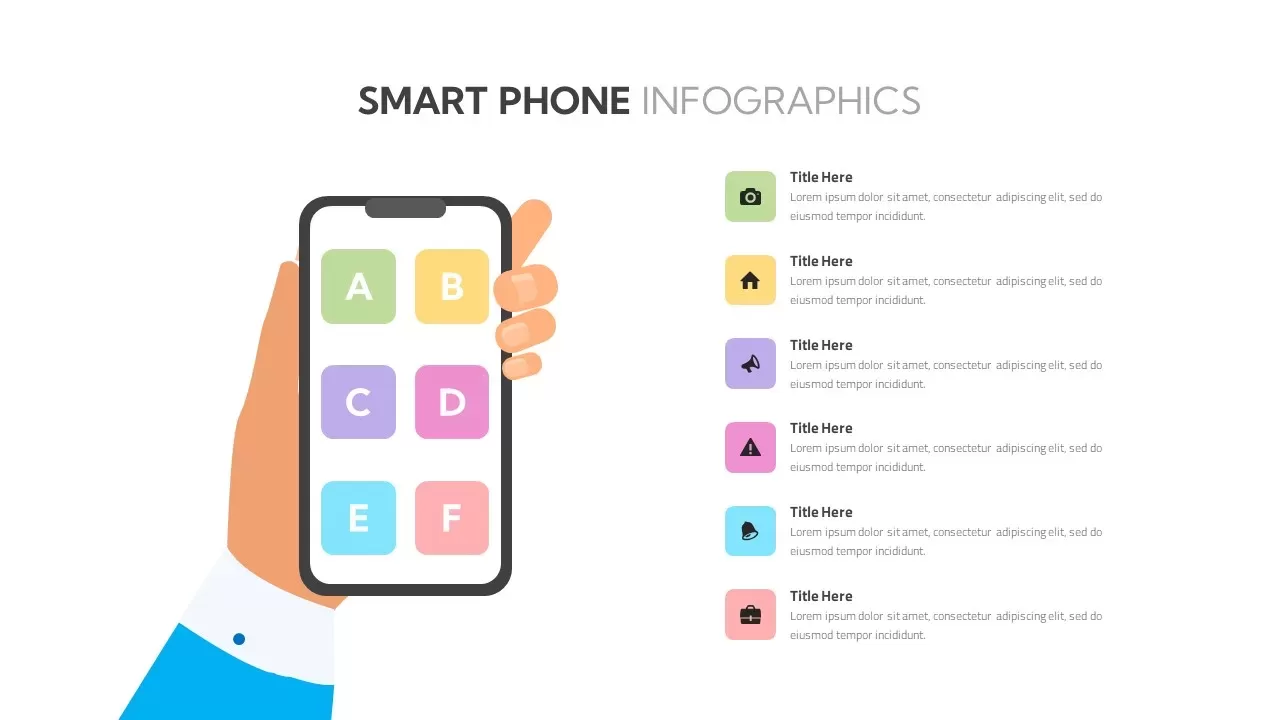
Smartphone Infographic Diagram Template for PowerPoint & Google Slides
Comparison
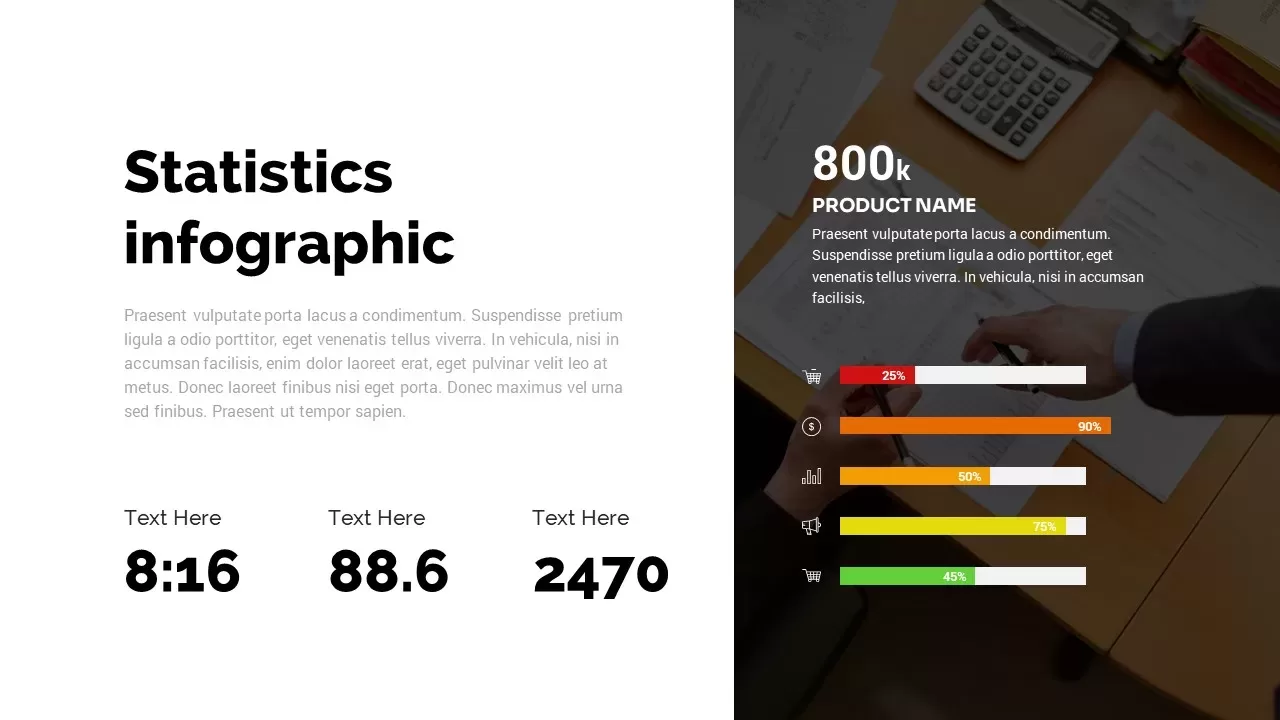
Statistics Infographic Template for PowerPoint & Google Slides
Bar/Column
Statistics & Global Metrics Infographic Template for PowerPoint & Google Slides
Bar/Column
Professional Drone Infographic Slide Template for PowerPoint & Google Slides
Infographics
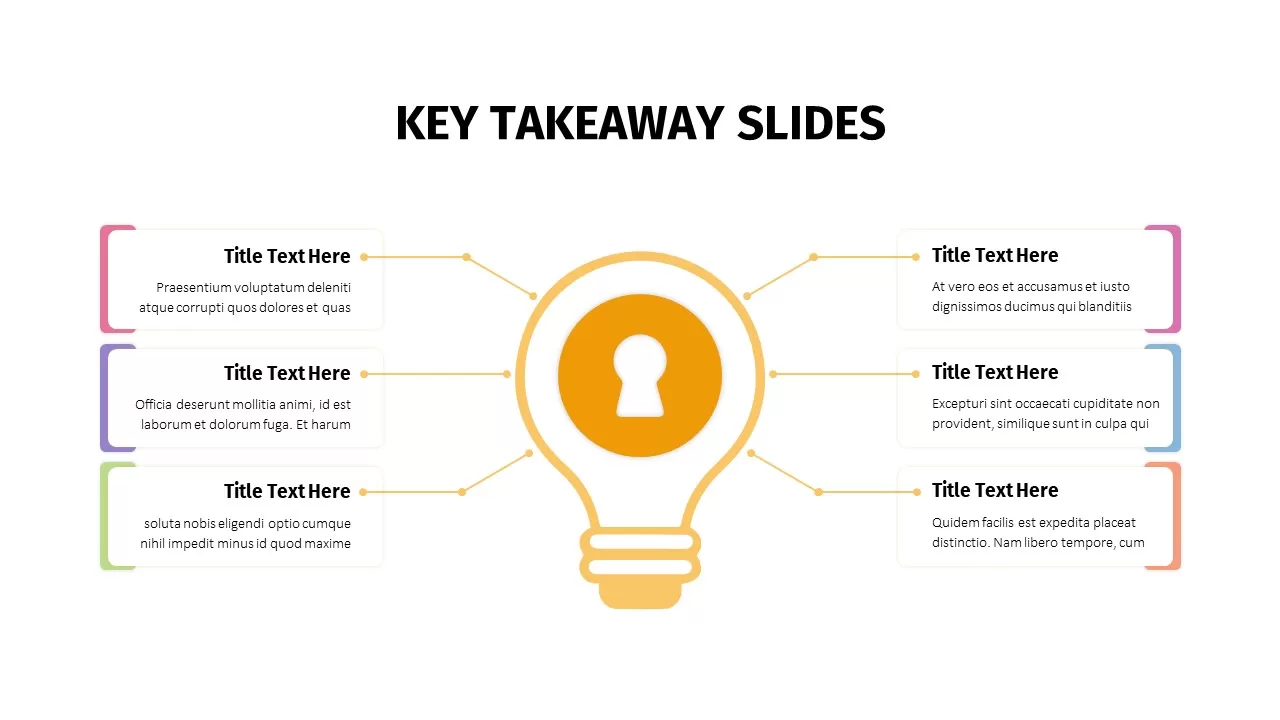
Animated Key Takeaway Spoke Infographic Template for PowerPoint & Google Slides
Infographics
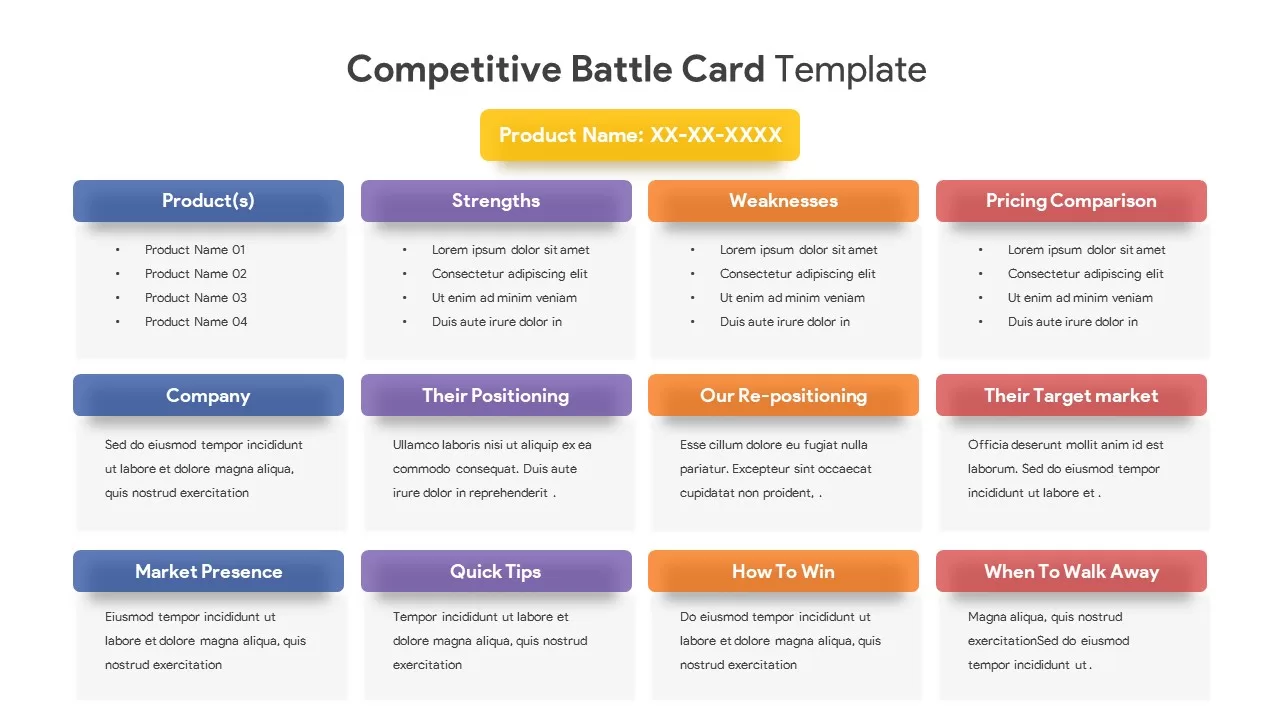
Competitive Battle Card Infographic Pack Template for PowerPoint & Google Slides
Competitor Analysis
Mastodon Metrics Infographic Dashboard Template for PowerPoint & Google Slides
Business Report
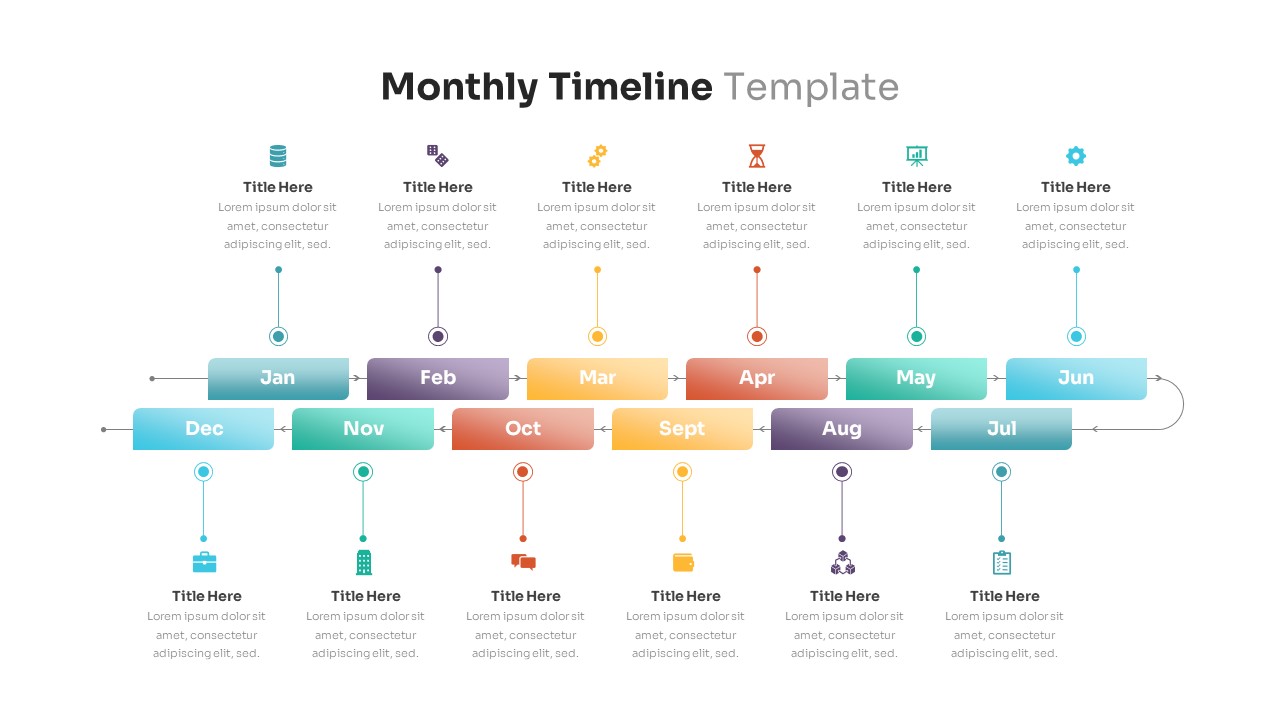
Editable Monthly Timeline Infographic Template for PowerPoint & Google Slides
Timeline
8 Circle Venn Diagram Infographic Design Template for PowerPoint & Google Slides
Circular
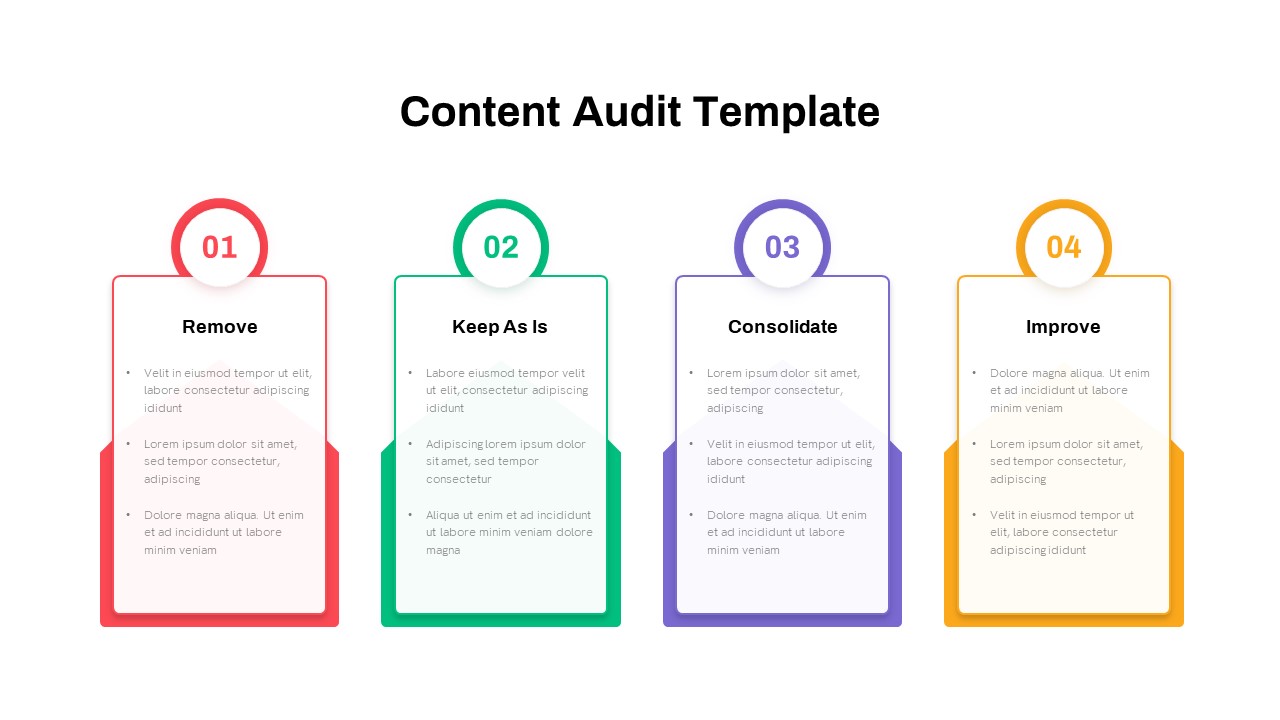
Four-Step Content Audit Infographic Template for PowerPoint & Google Slides
Process
Triangle Infographic Slide Collection Template for PowerPoint & Google Slides
Decks
Quarterly Timeline Infographic Template for PowerPoint & Google Slides
Timeline
Animated Water Drop Ripple Infographic Template for PowerPoint & Google Slides
Graphics
Six Colorful Gear Shapes Infographic Template for PowerPoint & Google Slides
Process
Free
Free Social Media Hub-and-Spoke Infographic Template for PowerPoint & Google Slides
Circular
Free
Syria Regional Data Map Infographic Template for PowerPoint & Google Slides
World Maps
First 100 Days Action Plan Infographic Template for PowerPoint & Google Slides
Timeline
Versatile 6 Options Infographic Layout Template for PowerPoint & Google Slides
Process
Vision & Strategy Infographic Pack Template for PowerPoint & Google Slides
Vision and Mission
Data-Driven AI in Insurance Infographic Template for PowerPoint & Google Slides
Circular
Cost Driver Infographic Slide Pack Template for PowerPoint & Google Slides
Process
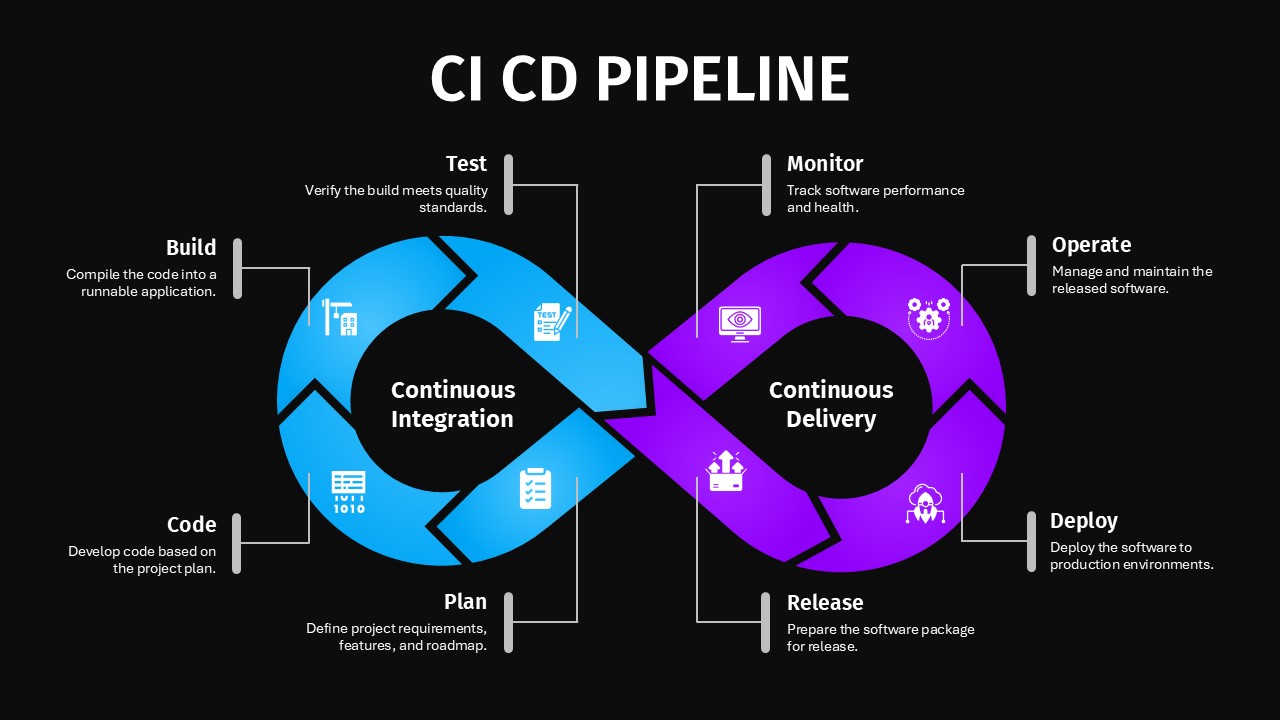
CI/CD Pipeline Infographic Template for PowerPoint & Google Slides
Flow Charts
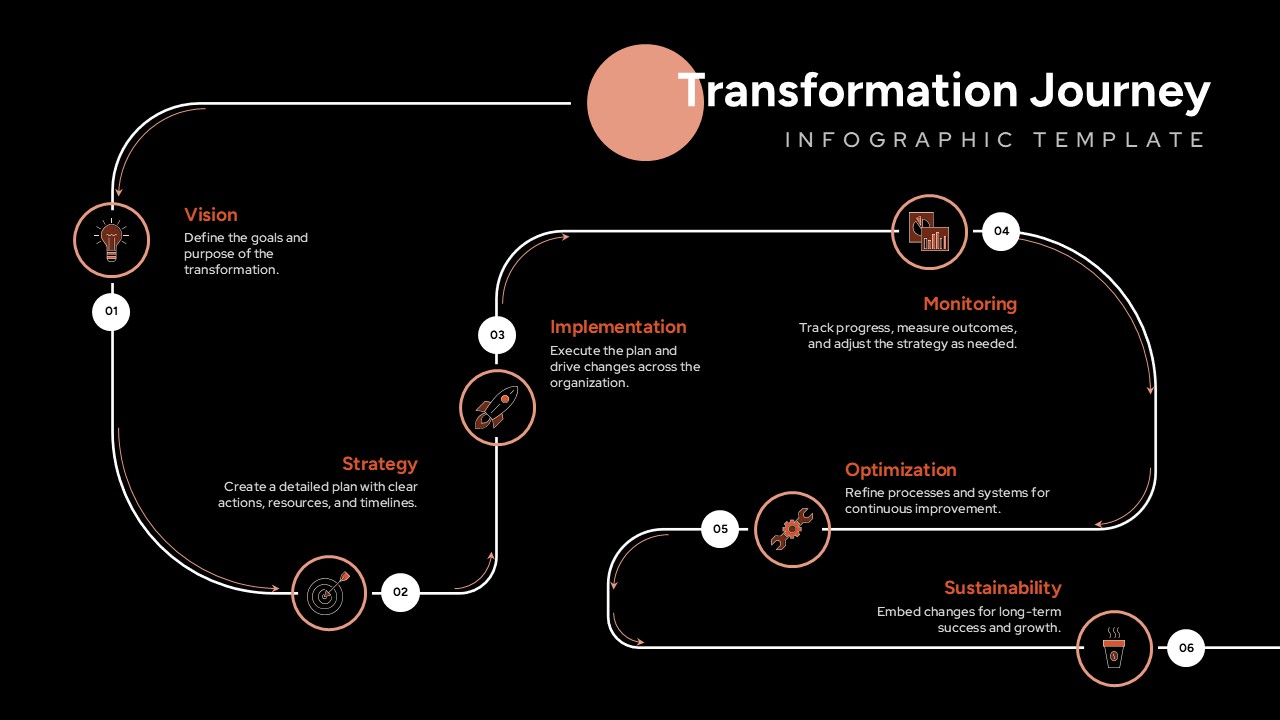
Transformation Journey Infographic Template for PowerPoint & Google Slides
Process
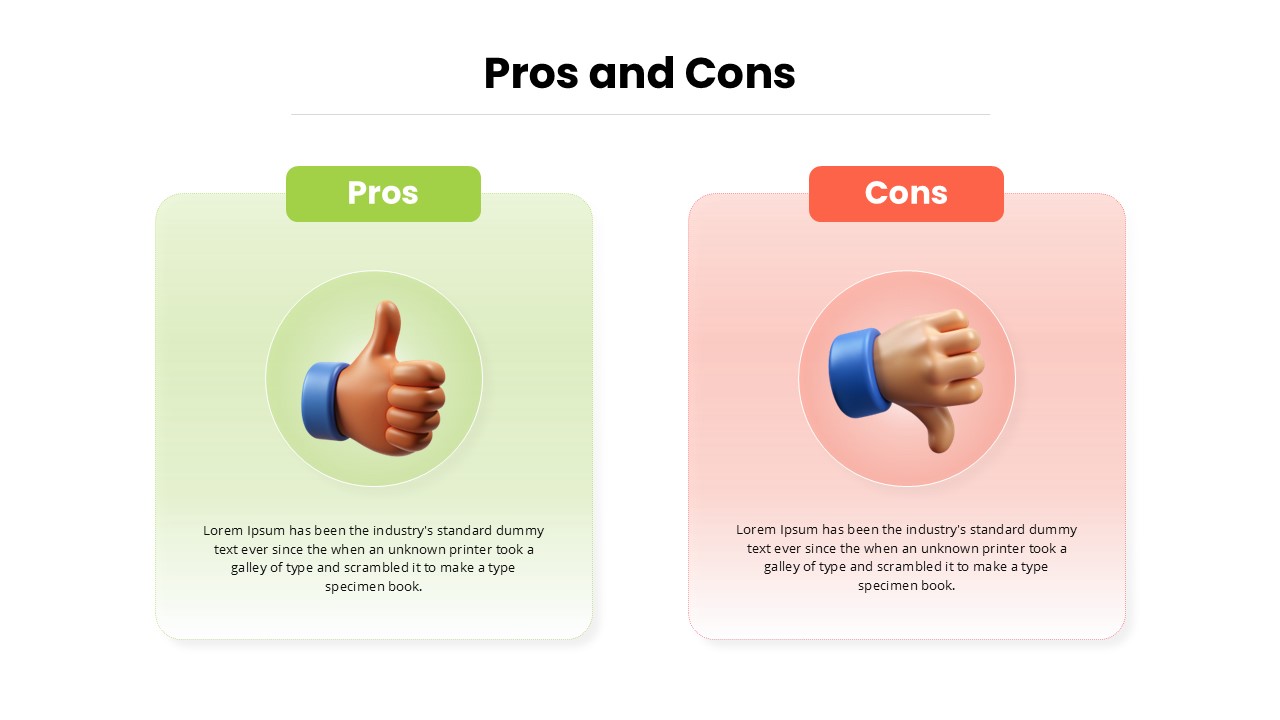
Pros and Cons Infographic Slide Pack Template for PowerPoint & Google Slides
Comparison
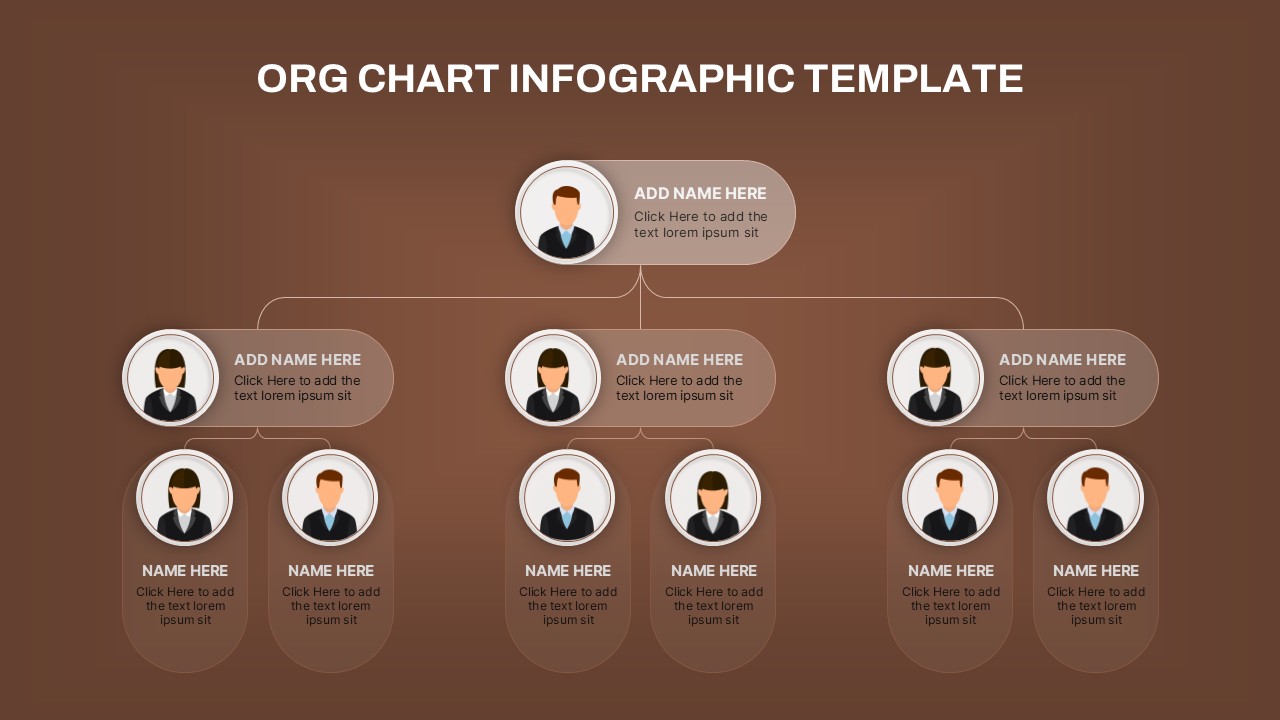
Hierarchical Org Chart Infographic Template for PowerPoint & Google Slides
Org Chart
SWOT Analysis Infographic with Circular Icons Template for PowerPoint & Google Slides
SWOT
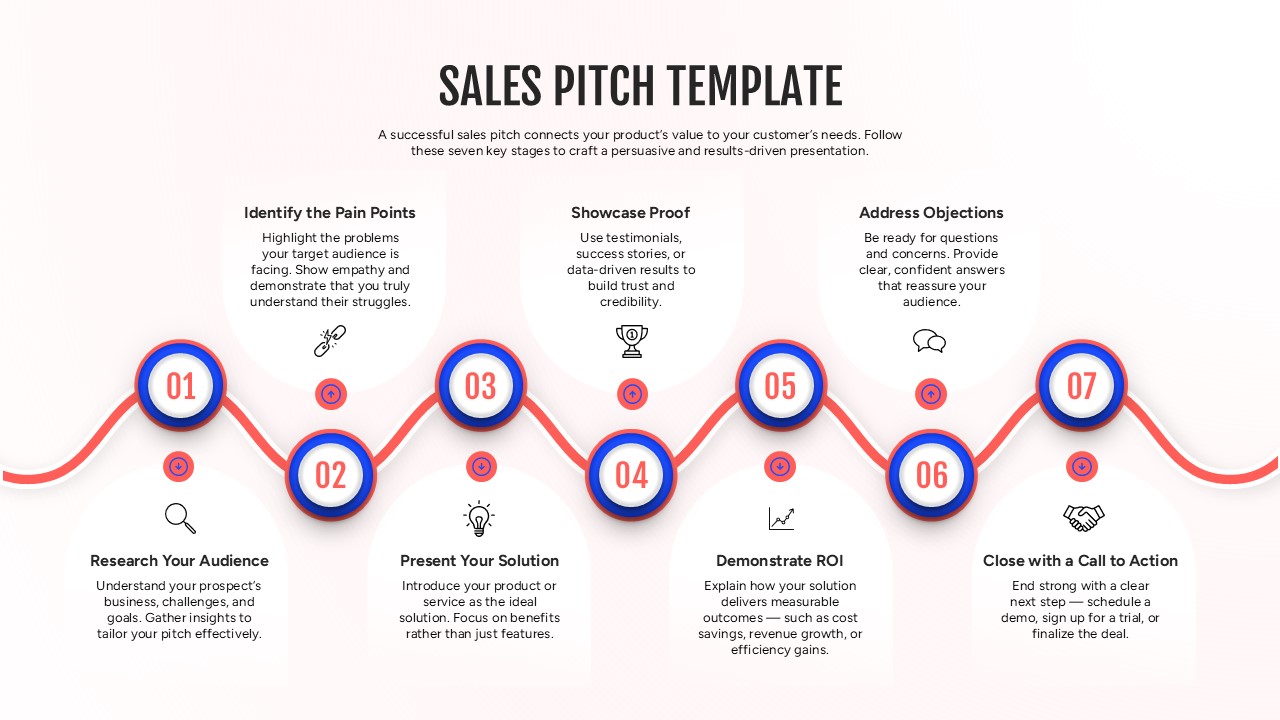
Sales Pitch Roadmap Infographic Template for PowerPoint & Google Slides
Marketing
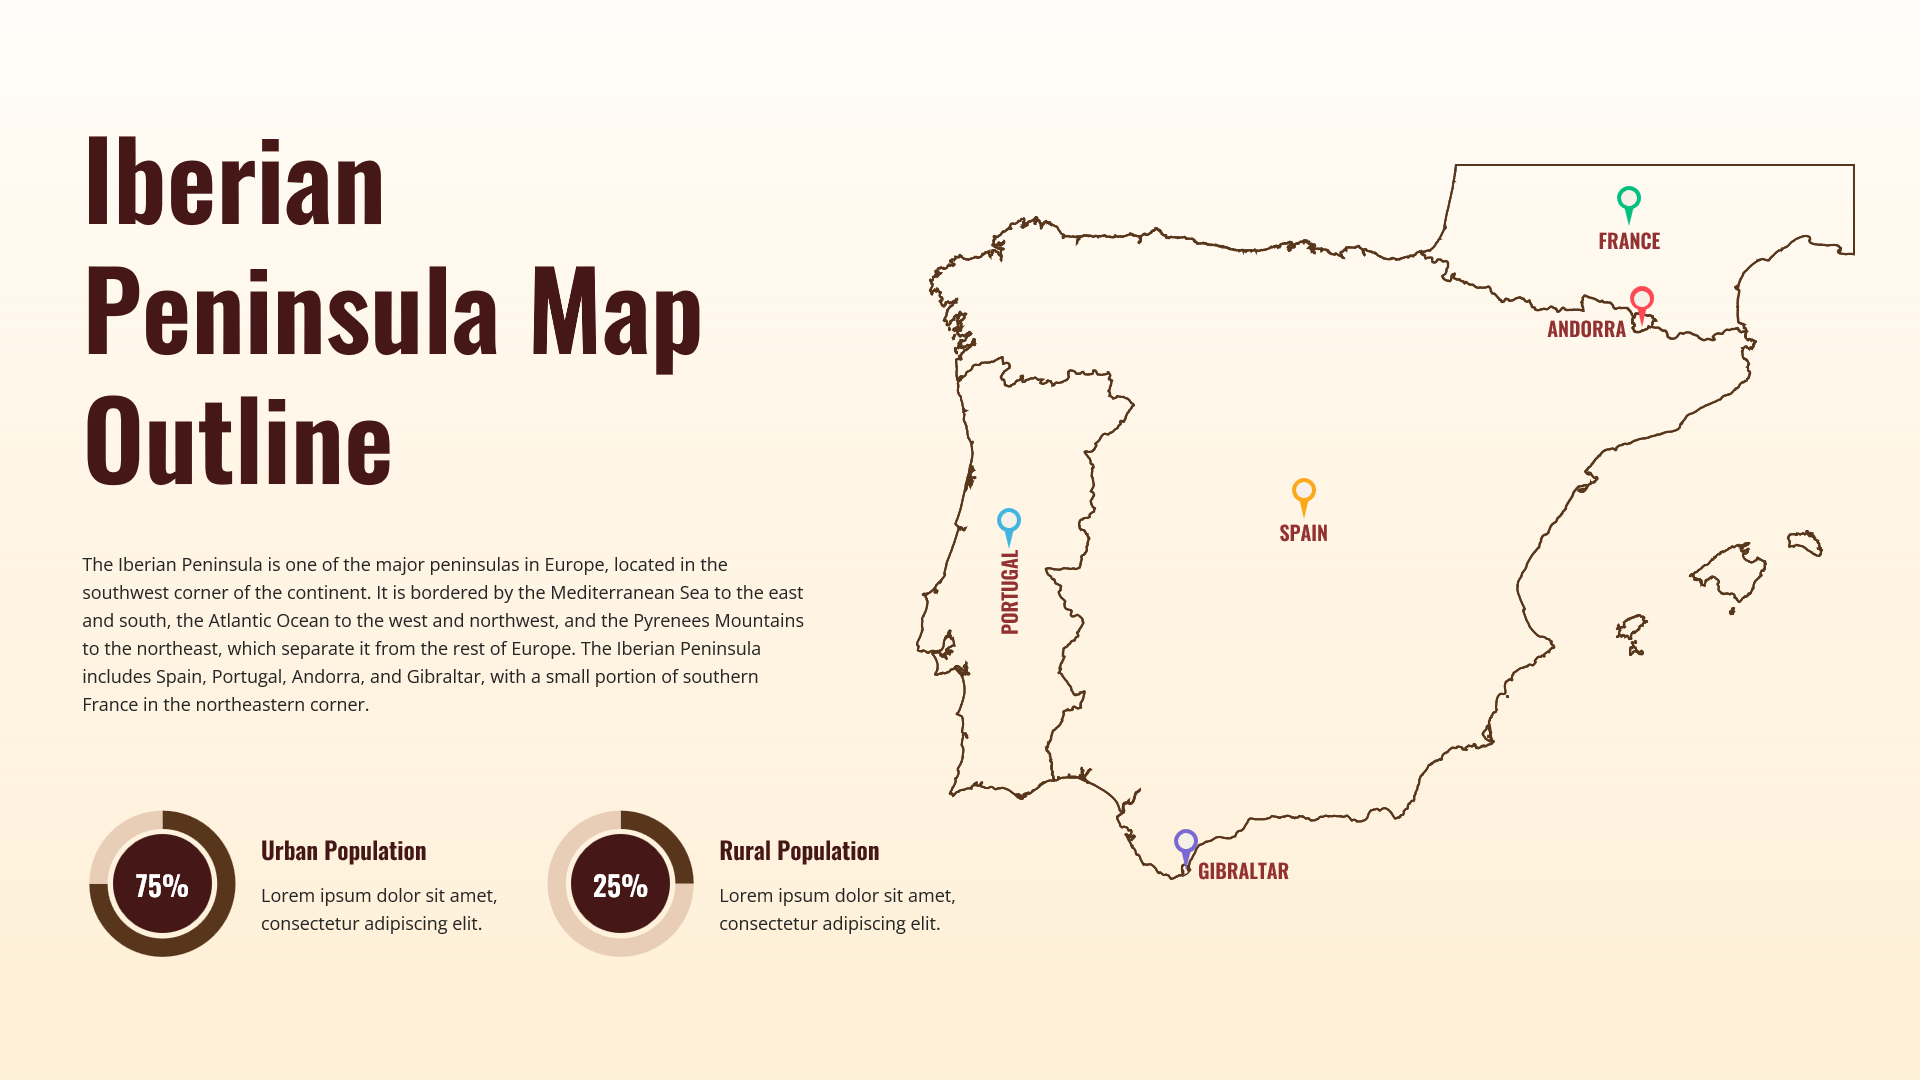
Iberian Peninsula Map Outline Infographic Template for PowerPoint & Google Slides
World Maps