Free Curved Arrow Infographic Diagram Template for PowerPoint & Google Slides
Description
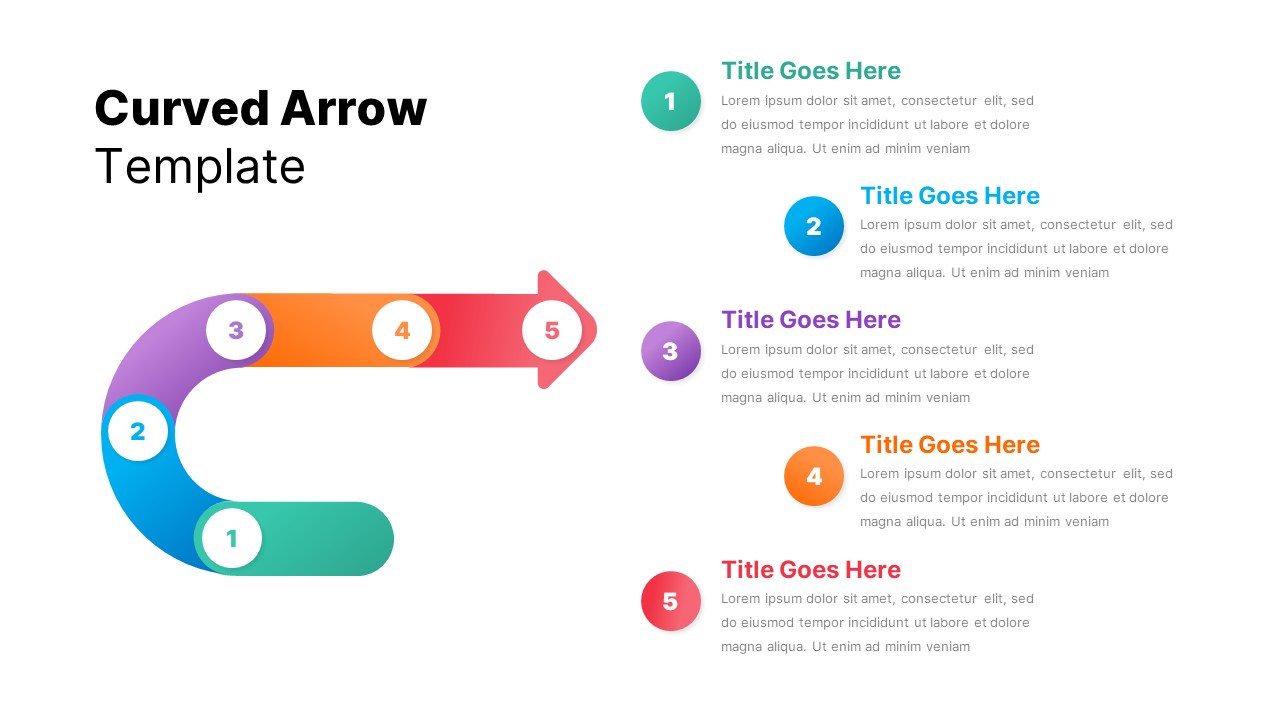
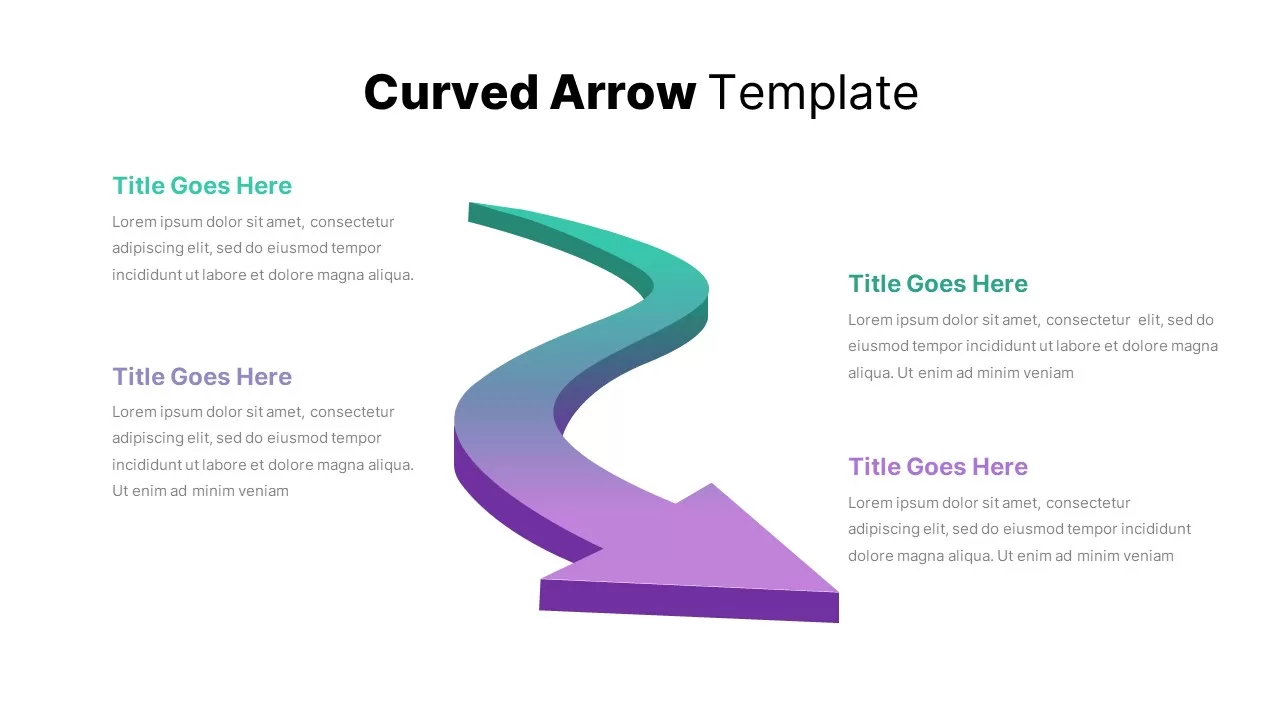
This slide presents a dynamic curved arrow infographic diagram ideal for mapping sequential steps, growth milestones, or cyclical processes. It features four ascending semicircular arrows rendered in green, blue, orange, and pink hues, each paired with a clear headline placeholder and supporting text block. The central, largest arc incorporates a bold percentage callout (59%) within a circular badge, enabling presenters to spotlight key metrics or progress indicators or hide it when focusing solely on process flow. Text placeholders are paired with subtle drop shadows for depth, while a clean white background and bold sans-serif typography maintain a professional aesthetic adaptable to diverse branding palettes.
Leveraging master slide layouts, vector-based graphics, and built-in alignment guides, this design ensures pixel-perfect placement and effortless customization—swap colors, adjust arc curvature, or modify line weights in just a few clicks. Designed with editable vector shapes, presenters can reposition arrow origins, swap icons, or adjust text alignment to suit narrative flow. The layout supports four-step workflows out of the box, with options to add or remove segments for longer or shorter processes. Alternative color palettes, including monochrome and gradient overlays, allow seamless integration with corporate style guides. The download also includes slide notes with best-practice tips—pair each arc with data-driven insights, emphasize phase transitions, or highlight return loops. Fully compatible with both PowerPoint and Google Slides, this template maintains high-resolution clarity and consistent formatting across platforms, eliminating version control headaches and speeding up slide production. Whether illustrating quarterly roadmaps, market expansion plans, or user journey overviews, this curved arrow diagram elevates any business presentation with professional clarity and customization flexibility.
Who is it for
Marketing professionals, project managers, and business analysts will find this infographic especially useful for illustrating roadmap plans, campaign funnels, or performance benchmarks. Consultants and startup founders can leverage the ascending arcs to highlight growth trajectories or investment stages. Educators and workshop facilitators can also adapt the modular design to depict lesson progressions or workshop agendas.
Other Uses
Beyond process mapping, this curved arrow diagram can transform data presentations, KPI dashboards, or executive summaries. It serves as an engaging alternative for technology roadmaps, milestone trackers, and risk assessment overviews. Creative teams can repurpose the arcs to visualize customer journeys or product development cycles, making this template a versatile asset across industries.
Login to download this file

Item ID
SB02731
Related Templates

Curved Arrow Process Flow Infographic Template for PowerPoint & Google Slides
Process
5-Step Curved Arrow Infographic Template for PowerPoint & Google Slides
Arrow
Three-Path Curved Arrow Infographic Template for PowerPoint & Google Slides
Arrow
Free Curved Arrow Progress Chart template for PowerPoint & Google Slides
Project
Free
Curved Arrow Process Flow Diagram Template for PowerPoint & Google Slides
Process
Curved Arrow Process Flow Diagram Template for PowerPoint & Google Slides
Arrow
Curved Arrow Flow Diagram template for PowerPoint & Google Slides
Business
Three-Step Curved Arrow Process Diagram Template for PowerPoint & Google Slides
Arrow
Four-Arrow Curved Hub-and-Spoke Diagram Template for PowerPoint & Google Slides
Arrow
Hand-Drawn Four-Step Curved Arrow Diagram Template for PowerPoint & Google Slides
Arrow
Four-Step Curved Arrow Diagram Template for PowerPoint & Google Slides
Arrow
Multi-Color Five-Step Curved Arrow Template for PowerPoint & Google Slides
Process
Dynamic Curved Arrow Process Roadmap Template for PowerPoint & Google Slides
Process
3D Curved Arrow Growth Process Slide Template for PowerPoint & Google Slides
Process
Curved Arrow Flow Template for PowerPoint & Google Slides
Process
Four-Step Curved Arrow Process Template for PowerPoint & Google Slides
Process
Curved Arrow Process Flow template for PowerPoint & Google Slides
Process
Curved Arrow Process Flow template for PowerPoint & Google Slides
Process
Curved Arrow Roadmap template for PowerPoint & Google Slides
Roadmap
Curved Arrow Progression template for PowerPoint & Google Slides
Process
Curved Five-Section Timeline Infographic template for PowerPoint & Google Slides
Timeline
Curved Road Map Timeline Infographic Template for PowerPoint & Google Slides
Roadmap
Curved Roadmap Infographic Vision Journey Template for PowerPoint & Google Slides
Business Strategy
Curved Road Timeline Infographic Template for PowerPoint & Google Slides
Timeline
Free 6-Step Curved Workflow Timeline for PowerPoint & Google Slides
Timeline
Free
Curved Road Roadmap Timeline Diagram Template for PowerPoint & Google Slides
Roadmap
Data Migration Life Cycle Curved Diagram Template for PowerPoint & Google Slides
Process
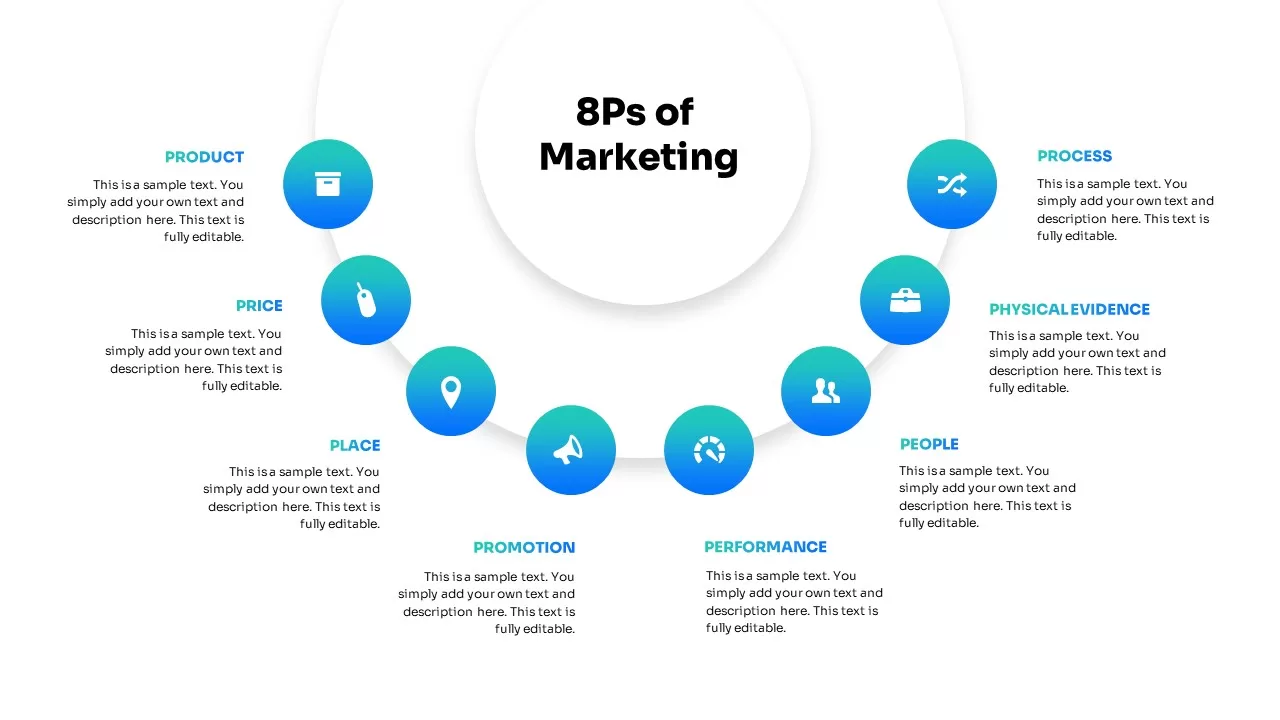
Curved 8Ps of Marketing Diagram Template for PowerPoint & Google Slides
Marketing

Free Multi-Year Arrow Timeline Infographic Template for PowerPoint & Google Slides
Timeline
Free
Five Up Arrow Infographic Diagram Template for PowerPoint & Google Slides
Arrow
Four-Section Arrow Infographic Diagram Template for PowerPoint & Google Slides
Arrow
3D Block Arrow Infographic Diagram Template for PowerPoint & Google Slides
Arrow
Multi-Series Curved Line Graph Analytics Template for PowerPoint & Google Slides
Comparison Chart
Colorful Curved Roadmap Phases Template for PowerPoint & Google Slides
Roadmap
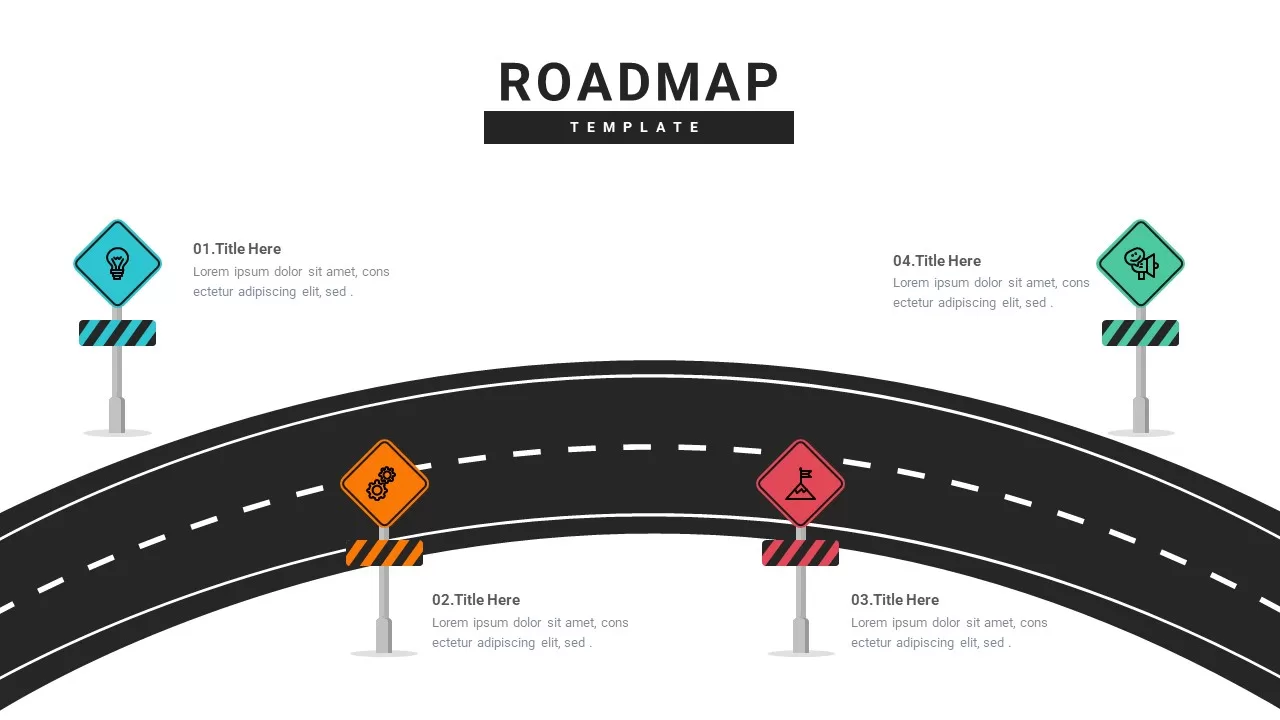
Curved Roadmap with Iconic Signposts Template for PowerPoint & Google Slides
Roadmap
Multi-color Curved Timeline Roadmap Template for PowerPoint & Google Slides
Timeline
Curved Line Graph for PowerPoint & Google Slides
Timeline
Curved Roadmap with Milestones Slide for PowerPoint & Google Slides
Roadmap
Free
Free Six-Stage Arrow Process Diagram Template for PowerPoint & Google Slides
Process
Free
Different Directional Arrow Infographic Template for PowerPoint & Google Slides
Arrow
Five 3D Growth Arrow Infographic Slide Template for PowerPoint & Google Slides
Arrow
Marketing Strategy Arrow Infographic Template for PowerPoint & Google Slides
Comparison

Arrow Infographic Template for PowerPoint & Google Slides
Arrow
Two Directional Arrow Infographic Template for PowerPoint & Google Slides
Arrow
Five-Stage Growth Arrow Infographic Template for PowerPoint & Google Slides
Arrow

Eight Post-It Note Arrow Infographic Template for PowerPoint & Google Slides
Arrow
Four-Step Arrow Process Infographic Template for PowerPoint & Google Slides
Arrow
Arrow Timeline Infographic Slide Template for PowerPoint & Google Slides
Timeline
Four-Option 4-Step Arrow Infographic Template for PowerPoint & Google Slides
Arrow
Dynamic Growth Arrow Step Infographic Template for PowerPoint & Google Slides
Process
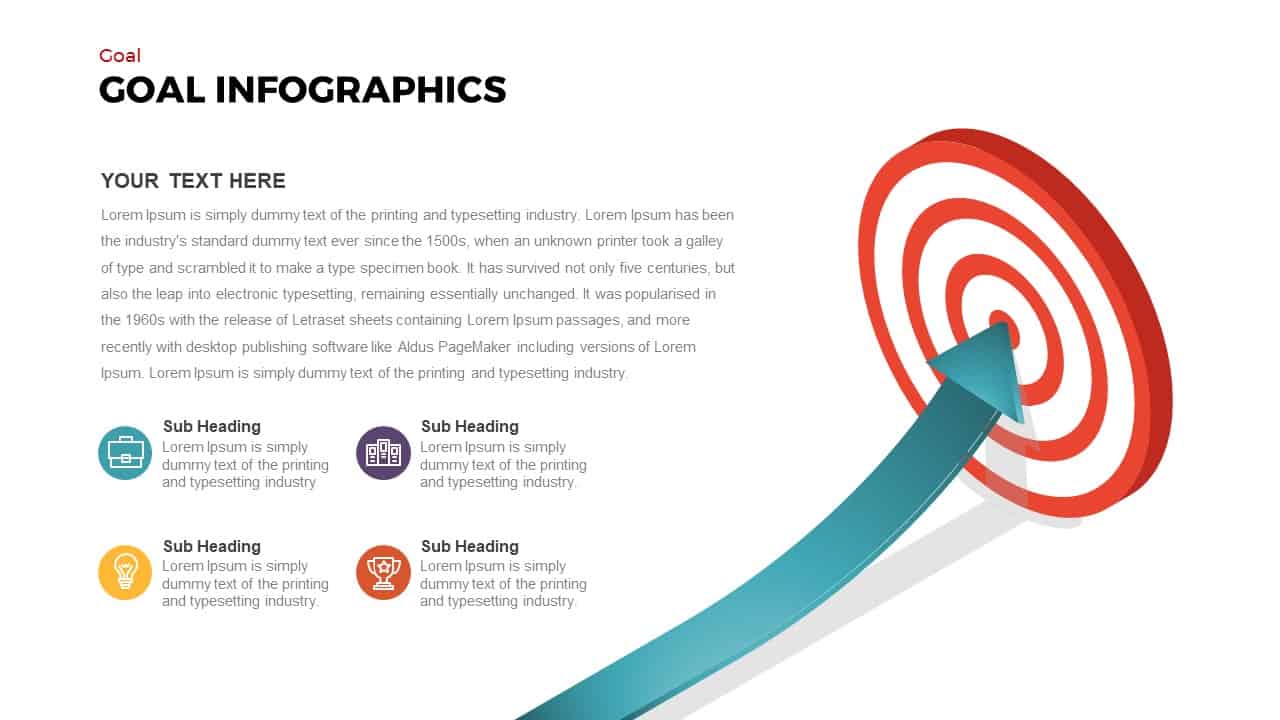
Goal Arrow and Target Infographic Template for PowerPoint & Google Slides
Goals

4-Way Radial Arrow Infographic Template for PowerPoint & Google Slides
Arrow
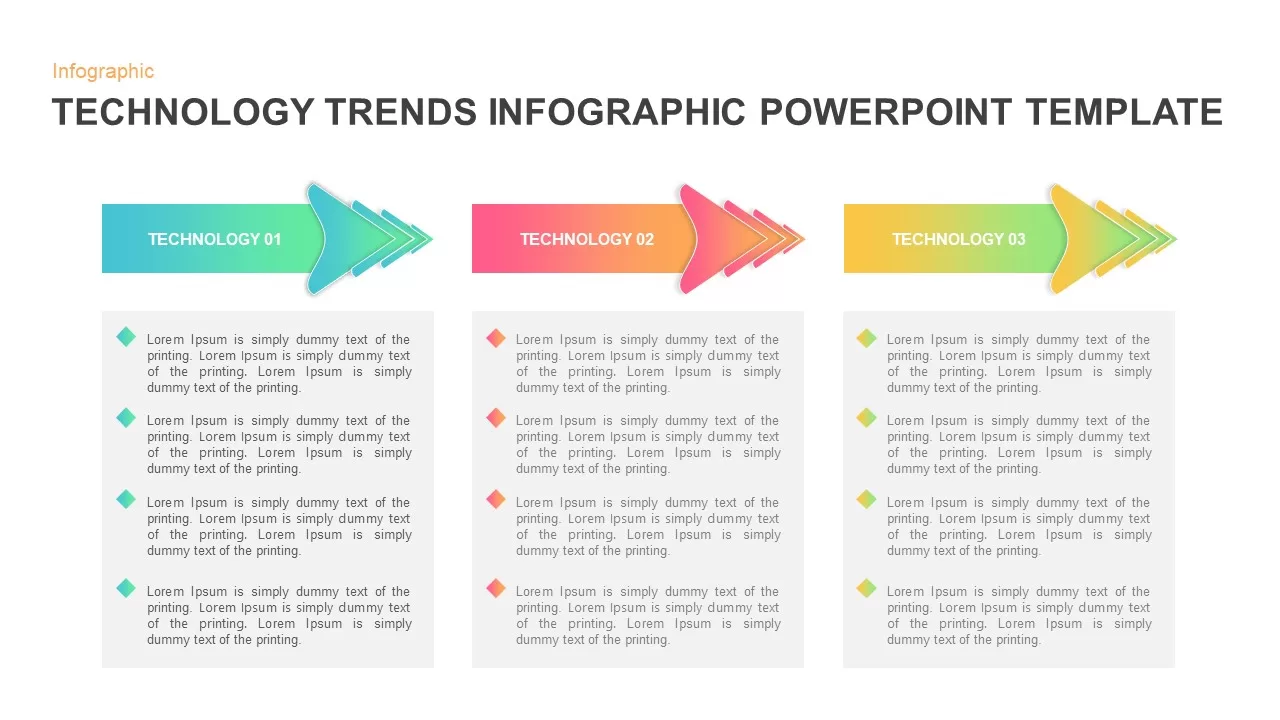
Technology Arrow Infographic Template for PowerPoint & Google Slides
Pitch Deck
Upward Arrow infographic template for PowerPoint & Google Slides
Infographics
Arrow infographic template for PowerPoint & Google Slides
Business
Four-Stage Circle Arrow Infographic Template for PowerPoint & Google Slides
Circular
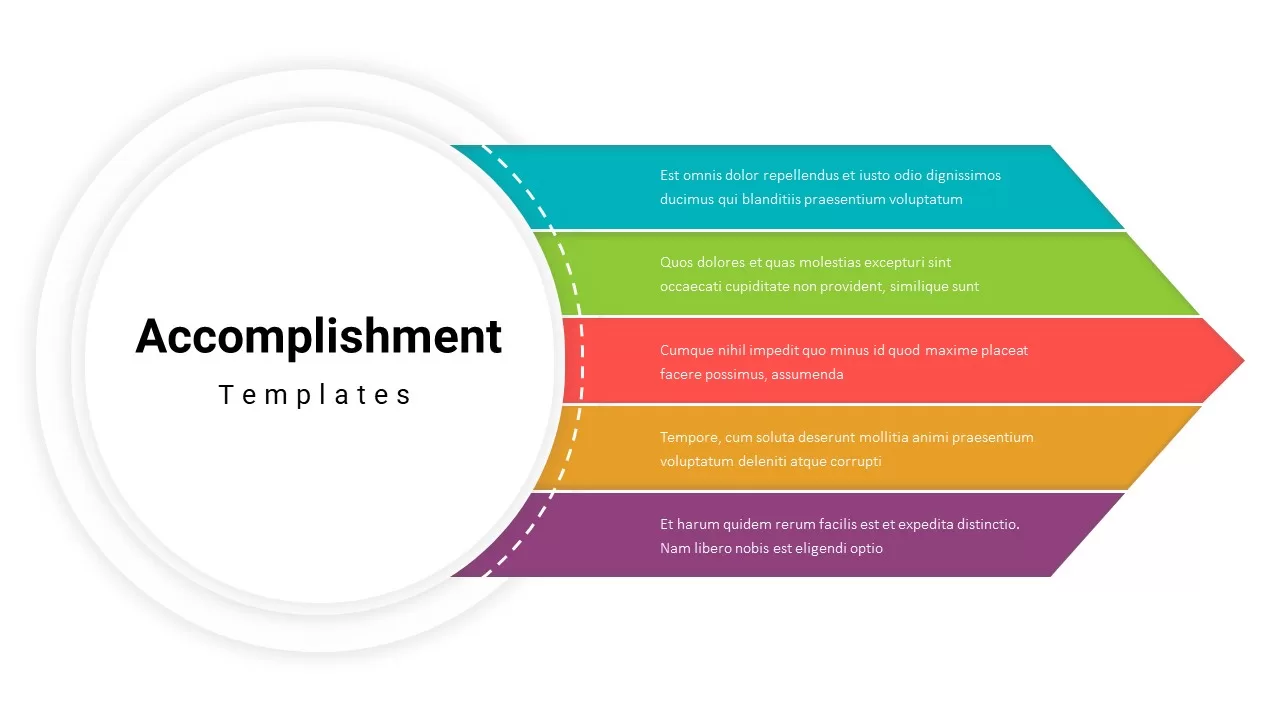
Accomplishment Arrow Infographic Template for PowerPoint & Google Slides
Accomplishment
Five-Stage Circular Arrow Infographic Template for PowerPoint & Google Slides
Circular
Four-Stage Circle Arrow Infographic Template for PowerPoint & Google Slides
Circular
Six-Segment Circular Arrow Infographic Template for PowerPoint & Google Slides
Circular
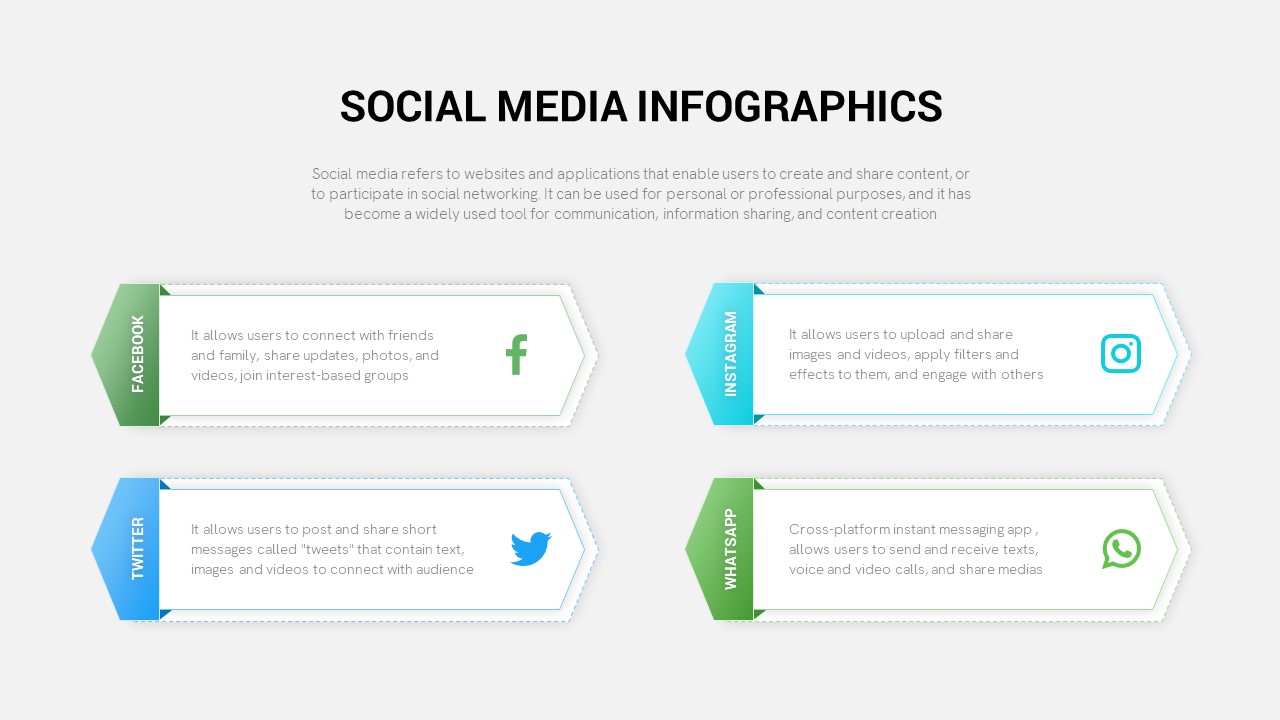
Social Media Infographic Arrow Layout Template for PowerPoint & Google Slides
Arrow
Bow and Arrow Goal Infographic Slide Template for PowerPoint & Google Slides
Goals
5-Step Arrow Diagram template for PowerPoint & Google Slides
Arrow
3D Four Arrow Infographics Diagram Template for PowerPoint & Google Slides
Arrow
Six Arrow Radial Process Diagram template for PowerPoint & Google Slides
Infographics
Arrow Process Diagram Template for PowerPoint & Google Slides
Process
Three Circle Arrow Process Diagram template for PowerPoint & Google Slides
Circular
5 Arrow Diagram template for PowerPoint & Google Slides
Arrow
3D Sphere Arrow Process Diagram template for PowerPoint & Google Slides
Arrow
Arrow Stage Process Diagram template for PowerPoint & Google Slides
Arrow
Four Directional Arrow Diagram Template for PowerPoint & Google Slides
Arrow
Five-Section Circular Arrow Diagram Template for PowerPoint & Google Slides
Circular
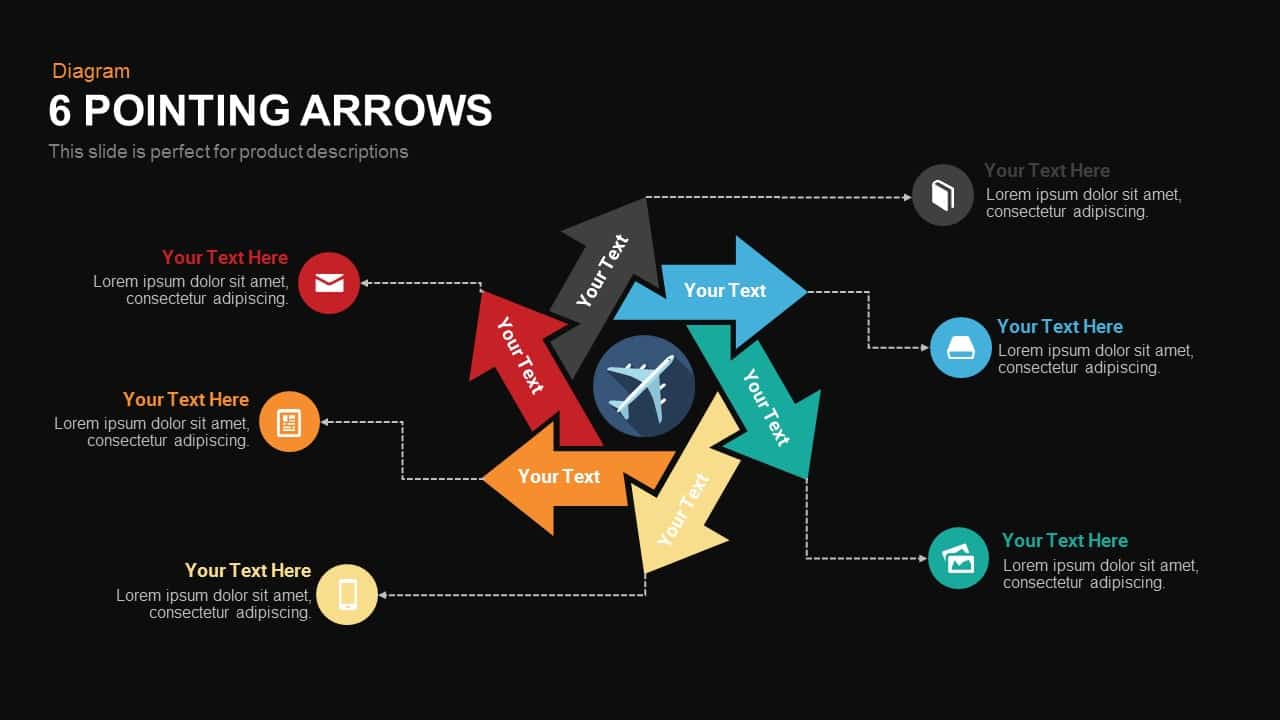
Six Pointing Arrow Process Diagram Template for PowerPoint & Google Slides
Arrow
Seven-Stage Arrow Process Diagram Template for PowerPoint & Google Slides
Process
Five-Stage Zig-Zag Arrow Diagram Template for PowerPoint & Google Slides
Process
Five-Section Arrow Signpost Diagram Template for PowerPoint & Google Slides
Arrow
Five-Stage Circle Arrow Diagram Template for PowerPoint & Google Slides
Circular
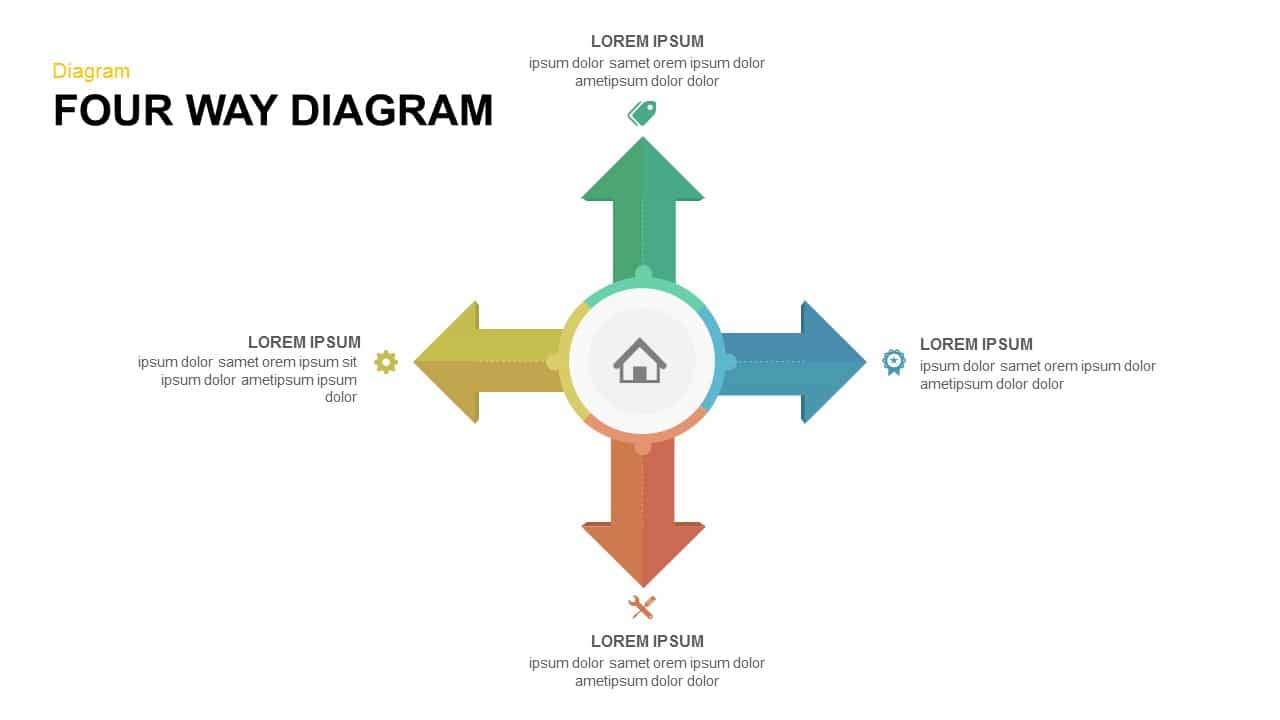
Four-Way Directional Arrow Diagram Template for PowerPoint & Google Slides
Arrow
Timeline Arrow Infographics Diagram Template for PowerPoint & Google Slides
Timeline
Five-Stage Pentagon Arrow Diagram Template for PowerPoint & Google Slides
Arrow
Seven-Segment Circular Arrow Diagram Template for PowerPoint & Google Slides
Arrow
8-Step Circular Arrow Diagram Template for PowerPoint & Google Slides
Arrow
8 Steps Arrow Process Diagram template for PowerPoint & Google Slides
Process
Pros & Cons Arrow Diagram template for PowerPoint & Google Slides
Comparison Chart

Elegant Process Support Arrow Diagram Template for PowerPoint & Google Slides
Arrow
Four-Point Arrow Cycle Diagram Template for PowerPoint & Google Slides
Arrow
Six-Step Two-Sided Arrow Diagram Template for PowerPoint & Google Slides
Process
Five-Stage Cyclic Process Arrow Diagram Template for PowerPoint & Google Slides
Process
Eight-Stage Zigzag Arrow Diagram Template for PowerPoint & Google Slides
Process
Six-Step Linear Arrow Process Diagram Template for PowerPoint & Google Slides
Process
Eight-Step Inward Arrow Diagram Template for PowerPoint & Google Slides
Arrow
Three-Way Decision Process Arrow Diagram Template for PowerPoint & Google Slides
Arrow
Five Stage Circular Arrow Diagram Template for PowerPoint & Google Slides
Process
Six-Stage Arrow Timeline Diagram Template for PowerPoint & Google Slides
Timeline
Agile Work Streams Arrow Diagram Template for PowerPoint & Google Slides
Process
Concentric Circular Arrow Cycle Diagram Template for PowerPoint & Google Slides
Process
Circular Arrow Process Diagram Template for PowerPoint & Google Slides
Circular
Pentagon Arrow Process Diagram Template for PowerPoint & Google Slides
Process
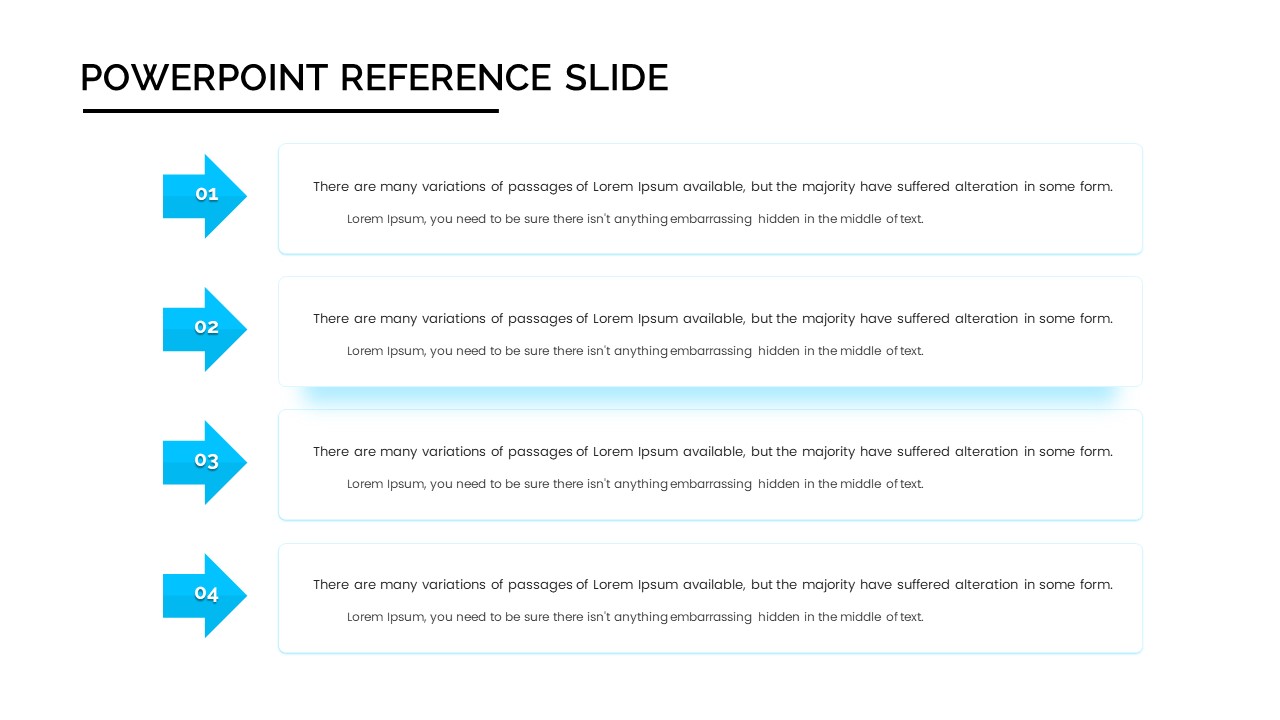
Four-Step Arrow Reference Diagram Slide Template for PowerPoint & Google Slides
Arrow
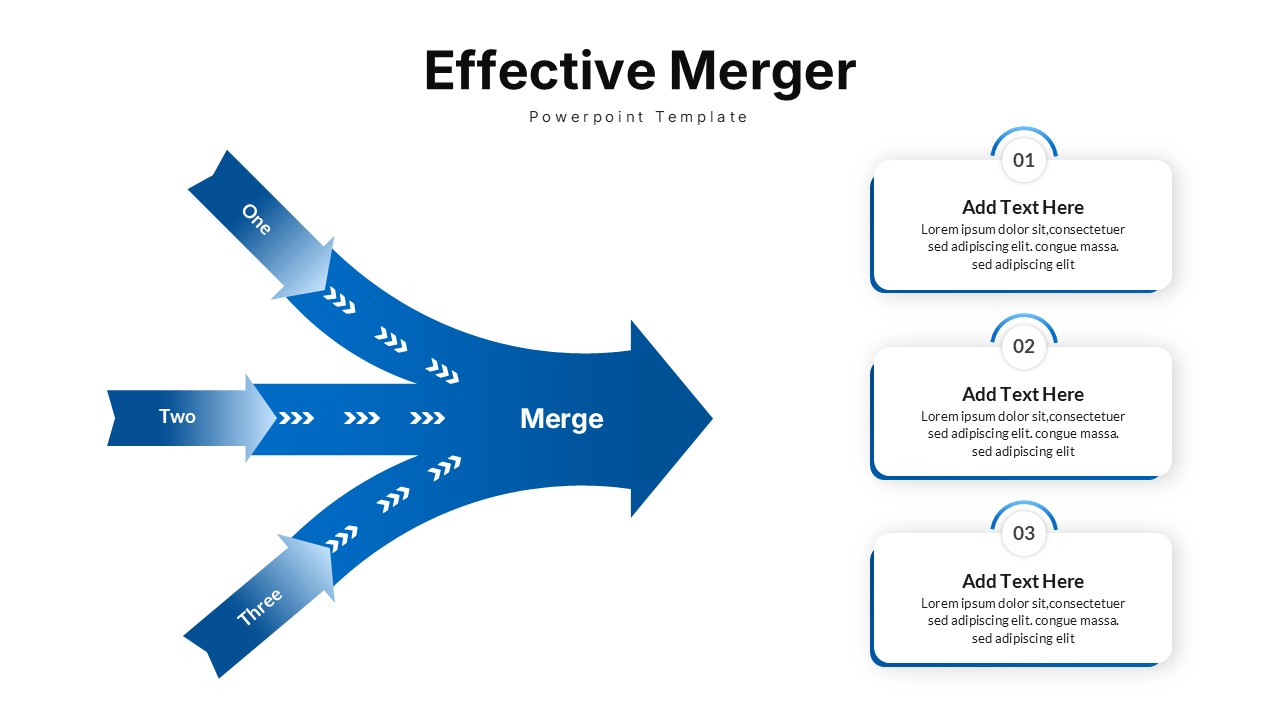
Effective Merger Arrow Diagram Template for PowerPoint & Google Slides
Arrow