Free Color-Coded Fishbone Diagram Template for PowerPoint & Google Slides

Description
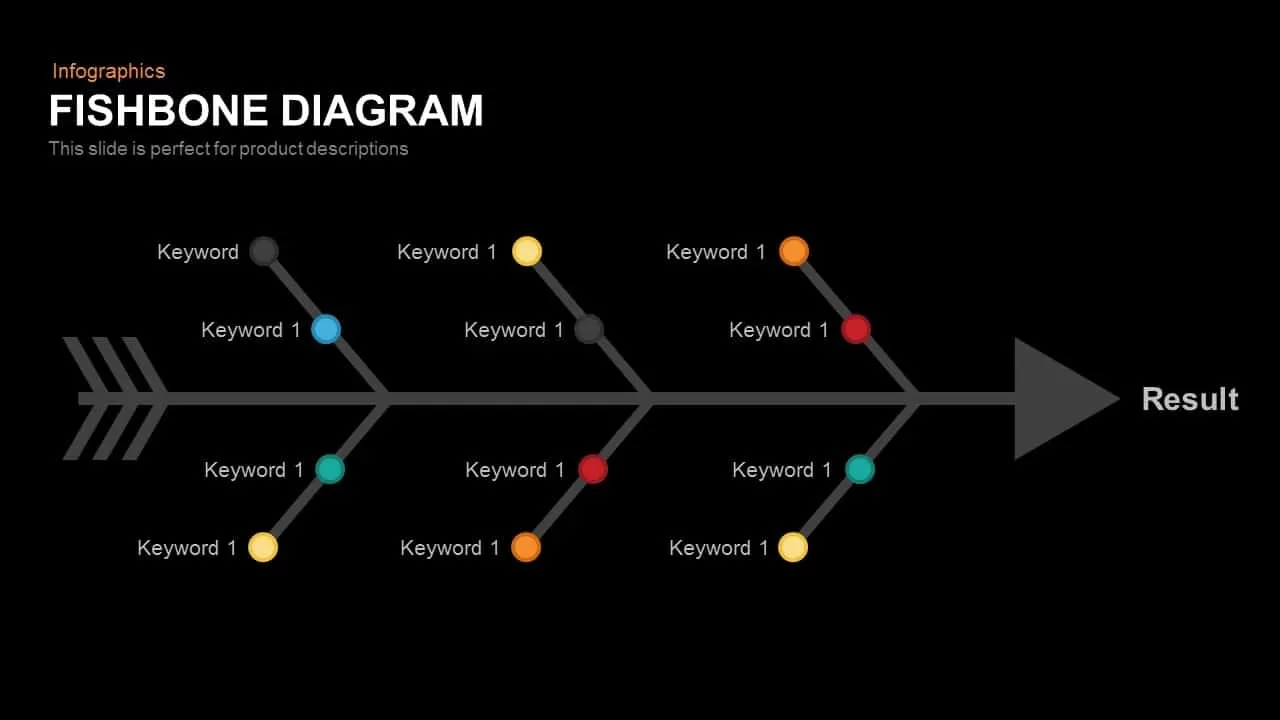
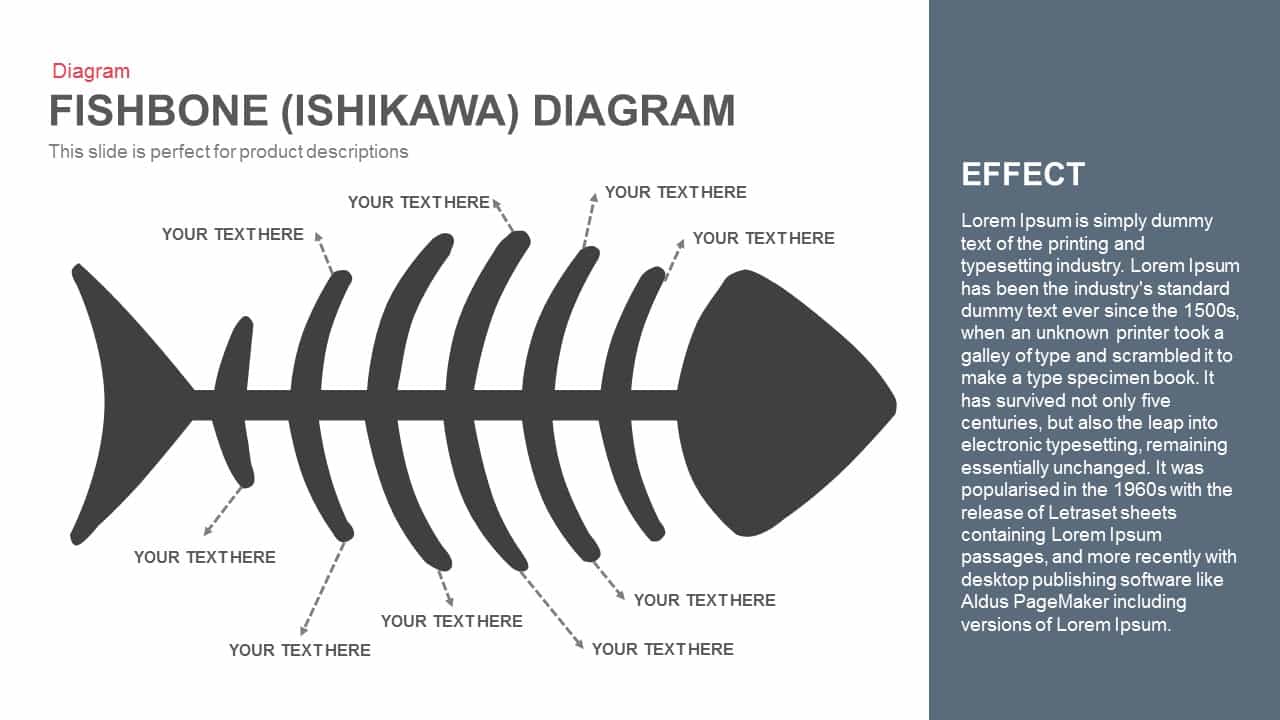
Identify root causes and streamline problem-solving discussions with this professional Fishbone Diagram template. Also known as an Ishikawa or cause-and-effect diagram, this slide uses a structured arrow format to visually categorize multiple contributing factors around a central problem or outcome. With six labeled branches—three on each side—color-coded in blue, green, and orange, users can easily distinguish between different categories of causes. Each branch includes multiple text placeholders for listing specific issues or contributing elements. The horizontal flow and clean layout support clear, logical communication during quality management presentations, root cause analysis, or strategic planning sessions.
Who is it for
This template is ideal for quality managers, process improvement teams, Six Sigma practitioners, engineers, analysts, and business consultants who need to identify and explain the root causes of issues in operational, product, or project environments. It’s also useful for educators teaching structured problem-solving methodologies.
Other Uses
In addition to traditional root cause analysis, use this diagram for project troubleshooting, brainstorming sessions, product development reviews, strategic planning, or risk assessments. It’s an effective tool for team workshops, training sessions, and executive presentations focused on continuous improvement or workflow optimization.
Login to download this file

Item ID
SBF00025
Related Templates

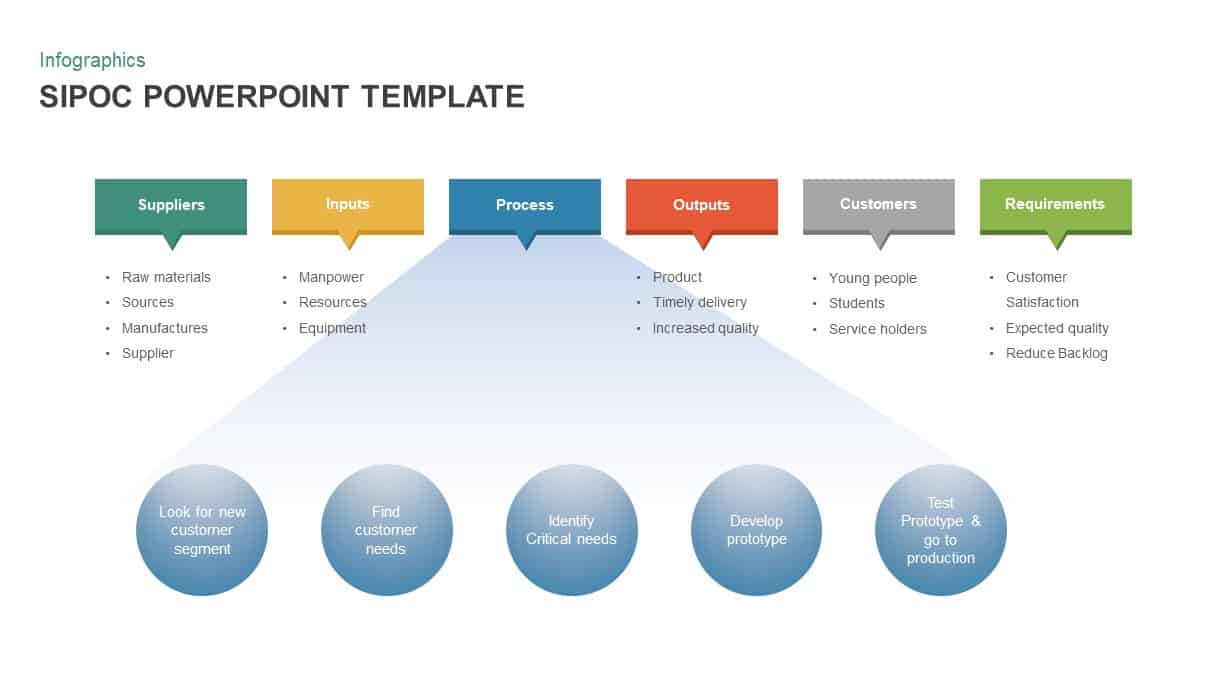
Color-Coded SIPOC Diagram with Process Flow for PowerPoint & Google Slides
Process

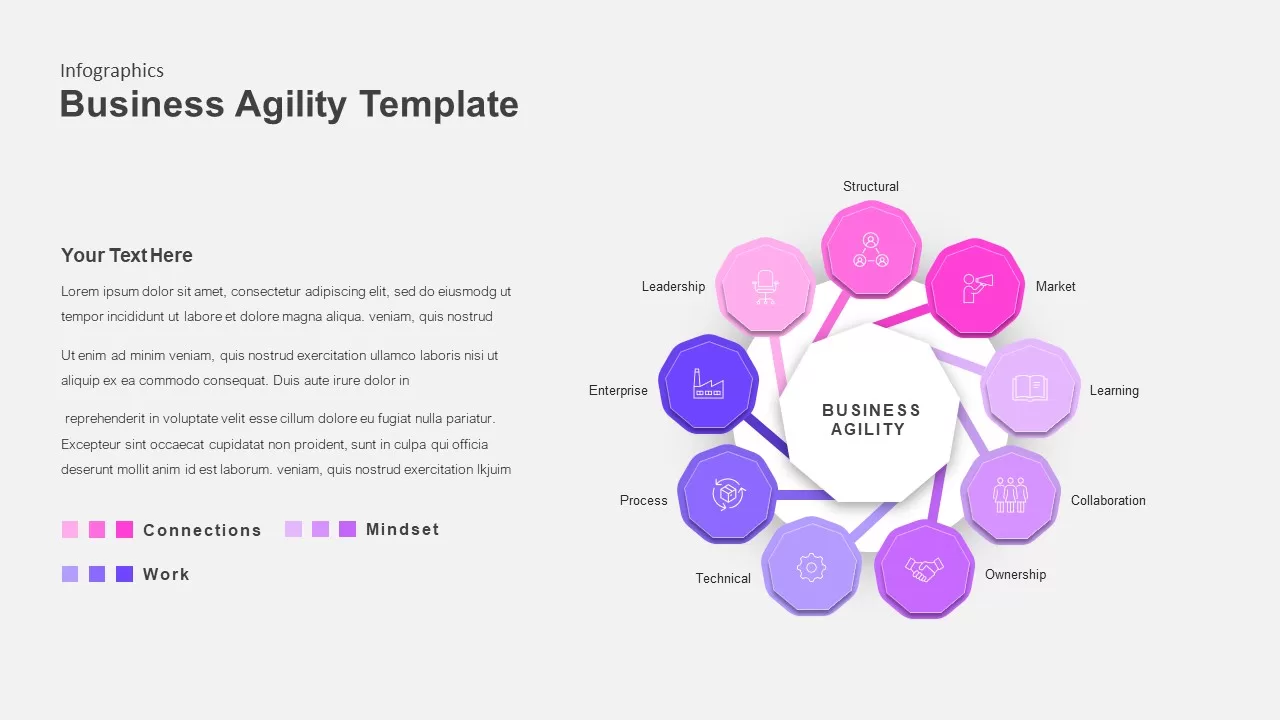
Color-Coded Business Agility Radial Template for PowerPoint & Google Slides
Business
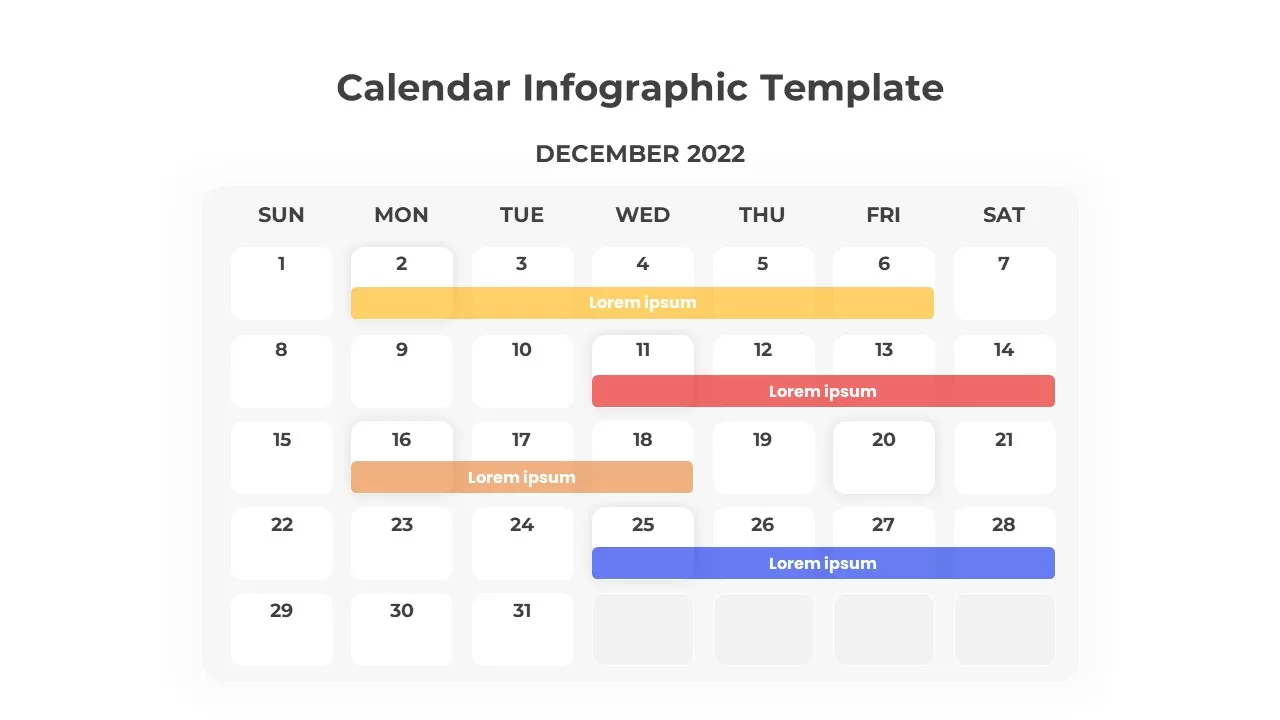
Color-Coded Calendar Infographic Template for PowerPoint & Google Slides
Infographics
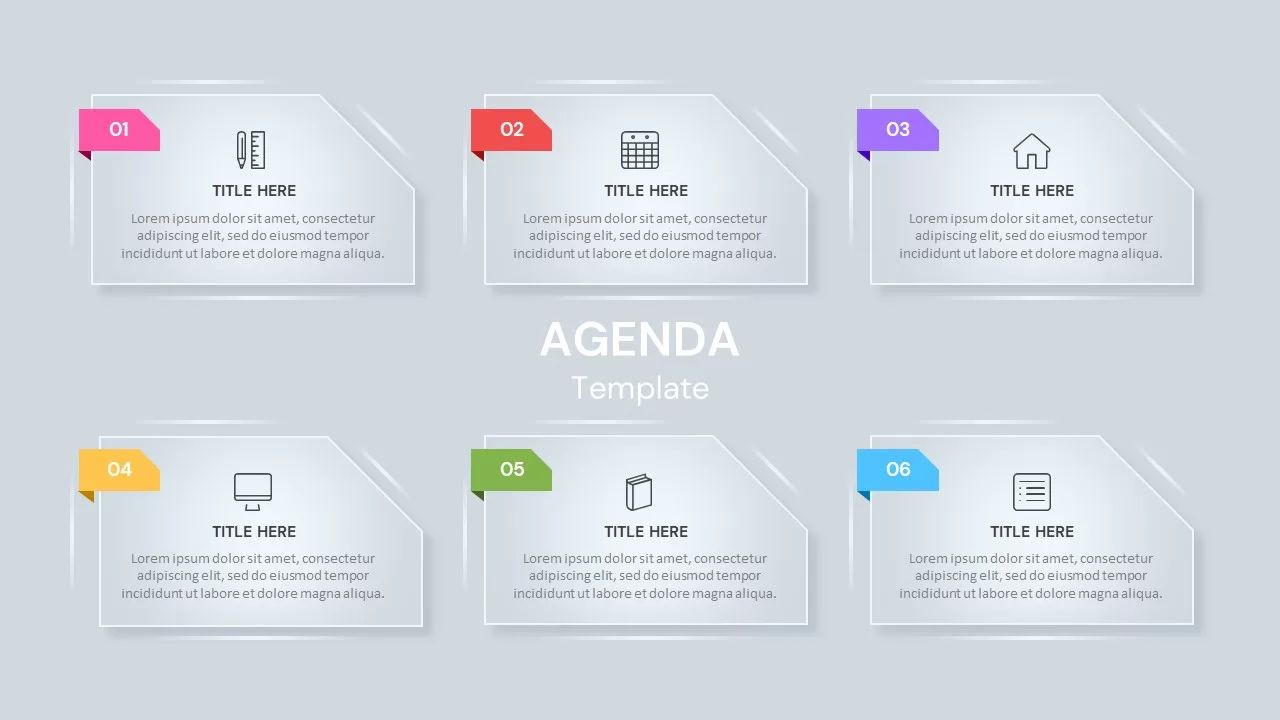
Six-Section Color-Coded Agenda Template for PowerPoint & Google Slides
Agenda
Six-Step Color-Coded Table of Contents Template for PowerPoint & Google Slides
Agenda
Color-Coded Project Status Template for PowerPoint & Google Slides
Project Status
Color-Coded Project Status Slide Template for PowerPoint & Google Slides
Project Status
Color-Coded Waste Management Bins Template for PowerPoint & Google Slides
Comparison
Blank Two-Tier Color-Coded Timeline Template for PowerPoint & Google Slides
Timeline
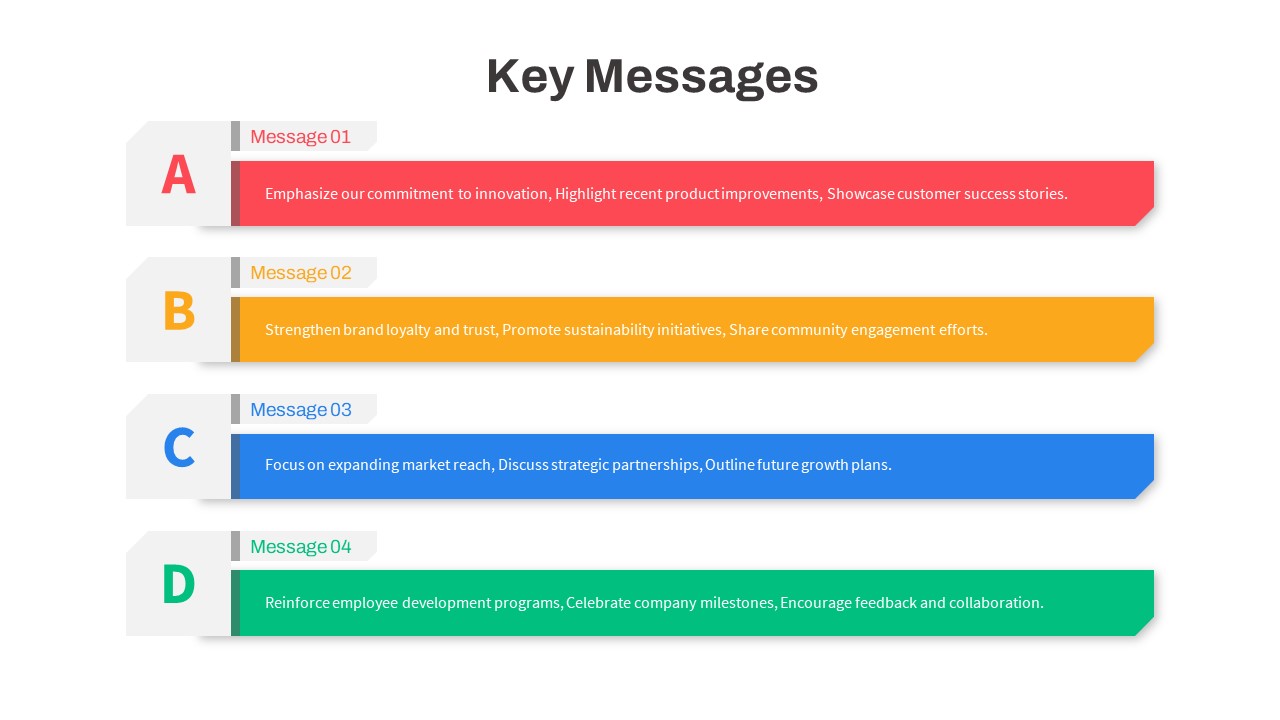
Color-Coded Corporate Key Messages Template for PowerPoint & Google Slides
Process
Color-Coded Gantt Chart template for PowerPoint & Google Slides
Business
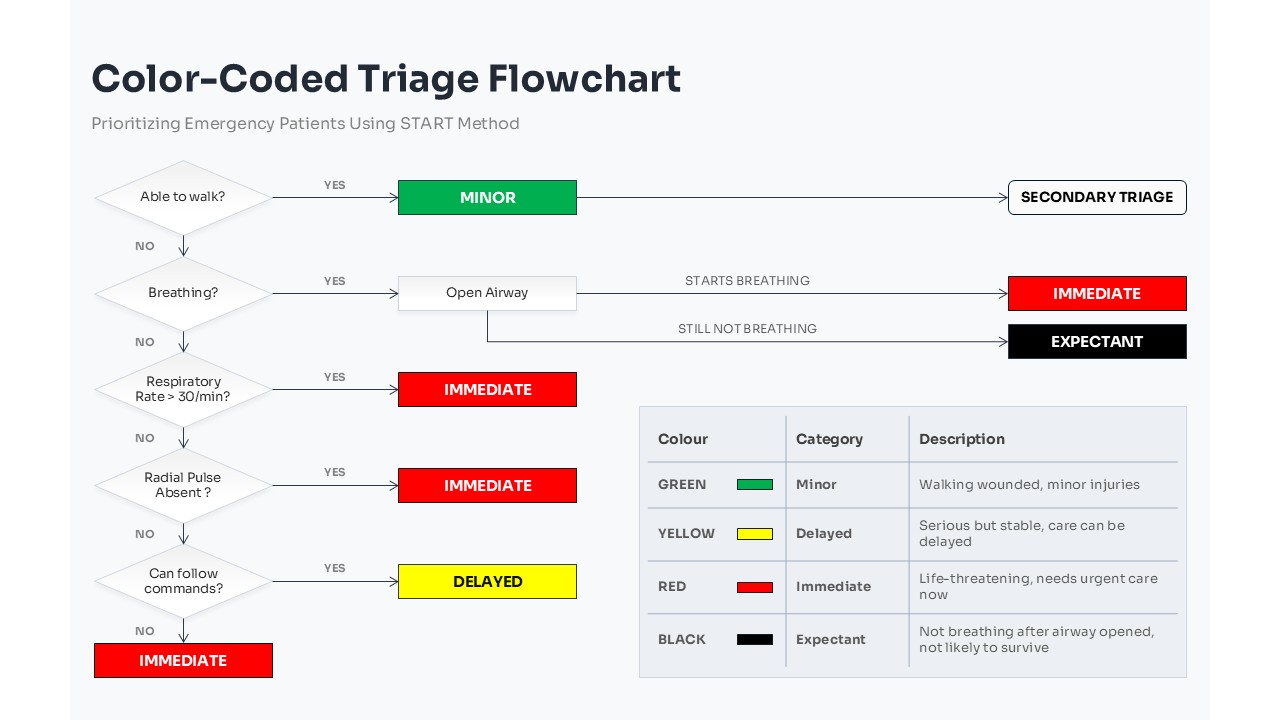
Color-Coded Medical Triage Flowchart Template for PowerPoint & Google Slides
Flow Charts
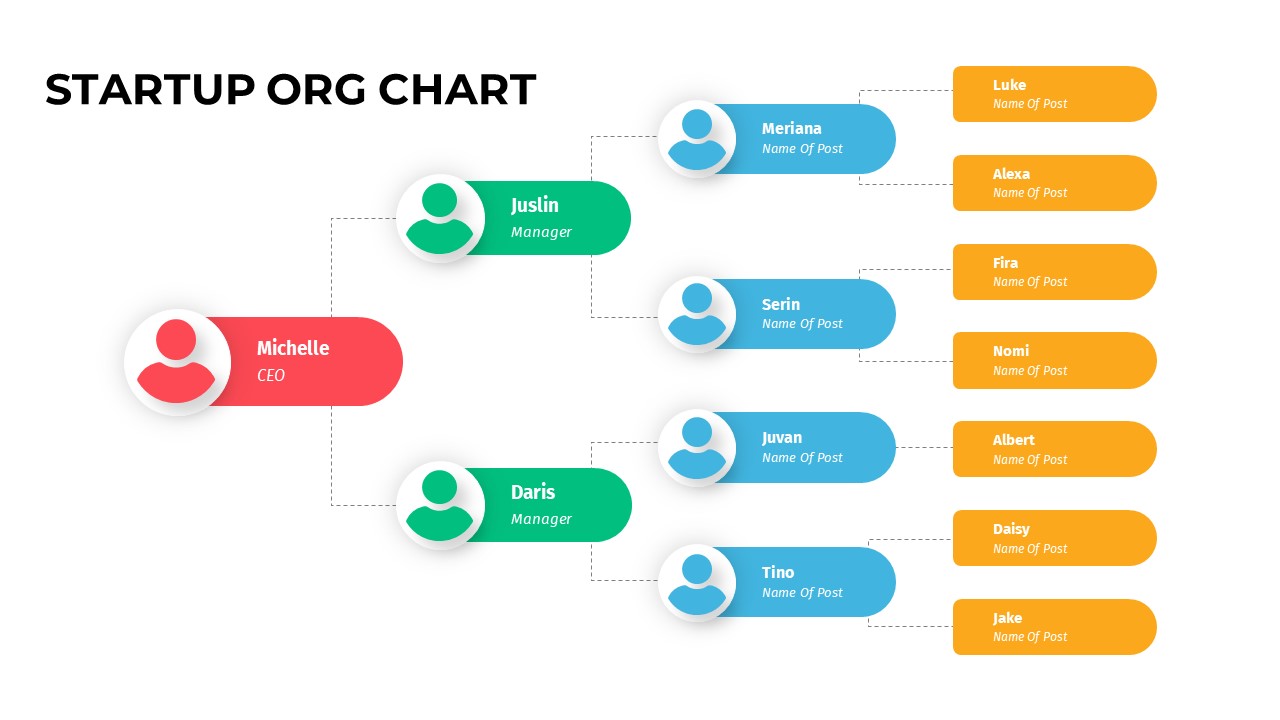
Color-Coded Startup Org Chart Slide for PowerPoint & Google Slides
Org Chart
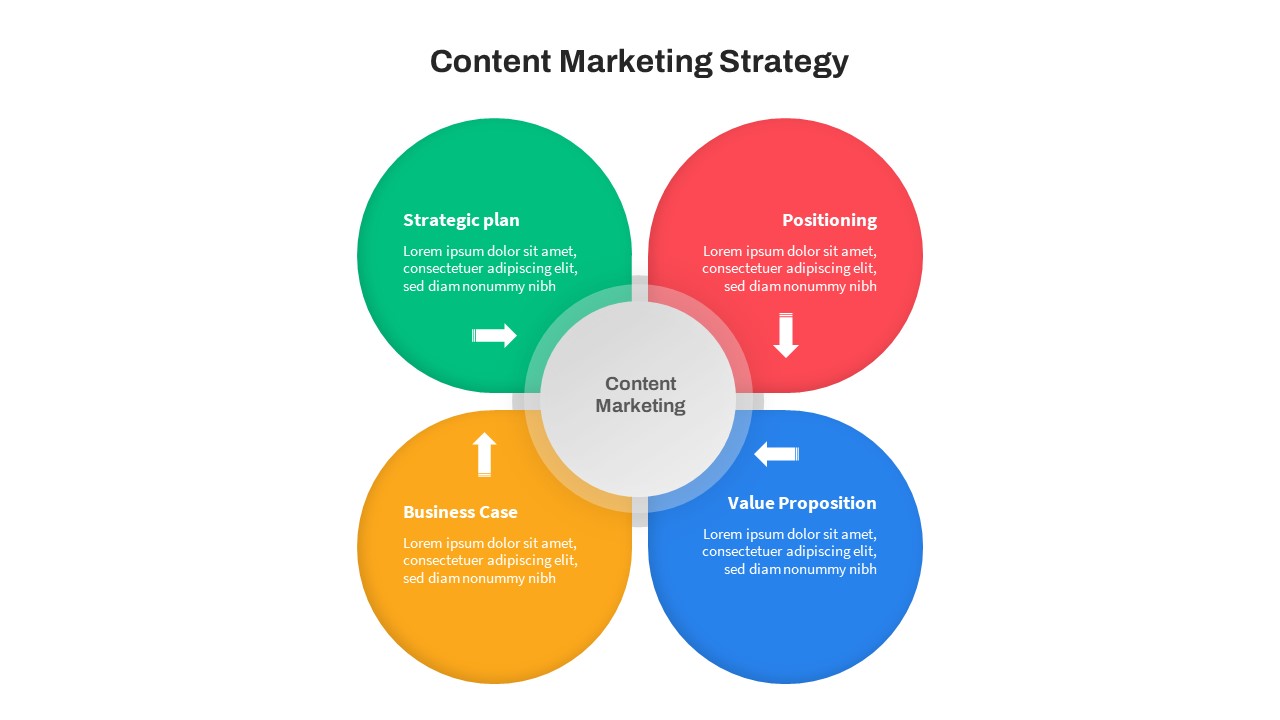
Color-Coded Content Marketing Strategy Slide for PowerPoint & Google Slides
Marketing
Free Root Cause Analysis Fishbone Diagram Template for PowerPoint & Google Slides
Process
Free
Free Minimal Multi-Color Table of Contents Template for PowerPoint & Google Slides
Agenda
Free
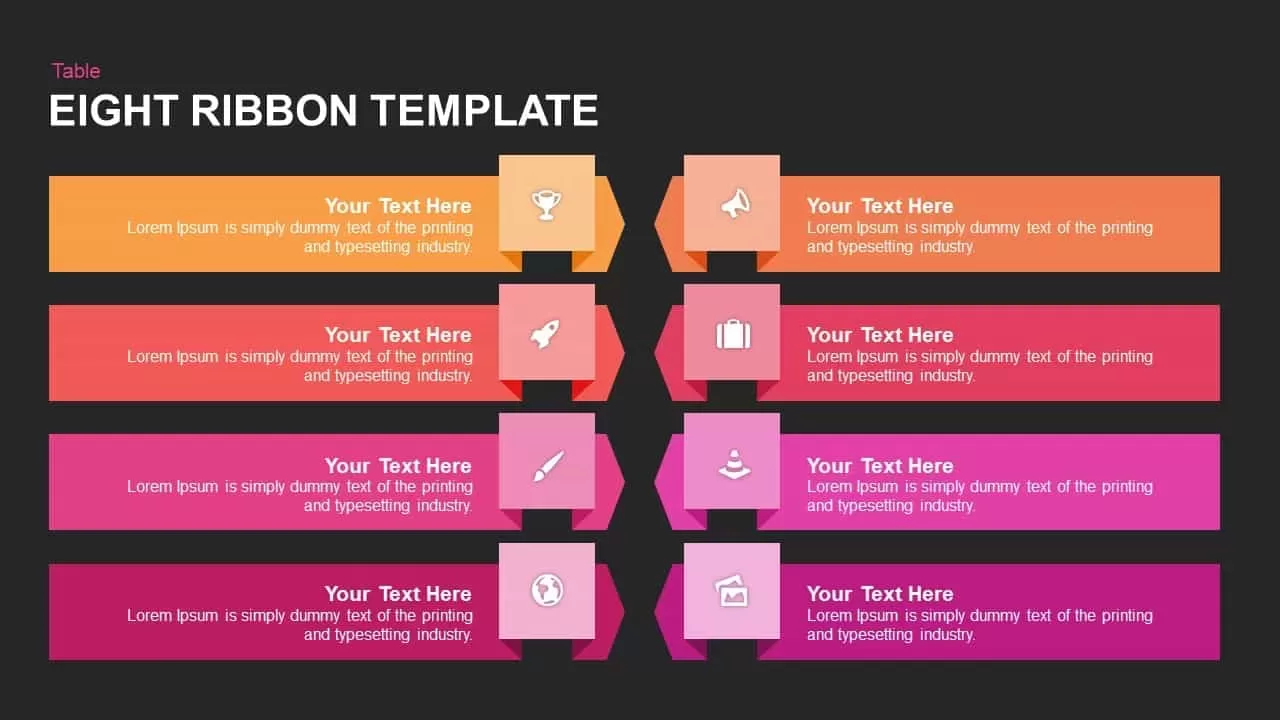
Multi-Color Eight-Step Ribbon Diagram Template for PowerPoint & Google Slides
Process
Multi-Color Enneagram Circular Diagram Template for PowerPoint & Google Slides
Circular
Modern Multi-Color Polar Chart Diagram Template for PowerPoint & Google Slides
Charts
Three-Section Fishbone Process Diagram template for PowerPoint & Google Slides
Process
Fishbone RCA Diagram Template for PowerPoint & Google Slides
Business Strategy
Fishbone Diagram Overview template for PowerPoint & Google Slides
Infographics
Fishbone Diagram Cause-and-Effect Template for PowerPoint & Google Slides
Process
Fishbone Cause and Effect Diagram Template for PowerPoint & Google Slides
Process
Fishbone Diagram Analysis Template for PowerPoint & Google Slides
Flow Charts
Fishbone Cause Analysis Diagram Template for PowerPoint & Google Slides
Process
Underwater Fishbone Cause-Effect Diagram Template for PowerPoint & Google Slides
Process
Fishbone Process Diagram template for PowerPoint & Google Slides
Infographics
Fishbone (Ishikawa) Diagram for PowerPoint & Google Slides
Process
5 Why Fishbone Diagram for Root Cause Analysis in PowerPoint & Google Slides
Process

Blured Color Duo Pitch Template for PowerPoint & Google Slides
Company Profile

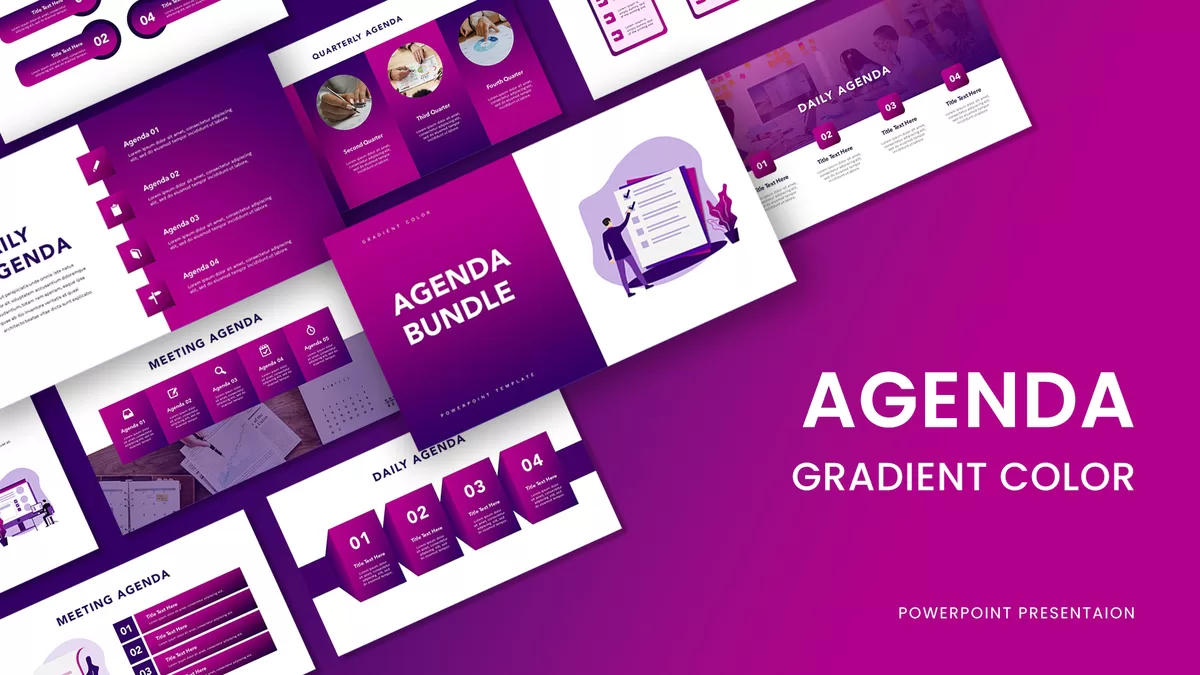
Gradient Color Agenda Slide Bundle Template for PowerPoint & Google Slides
Agenda
Multi-Color Five-Step Curved Arrow Template for PowerPoint & Google Slides
Process
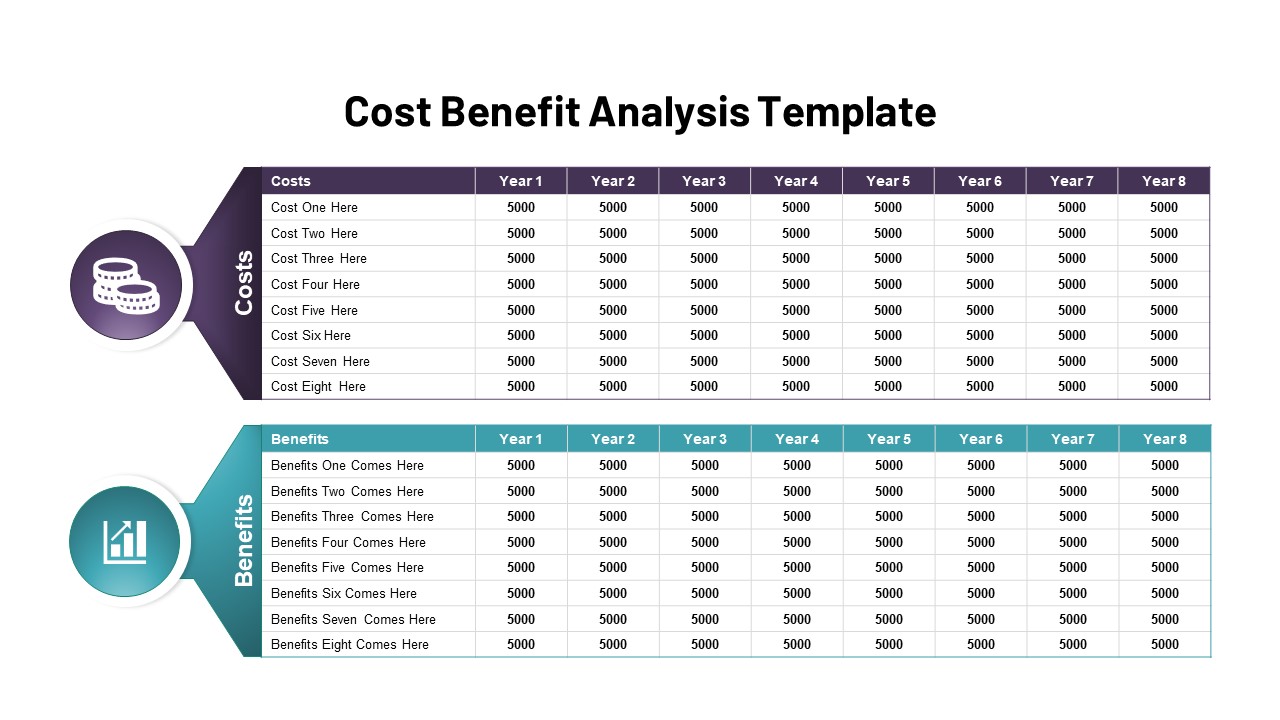
Dual-Color Cost vs Benefit Analysis Template for PowerPoint & Google Slides
Comparison
Purple Color Presentation Template for PowerPoint & Google Slides
Company Profile
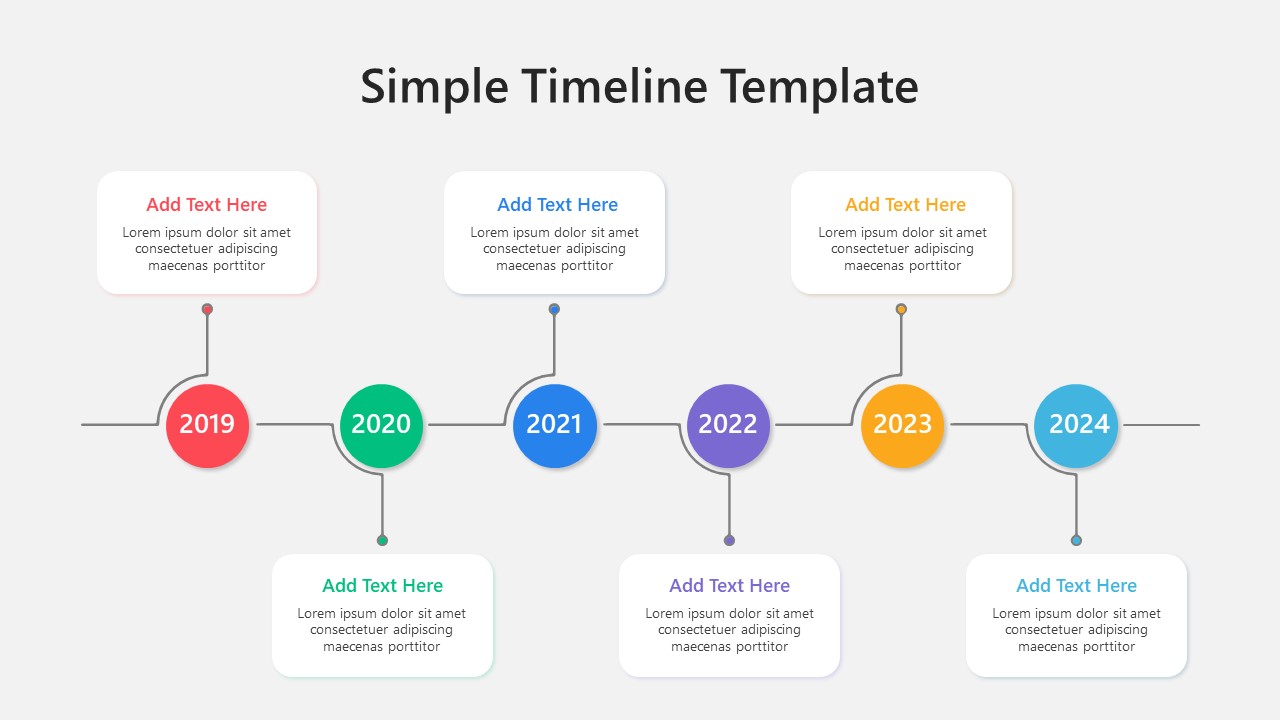
Multi-Color Milestone Timeline Layout Template for PowerPoint & Google Slides
Timeline
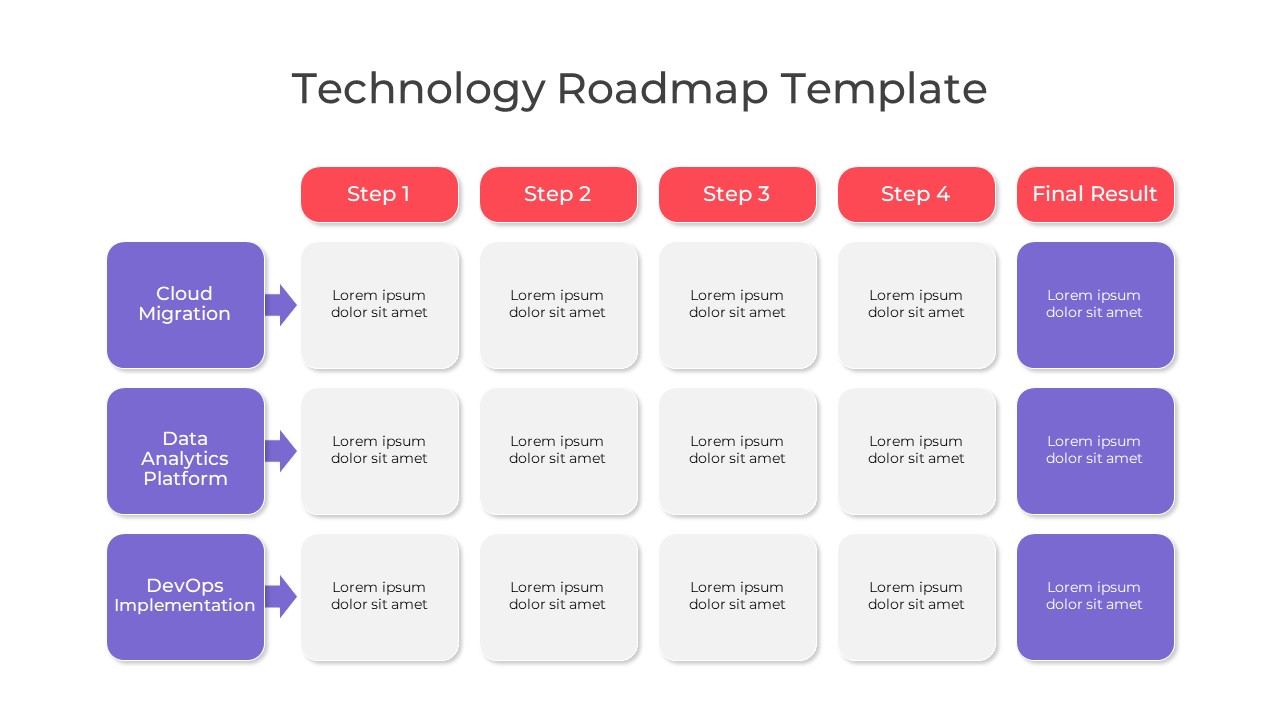
Multi-Color Technology Roadmap Template Pack for PowerPoint & Google Slides
Roadmap
Multi-color Curved Timeline Roadmap Template for PowerPoint & Google Slides
Timeline
Multi Color SWOT Analysis Quadrant Template for PowerPoint & Google Slides
SWOT
3D Color Block Organizational Chart Slide for PowerPoint & Google Slides
Org Chart
Fishbone Cause and Effect Infographic Template for PowerPoint & Google Slides
Infographics
Fishbone Timeline Infographic Series Template for PowerPoint & Google Slides
Manufacturing
Free Eight Circle Creative Diagram template for PowerPoint & Google Slides
Circular
Free
Free Six Stage Bubble Process Diagram template for PowerPoint & Google Slides
Process
Free
Free Six-Stage Arrow Process Diagram Template for PowerPoint & Google Slides
Process
Free
Free Bulb Puzzle Infographics Diagram Template for PowerPoint & Google Slides
Process
Free
Free 4-Step 3D Funnel Diagram Template for PowerPoint & Google Slides
Funnel
Free

Free Simple Venn Diagram Overview template for PowerPoint & Google Slides
Comparison Chart
Free
Free Venn Diagram template for PowerPoint & Google Slides
Charts
Free
Free Circular Multi-Step Flow Chart Diagram Template for PowerPoint & Google Slides
Flow Charts
Free
Free Curved Arrow Infographic Diagram Template for PowerPoint & Google Slides
Arrow
Free
Free Journey Slide with Four Icons Diagram Template for PowerPoint & Google Slides
Process
Free
Free Animated DNA Infographic Diagram Template for PowerPoint & Google Slides
Infographics
Free
Free Vision and Mission Target Diagram Template for PowerPoint & Google Slides
Vision and Mission
Free
Free Editable Family Tree Genealogy Diagram Template for PowerPoint & Google Slides
Org Chart
Free
Free Brain Function Diagram Infographic Template for PowerPoint & Google Slides
Process
Free
Free Business Development Funnel Diagram Template for PowerPoint & Google Slides
Marketing Funnel
Free
Free UI/UX Process Timeline Diagram Template for PowerPoint & Google Slides
Process
Free
Free Value Proposition Diagram Template for PowerPoint & Google Slides
Business Strategy
Free
Free Time Management Clock Cycle Diagram Template for PowerPoint & Google Slides
Process
Free
Free Environmental Hub-and-Spoke Diagram Template for PowerPoint & Google Slides
Circular
Free
Free Business Model Canvas Diagram Slide Template for PowerPoint & Google Slides
Business Models
Free
Free Zodiac Horoscope Wheel Diagram Template for PowerPoint & Google Slides
Circular
Free
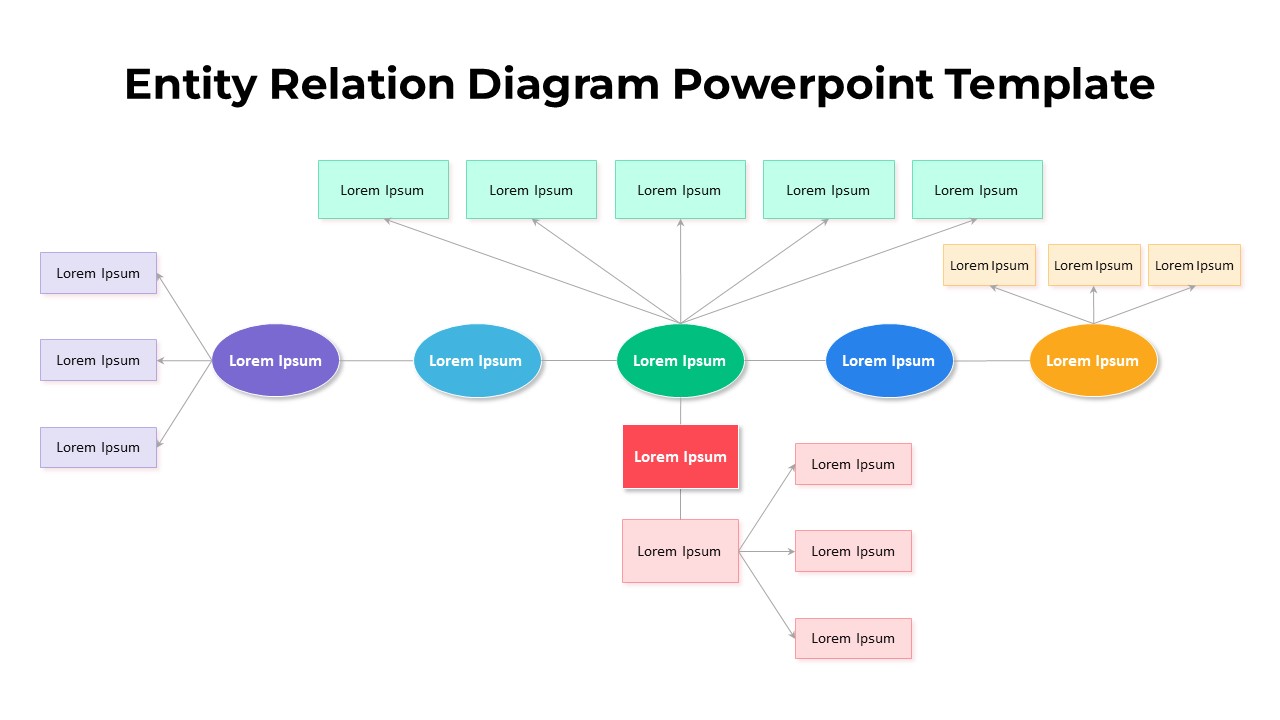
Free Entity Relation Diagram template for PowerPoint & Google Slides
Flow Charts
Free
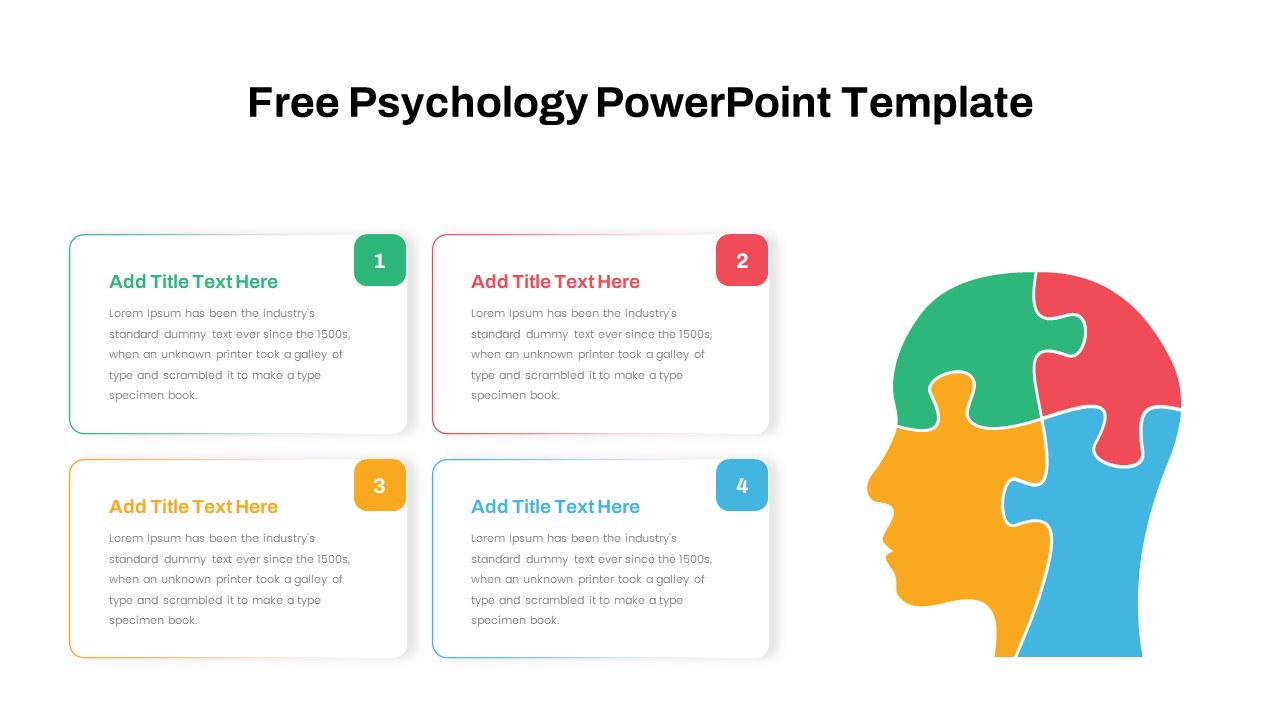
Free Psychology Puzzle Diagram Slide for PowerPoint & Google Slides
Comparison
Free
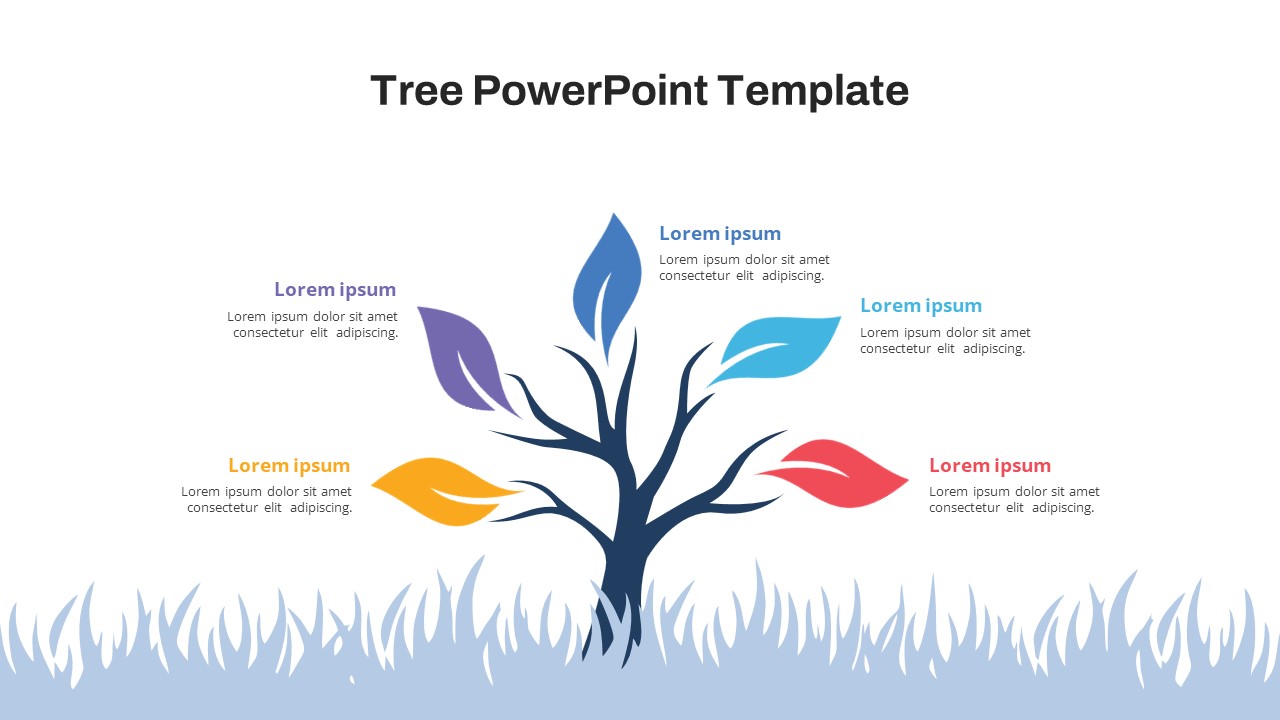
Free Colorful Tree Diagram for Growth & Strategy in PowerPoint & Google Slides
Infographics
Free
Free Professional Gantt Chart Pack – 4 Slides Template for PowerPoint & Google Slides
Gantt Chart
Free
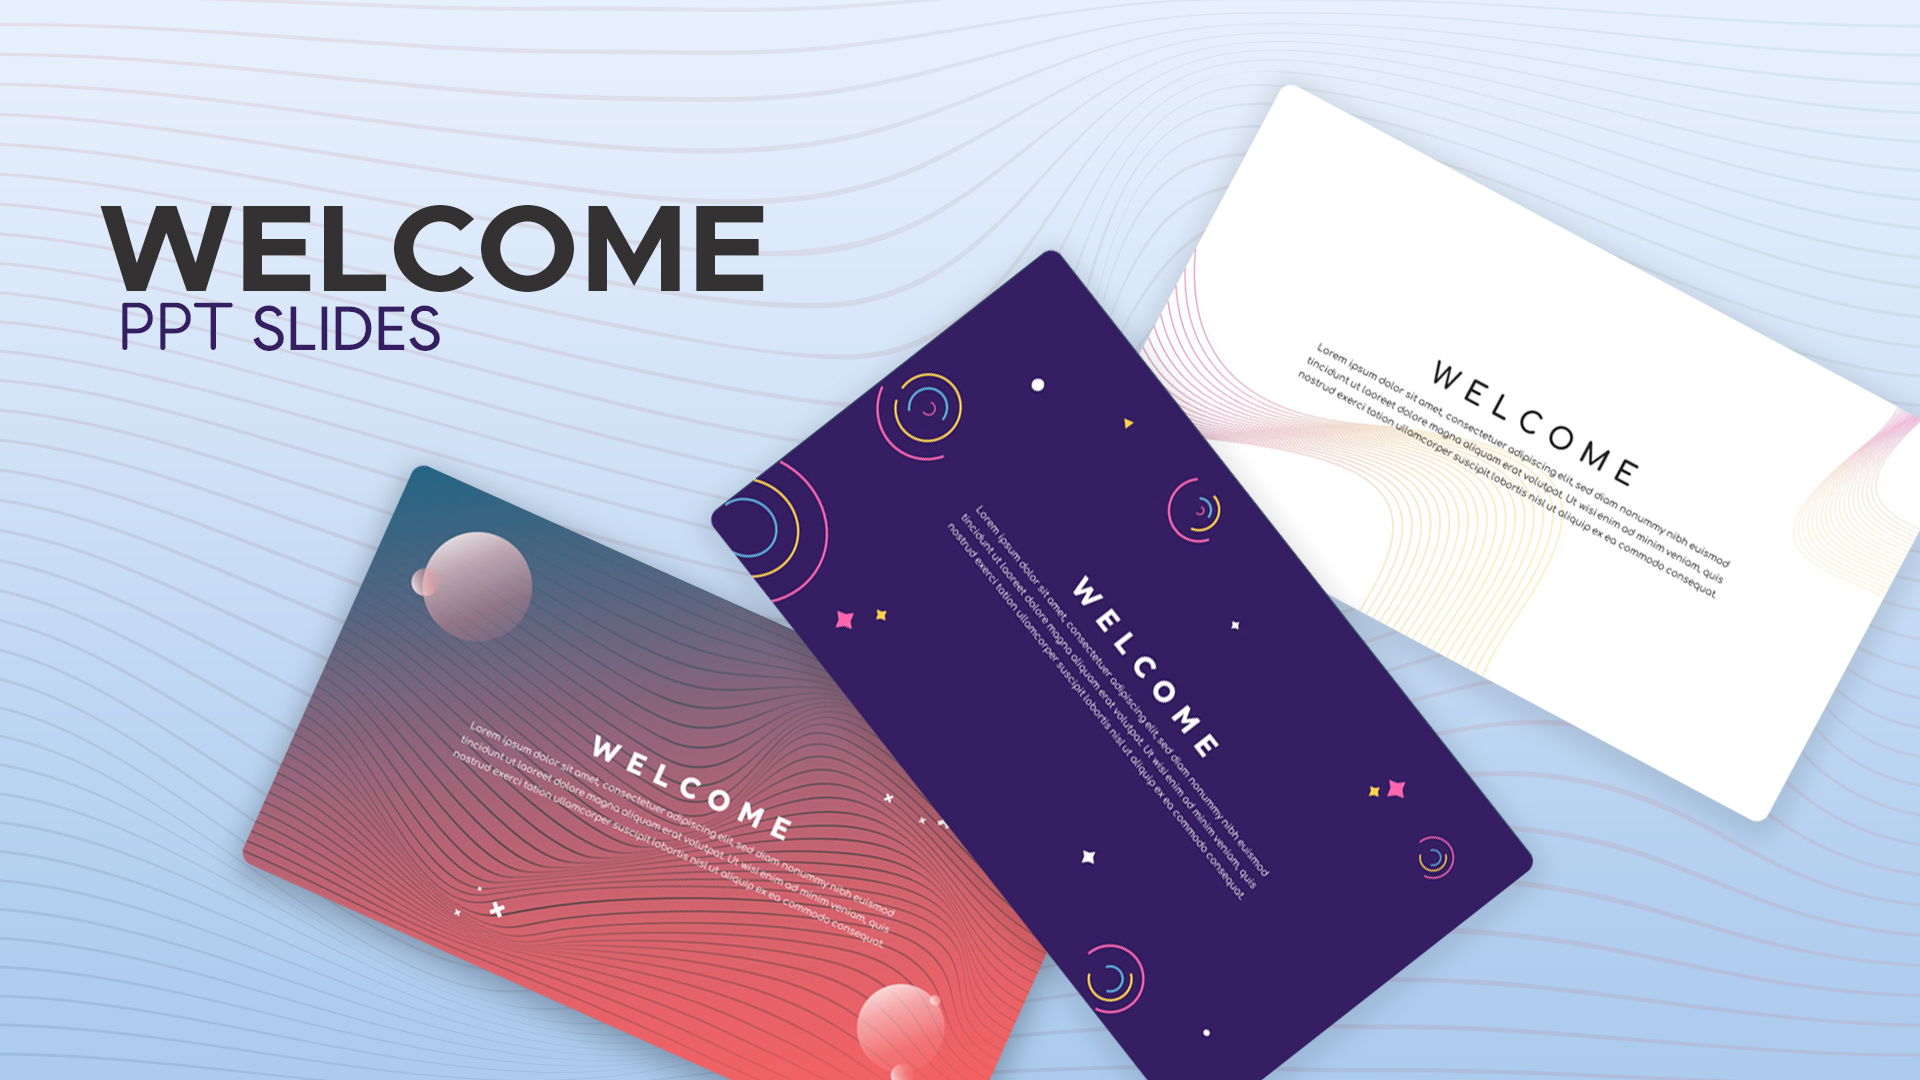
Free Modern Gradient Wave Welcome Slides Template for PowerPoint & Google Slides
Free
Free
Free Colorful Morning Meeting Agenda Slides Template for PowerPoint & Google Slides
Agenda
Free
Free New Year’s Resolution Slides Pack for PowerPoint & Google Slides 2023
Graphics
Free
Snake Diagram Pack of 8 Slides template for PowerPoint & Google Slides
Process
BEST Free Business PowerPoint Templates Collection Template for PowerPoint & Google Slides
Company Profile
Free
Free Garden Area PowerPoint Template for PowerPoint & Google Slides
Marketing
Free
Free Teacher’s Week Plan PowerPoint Template for PowerPoint & Google Slides
Decks
Free
Free Animated Church PowerPoint Template for PowerPoint & Google Slides
Decks
Free
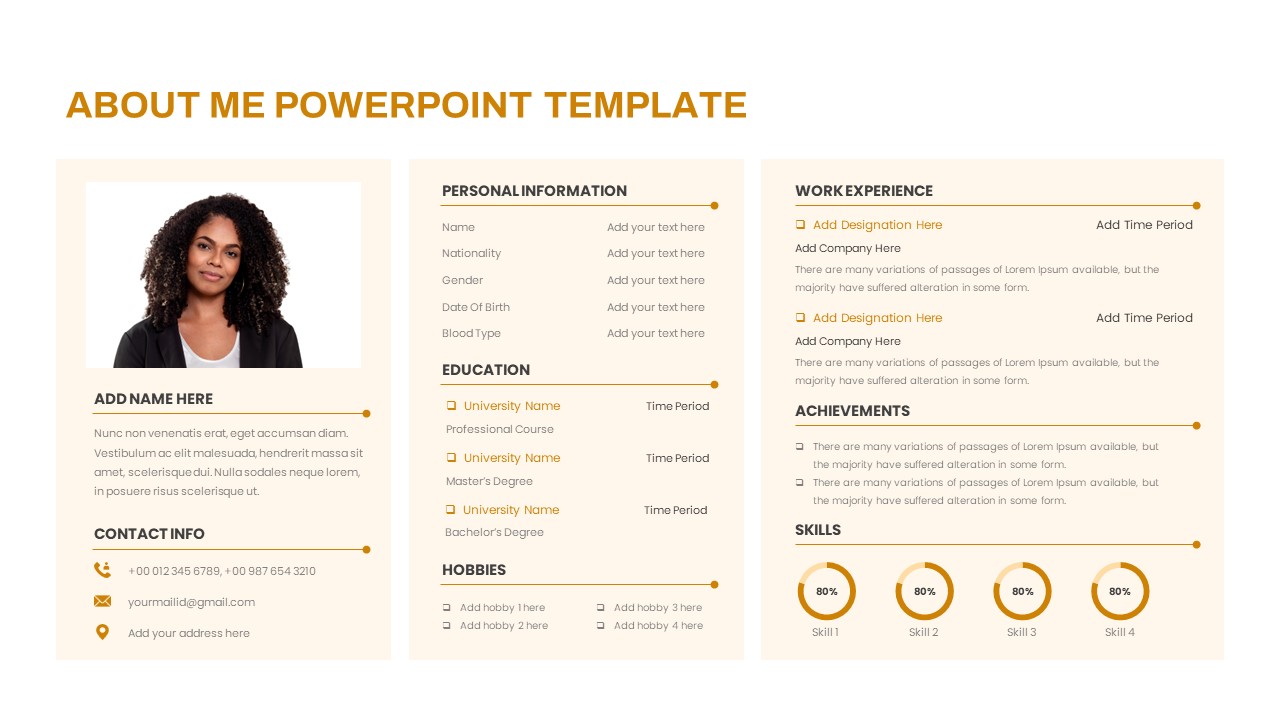
Free About Me PowerPoint Template for PowerPoint & Google Slides
Employee Performance
Free
Free KPI Dashboard PowerPoint Template for PowerPoint & Google Slides
Charts
Free
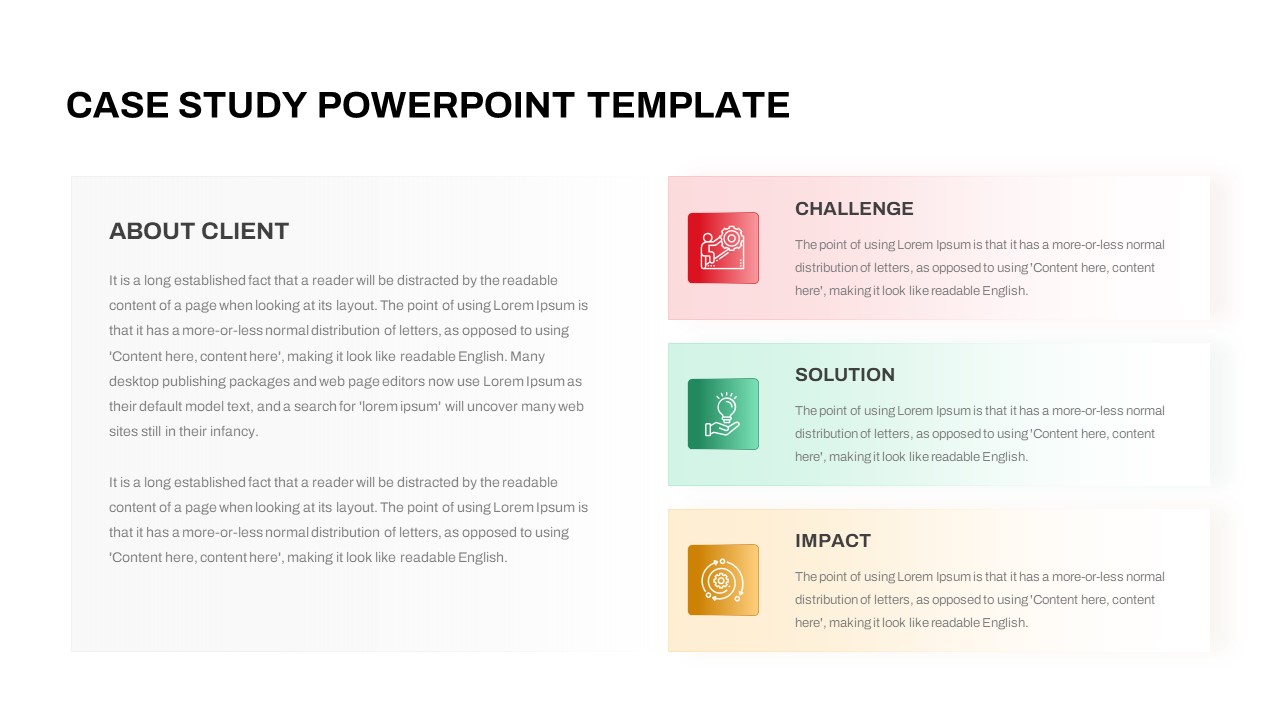
Free Case Study PowerPoint Template for PowerPoint & Google Slides
Infographics
Free
Free Callout Boxes PowerPoint Shapes for PowerPoint & Google Slides
Infographics
Free
Free Infographic Deck PowerPoint Pack for PowerPoint & Google Slides
Infographics
Free

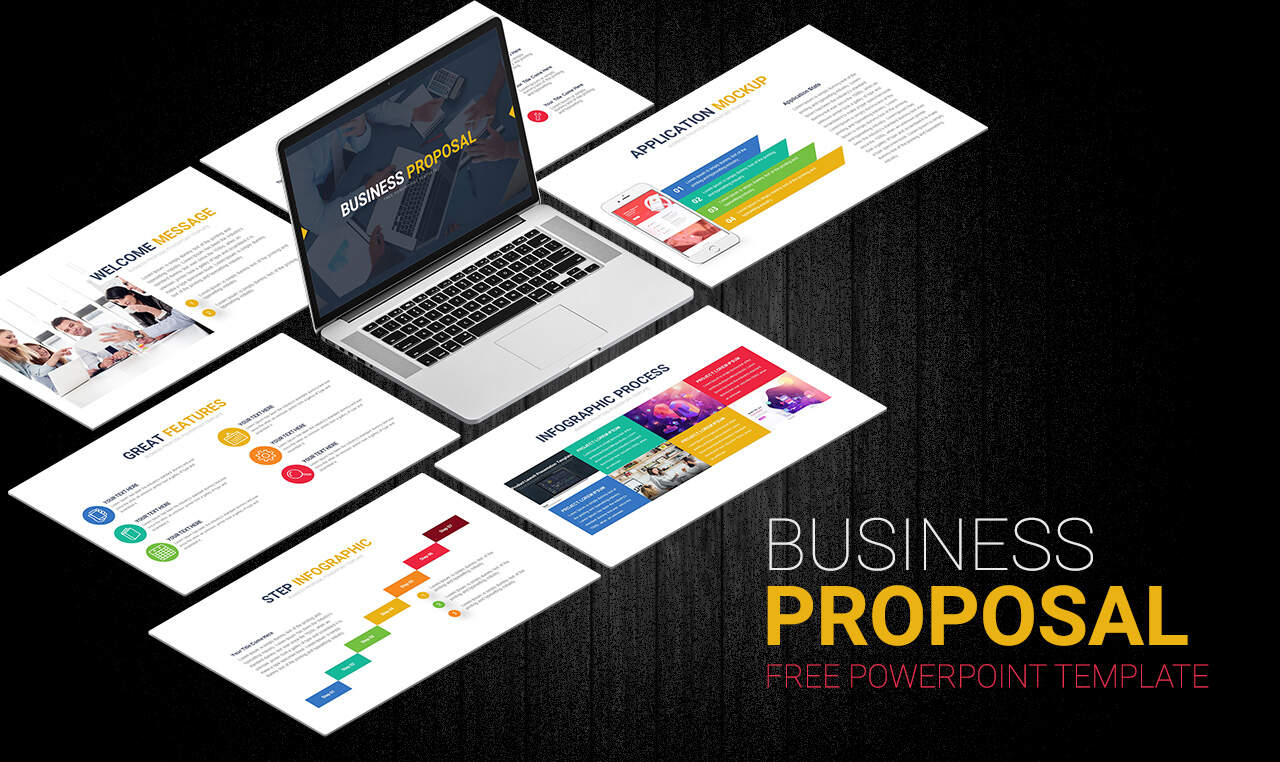
Free Business Proposal Pitch Deck Template for PowerPoint & Google Slides
Pitch Deck
Free
Free Medical Healthcare Presentation Template for PowerPoint & Google Slides
Health
Free
Free Traveller Travel Agency Deck template for PowerPoint & Google Slides
Company Profile
Free
Free Strategic Plan template for PowerPoint & Google Slides
Business Strategy
Free
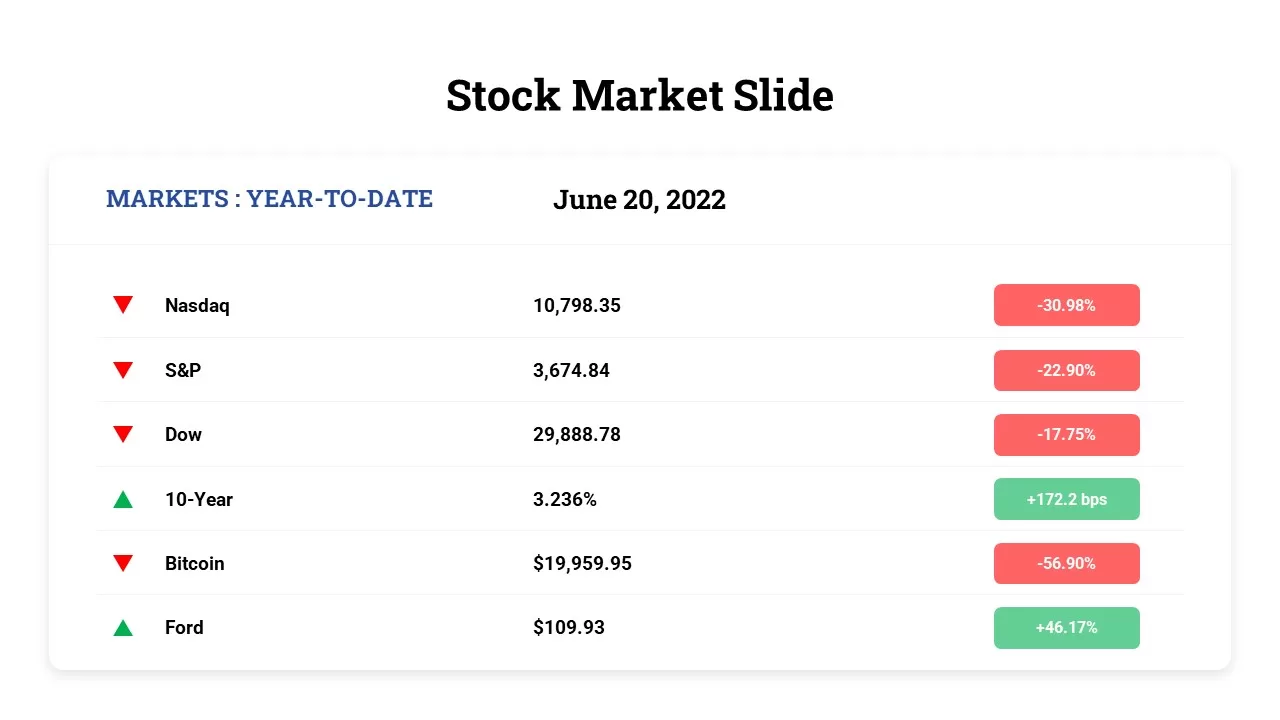
Free Stock Market Performance Overview template for PowerPoint & Google Slides
Finance
Free
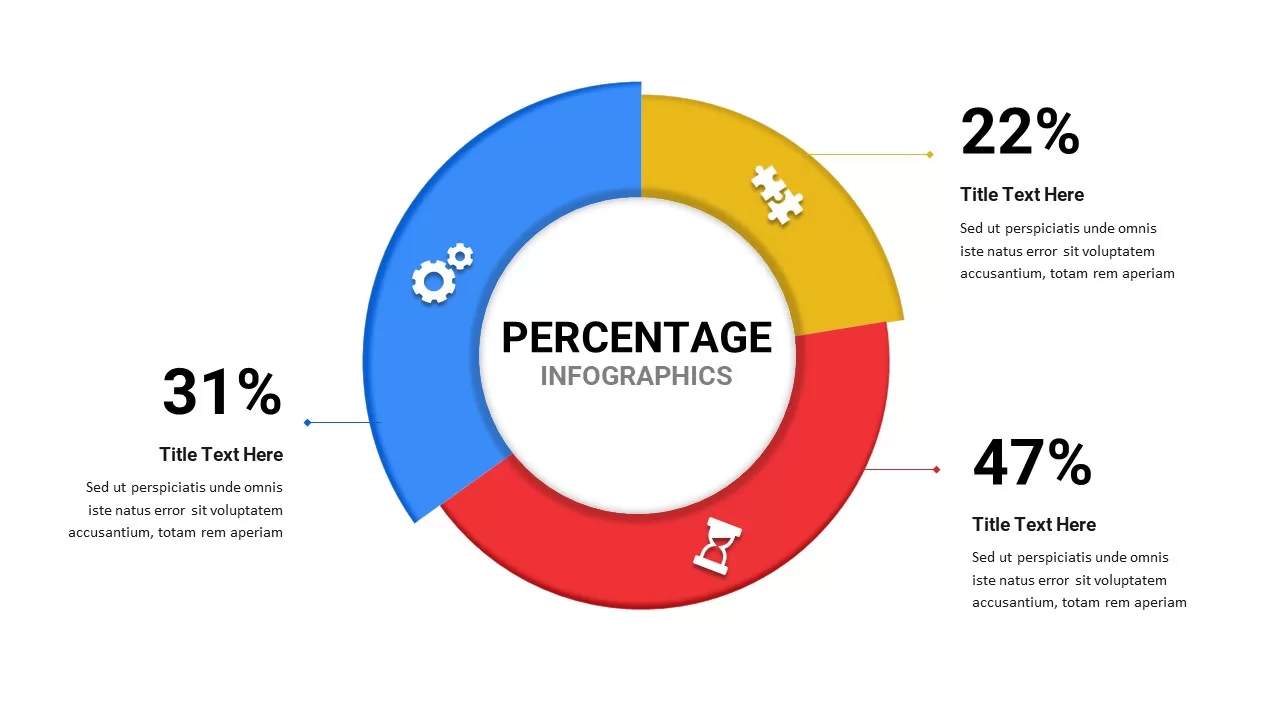
Free Percentage Infographics template for PowerPoint & Google Slides
Comparison
Free
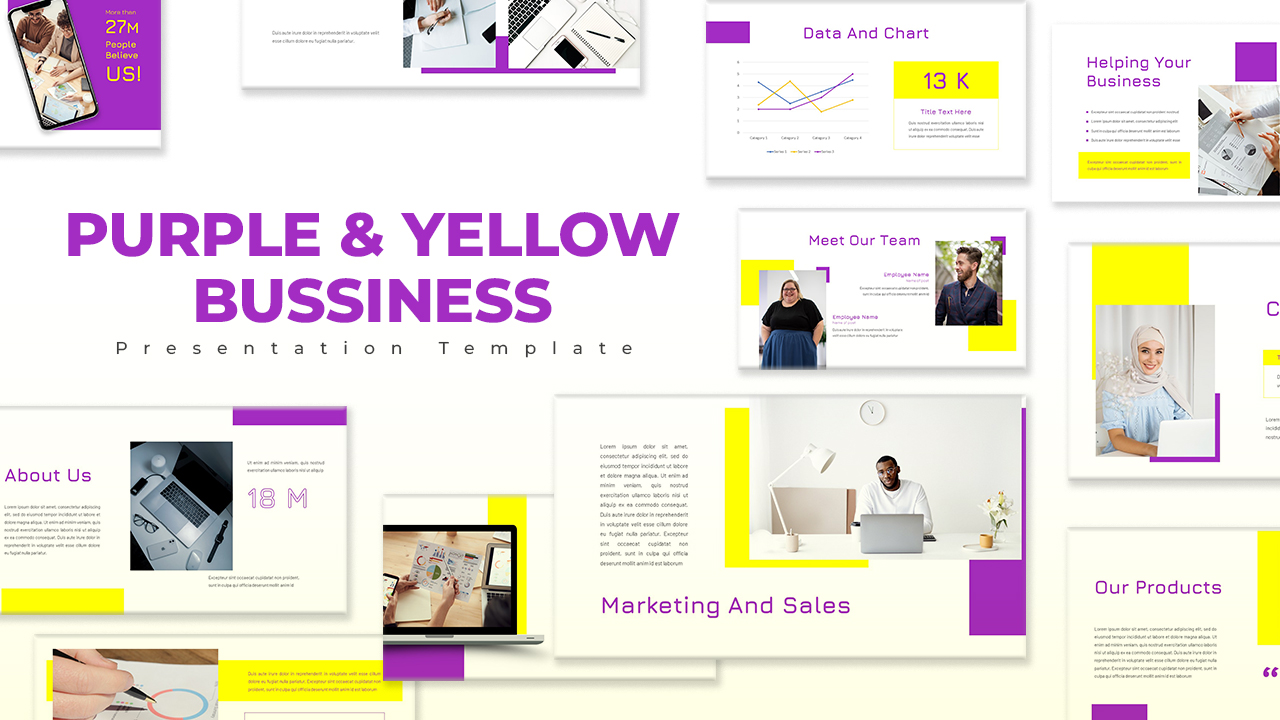
Free Purple & Yellow Business Presentation Template for PowerPoint & Google Slides
Company Profile
Free
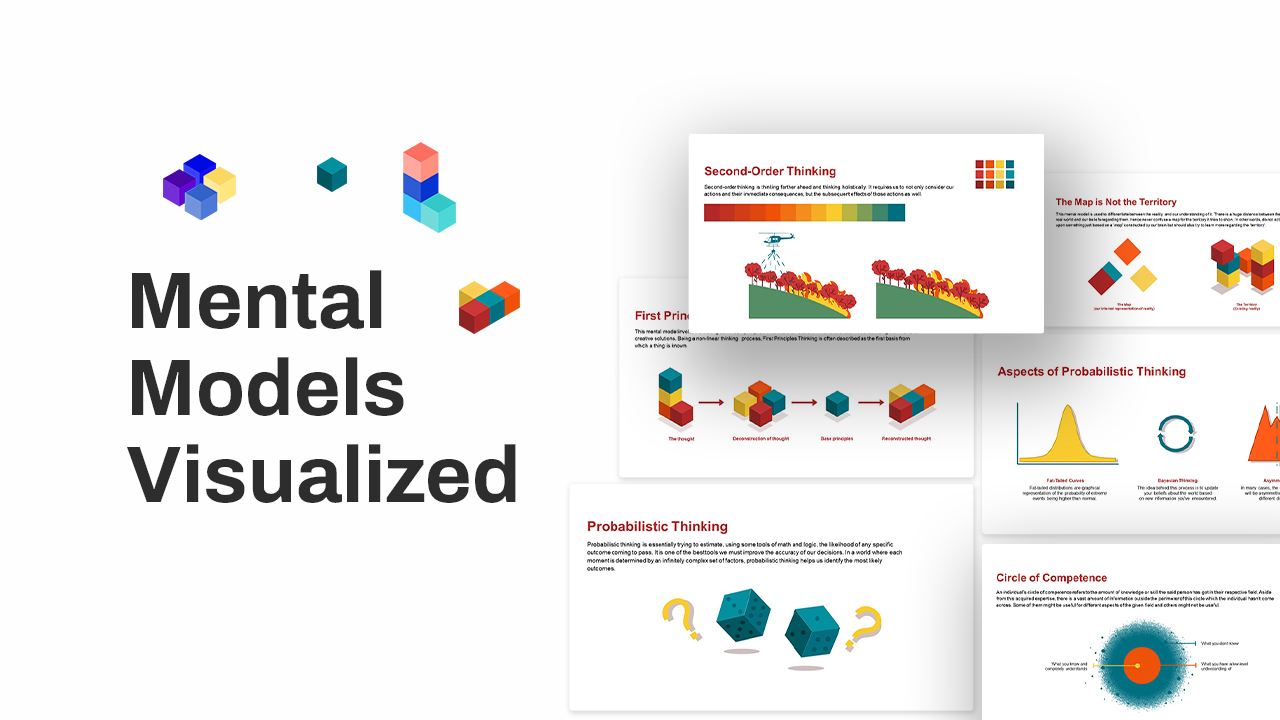
Free Mental Models Infographic Diagrams Template for PowerPoint & Google Slides
Process
Free
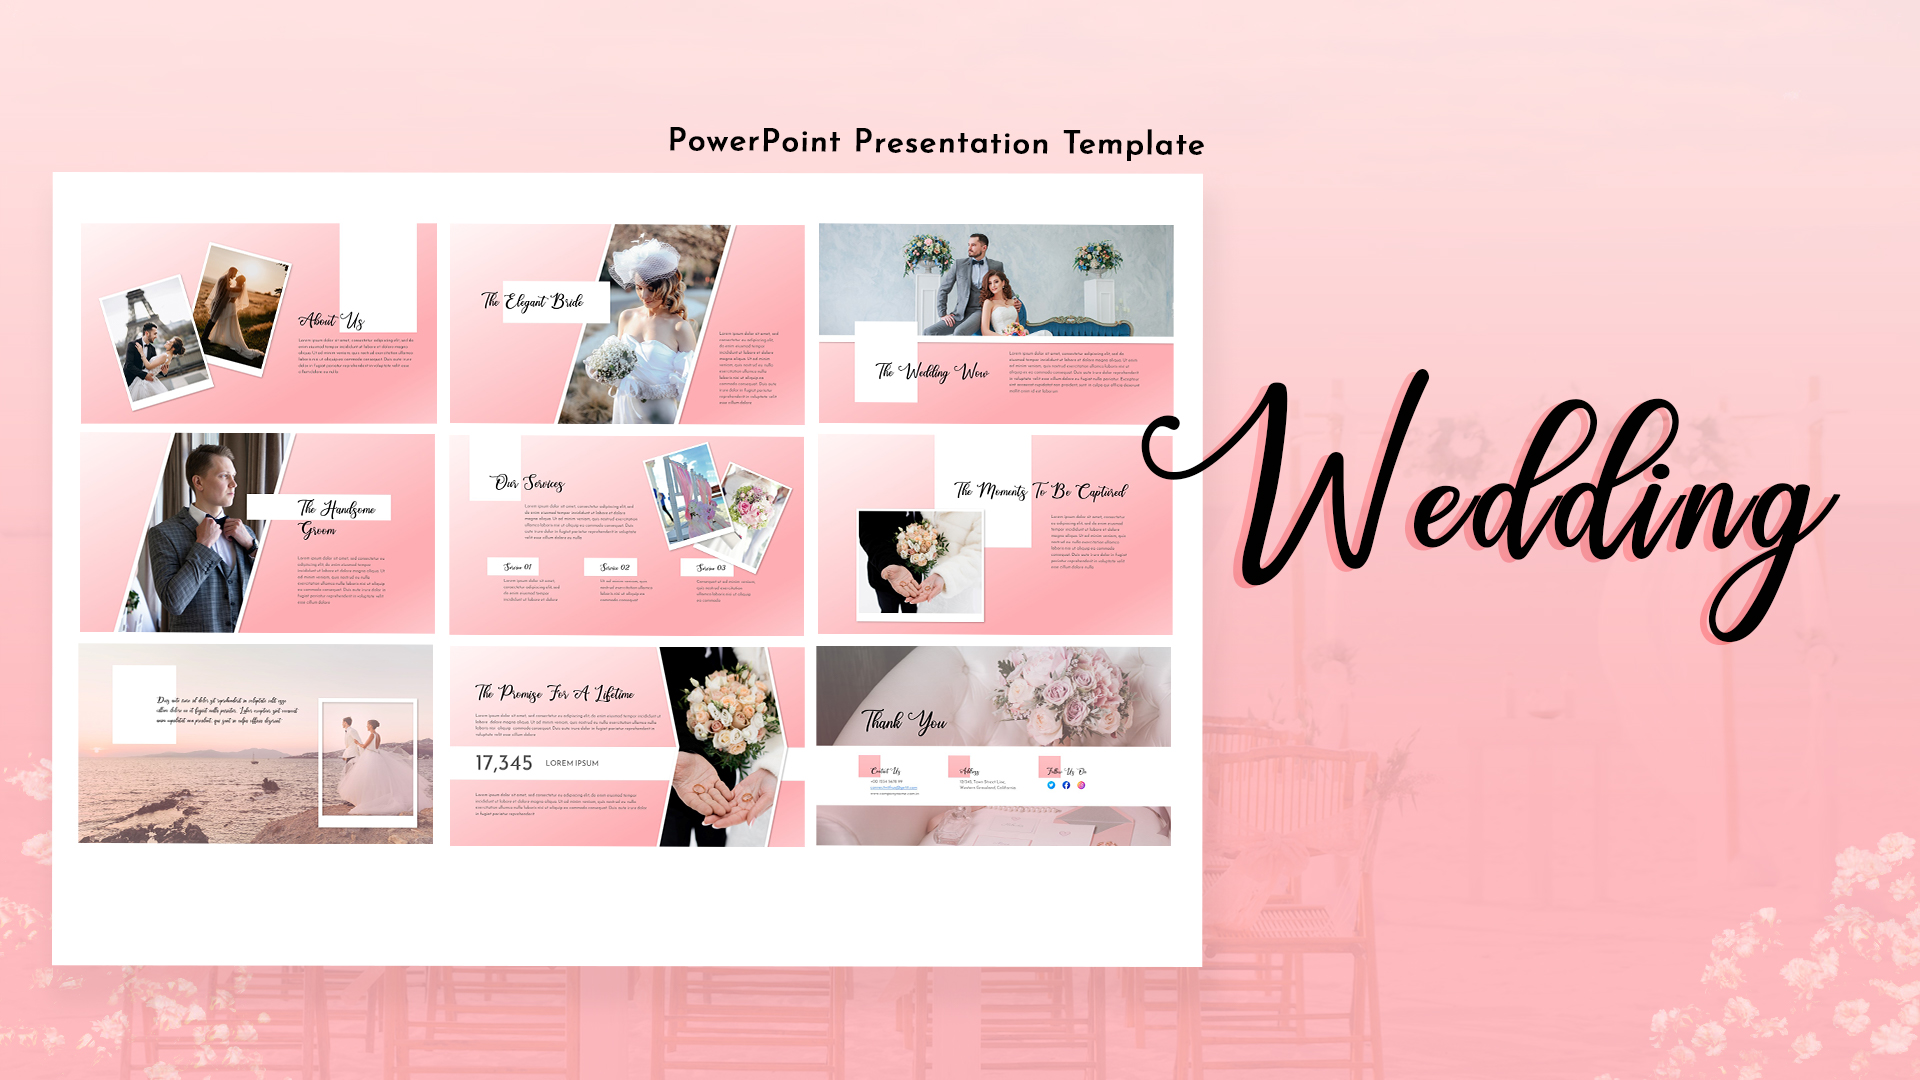
Free Romantic Pink Wedding Slideshow Template for PowerPoint & Google Slides
Pitch Deck
Free
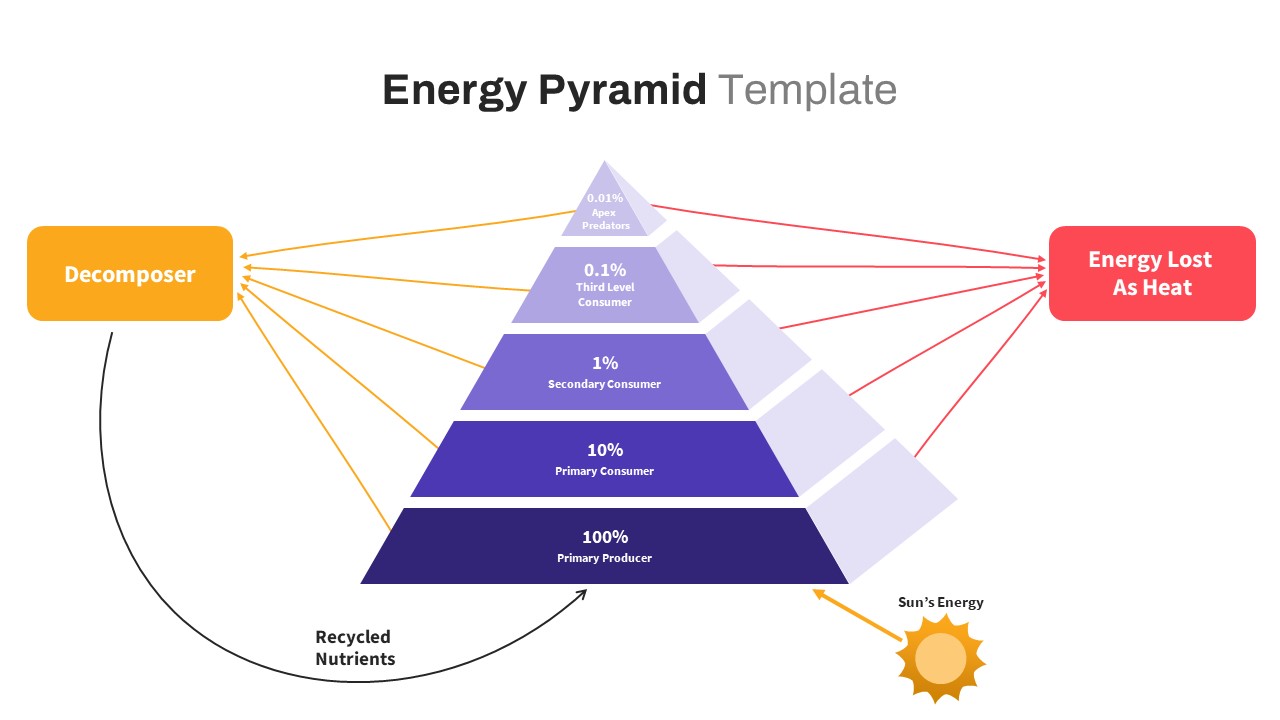
Free Ecological Energy Flow Pyramid Template for PowerPoint & Google Slides
Pyramid
Free
Free Modern Sales Pitch Deck Template for PowerPoint & Google Slides
Pitch Deck
Free
Free Nonprofit Charity Social Impact Deck Template for PowerPoint & Google Slides
Pitch Deck
Free
Free Clean Personal Biography Profile Slide Template for PowerPoint & Google Slides
Our Team
Free
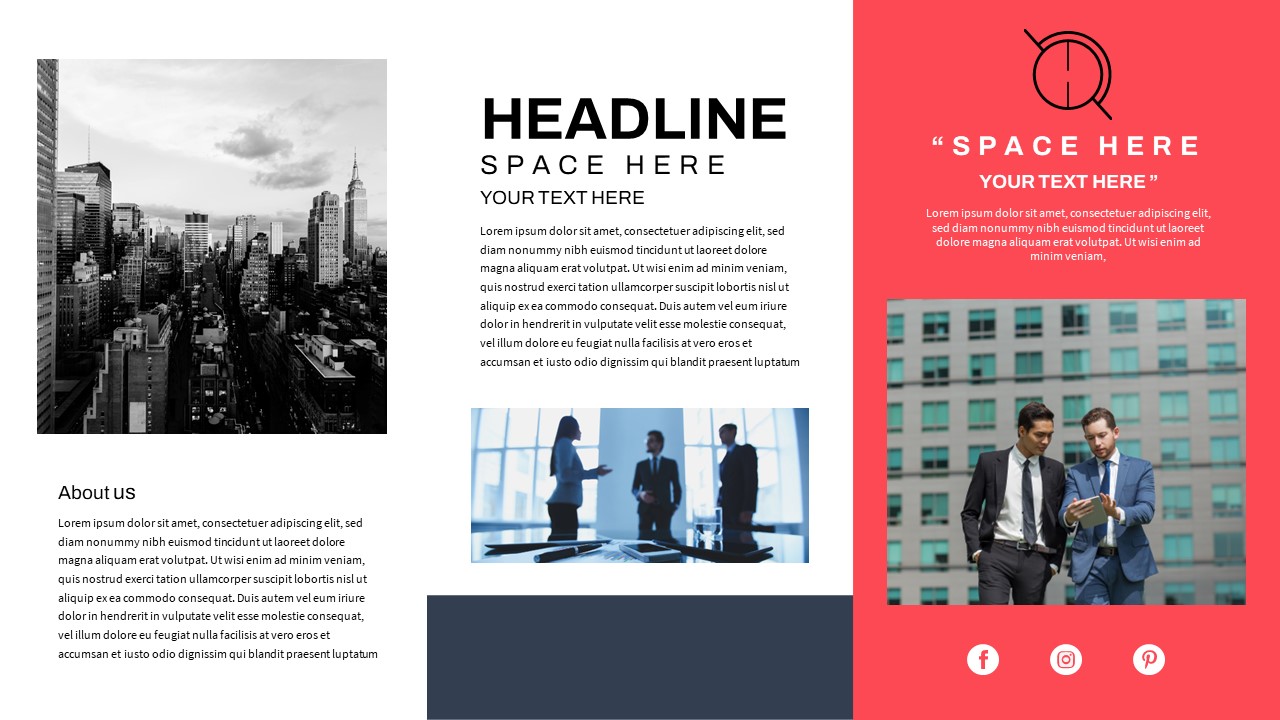
Free Modern Company Profile About Us Slide Template for PowerPoint & Google Slides
Company Profile
Free
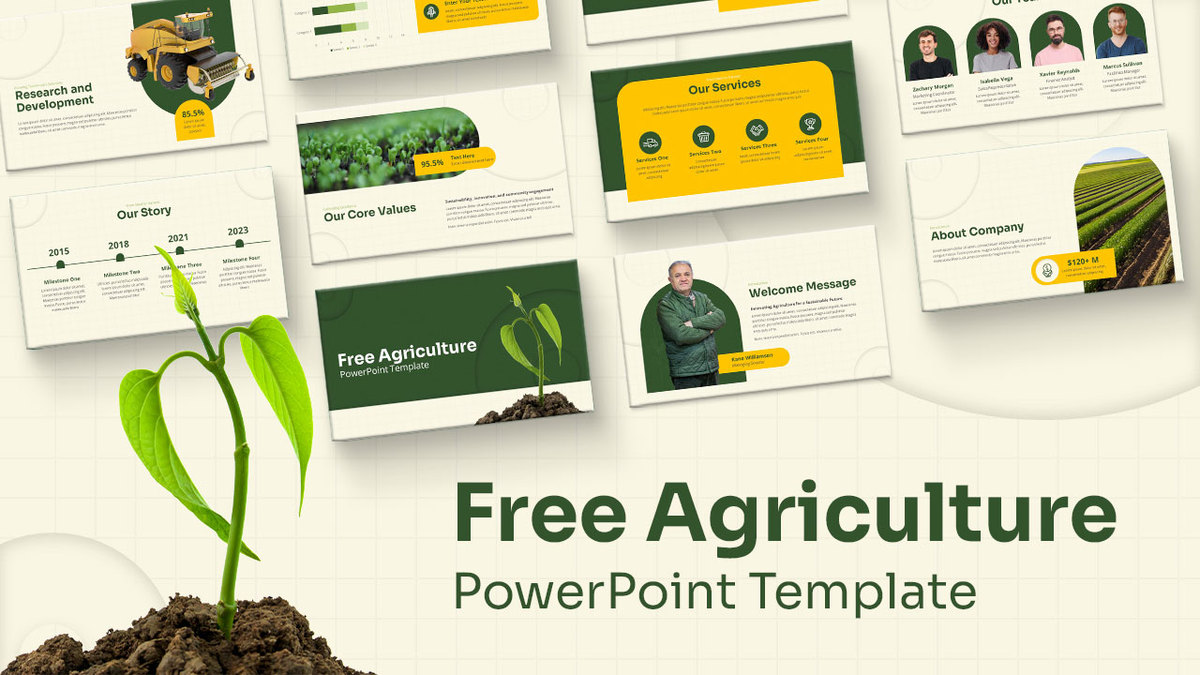
Free Agriculture Company Profile Pitch Deck template for PowerPoint & Google Slides
Company Profile
Free
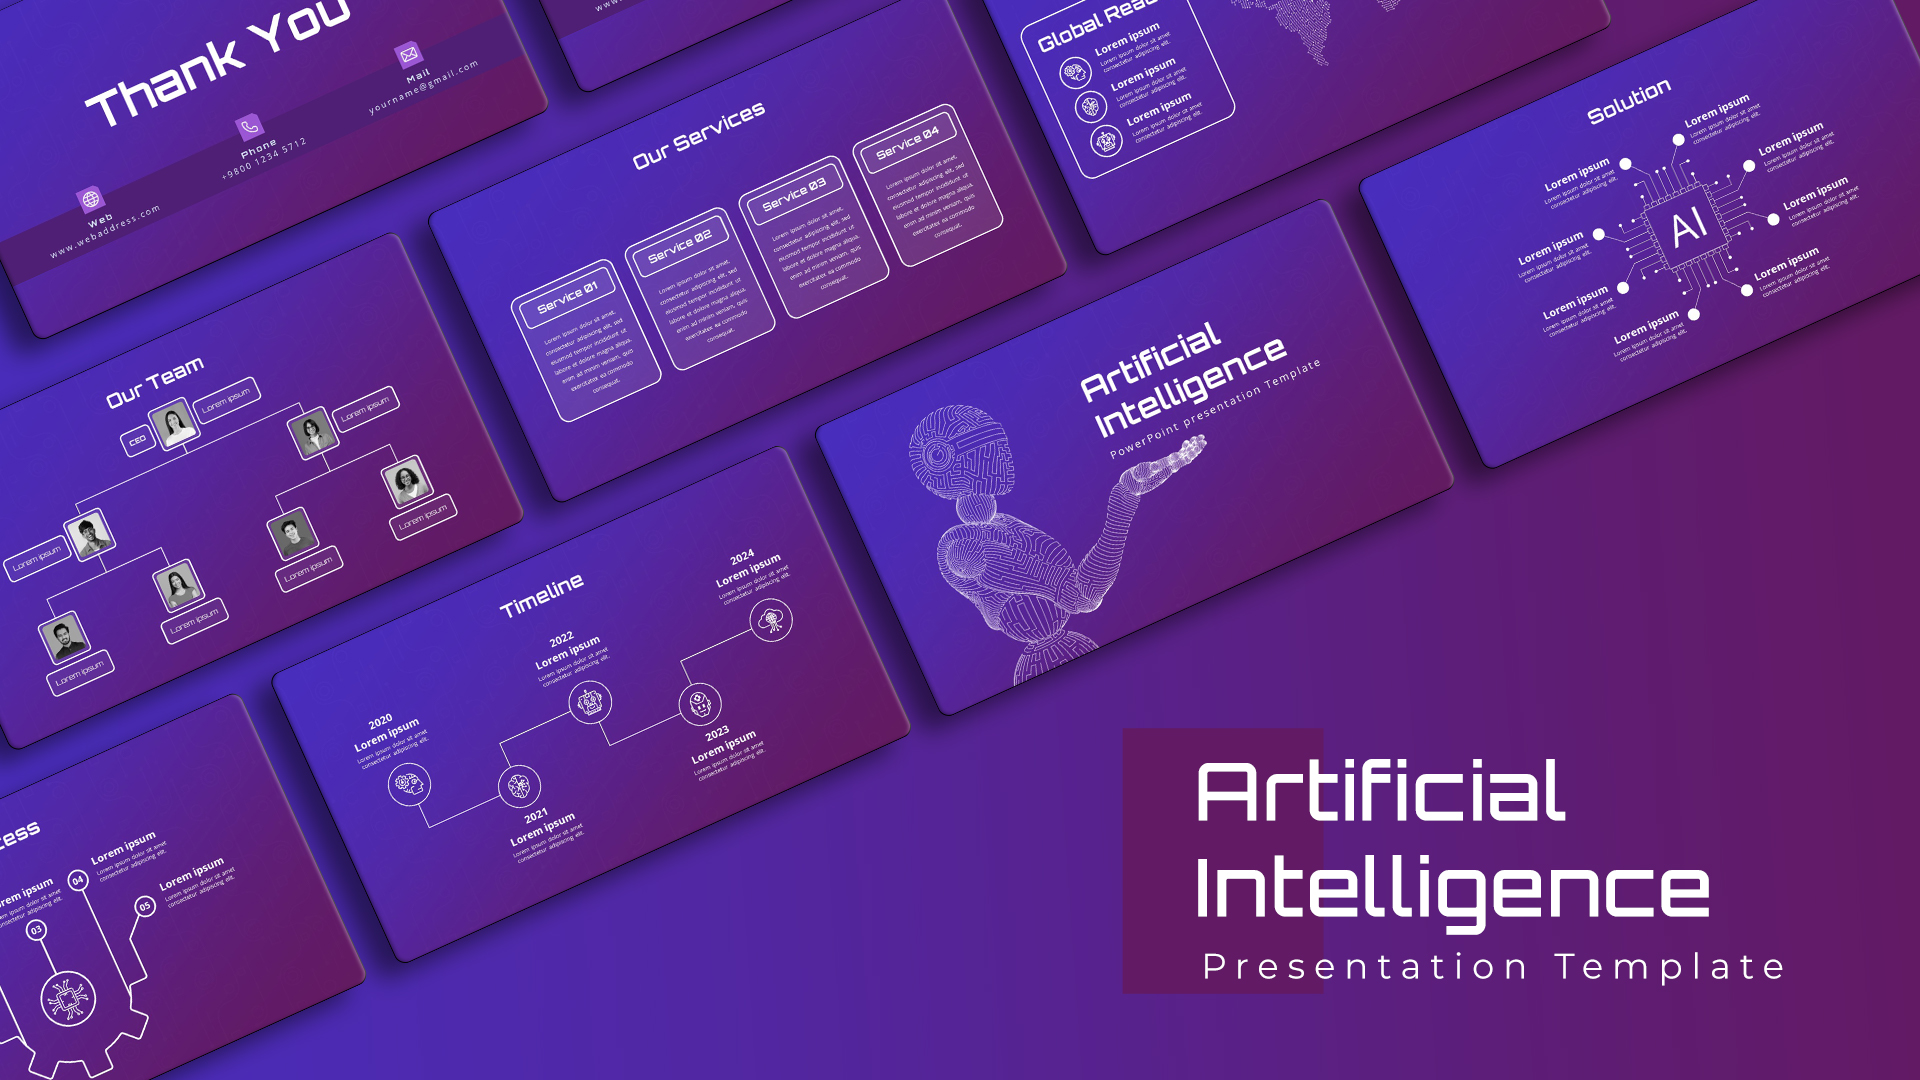
Free AI Artificial Intelligence Presentation Template for PowerPoint & Google Slides
AI
Free
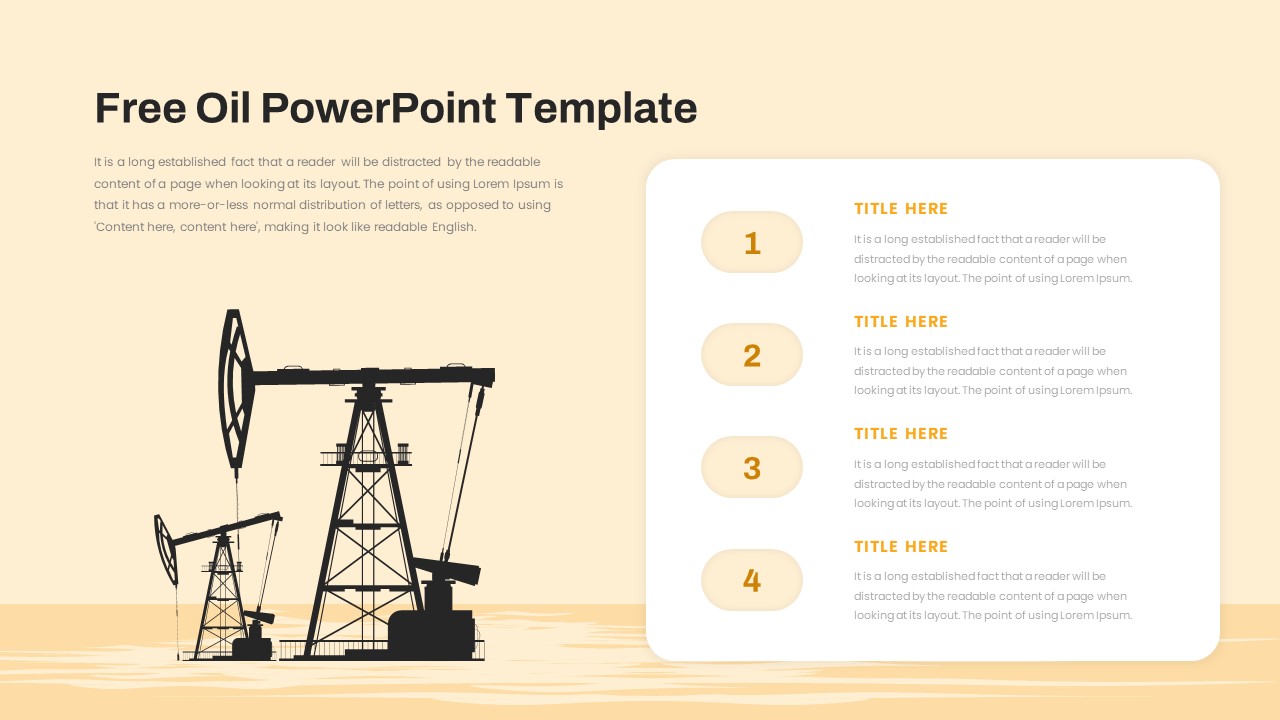
Free Oil Industry Four-Step Presentation Template for PowerPoint & Google Slides
Process
Free
Free TikTok Marketing Analytics Overview Template for PowerPoint & Google Slides
Company Profile
Free
Free Award Certificate Design Template for PowerPoint & Google Slides
Accomplishment
Free
Free Florists Business Presentation Design Template for PowerPoint & Google Slides
Company Profile