4 Set Venn Diagram Comparison Template for PowerPoint & Google Slides


Description
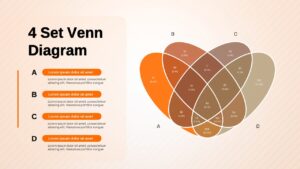
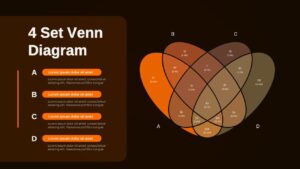
Visualize complex relationships and overlapping data with this 4 Set Venn Diagram Comparison Template for PowerPoint & Google Slides. Designed to illustrate connections between four distinct groups, this slide enables you to clearly present intersections, shared attributes, and unique elements within a single, structured layout.
The diagram features four overlapping shapes labeled A, B, C, and D, with clearly segmented intersection areas to display numerical values, percentages, or key insights. Each section can be customized to represent departments, product lines, market segments, research variables, or strategic pillars. The left-side content panel provides dedicated text areas for describing each set, ensuring audiences understand the context behind every data group.
With bold typography, rounded shapes, and high-contrast color accents, the design enhances readability while maintaining a professional and modern appearance. The layered intersections make it easy to communicate similarities, differences, and cross-functional impact at a glance. Fully editable shapes, colors, and text placeholders allow seamless customization to match your brand guidelines or presentation theme.
Optimized for both PowerPoint and Google Slides, this diagram supports data-driven storytelling, comparative analysis, and strategic decision-making with clarity and visual impact.
Who is it for
Business analysts, project managers, consultants, researchers, and marketing professionals can use this slide to compare overlapping segments, strategies, or performance metrics. Educators and students will also find it useful for explaining theoretical concepts or statistical relationships.
Other Uses
Repurpose this diagram for competitor analysis, risk assessment, audience segmentation, feature comparison, stakeholder mapping, or product differentiation studies. It is also ideal for workshops, strategy sessions, and academic presentations requiring structured comparison across four variables.
Login to download this file

Item ID
SB05809Designed By
Naseeba
Related Templates

Four-Circle Venn Process Diagram template for PowerPoint & Google Slides
Process

Venn Diagram Infographics Pack Template for PowerPoint & Google Slides
Circular
Creative Three-Circle Venn Diagram Template for PowerPoint & Google Slides
Comparison
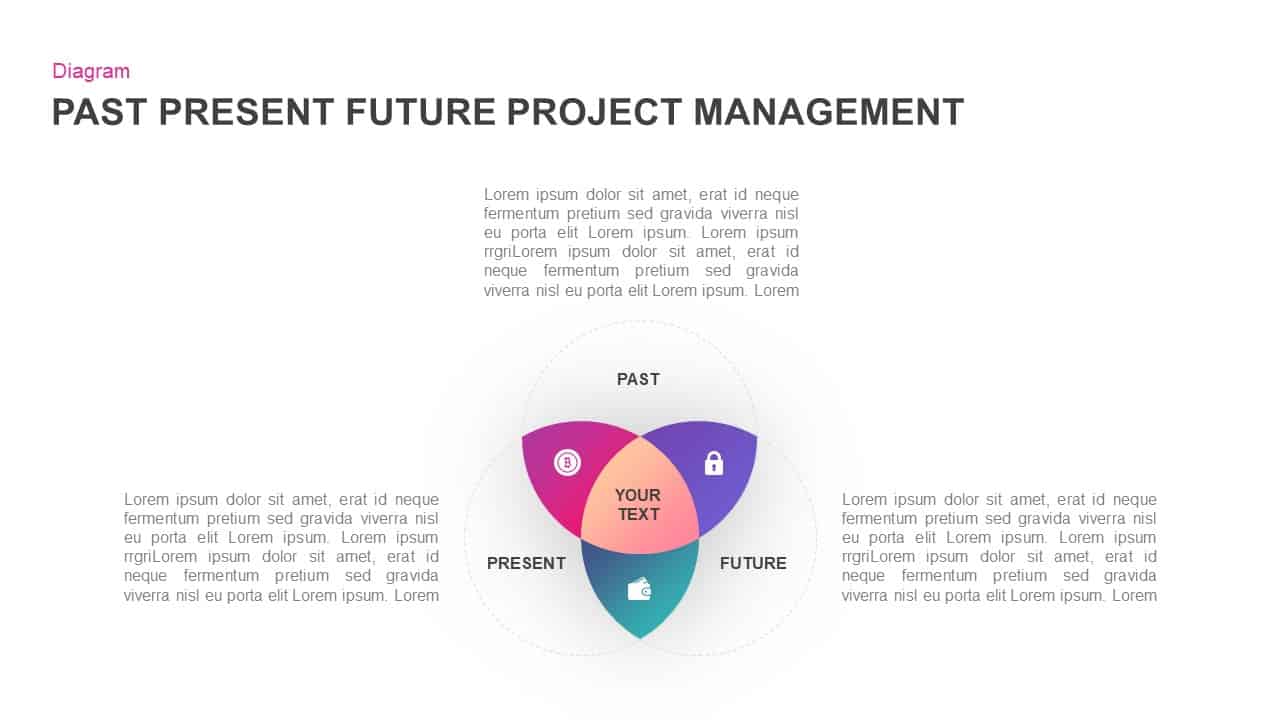
Past, Present & Future Venn Diagram Template for PowerPoint & Google Slides
Comparison
Colorful Venn Diagram Infographics Template for PowerPoint & Google Slides
Circular
Modern Gear Venn Diagram Infographic Template for PowerPoint & Google Slides
Comparison
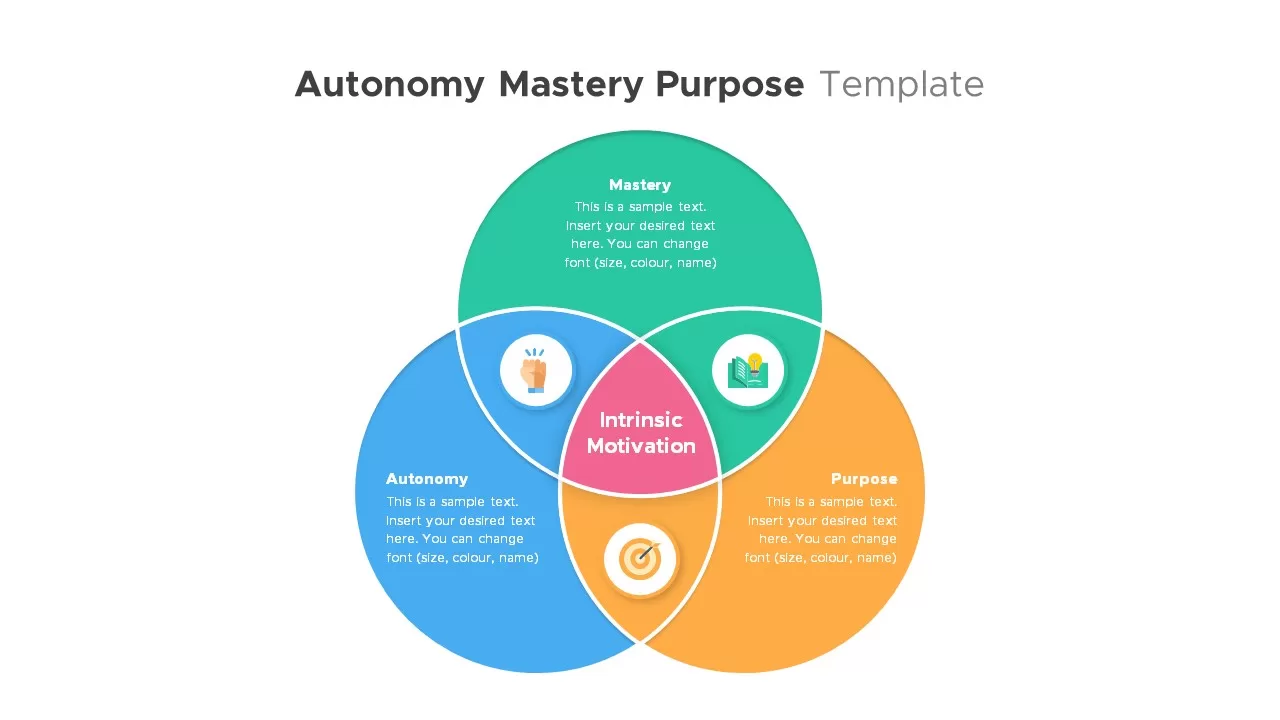
Autonomy, Mastery & Purpose Venn Diagram Template for PowerPoint & Google Slides
Circular
Free Simple Venn Diagram Overview template for PowerPoint & Google Slides
Comparison Chart
Free
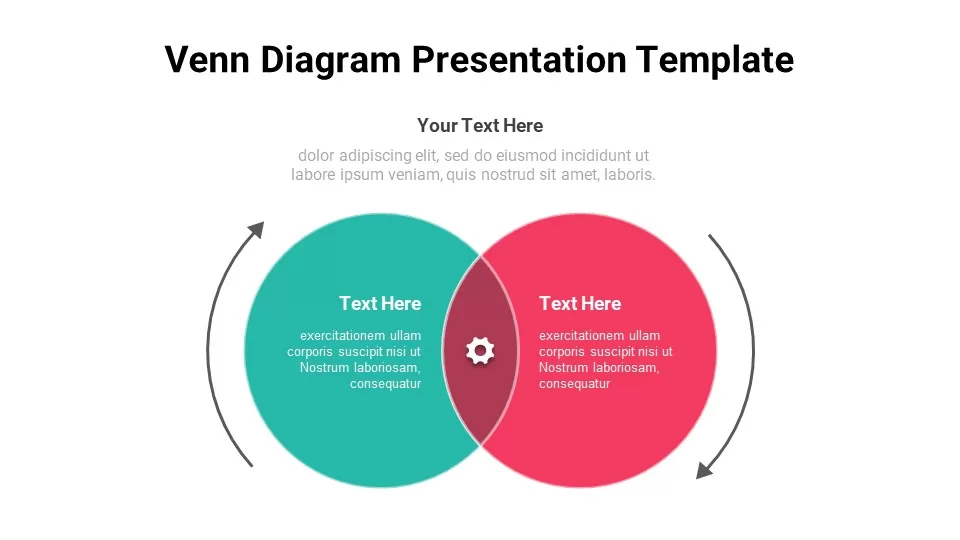
Free Venn Diagram template for PowerPoint & Google Slides
Charts
Free
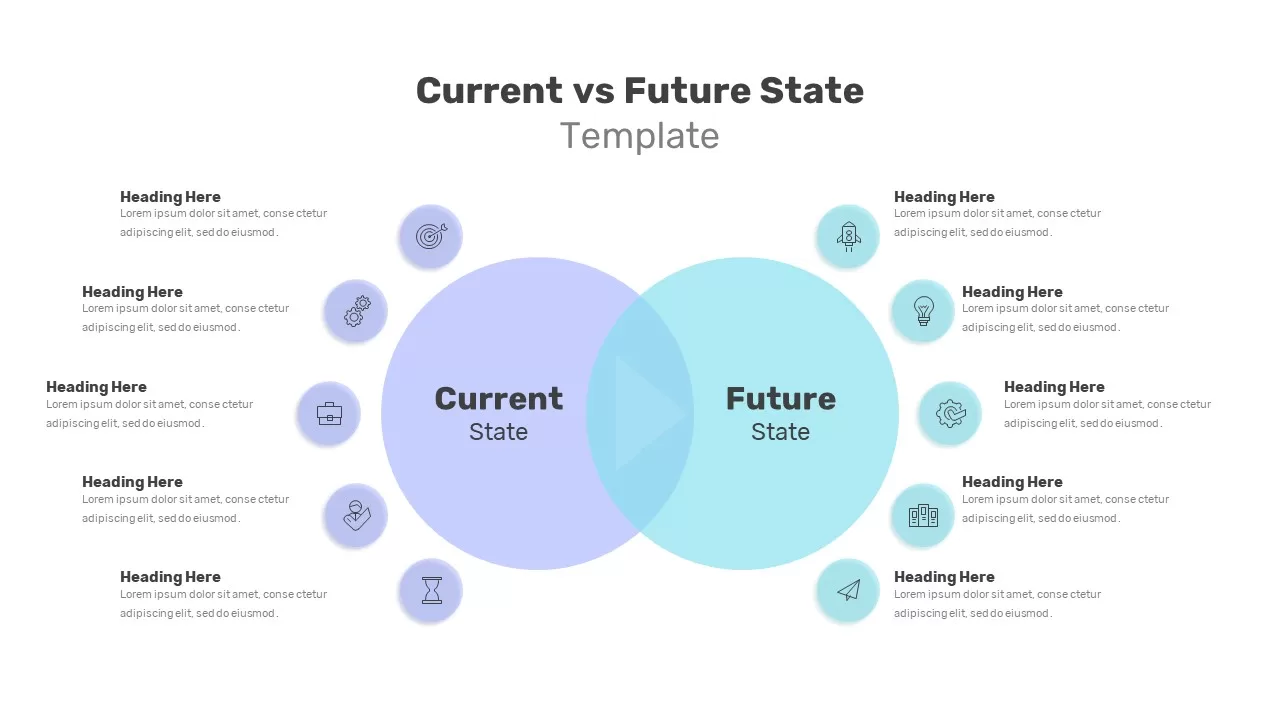
Current vs Future State Venn Diagram Template for PowerPoint & Google Slides
Comparison
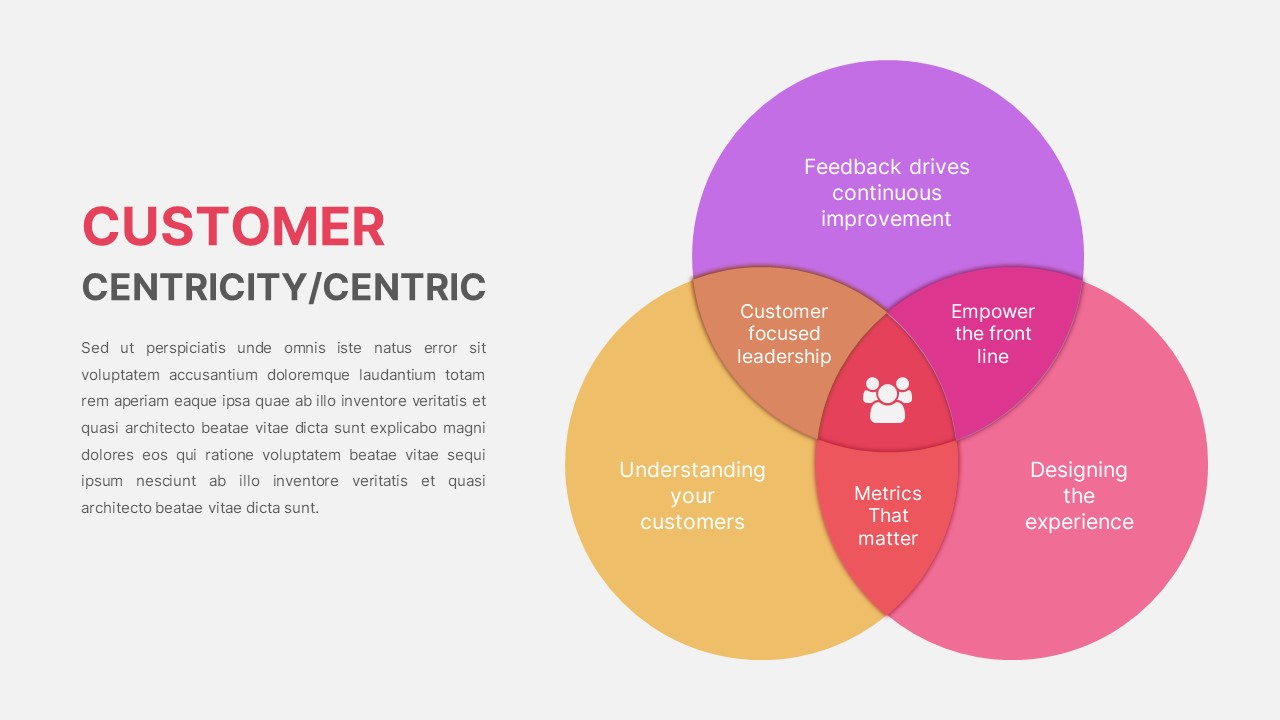
Customer Centricity Venn Diagram template for PowerPoint & Google Slides
Infographics
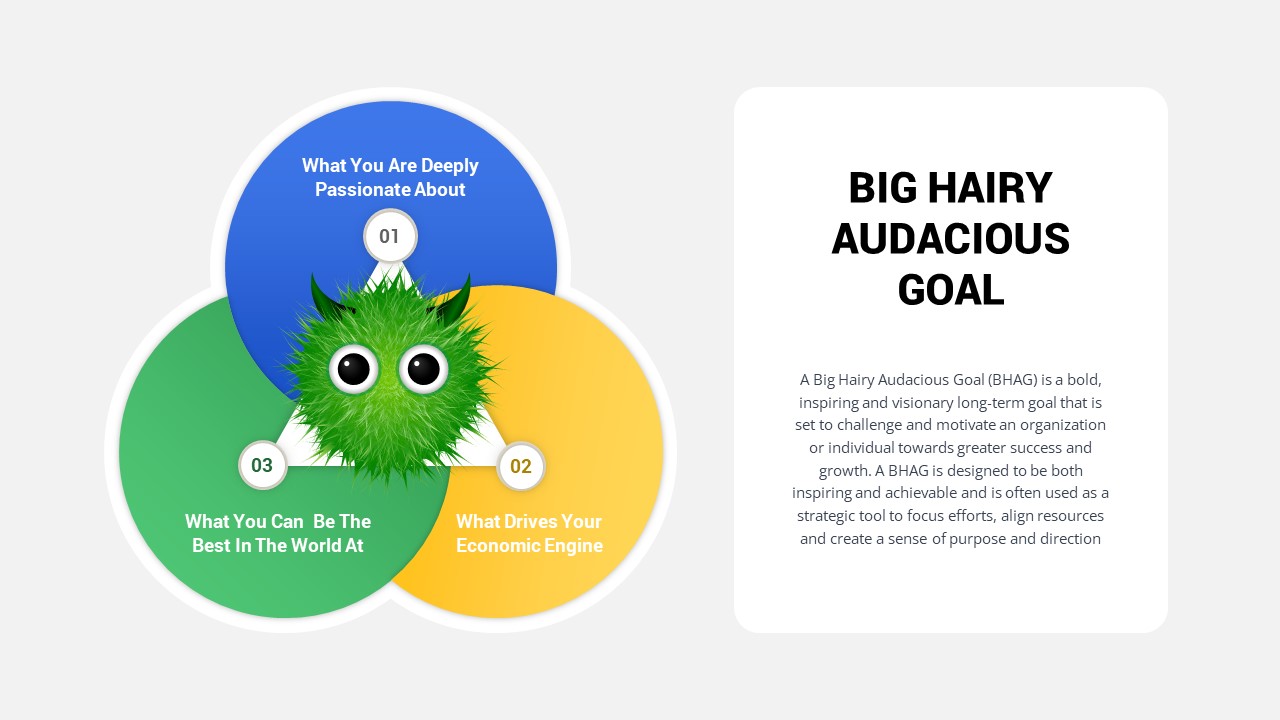
Big Hairy Audacious Goal Venn Diagram Template for PowerPoint & Google Slides
Circular
Five Circle Venn Diagram for Template for PowerPoint & Google Slides
Circular
8 Circle Venn Diagram Infographic Design Template for PowerPoint & Google Slides
Circular
Professional 6 Circle Venn Diagram Template for PowerPoint & Google Slides
Circular
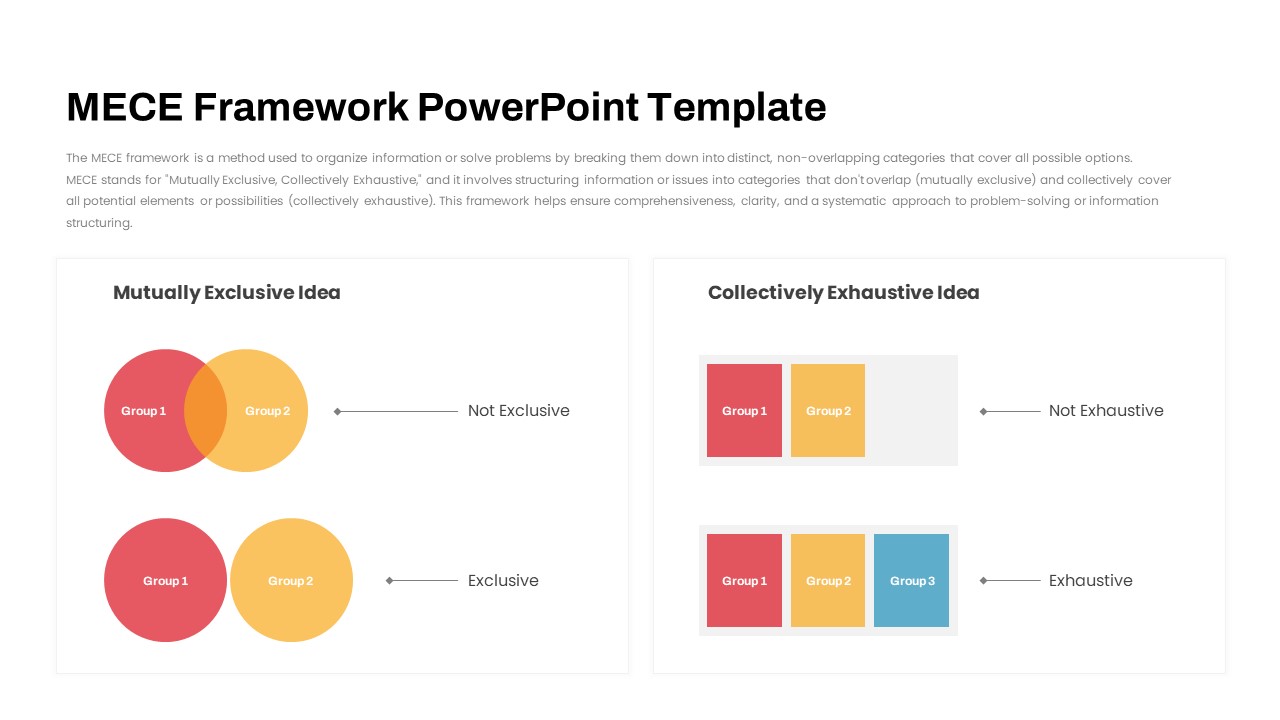
MECE Framework Venn & Block Diagram Template for PowerPoint & Google Slides
Comparison
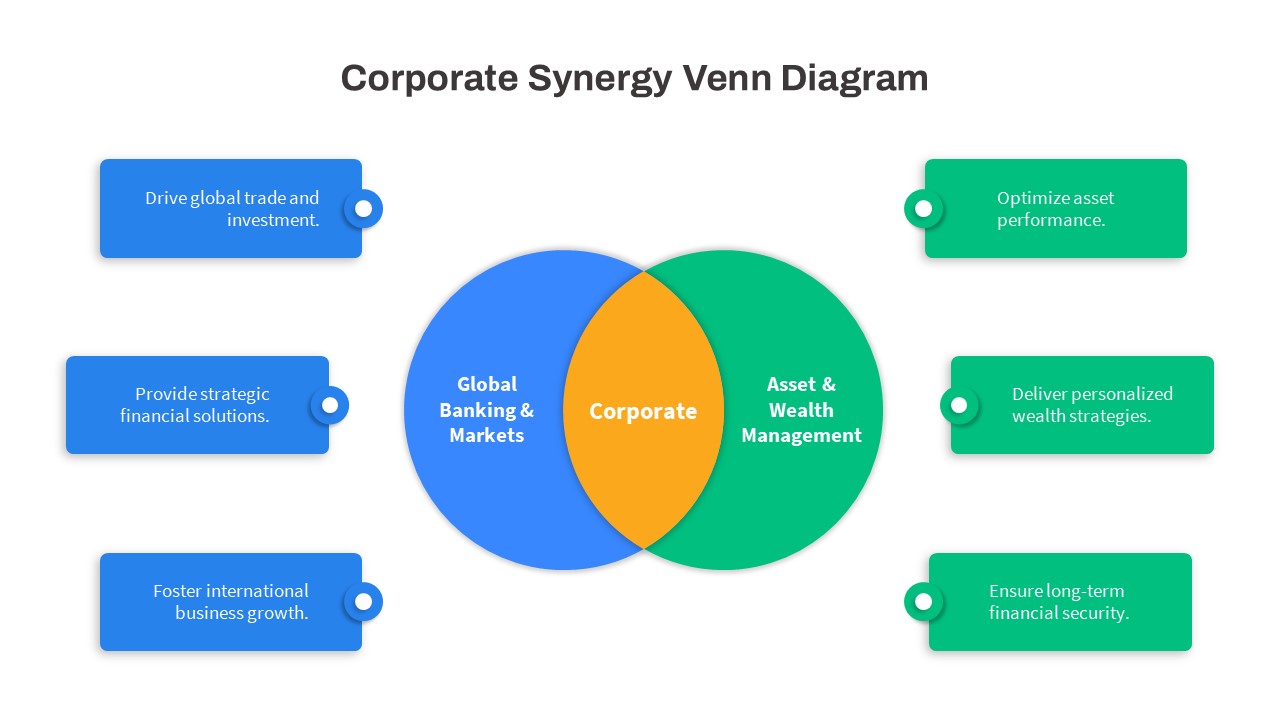
Corporate Synergy Venn Diagram Template for PowerPoint & Google Slides
Comparison
Salience Model Venn Diagram Infographic Template for PowerPoint & Google Slides
Circular
Modern Growth Hacking Venn Diagram Template for PowerPoint & Google Slides
Circular
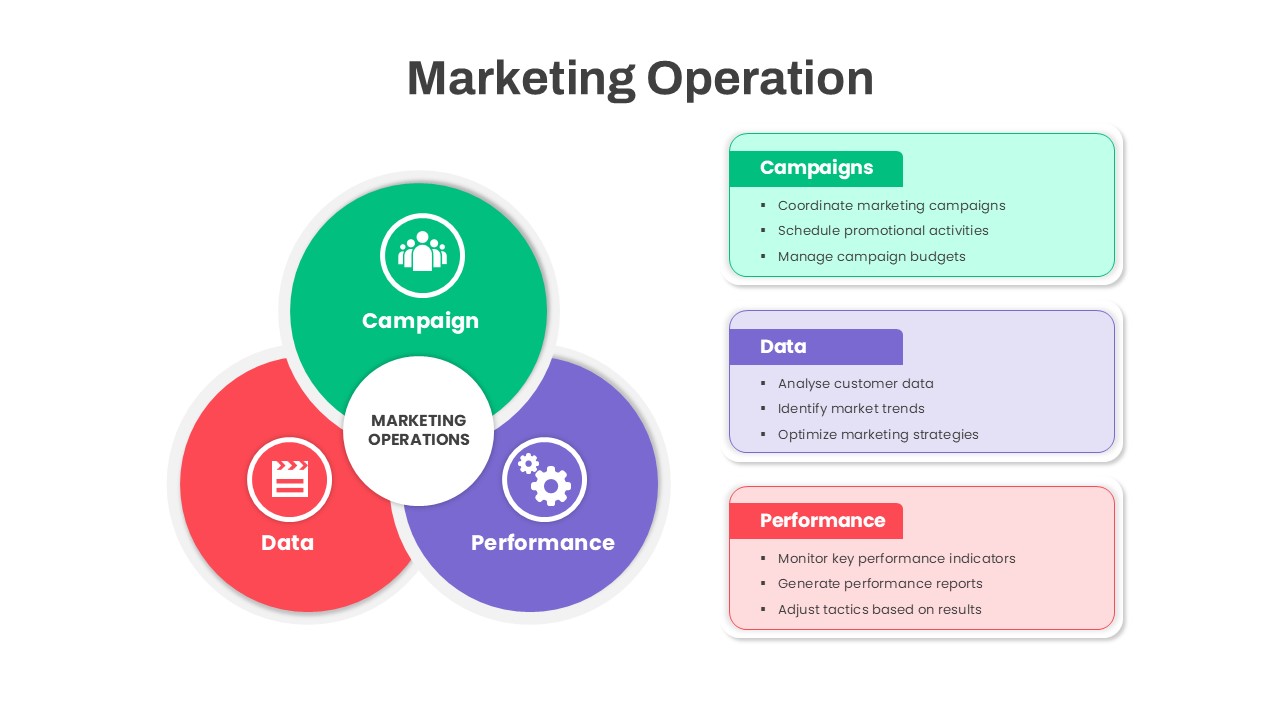
Marketing Operations Venn Diagram Template for PowerPoint & Google Slides
Circular
3Ps Triple Bottom Line Venn Diagram Template for PowerPoint & Google Slides
Circular
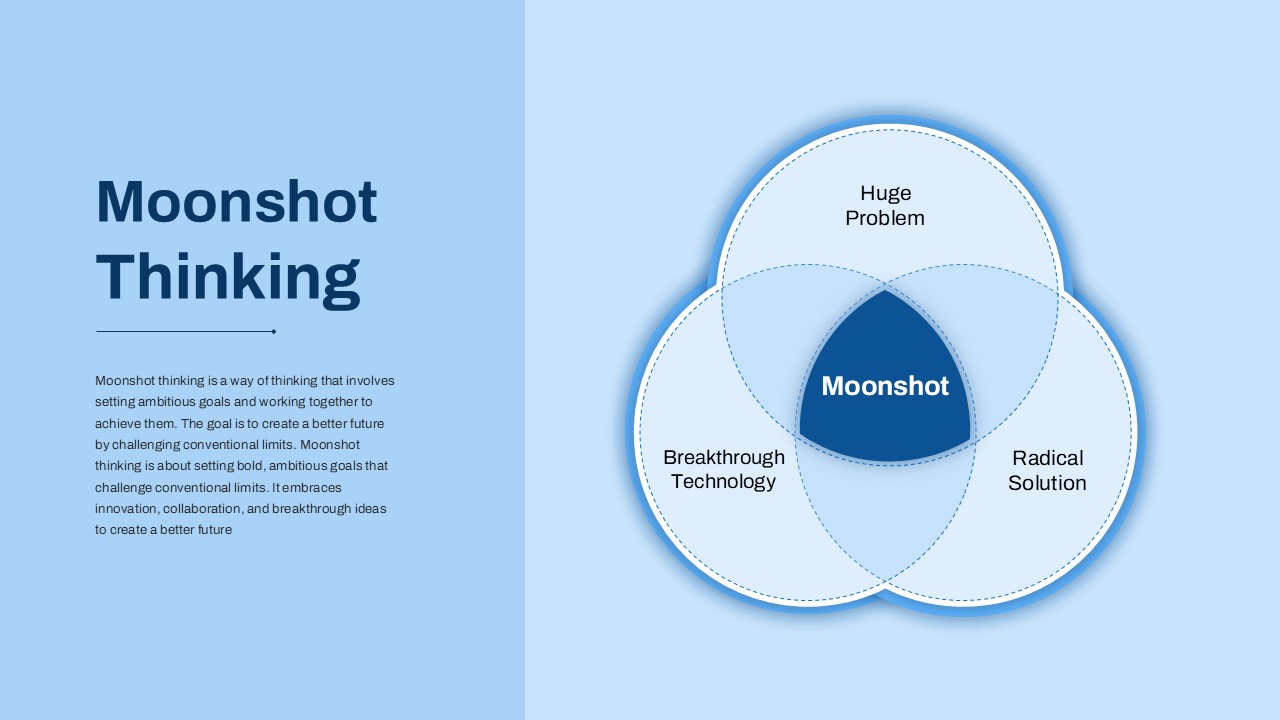
Bold Moonshot Thinking Venn Diagram Template for PowerPoint & Google Slides
Circular
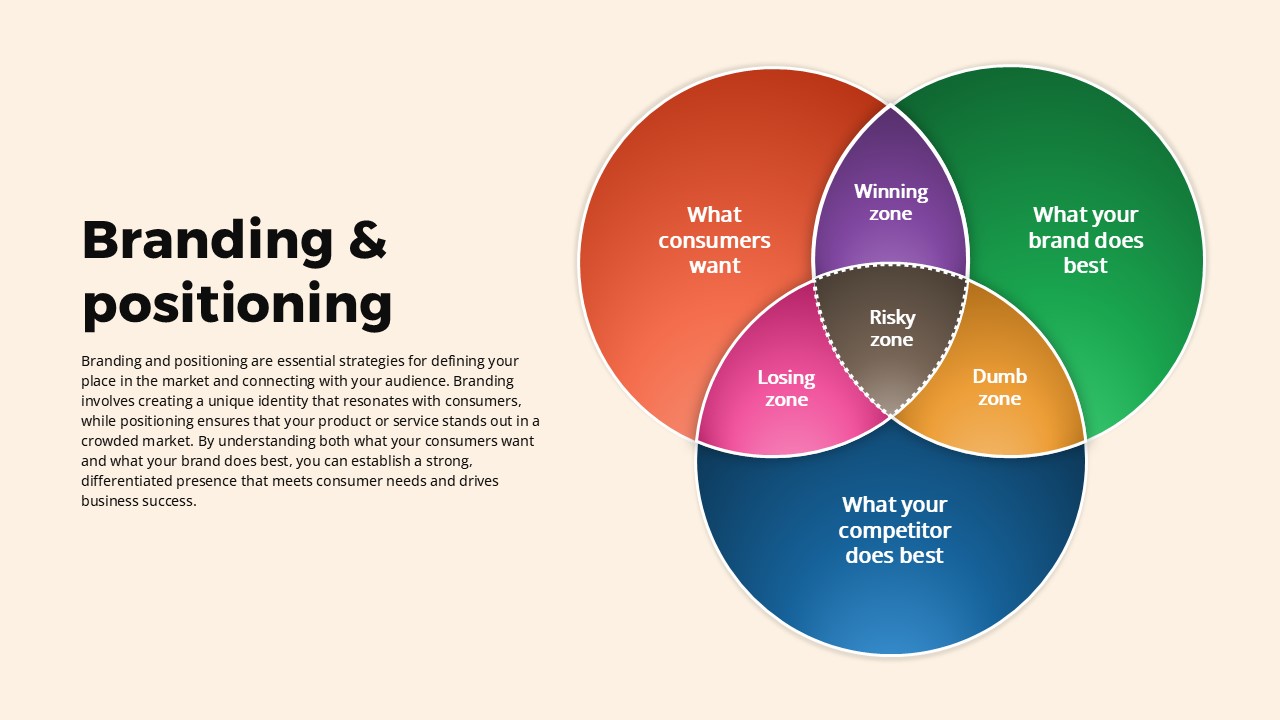
Branding and Positioning Venn Diagram Template for PowerPoint & Google Slides
Comparison
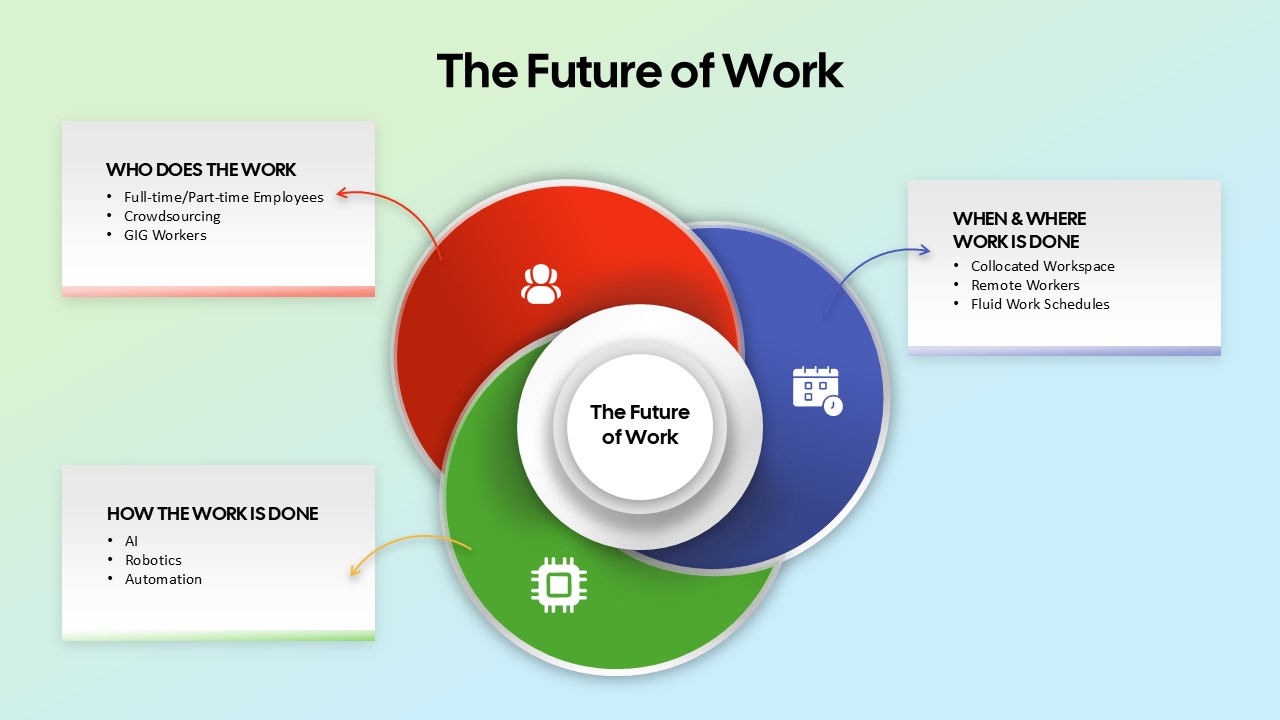
The Future of Work Venn Diagram Template for PowerPoint & Google Slides
Circular
Quadruple Venn Diagram Template for PowerPoint & Google Slides
Circular
Triangle Venn Diagram Infographic Template for PowerPoint & Google Slides
Comparison
Colorful Venn Diagram with 4 Circle for PowerPoint & Google Slides
Circular
Four Section Comparison Chart Diagram Template for PowerPoint & Google Slides
Infographics
Success vs Failure Comparison Diagram Template for PowerPoint & Google Slides
Comparison
Four Business Structure Types Comparison Diagram Template for PowerPoint & Google Slides
Business Strategy

Isometric 3D Block Comparison Diagram Template for PowerPoint & Google Slides
Comparison
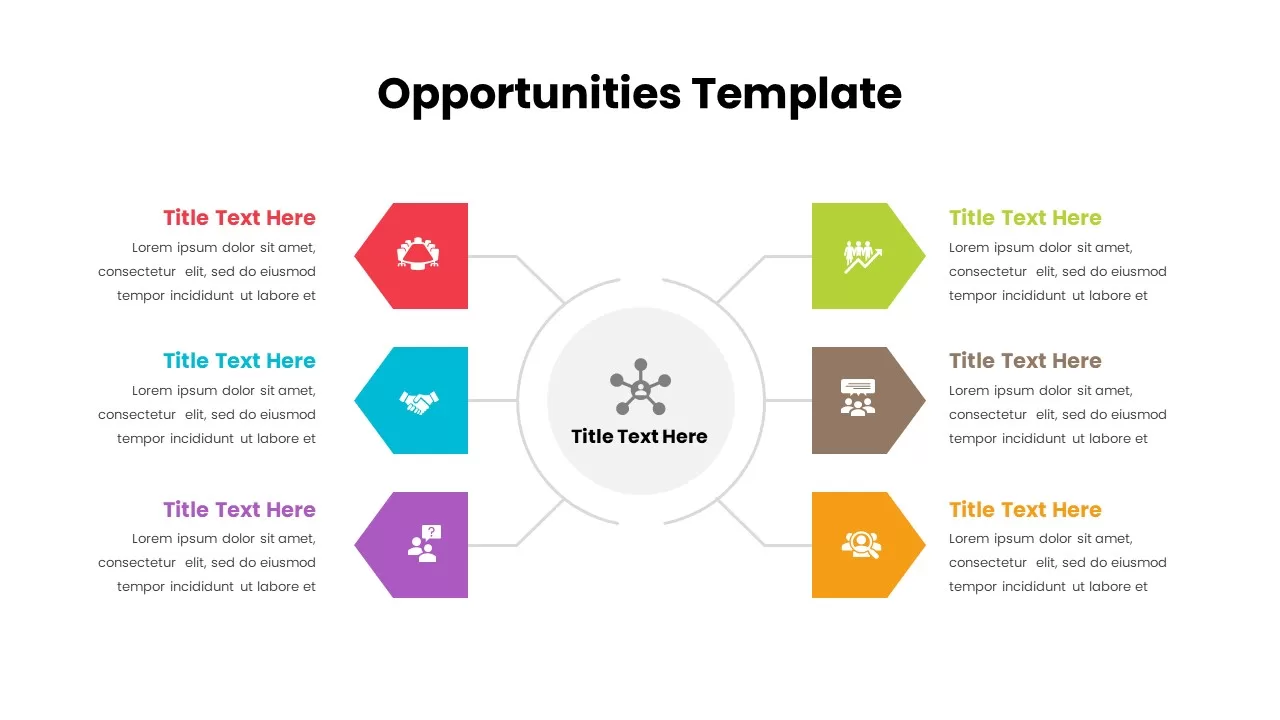
Opportunities Hub-and-Spoke Comparison Diagram Template for PowerPoint & Google Slides
Opportunities Challenges
Integrative Thinking Comparison Diagram Template for PowerPoint & Google Slides
Comparison
Market Share Comparison Diagram Template for PowerPoint & Google Slides
Comparison Chart
Two-Sided Coin Comparison Diagram Template for PowerPoint & Google Slides
Comparison
Attribution Models Comparison Diagram Template for PowerPoint & Google Slides
Comparison
Operating Channels Comparison Diagram Template for PowerPoint & Google Slides
Business Models
Service Zoom Feature Slides Comparison template for PowerPoint & Google Slides
Process
Simple Comparison Table Template for PowerPoint & Google Slides
Comparison
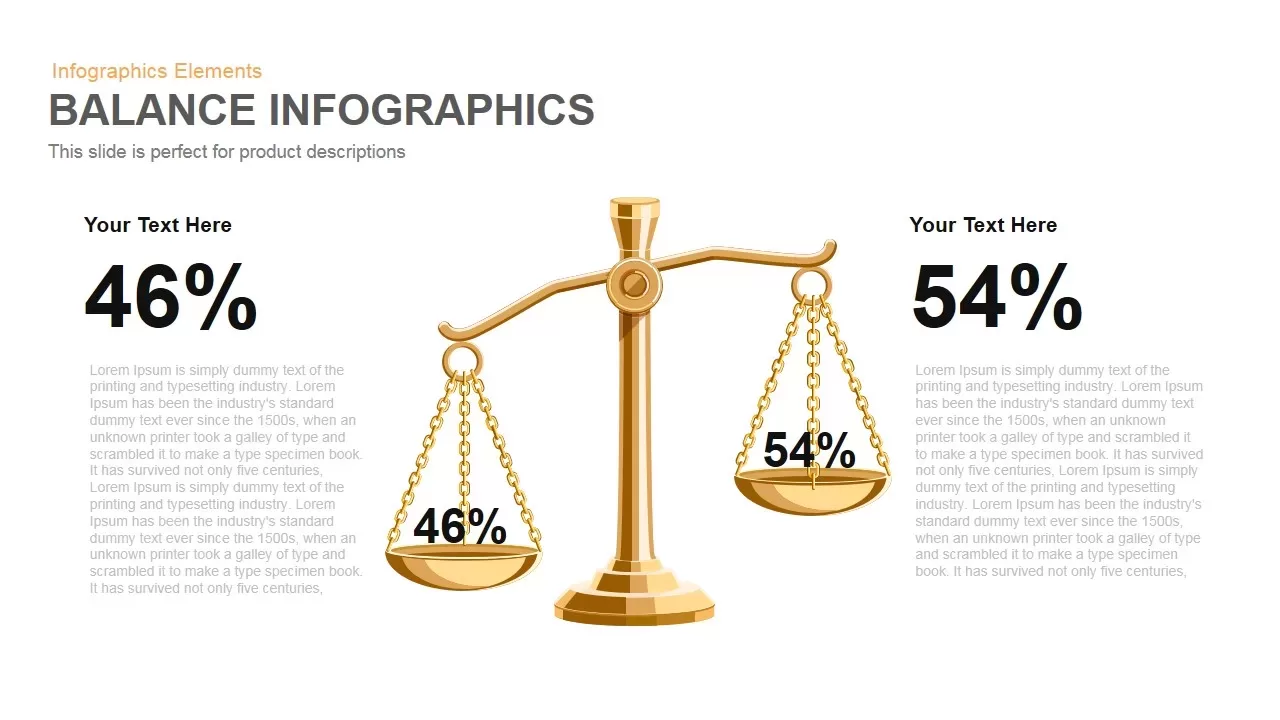
Gold Scales Balance Comparison Template for PowerPoint & Google Slides
Comparison
Four-Tier Pricing Comparison Table Template for PowerPoint & Google Slides
Comparison
3-Column Comparison template for PowerPoint & Google Slides
Comparison

A/B Testing Comparison Infographic template for PowerPoint & Google Slides
Comparison
Four-Plan Pricing Table Comparison Template for PowerPoint & Google Slides
Comparison
Interactive Product Comparison Bar Chart Template for PowerPoint & Google Slides
Bar/Column

Comparison Pricing Table Infographic Template for PowerPoint & Google Slides
Comparison Chart
Interactive Pricing Plan Comparison Template for PowerPoint & Google Slides
Comparison
Six-Metric Green Product Comparison Template for PowerPoint & Google Slides
Comparison
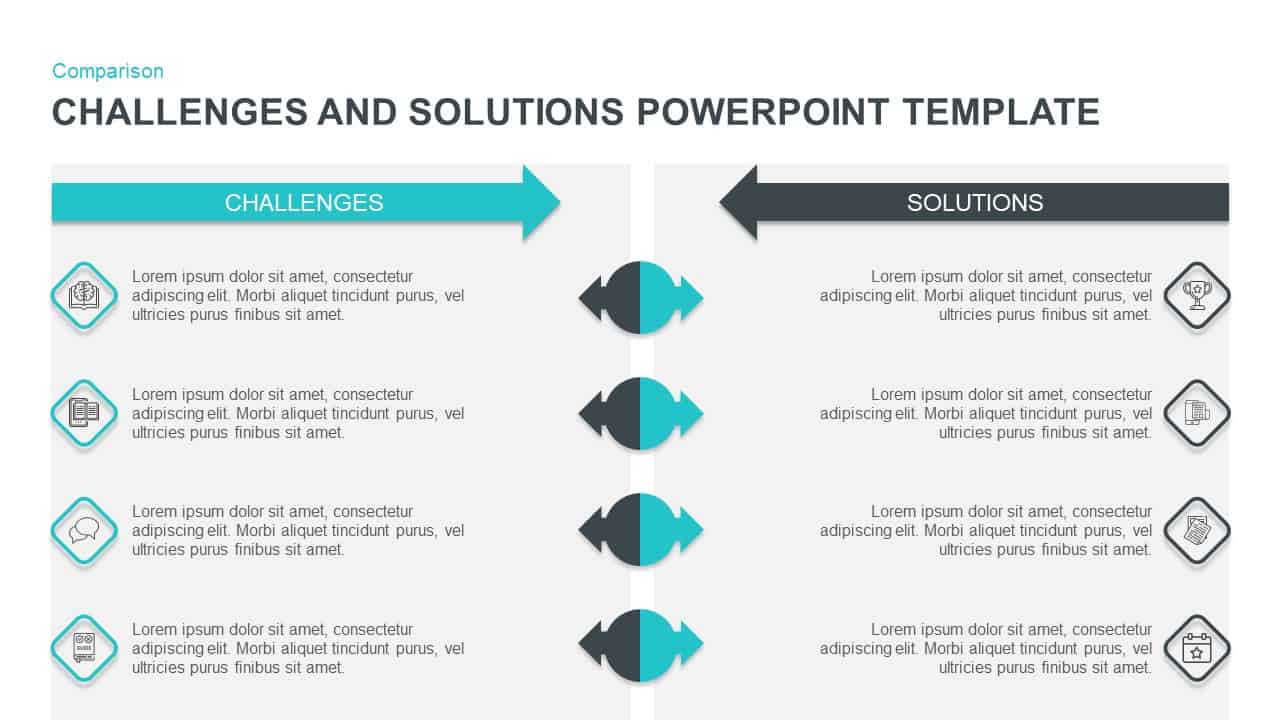
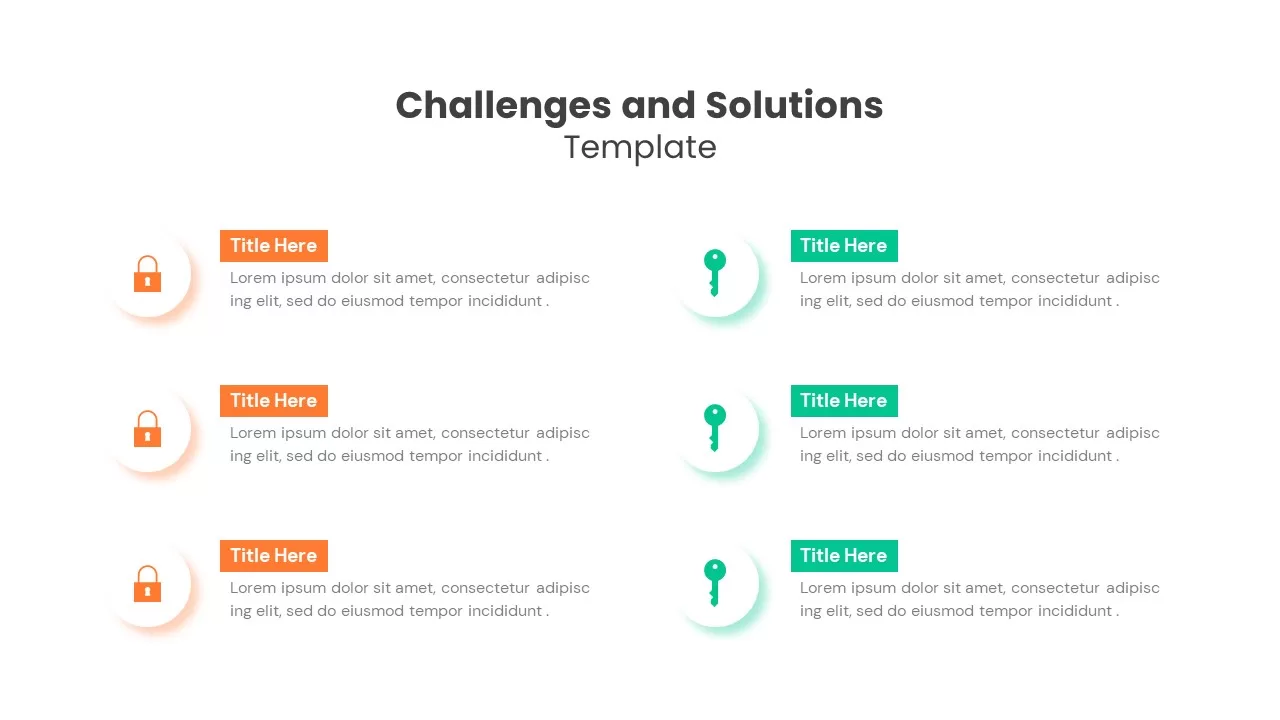
Challenges vs Solutions Comparison Template for PowerPoint & Google Slides
Comparison
Two-Column Comparison Infographic Slide Template for PowerPoint & Google Slides
Comparison
Generations Comparison Infographic Template for PowerPoint & Google Slides
Timeline
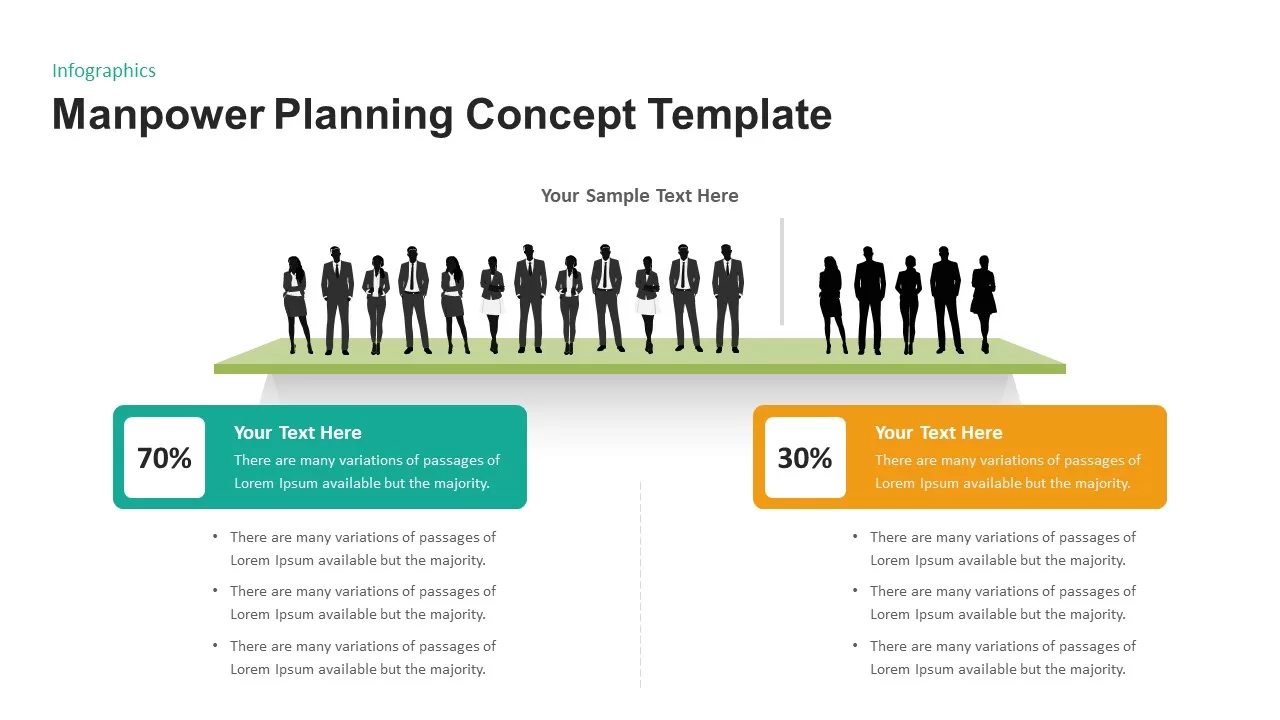
Manpower Planning Concept Comparison Template for PowerPoint & Google Slides
Comparison Chart
RAG Status Infographic Comparison Template for PowerPoint & Google Slides
Project
Yin Yang Comparison template for PowerPoint & Google Slides
Business
Current vs Future State Comparison Slide Template for PowerPoint & Google Slides
Comparison Chart
Current vs Future State Comparison Slide Template for PowerPoint & Google Slides
Comparison Chart
Current vs Future State Comparison Template for PowerPoint & Google Slides
Comparison Chart
Challenges & Opportunities Comparison Template for PowerPoint & Google Slides
Opportunities Challenges
Modern Before and After Comparison Template for PowerPoint & Google Slides
Infographics
Dynamic Benchmarking Comparison Chart Template for PowerPoint & Google Slides
Comparison Chart
Challenges & Solutions Comparison Template for PowerPoint & Google Slides
Opportunities Challenges
Adam’s Equity Theory Scale Comparison Template for PowerPoint & Google Slides
Comparison
Vendor Comparison Analysis template for PowerPoint & Google Slides
Comparison Chart
Vendor Comparison Matrix with High-Level Requirements template for PowerPoint & Google Slides
Comparison Chart
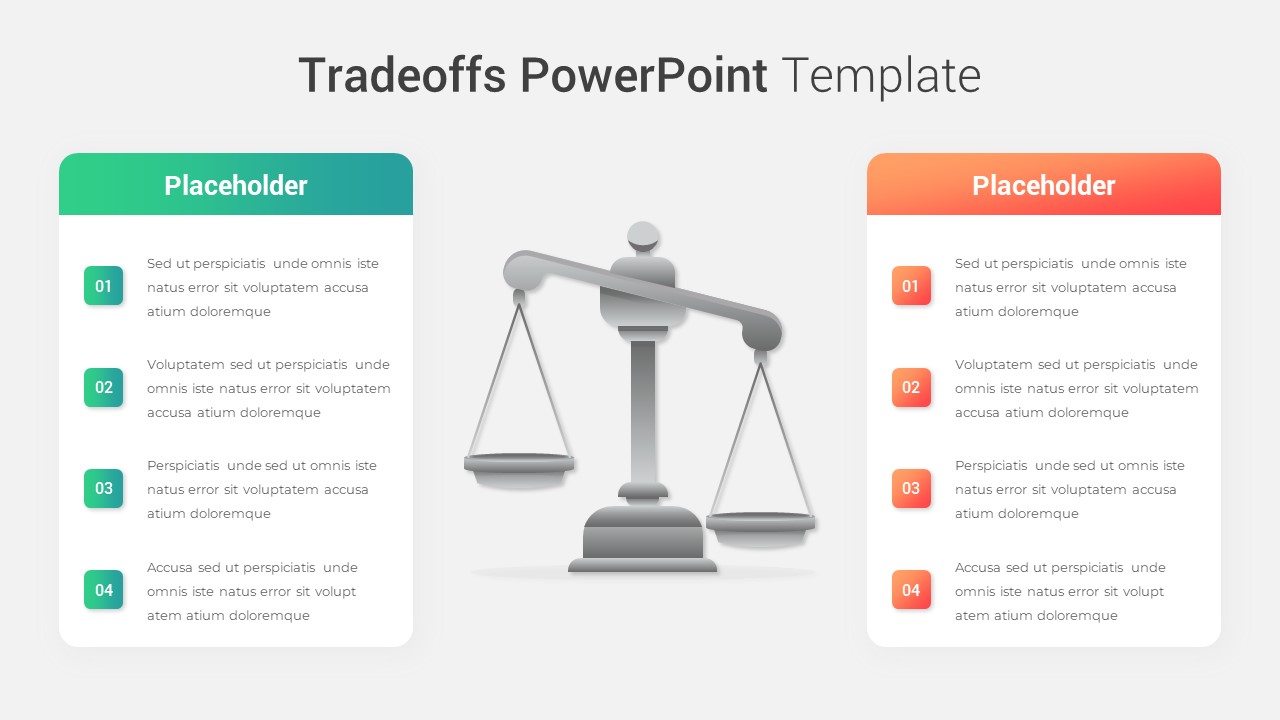
Modern Tradeoffs Comparison Slide Template for PowerPoint & Google Slides
Comparison
Popular Social Media Comparison Grid Template for PowerPoint & Google Slides
Digital Marketing
Hits and Misses Performance Comparison Template for PowerPoint & Google Slides
Comparison
Conflict Infographics Comparison Template for PowerPoint & Google Slides
Infographics
Clustered Bar Chart Comparison Template for PowerPoint & Google Slides
Bar/Column
Business Timeline Comparison Bar Chart Template for PowerPoint & Google Slides
Comparison Chart
Grouped Column Chart Comparison Template for PowerPoint & Google Slides
Bar/Column
Multiple Line Chart Comparison Template for PowerPoint & Google Slides
Comparison Chart
Interactive Multi-Use Cost Comparison Template for PowerPoint & Google Slides
Comparison
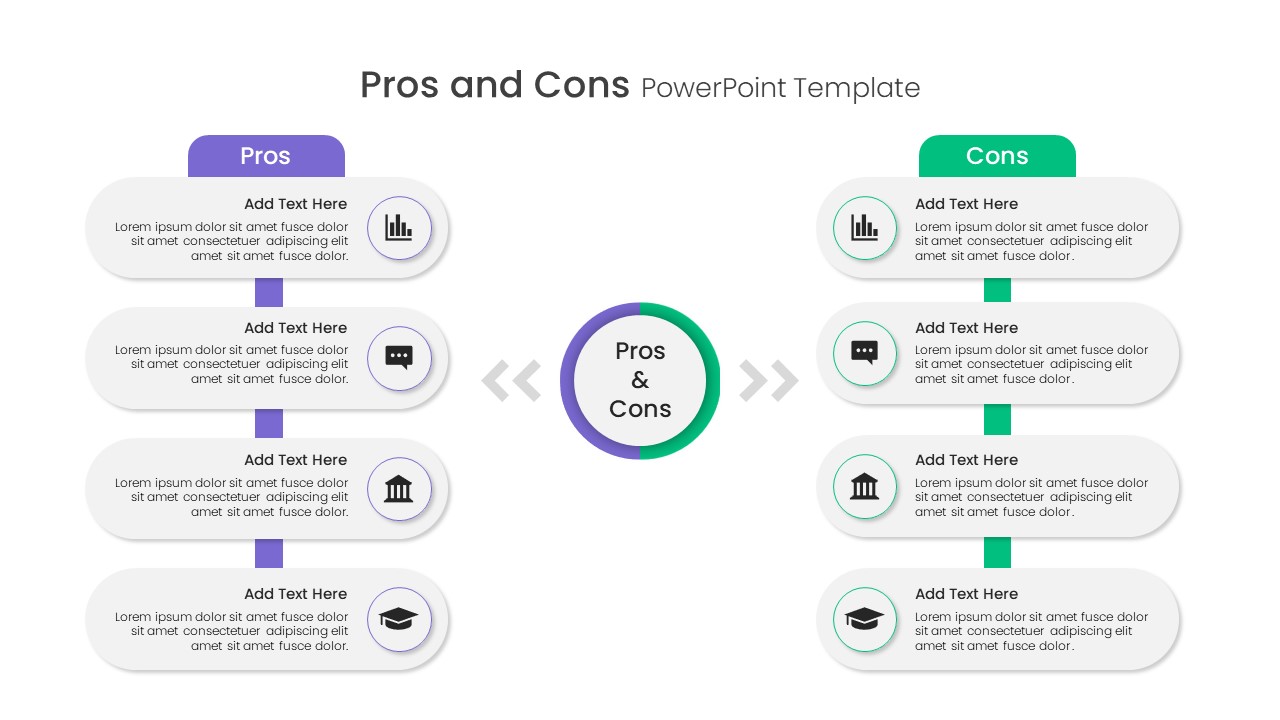
Free Pros and Cons Comparison Template for PowerPoint & Google Slides
Comparison
Free
Free Versatile Product Comparison Chart Template for PowerPoint & Google Slides
Charts
Free
AI vs. Human Intelligence Comparison Template for PowerPoint & Google Slides
Comparison
Quarterly Revenue Comparison Bar Chart Template for PowerPoint & Google Slides
Bar/Column
Regional Revenue Comparison Overview Template for PowerPoint & Google Slides
Comparison
Project Comparison Timeline Roadmap Template for PowerPoint & Google Slides
Comparison
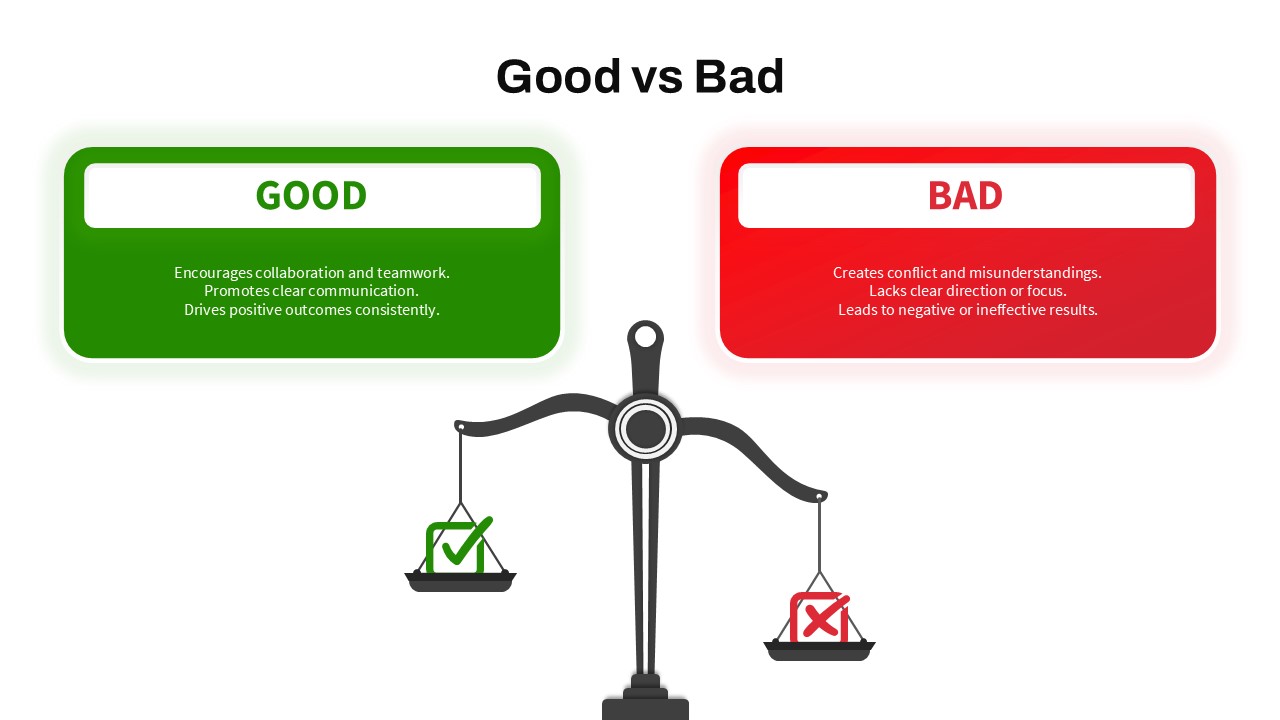
Good vs Bad Comparison with Scale Template for PowerPoint & Google Slides
Comparison
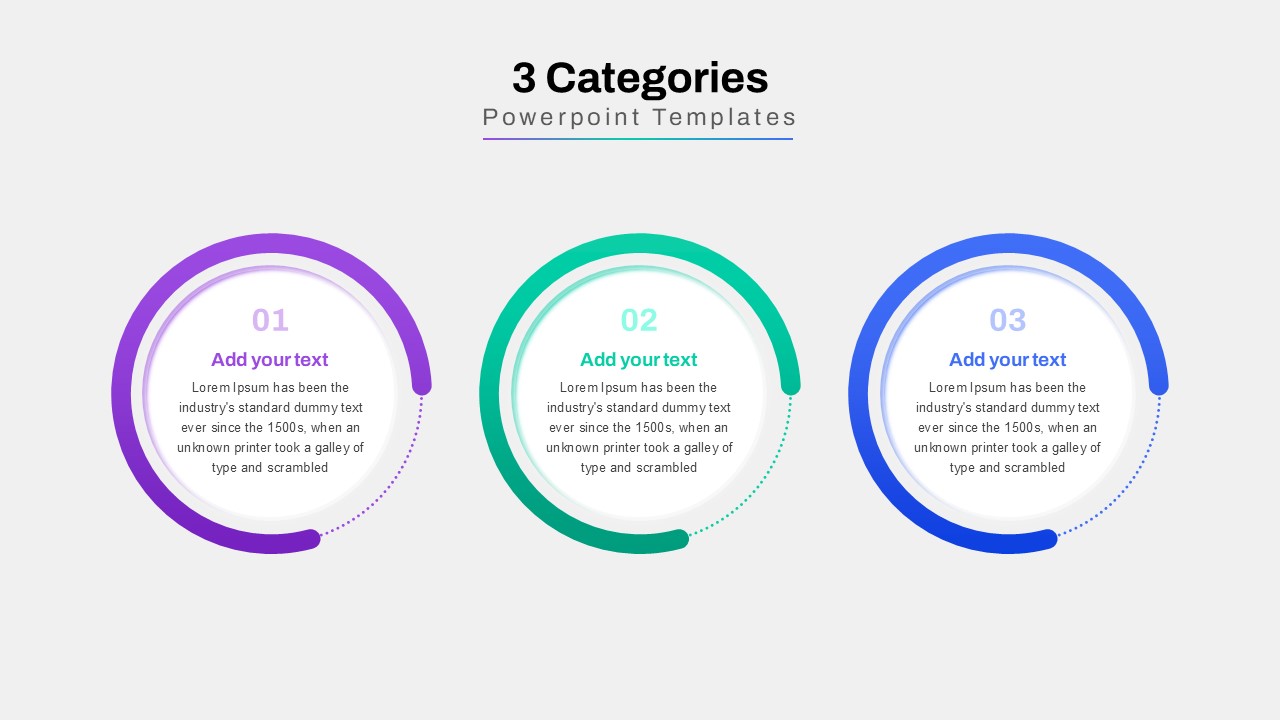
Three-Category Comparison Template for PowerPoint & Google Slides
Comparison
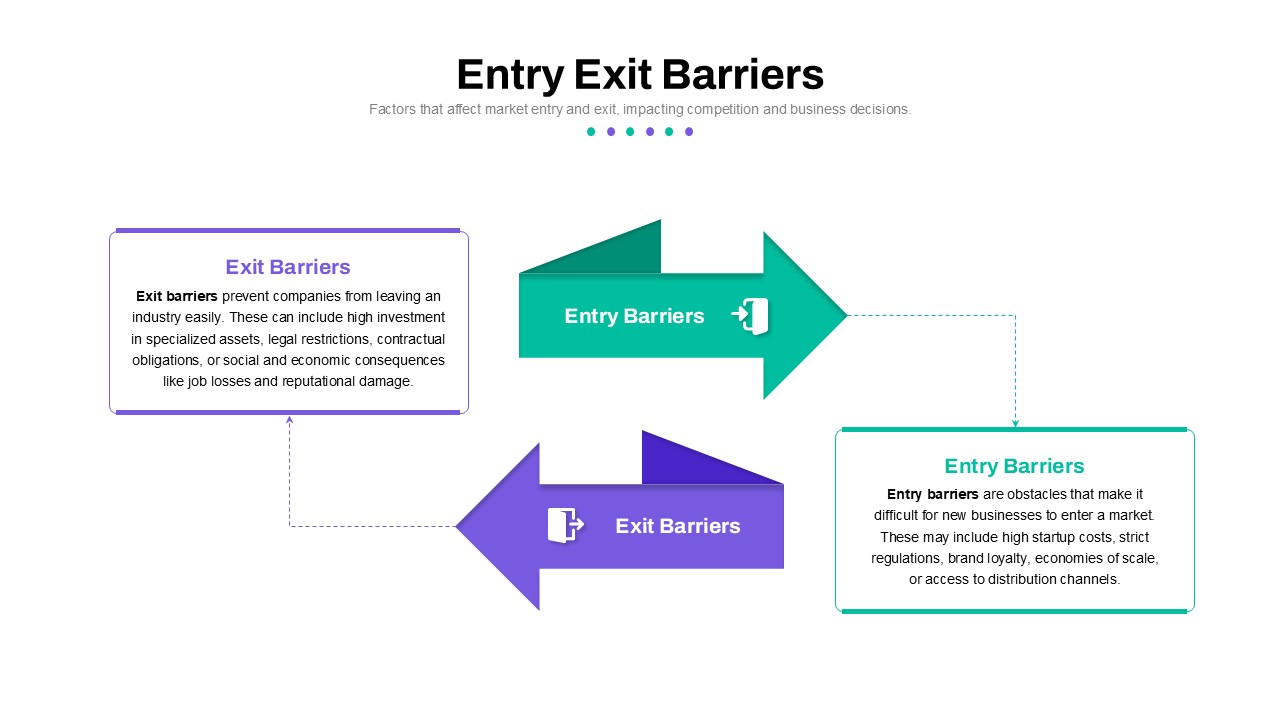
Entry and Exit Barriers Comparison Template for PowerPoint & Google Slides
Comparison
Competitor Comparison Chart Design Template for PowerPoint & Google Slides
Comparison
Two-Option Bar Chart Comparison Table Template for PowerPoint & Google Slides
Comparison
Profile Comparison Chart template for PowerPoint & Google Slides
Comparison Chart
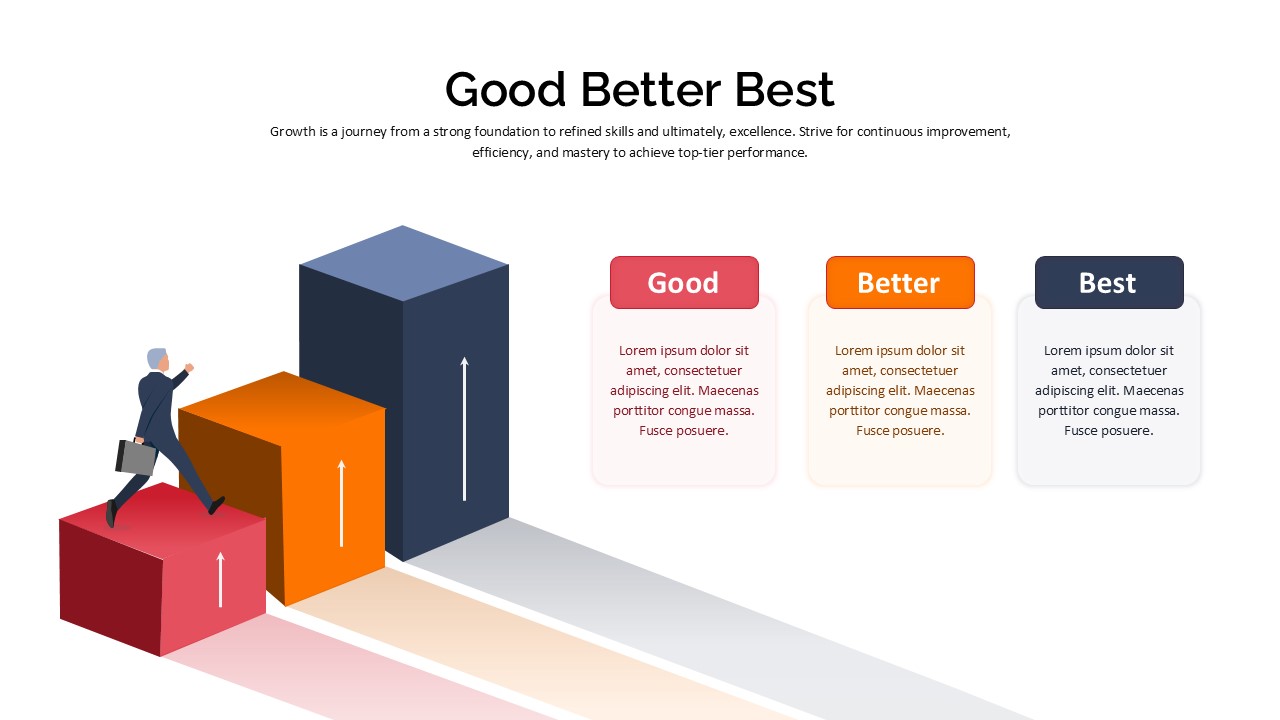
Good Better Best Comparison template for PowerPoint & Google Slides
Comparison
Product Feature Comparison Table Template for PowerPoint & Google Slides
Comparison Chart
Competitor Profile Matrix Comparison Template for PowerPoint & Google Slides
Comparison Chart
Sales Growth Comparison Chart & Table Template for PowerPoint & Google Slides
Bar/Column
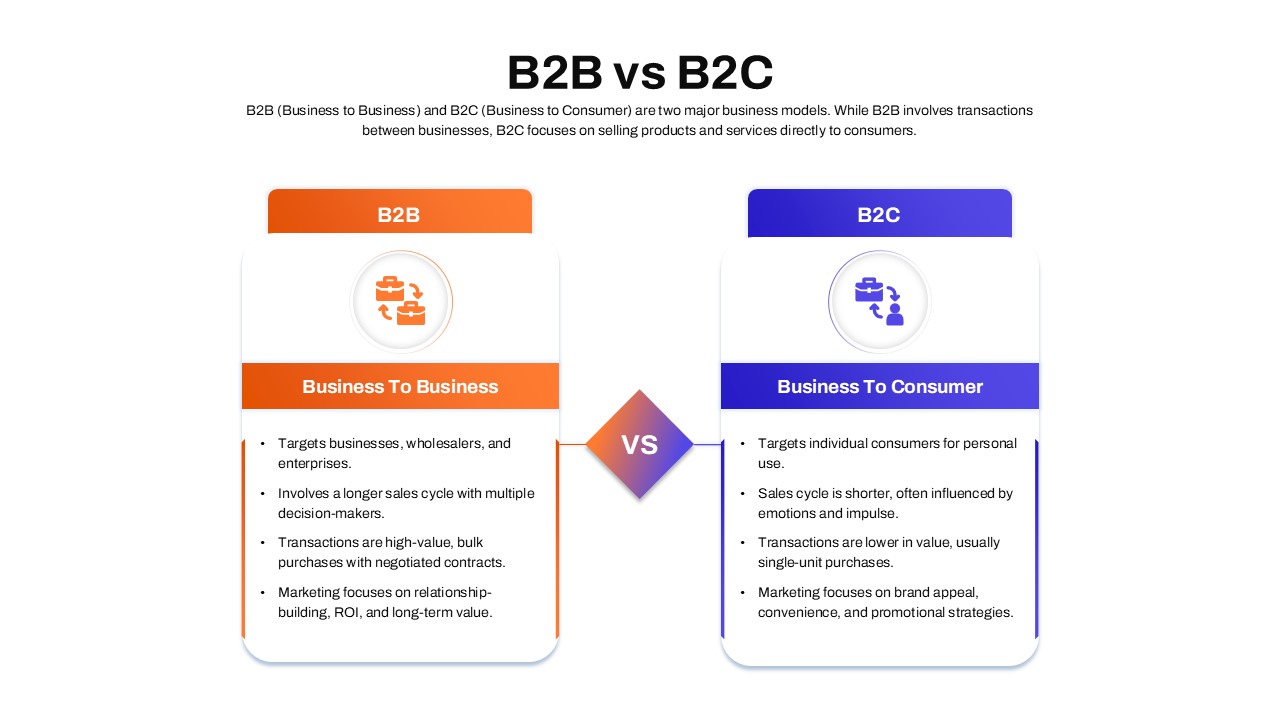
B2B vs B2C Comparison template for PowerPoint & Google Slides
Business Models
VUCA vs BANI Comparison Infographic Template for PowerPoint & Google Slides
Comparison
Skills Gap Analysis Comparison Chart Template for PowerPoint & Google Slides
Gap
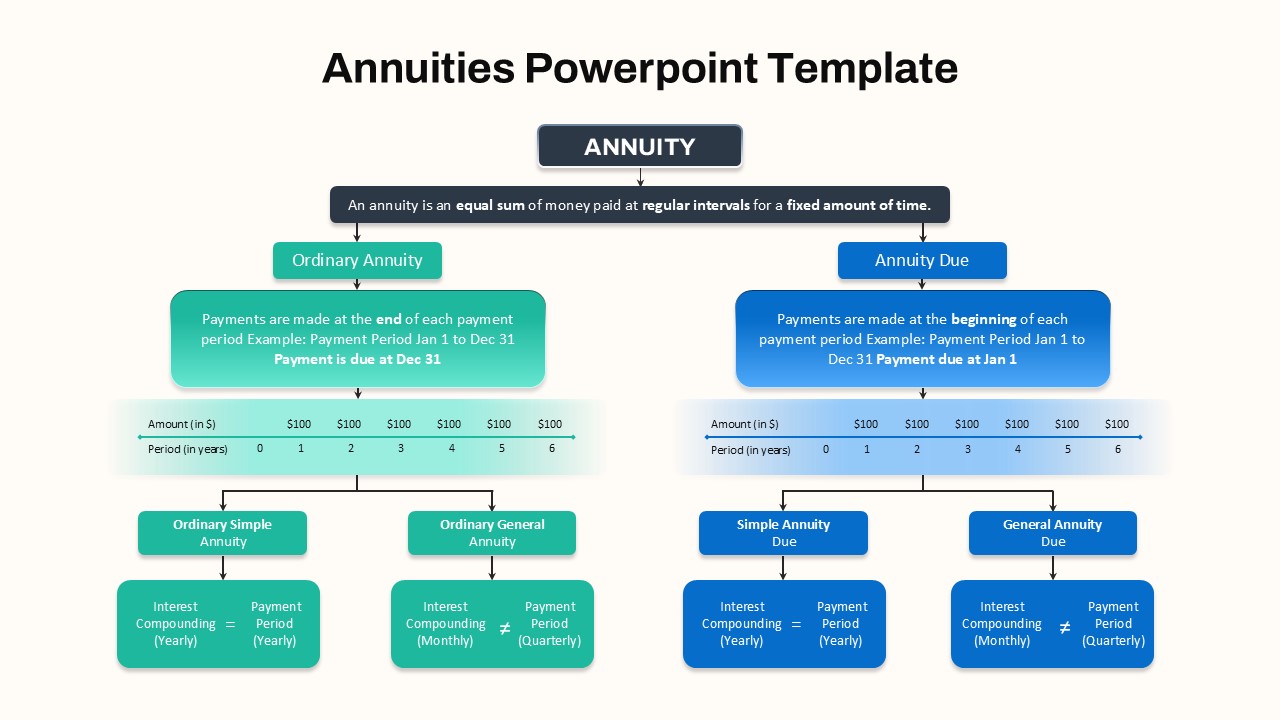
Hierarchical Annuity Comparison Flowchart Template for PowerPoint & Google Slides
Business Report
Feasibility Matrix Comparison Chart Template for PowerPoint & Google Slides
Comparison Chart
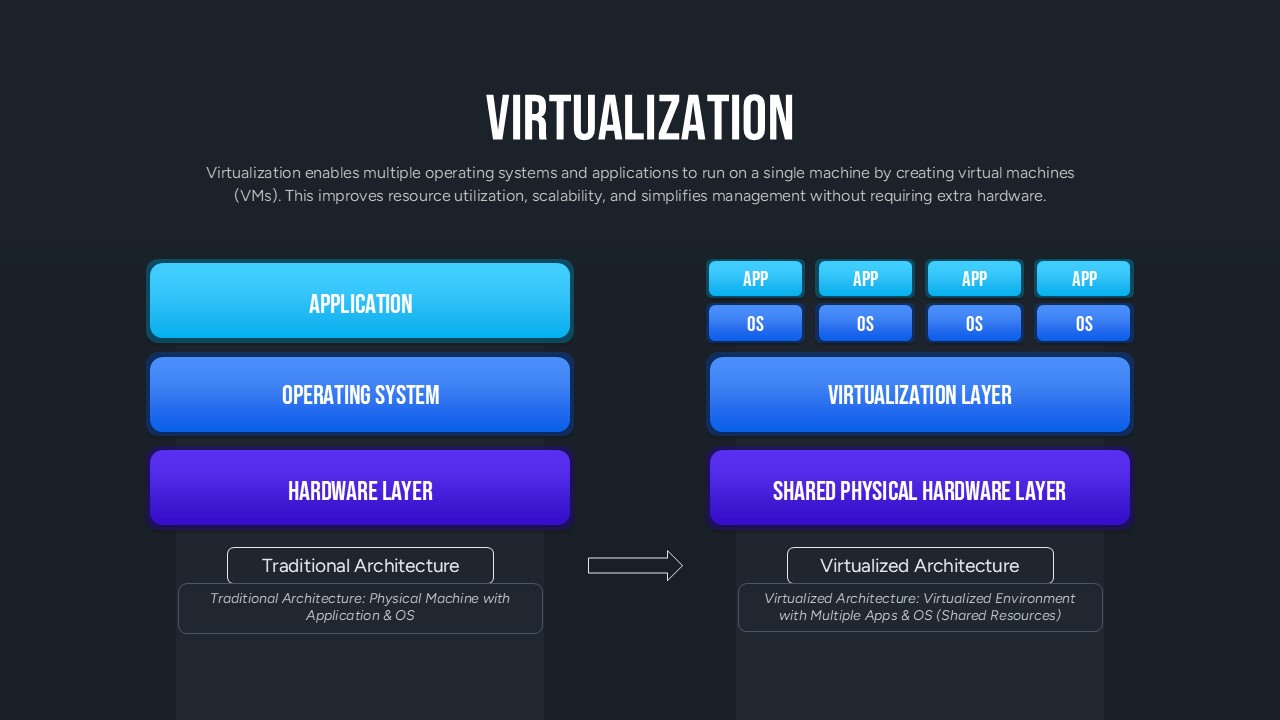
Virtualization Architecture Comparison Template for PowerPoint & Google Slides
Comparison Chart
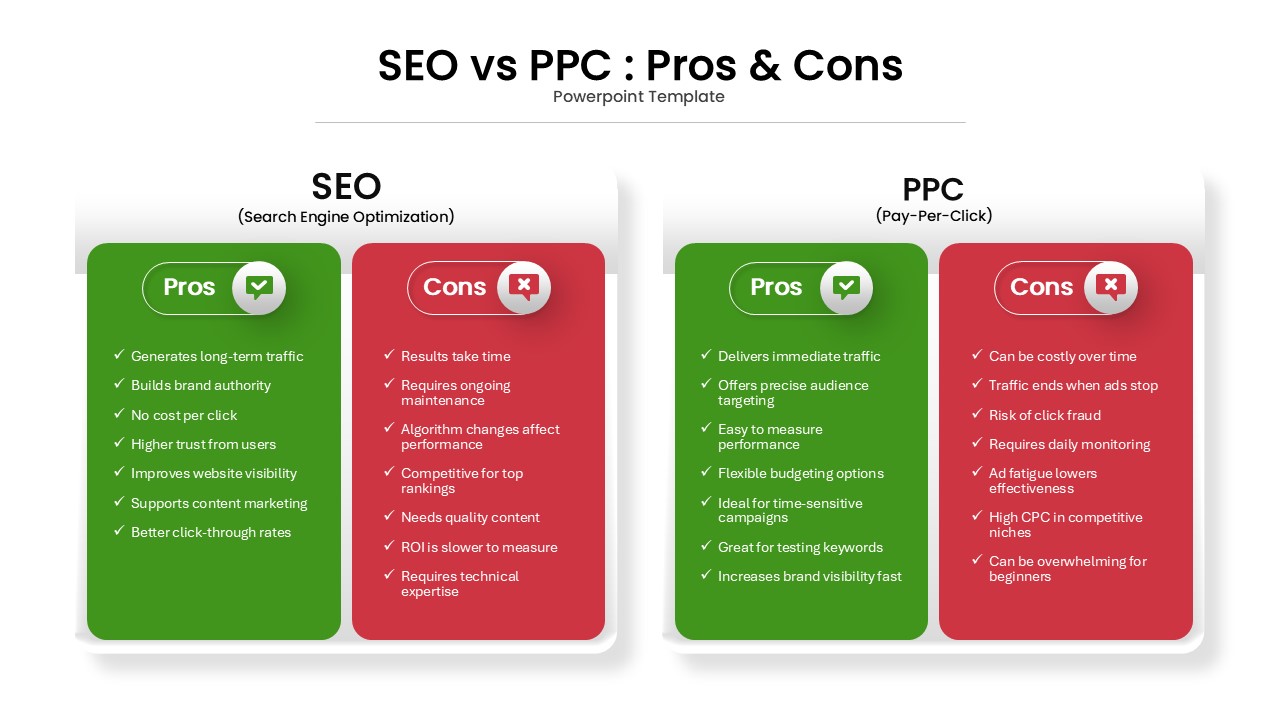
SEO vs PPC: Pros & Cons Comparison Template for PowerPoint & Google Slides
Comparison
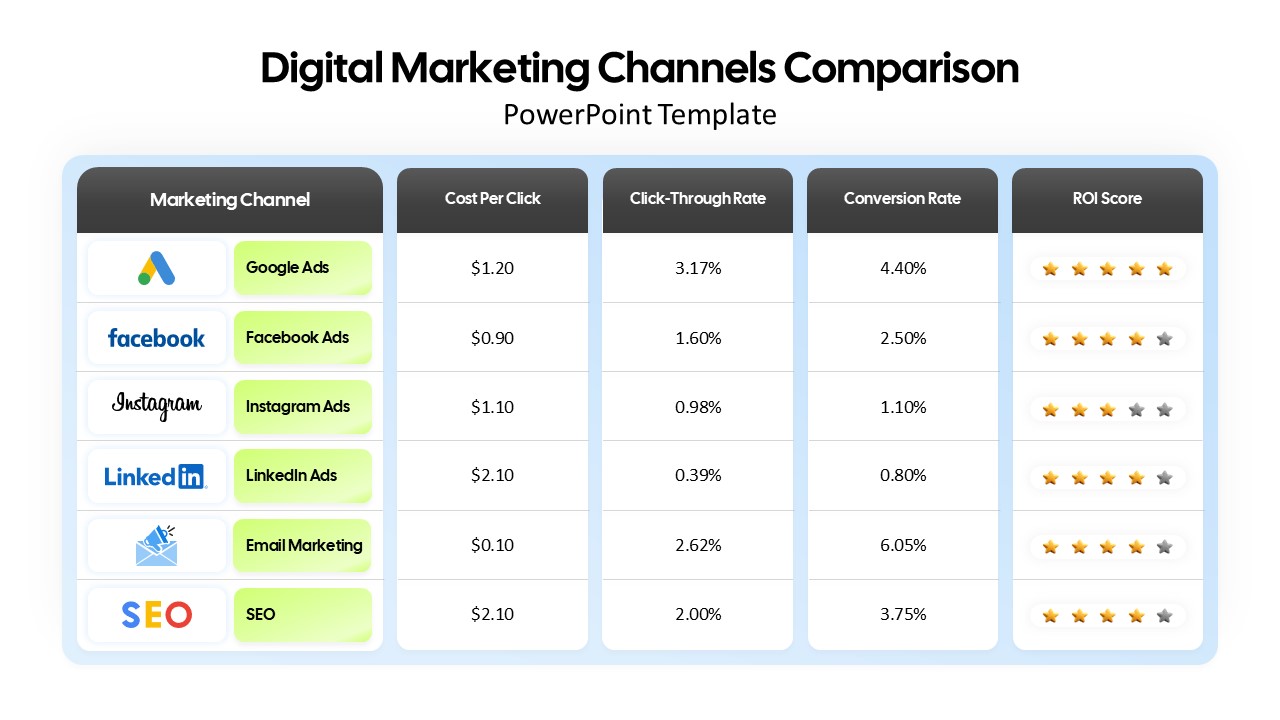
Digital Marketing Channels Comparison template for PowerPoint & Google Slides
Business
Colorful Business Data Comparison Table Template for PowerPoint & Google Slides
Table
Year-over-Year Performance Comparison Template for PowerPoint & Google Slides
Comparison Chart
Blank Comparison Chart Template for PowerPoint & Google Slides
Comparison Chart