Flywheel Infographics Pack Template for PowerPoint & Google Slides


Description
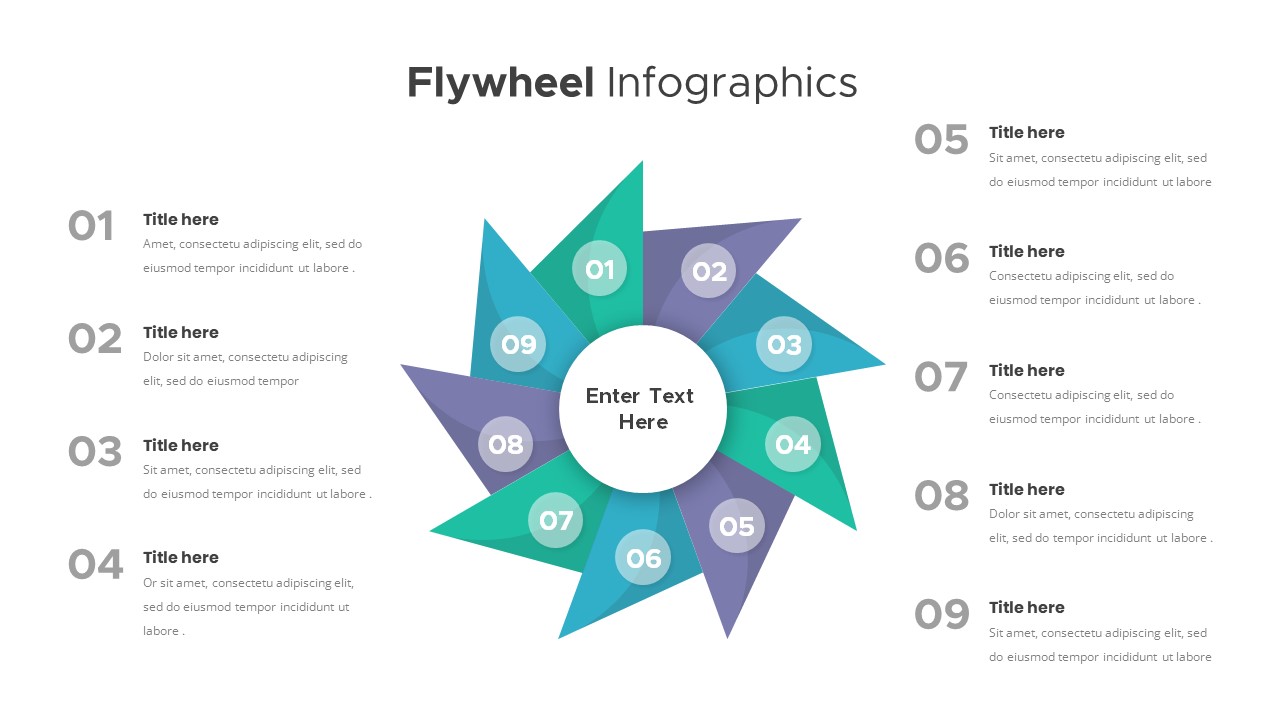
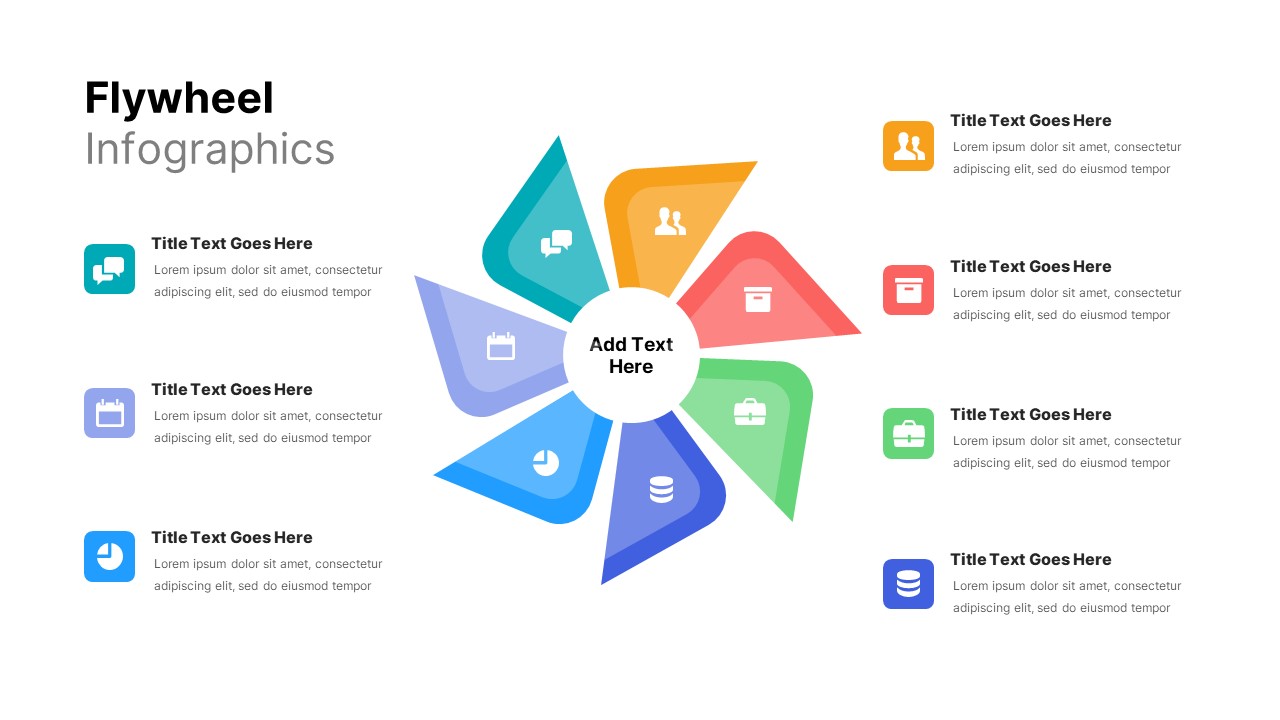
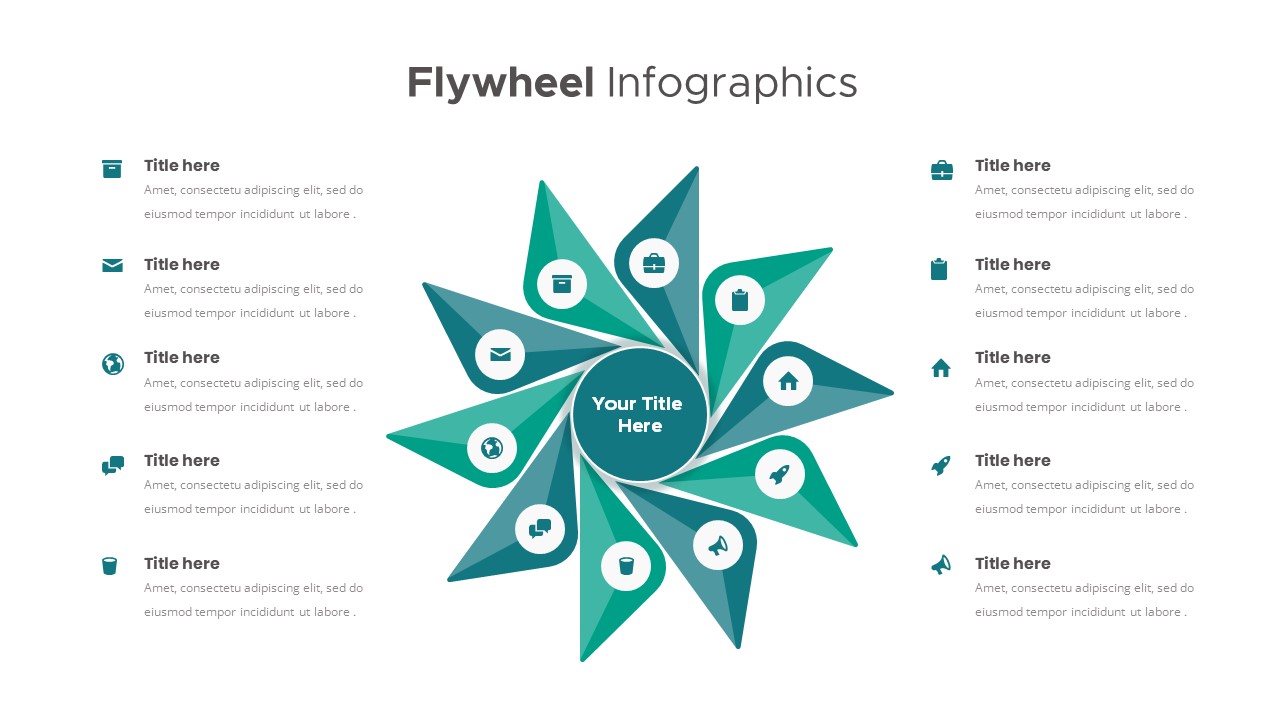
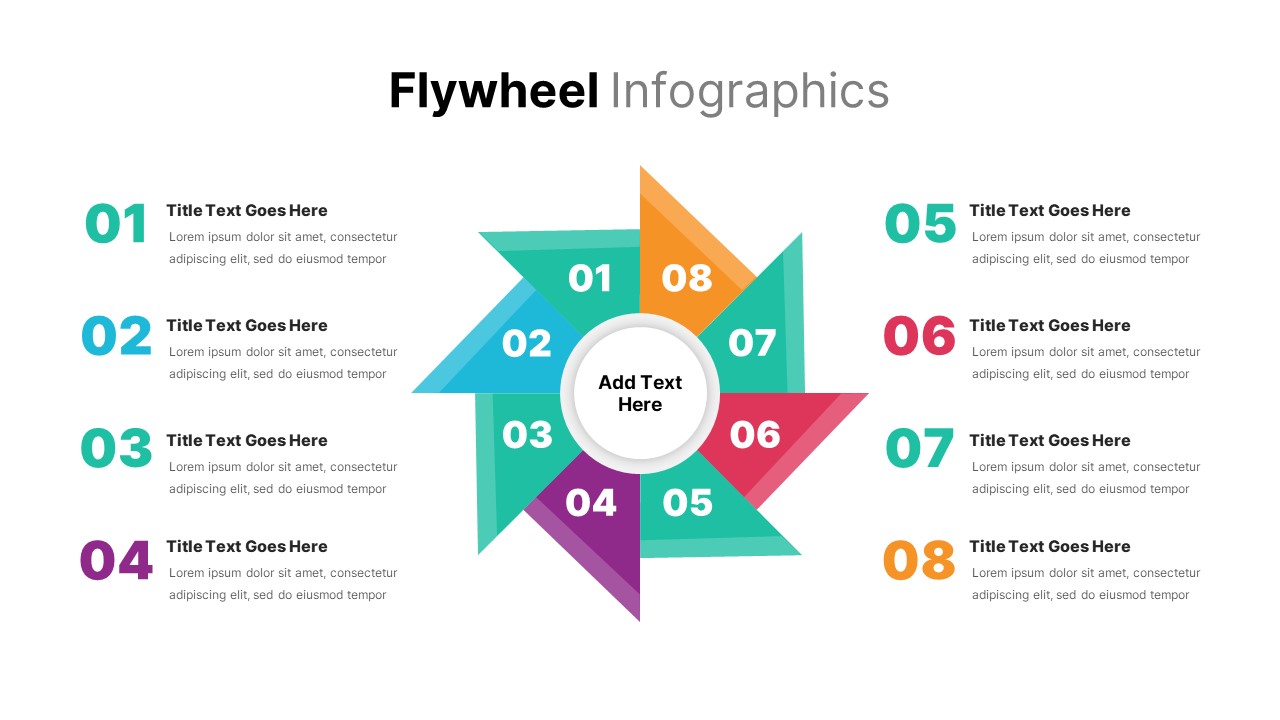
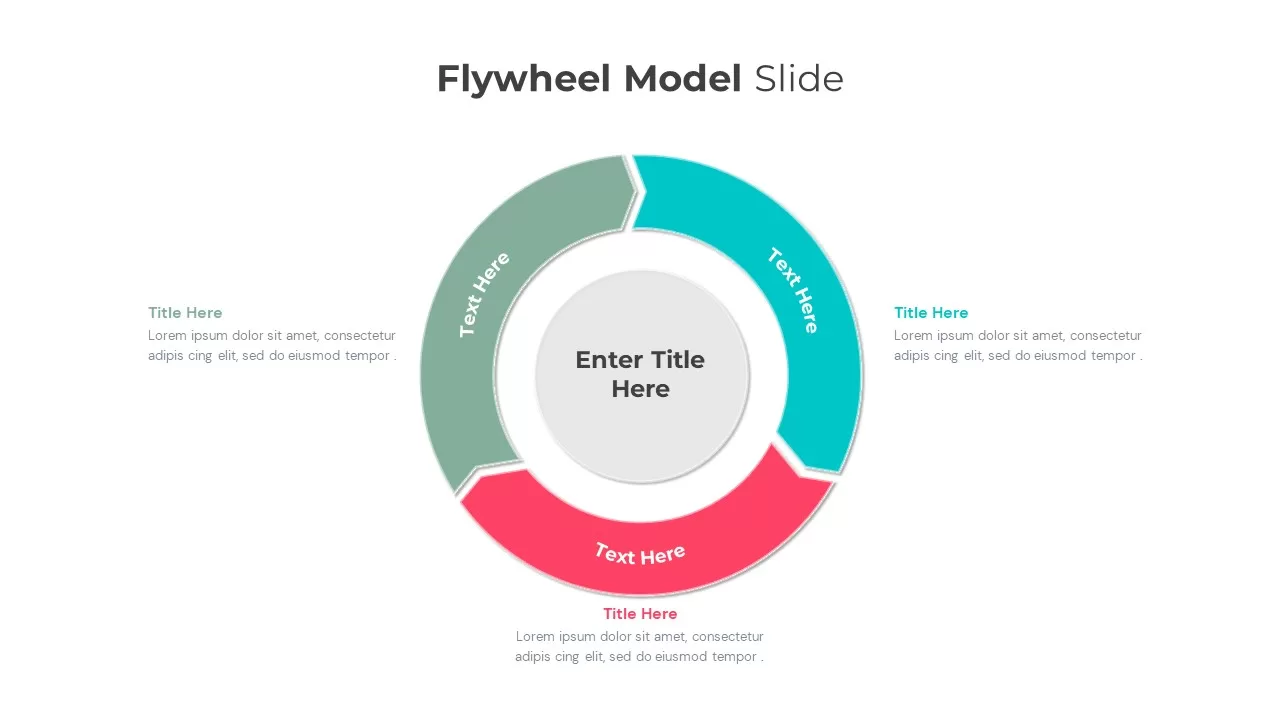
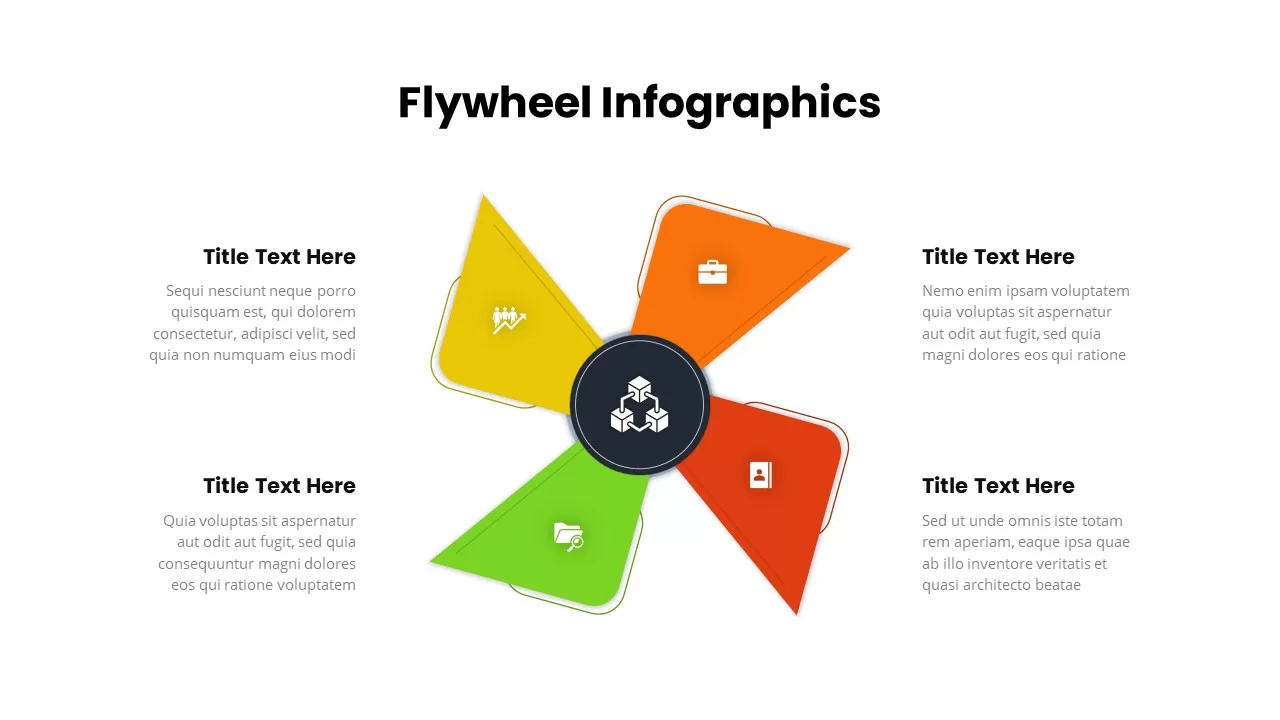
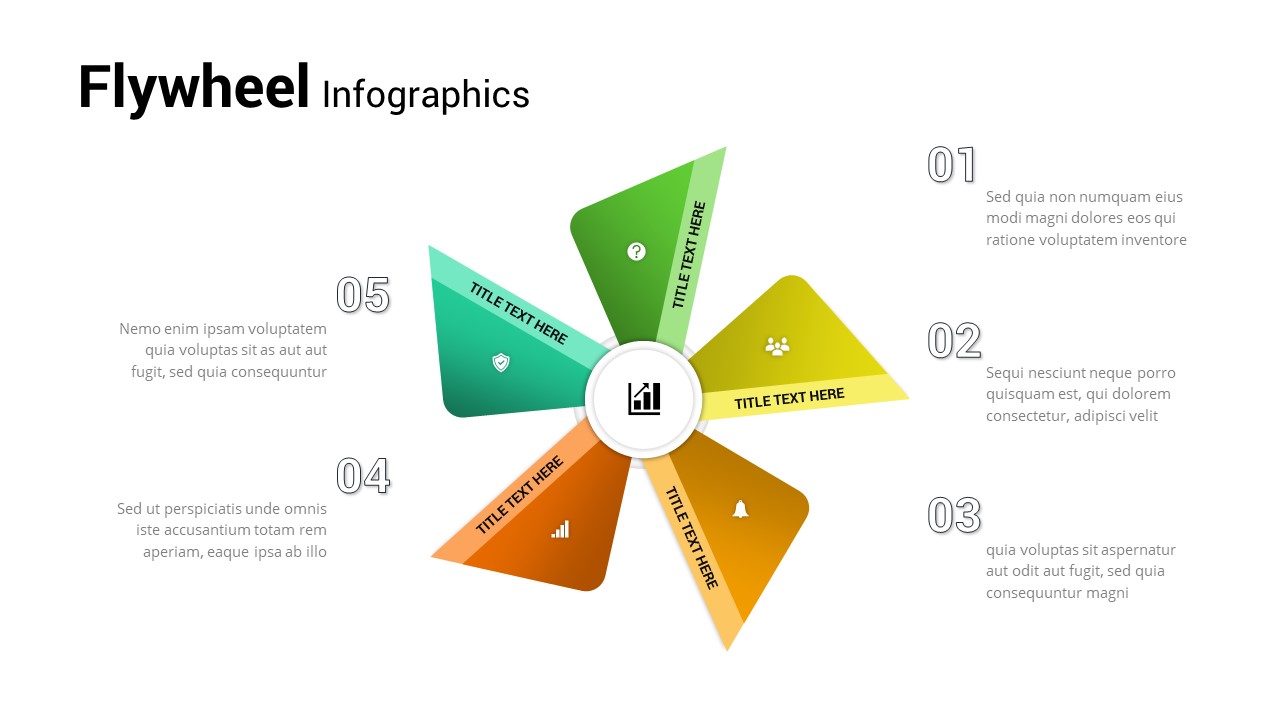
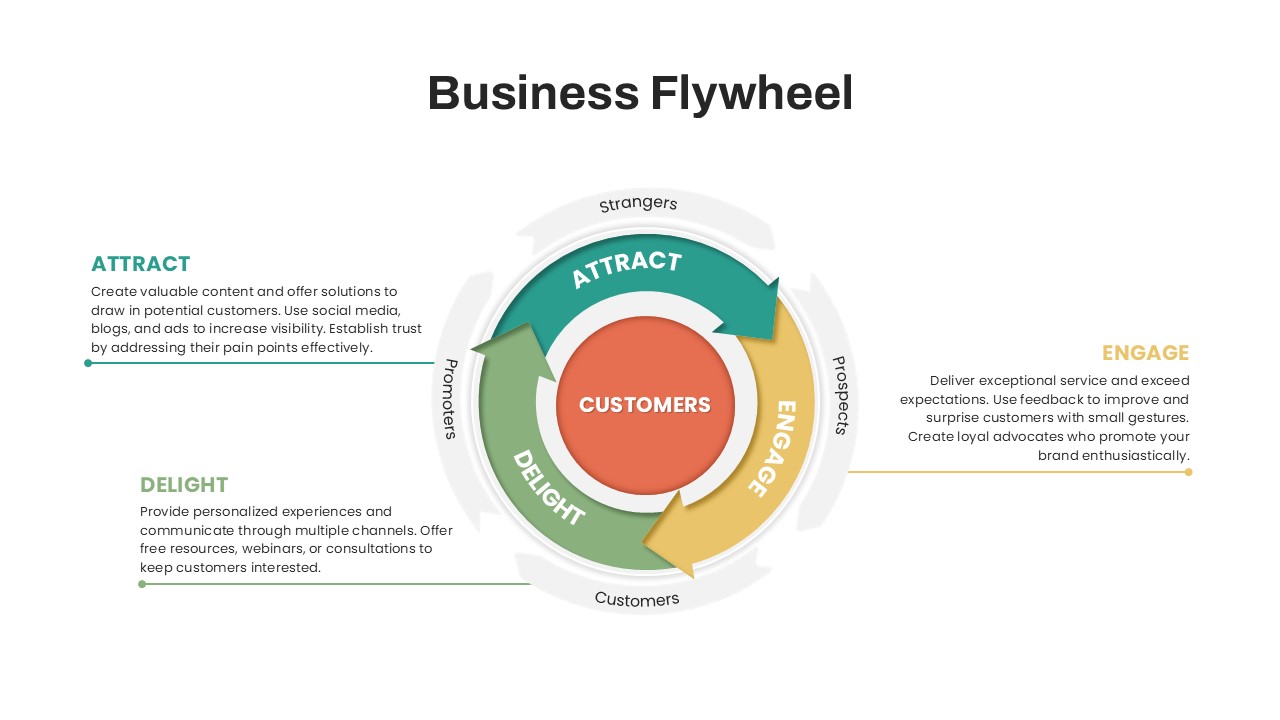
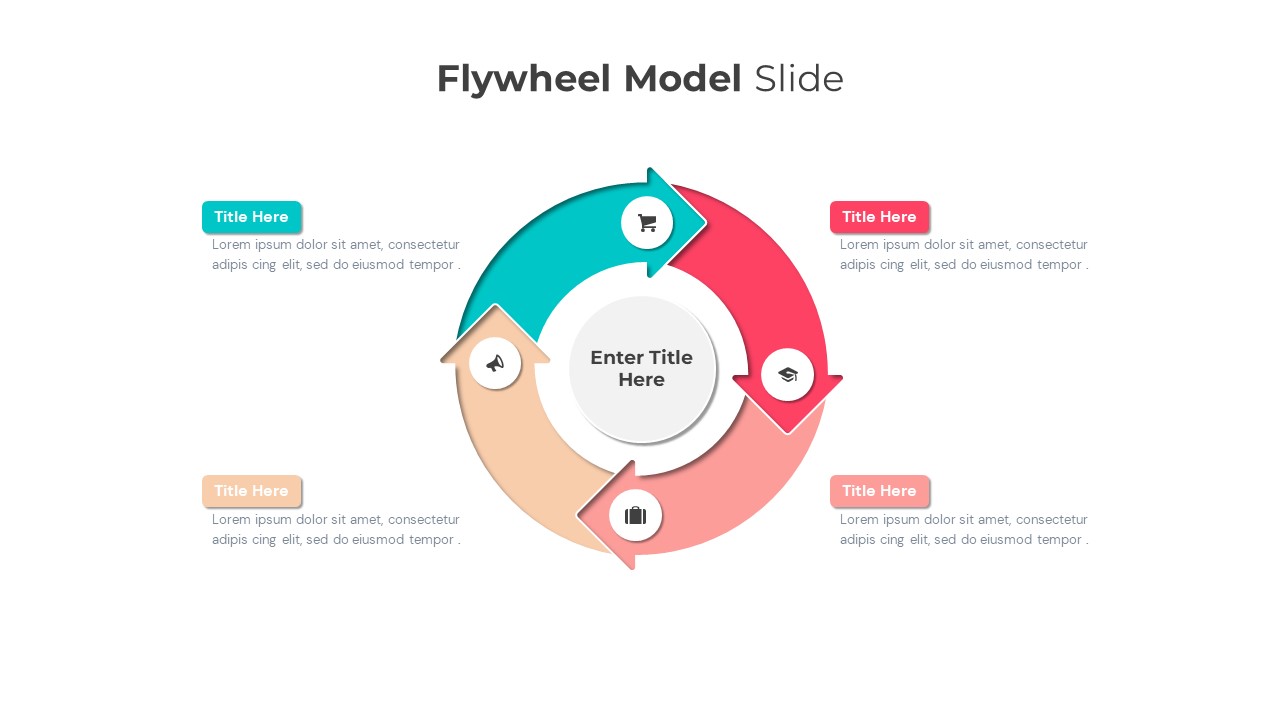
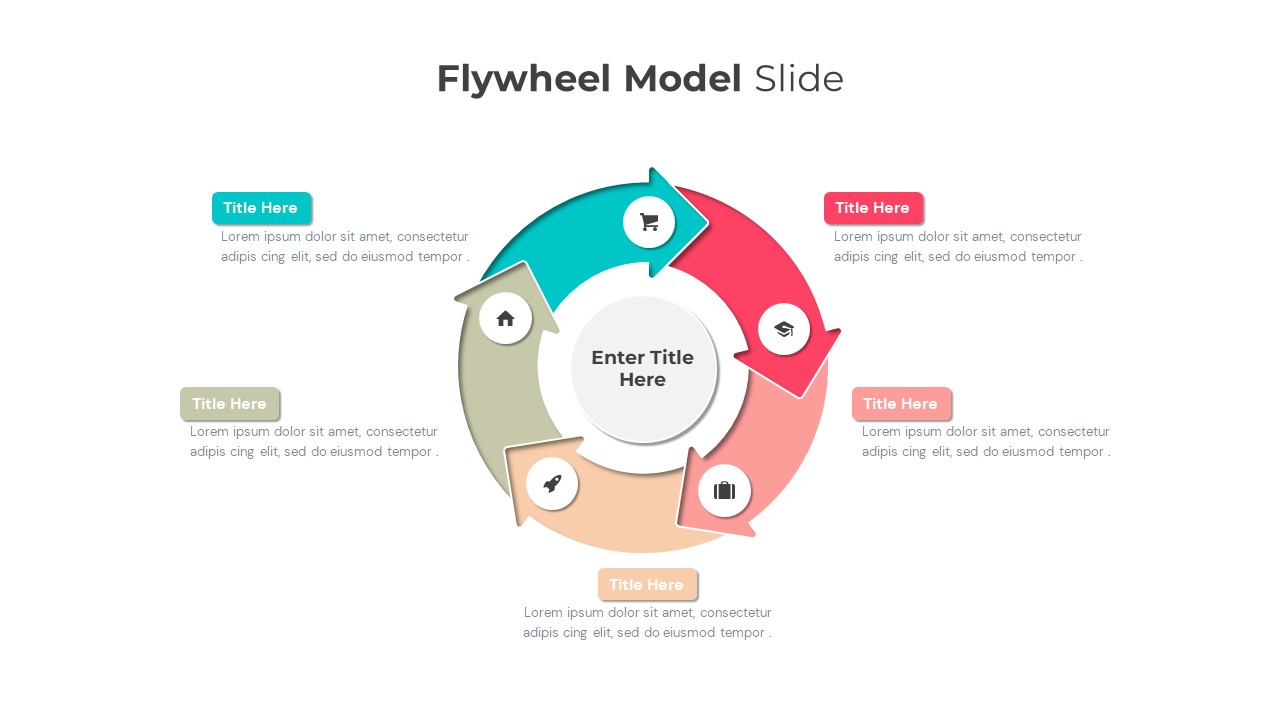
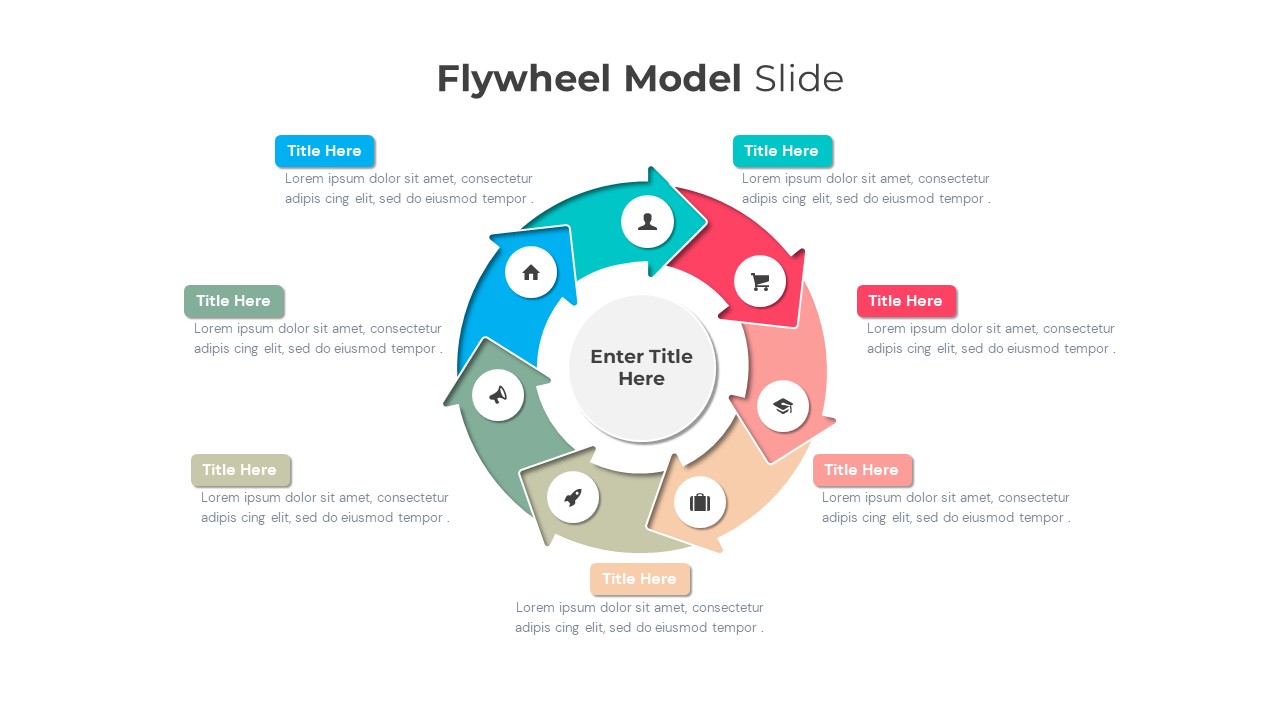
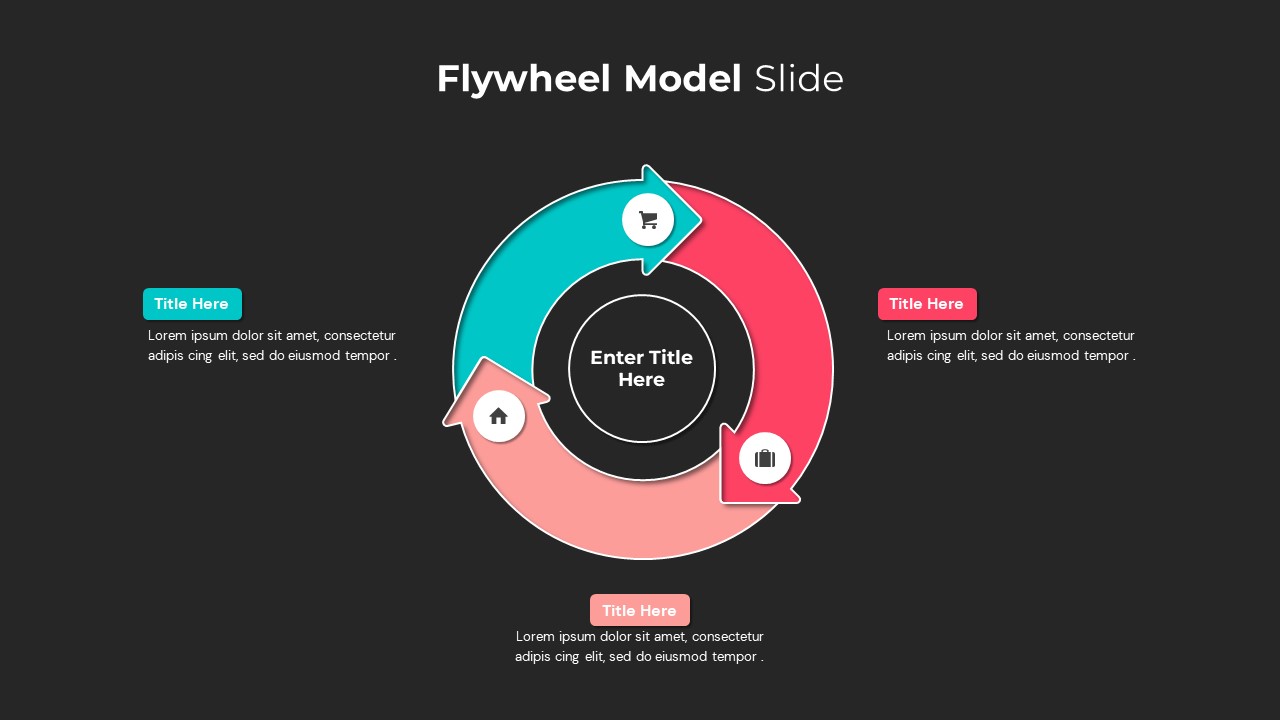
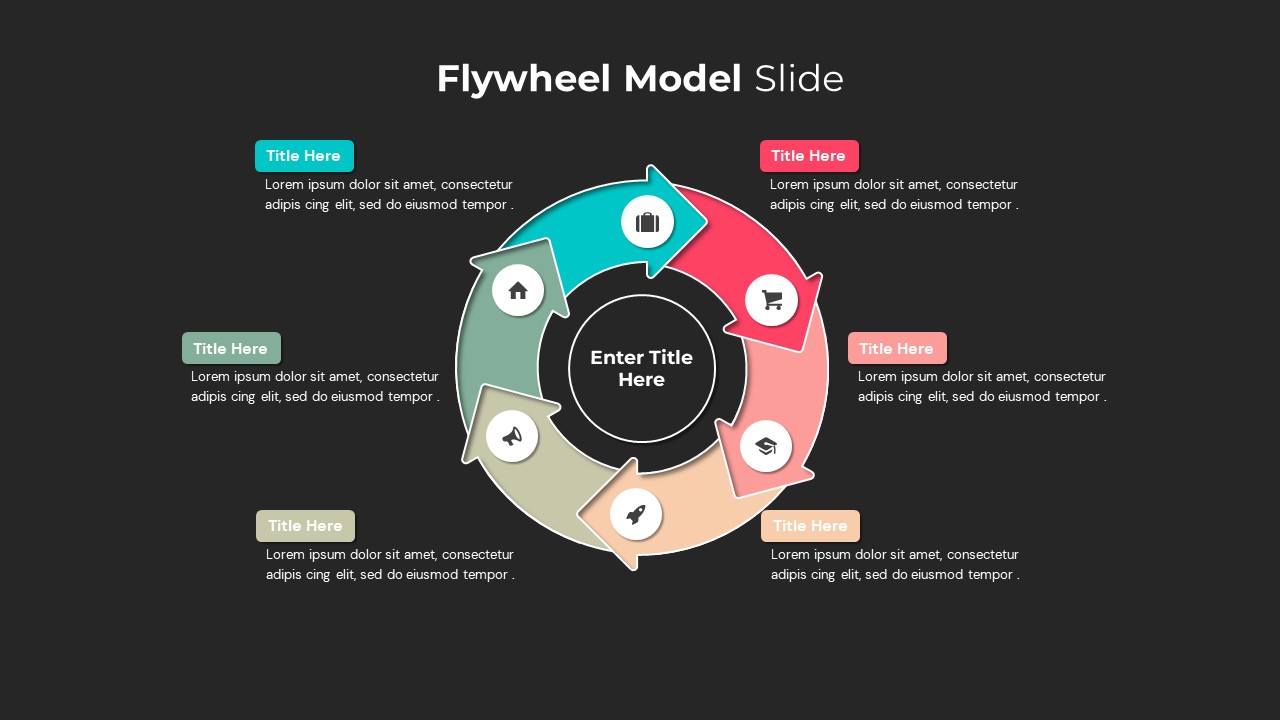
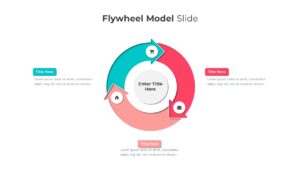
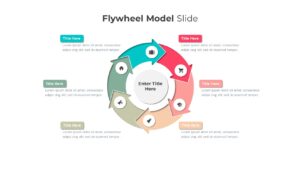
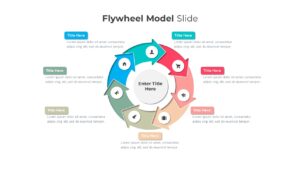
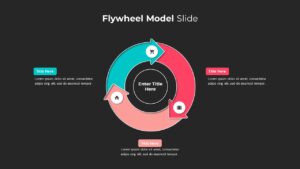
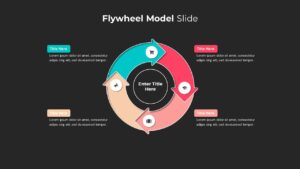
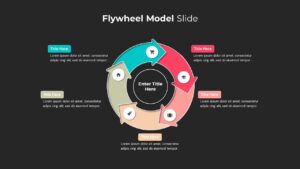
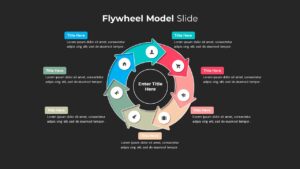
Leverage this pack of five fully editable flywheel infographic slides to illustrate cyclical processes, strategic frameworks, and growth loops with unparalleled clarity. Each variation features a central circular hub labeled for your core metric or concept, surrounded by three bold arrow-shaped segments in contrasting colors—teal, coral, and red—that visually reinforce momentum and interdependence. Icon placeholders at each arrow tip let you swap in industry-relevant symbols (shopping cart, briefcase, home, and more), while matching text boxes on the left, right, and bottom provide space for concise headings and descriptive copy. A subtle gradient arrow marker and clean background maintain focus on your content, and consistent master layouts ensure rapid adaptation across all five slides.
Built with vector shapes and preconfigured animations, this infographic pack streamlines customization: adjust segment hues, reposition arrows, edit text styles, or replace icons in just a few clicks without losing alignment. The modern flat design, accented by mild drop shadows and crisp typography, delivers a professional aesthetic that aligns seamlessly with both corporate and creative branding. Cross-platform compatibility between PowerPoint and Google Slides eliminates formatting headaches and version-control issues, so you can collaborate confidently across devices.
Whether you’re mapping customer acquisition loops, showcasing product lifecycle stages, or presenting iterative marketing funnels, this flywheel pack offers flexibility. Use individual slides to emphasize different metrics—revenue, engagement, retention—and guide audiences through each phase step-by-step. The varied layouts also support side-by-side comparisons of scenarios, A/B testing results, or department-specific workflows, making this asset ideal for executive briefings, strategy workshops, and investor pitches.
Who is it for
Marketing leaders, product managers, and business strategists will benefit from these flywheel diagrams when illustrating growth models, operational cycles, or process optimizations. Project managers, consultants, and startup founders can leverage the three-step format to drive alignment and facilitate data-driven discussions.
Other Uses
Beyond strategic frameworks, repurpose these slides for sales pipeline visualization, user journey mapping, performance review cycles, or educational workshops on continuous improvement. Swap icons and colors to adapt the flywheel to any industry or department need.
Login to download this file

Item ID
SB03122
Related Templates

Flywheel Infographics template for PowerPoint & Google Slides
Process
Flywheel Infographics template for PowerPoint & Google Slides
Business Strategy
Flywheel Infographics template for PowerPoint & Google Slides
Business Strategy
Flywheel Infographics template for PowerPoint & Google Slides
Business Strategy
Venn Diagram Infographics Pack Template for PowerPoint & Google Slides
Circular
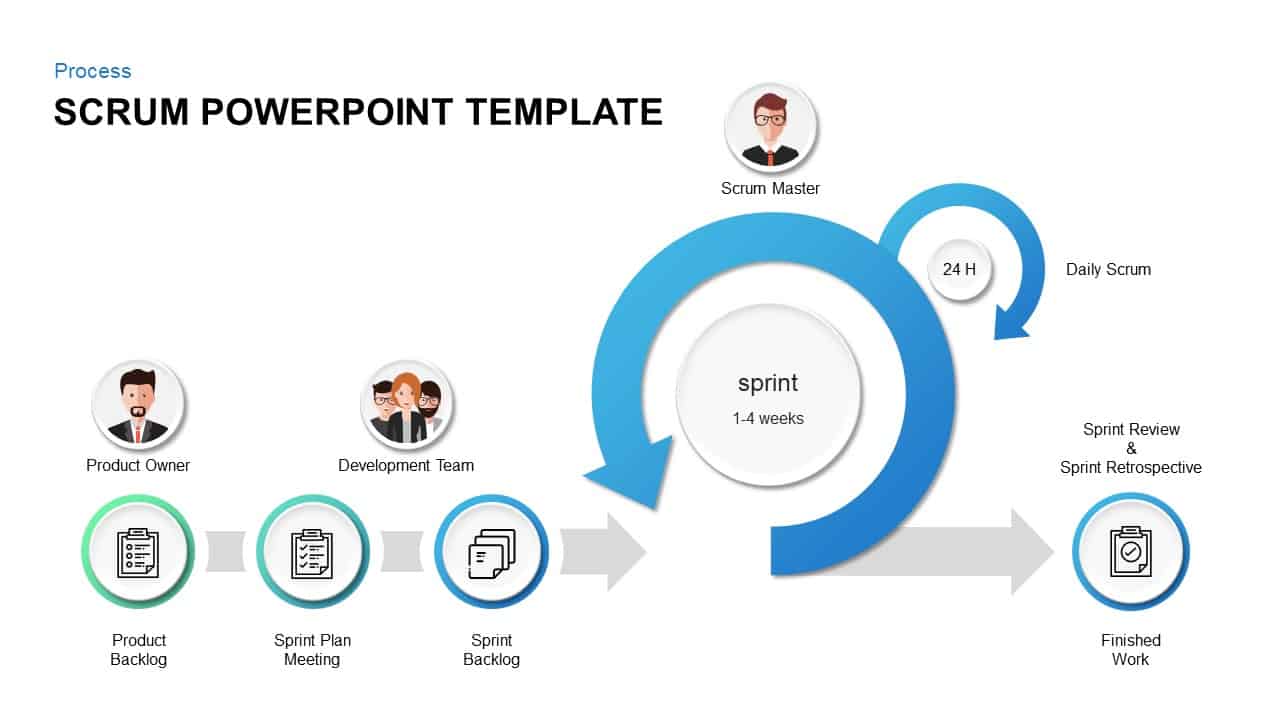
Comprehensive Scrum Infographics Pack Template for PowerPoint & Google Slides
Scrum
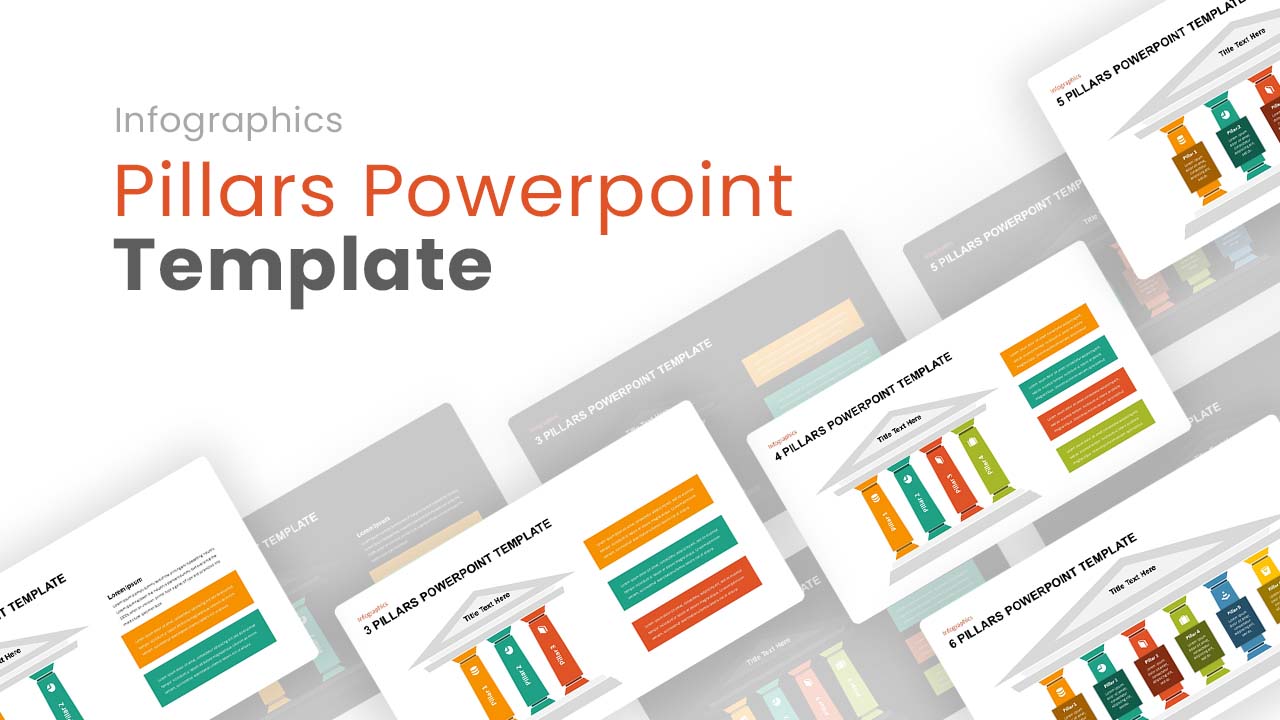
Editable Pillars Infographics Pack Template for PowerPoint & Google Slides
Infographics
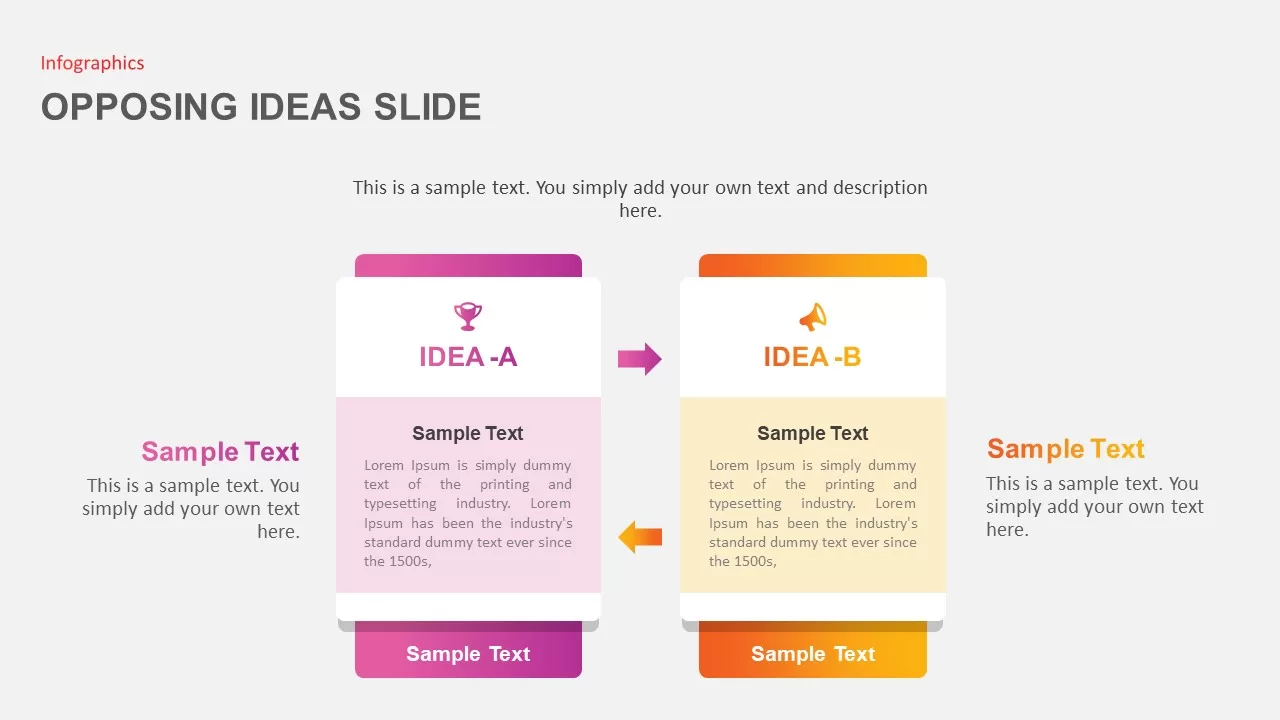
Opposing Ideas Infographics Pack Template for PowerPoint & Google Slides
Comparison

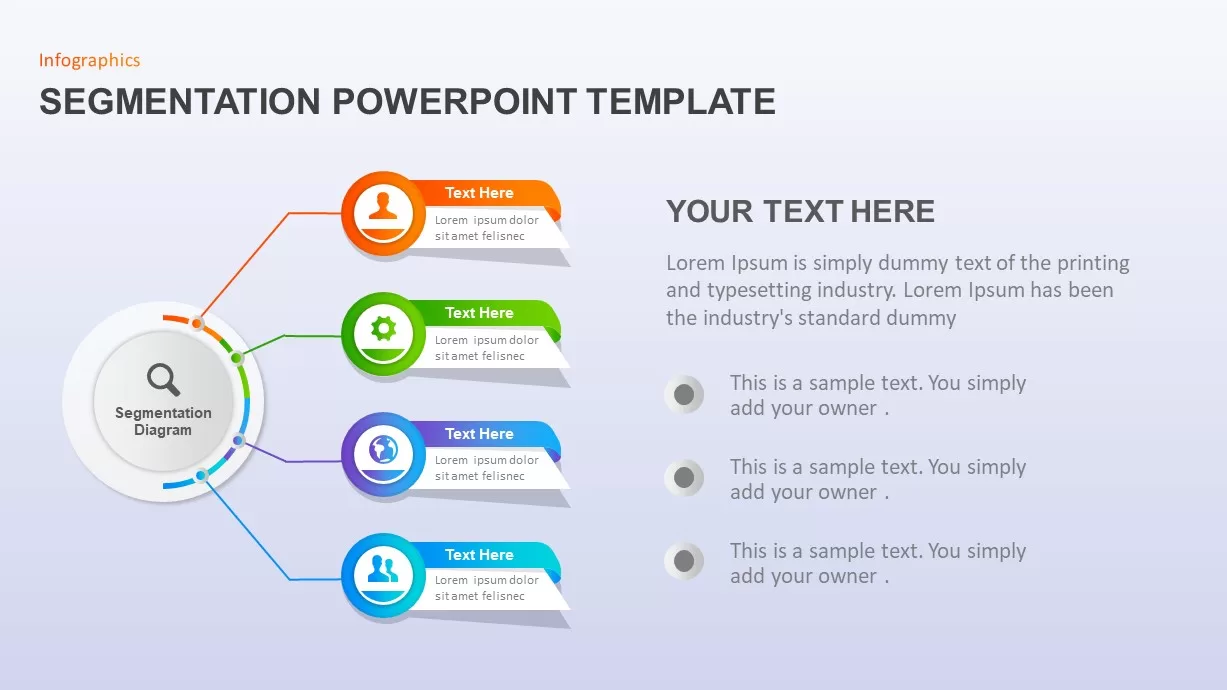
Market Segmentation & STP Infographics Pack Template for PowerPoint & Google Slides
Marketing
Business Growth Plant Infographics Pack Template for PowerPoint & Google Slides
Process

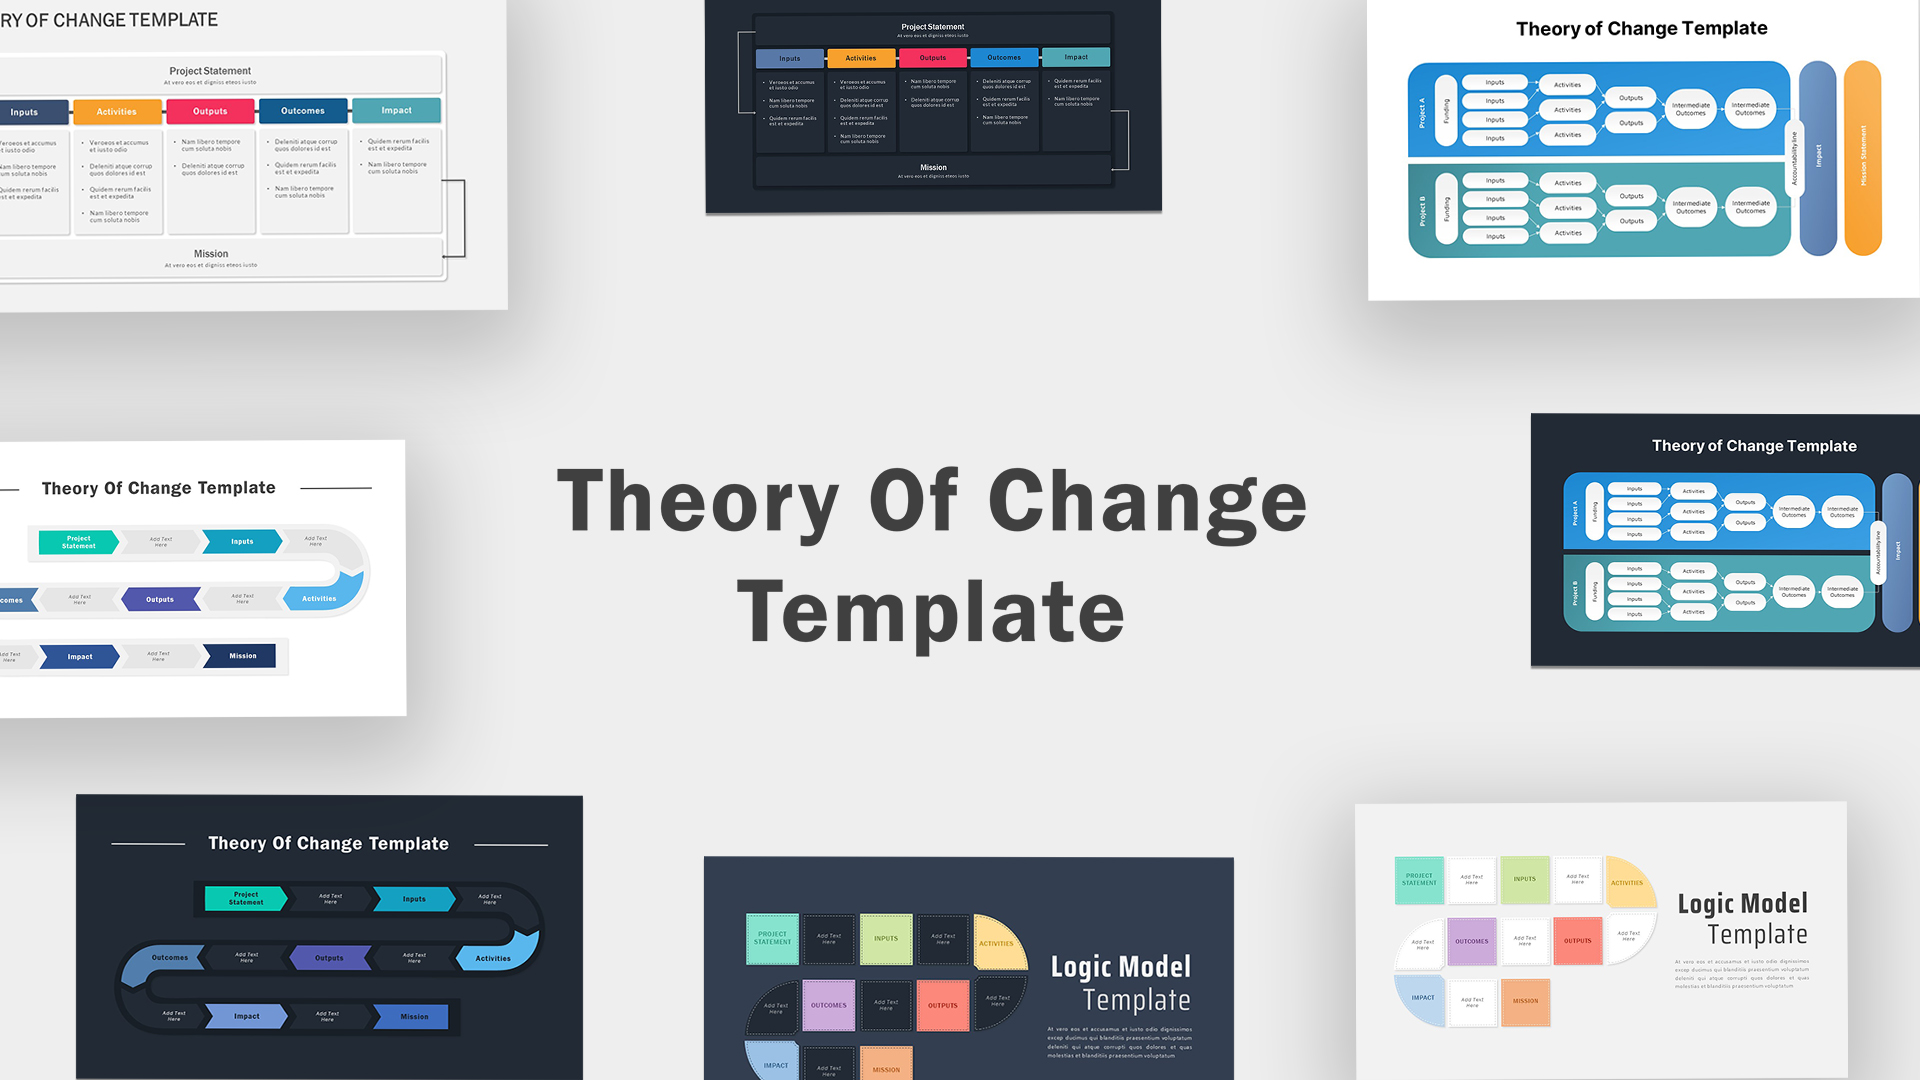
Theory of Change Infographics Pack Template for PowerPoint & Google Slides
Process
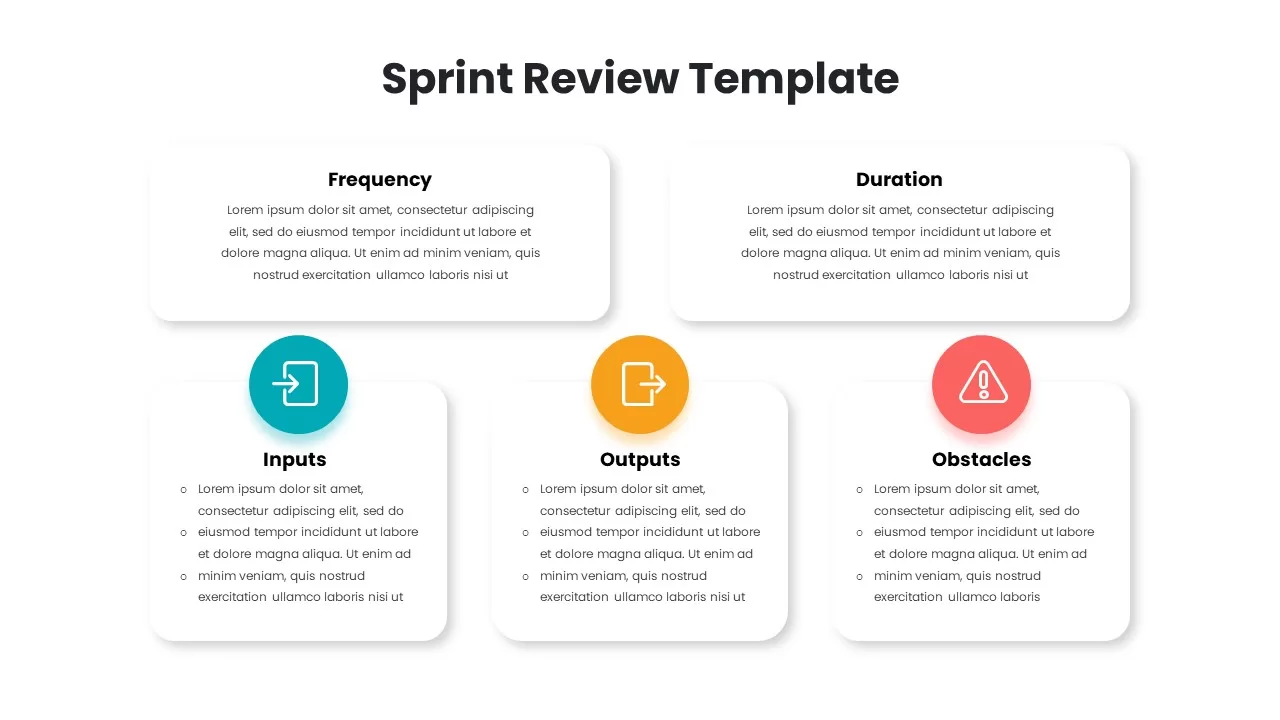
Sprint Review Process Infographics Pack Template for PowerPoint & Google Slides
Infographics
Free Roadmap Infographics Pack Template for PowerPoint & Google Slides
Pitch Deck
Free
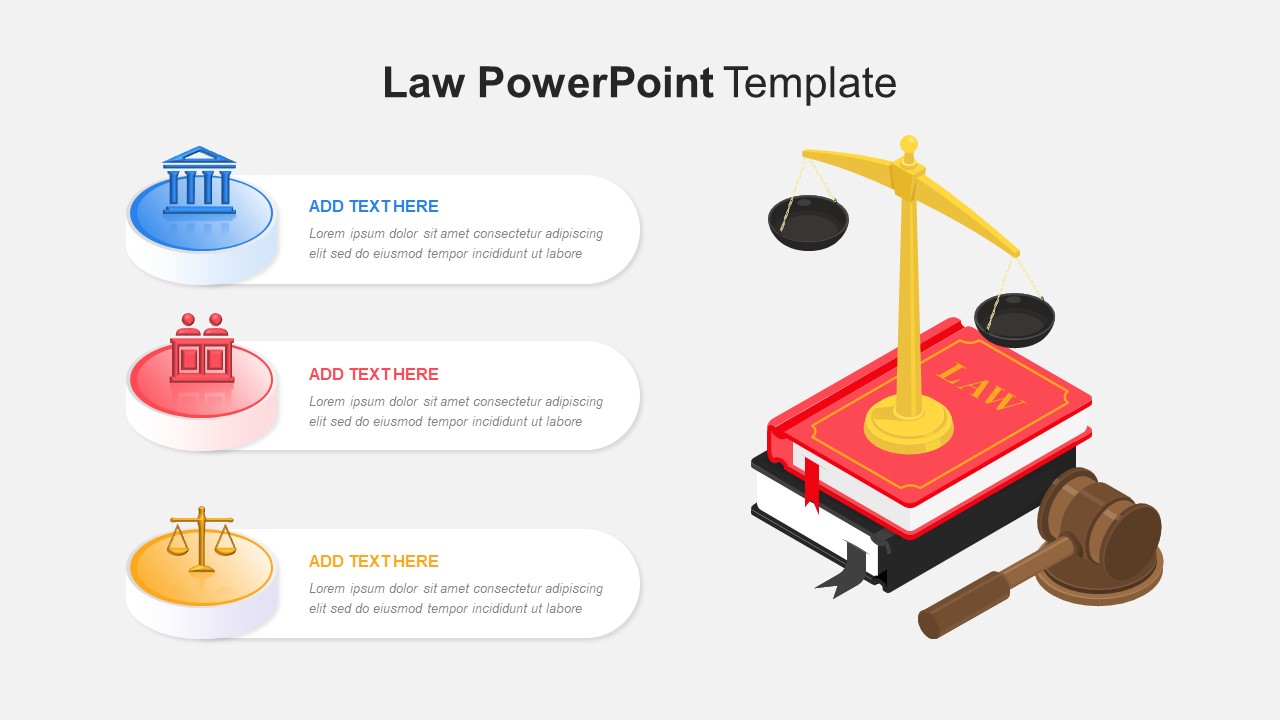
Free Law Infographics Slide Pack Collection Template for PowerPoint & Google Slides
Infographics
Free
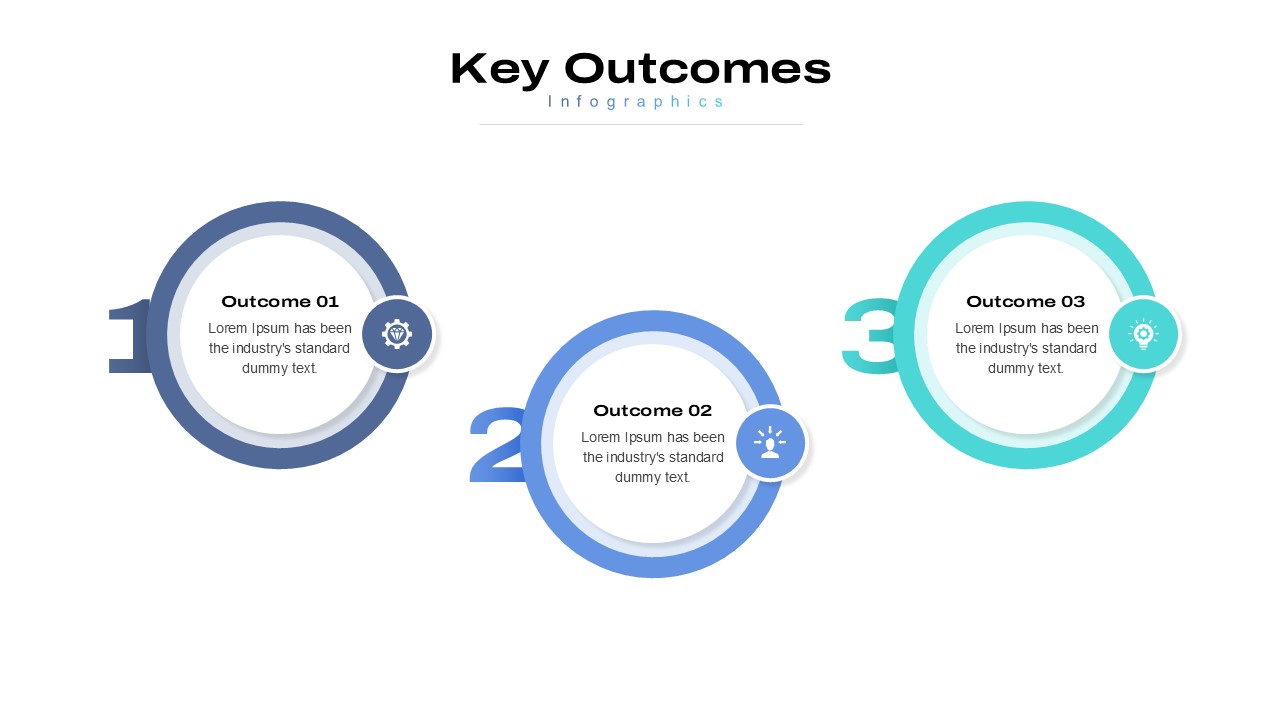
5 Styles Key Outcomes Infographics Pack Template for PowerPoint & Google Slides
Infographics
Looking Ahead 3-Slide Infographics Pack Template for PowerPoint & Google Slides
Business
Career Development Plan Infographics Pack for PowerPoint & Google Slides
Infographics
Quiet Quitting Infographics Pack for PowerPoint & Google Slides
Employee Performance
Free
Flywheel Model Infographic Template for PowerPoint & Google Slides
Process
Four-Segment Flywheel Infographic Model Template for PowerPoint & Google Slides
Process
Five-Step Flywheel Infographic Diagram Template for PowerPoint & Google Slides
Process
Six-Step Colorful Flywheel Diagram Template for PowerPoint & Google Slides
Circular
Business Flywheel Lifecycle Model Template for PowerPoint & Google Slides
Circular
Data Flywheel Strategy template for PowerPoint & Google Slides
Business
Funnel and Flywheel Thinking Comparison template for PowerPoint & Google Slides
Infographics
Flywheel Growth Cycle Diagram Template for PowerPoint & Google Slides
Circular
Snake Diagram Pack of 8 Slides template for PowerPoint & Google Slides
Process
Sales Process Infographic Slides Pack Template for PowerPoint & Google Slides
Process
Acknowledgement Slides Pack Template for PowerPoint & Google Slides
Our Team
Agenda Infographic Pack of 2 Slides Template for PowerPoint & Google Slides
Agenda
Quad Chart Infographic Pack of 8 Slides Template for PowerPoint & Google Slides
Comparison Chart
Free Professional Gantt Chart Pack – 4 Slides Template for PowerPoint & Google Slides
Gantt Chart
Free
Game Plan Infographic Slides Pack Template for PowerPoint & Google Slides
Infographics
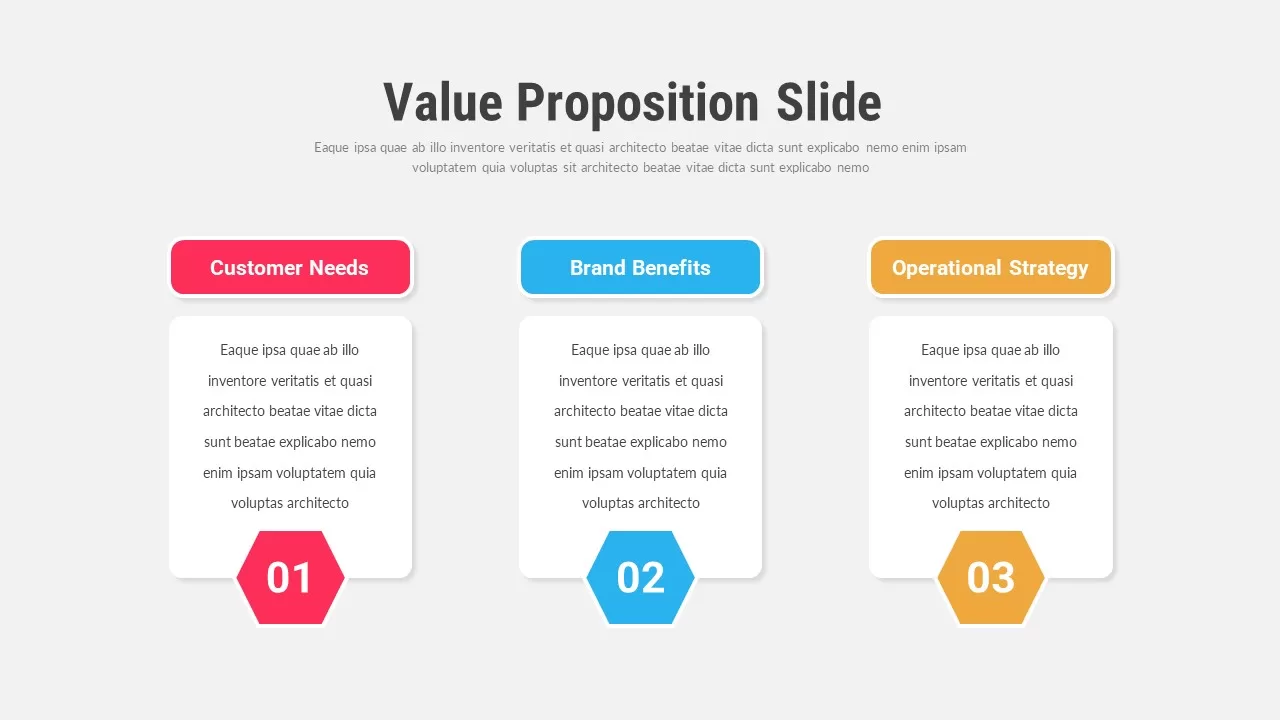
Value Proposition Slides Pack for PowerPoint & Google Slides
Infographics
Free New Year’s Resolution Slides Pack for PowerPoint & Google Slides 2023
Graphics
Free
Free Infographic Deck PowerPoint Pack for PowerPoint & Google Slides
Infographics
Free

North Korea Map with Provinces Infographic Pack Template for PowerPoint & Google Slides
Maps
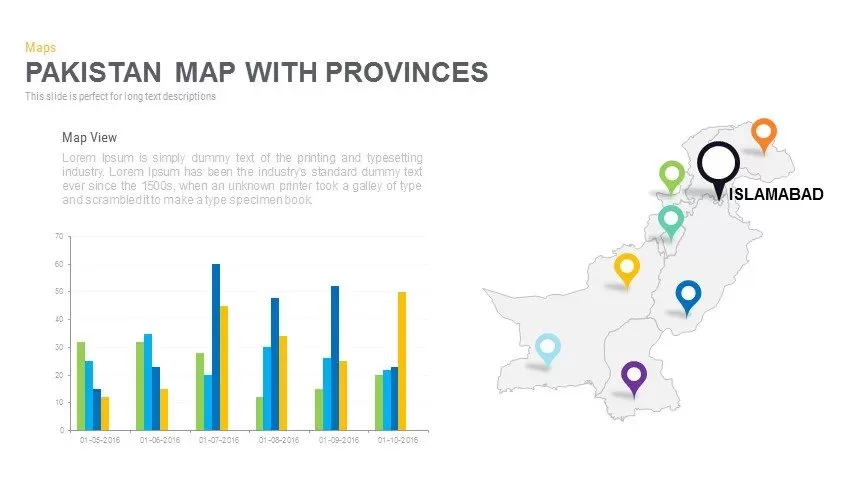
Pakistan Provinces Map Infographic Pack Template for PowerPoint & Google Slides
Maps
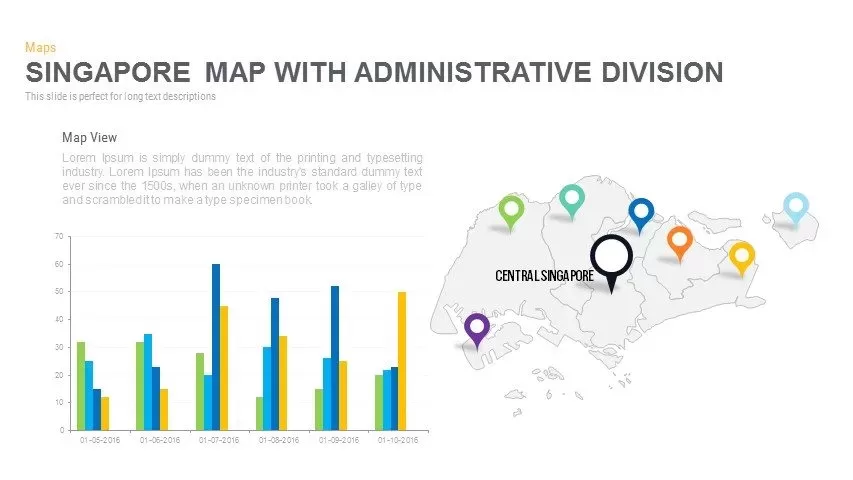
Singapore Map Pack Template for PowerPoint & Google Slides
Maps
Sri Lanka Map Infographic Pack Template for PowerPoint & Google Slides
Maps
Editable Tajikistan Provinces Map Pack Template for PowerPoint & Google Slides
Maps
Thailand Provinces Map Infographic Pack Template for PowerPoint & Google Slides
Maps
Uzbekistan Map with Regions Pack Template for PowerPoint & Google Slides
Maps
Vietnam Provinces Map Infographic Pack Template for PowerPoint & Google Slides
Maps
Algeria Map with Provinces Pack Template for PowerPoint & Google Slides
Maps
Angola Provinces Map Slide Pack Template for PowerPoint & Google Slides
World Maps
Angola Map with Provinces Slide Pack Template for PowerPoint & Google Slides
World Maps
Burkina Faso Map with Regions Slide Pack Template for PowerPoint & Google Slides
World Maps
Cameroon Map with Regions Slide Pack Template for PowerPoint & Google Slides
World Maps
Chad Map with Regions Slide Pack Template for PowerPoint & Google Slides
World Maps
DR Congo Prefecture Map Slide Pack Template for PowerPoint & Google Slides
World Maps
Egypt Regional Map Slide Pack Template for PowerPoint & Google Slides
World Maps
Ethiopia Map with Regions Slide Pack Template for PowerPoint & Google Slides
World Maps
Iran Map with Provinces Slide Pack Template for PowerPoint & Google Slides
World Maps
Zimbabwe Map with Provinces Slide Pack Template for PowerPoint & Google Slides
World Maps
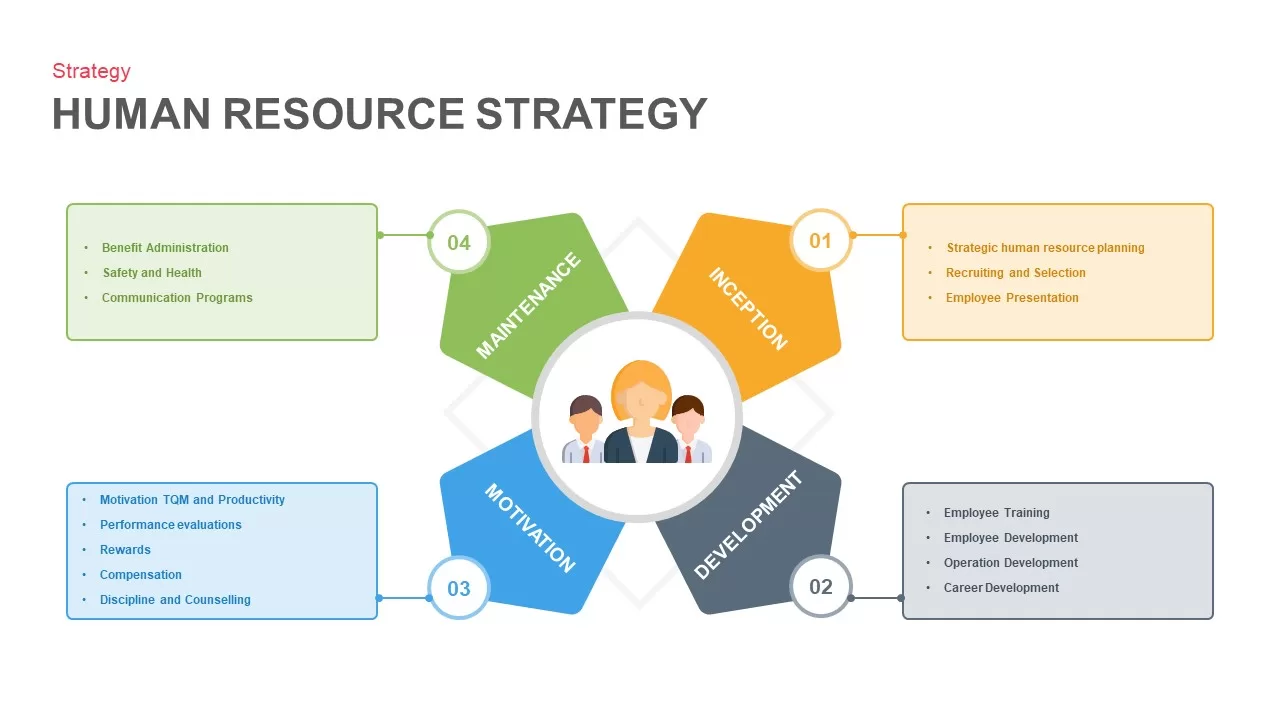
Human Resource Strategy Model Pack Template for PowerPoint & Google Slides
HR
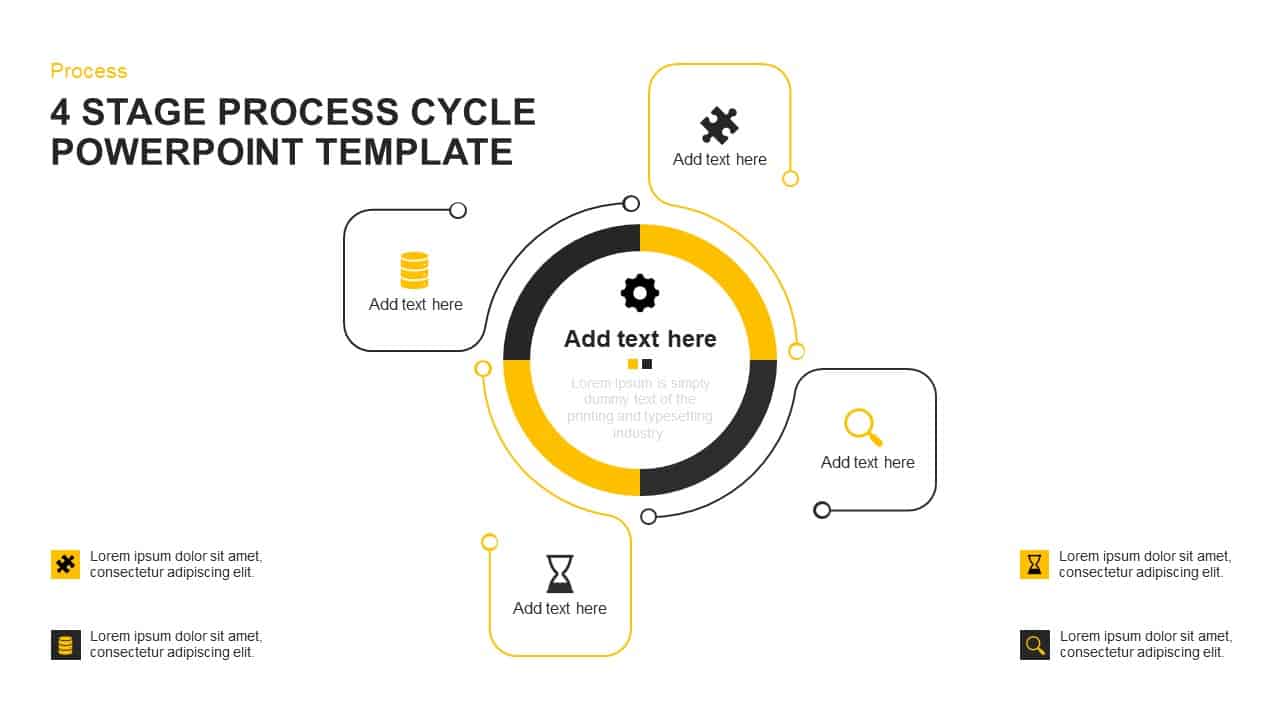
Four-Stage Process Cycle Variations Pack Template for PowerPoint & Google Slides
Process
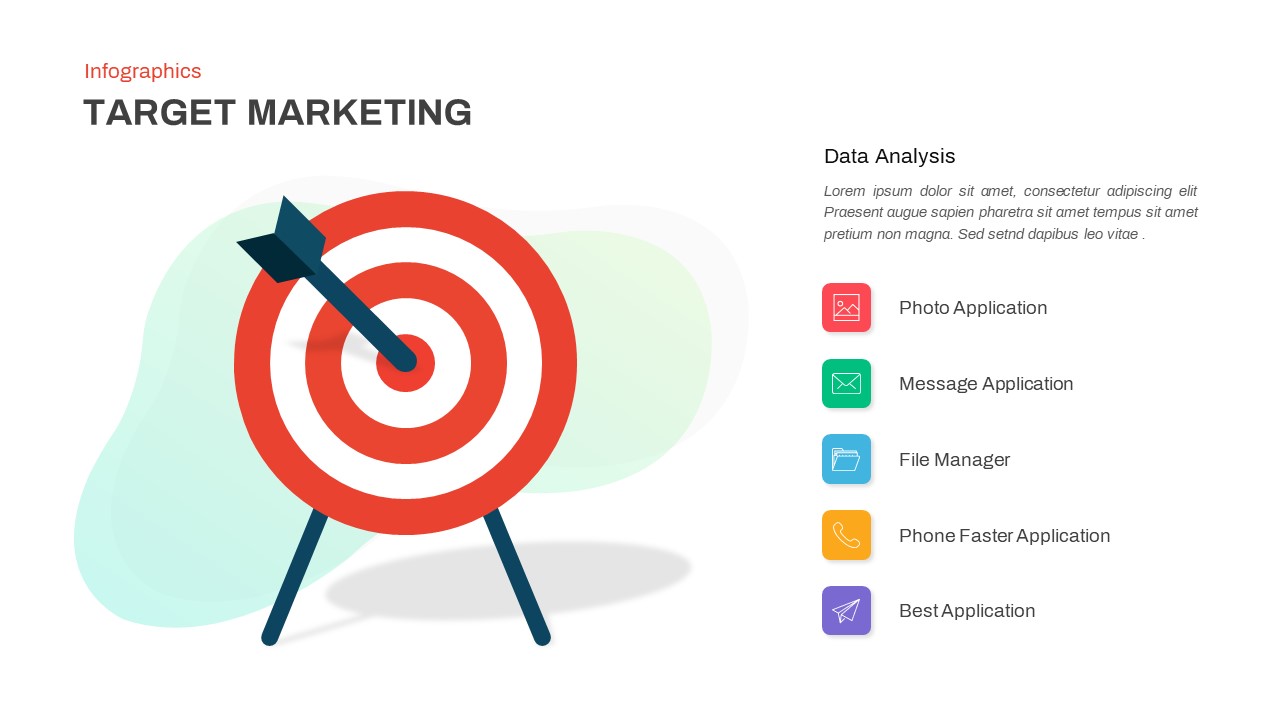
Target Marketing Infographic Slide Pack Template for PowerPoint & Google Slides
Infographics
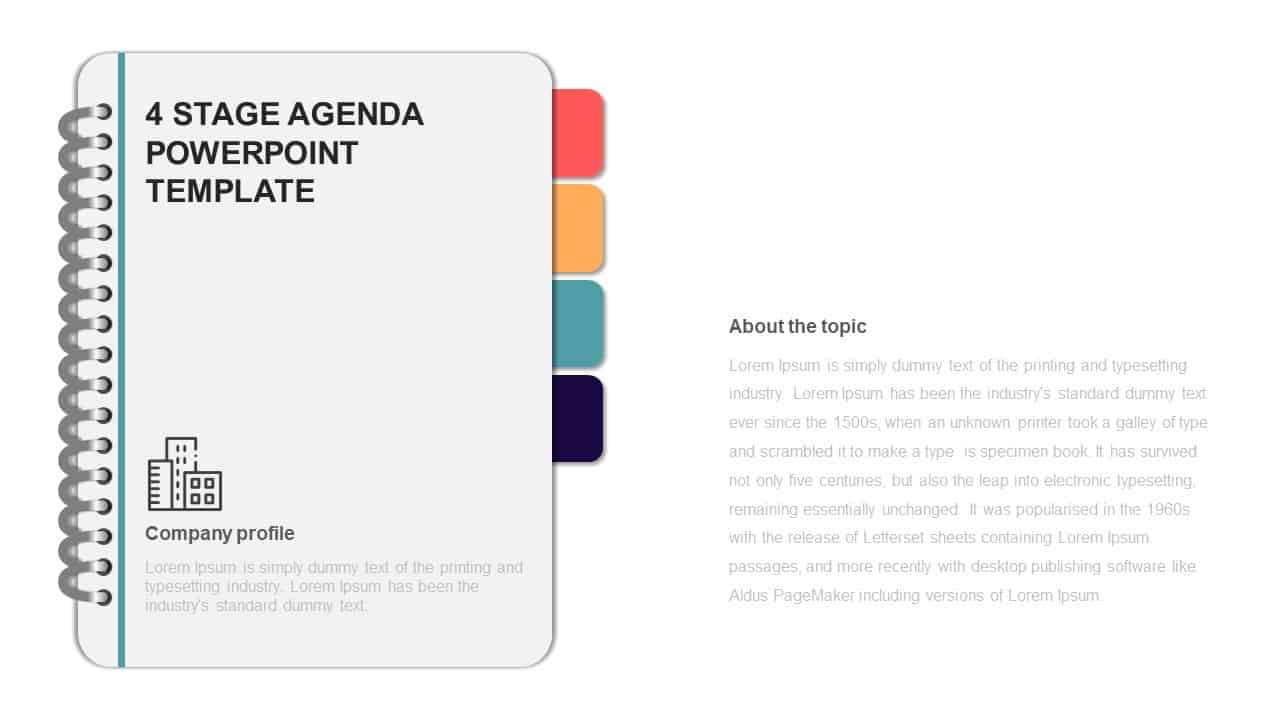
4-Stage Agenda Slide Pack Template for PowerPoint & Google Slides
Agenda
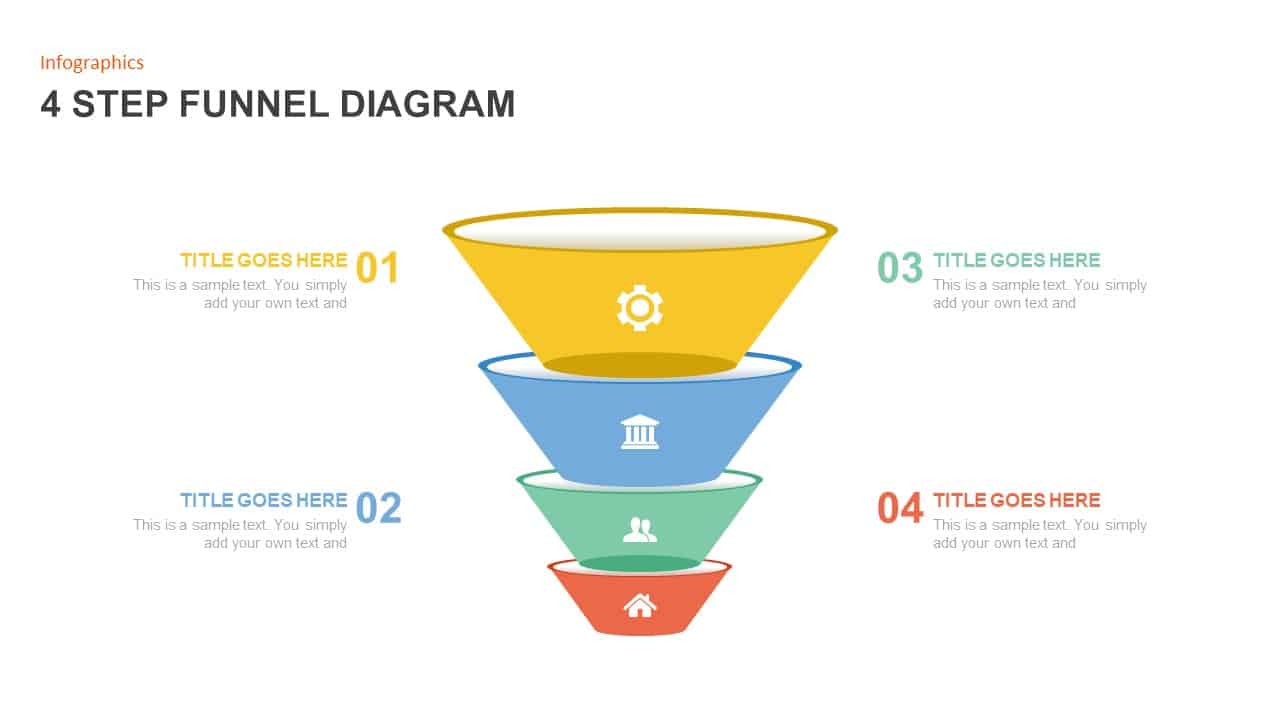
Four-Step Funnel Infographic Pack Template for PowerPoint & Google Slides
Funnel
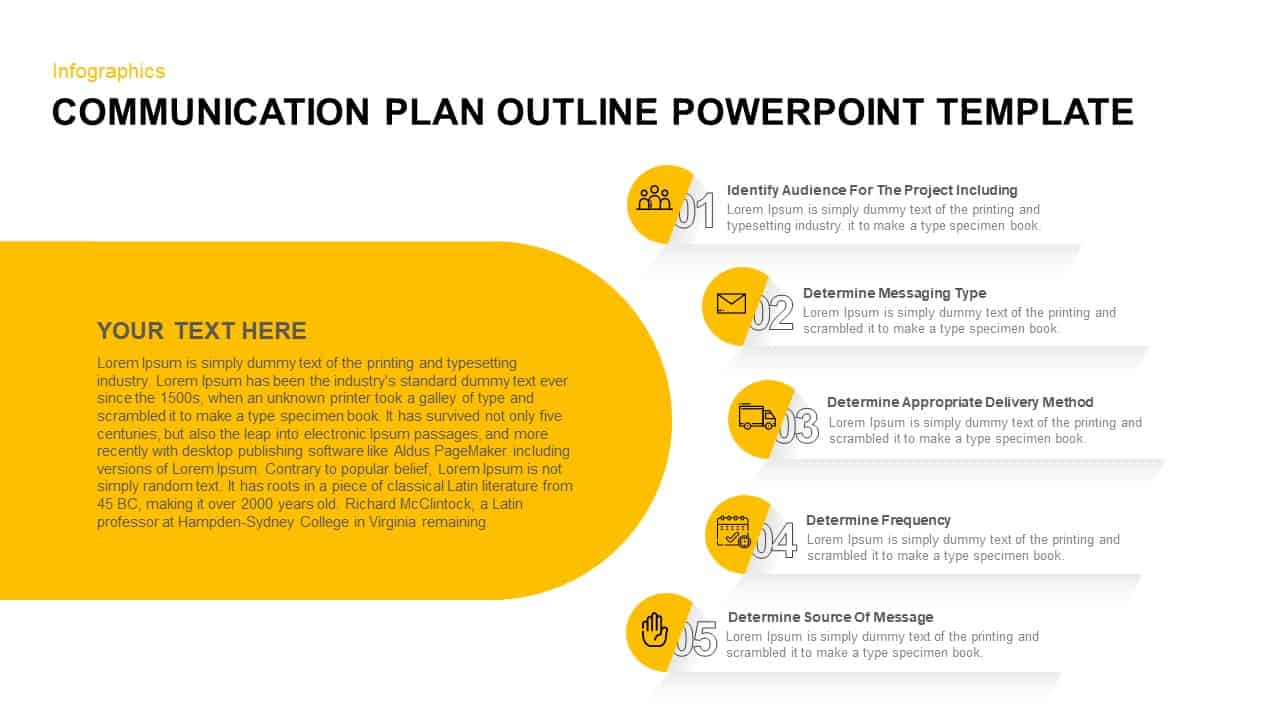
Communication Plan Outline Template Pack for PowerPoint & Google Slides
Infographics
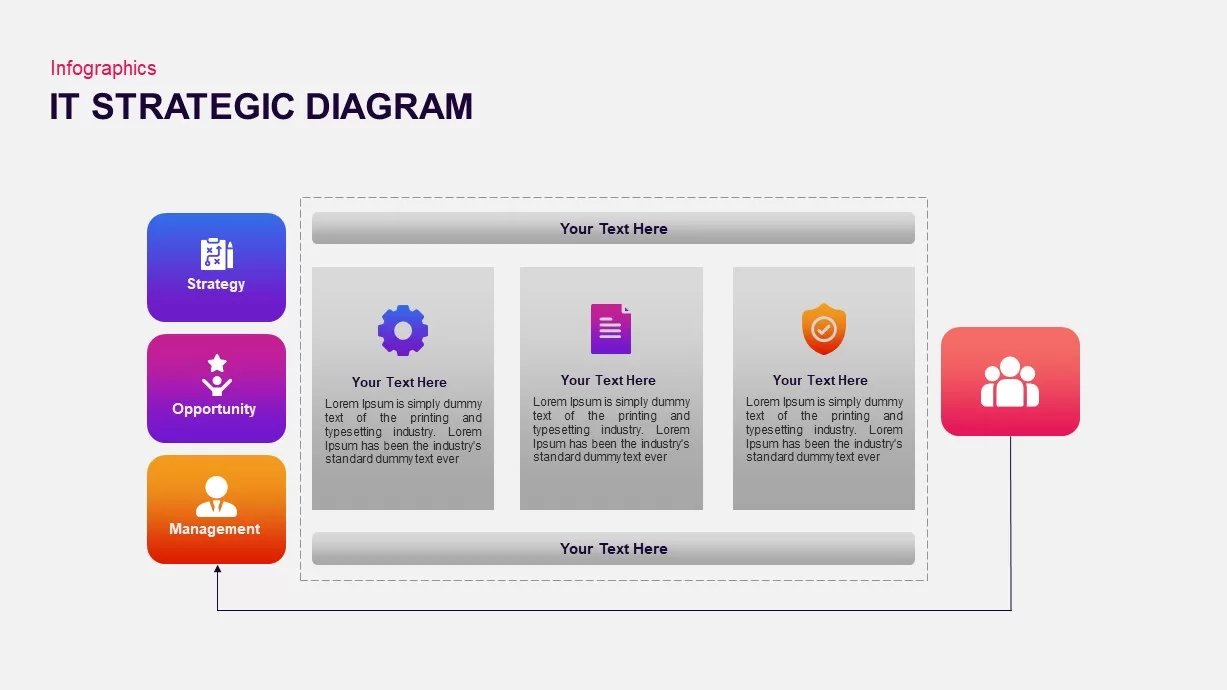
IT Strategic Diagram Infographic Pack Template for PowerPoint & Google Slides
Business Strategy
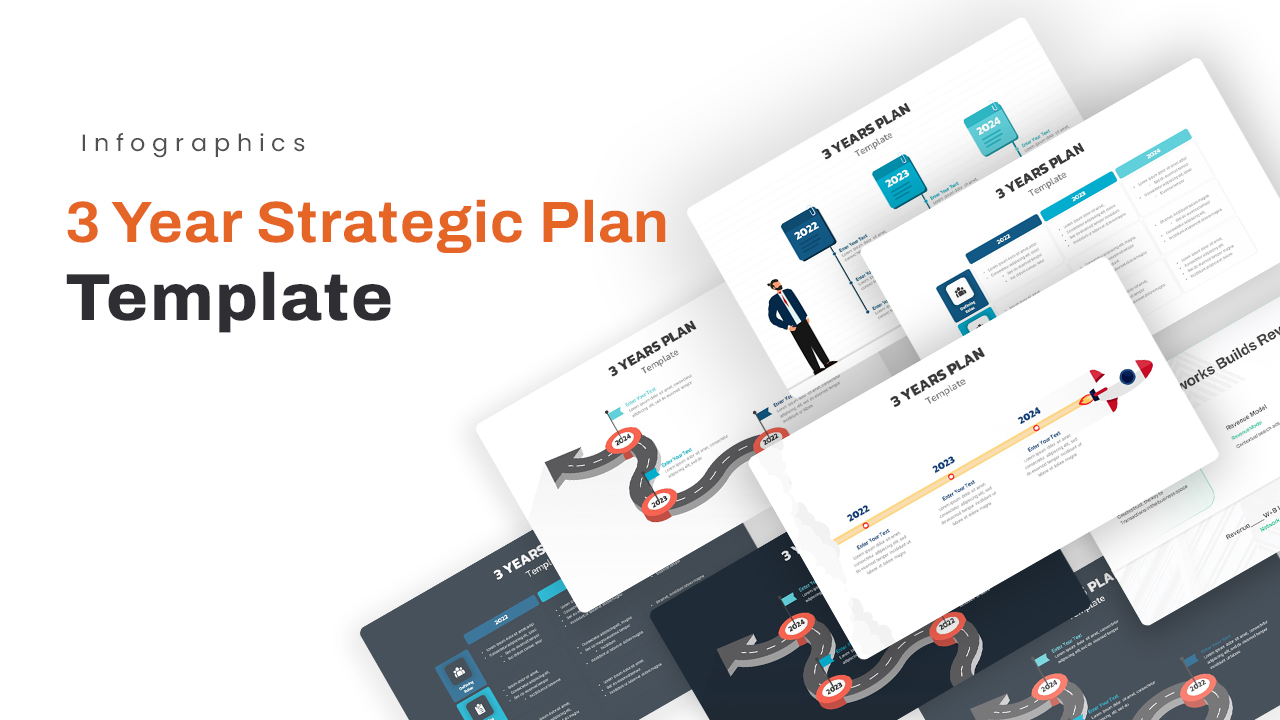
Three-Year Plan Infographic Pack Template for PowerPoint & Google Slides
Timeline
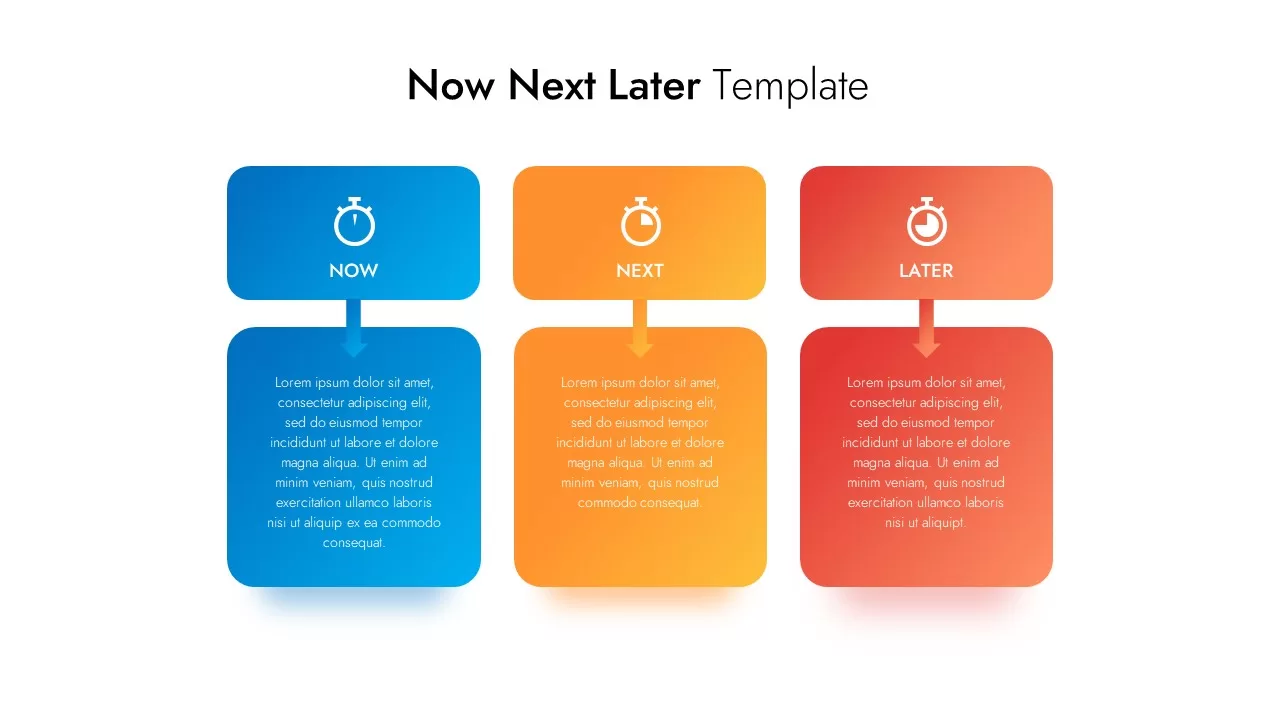
Now Next Later Infographic Pack Template for PowerPoint & Google Slides
Process
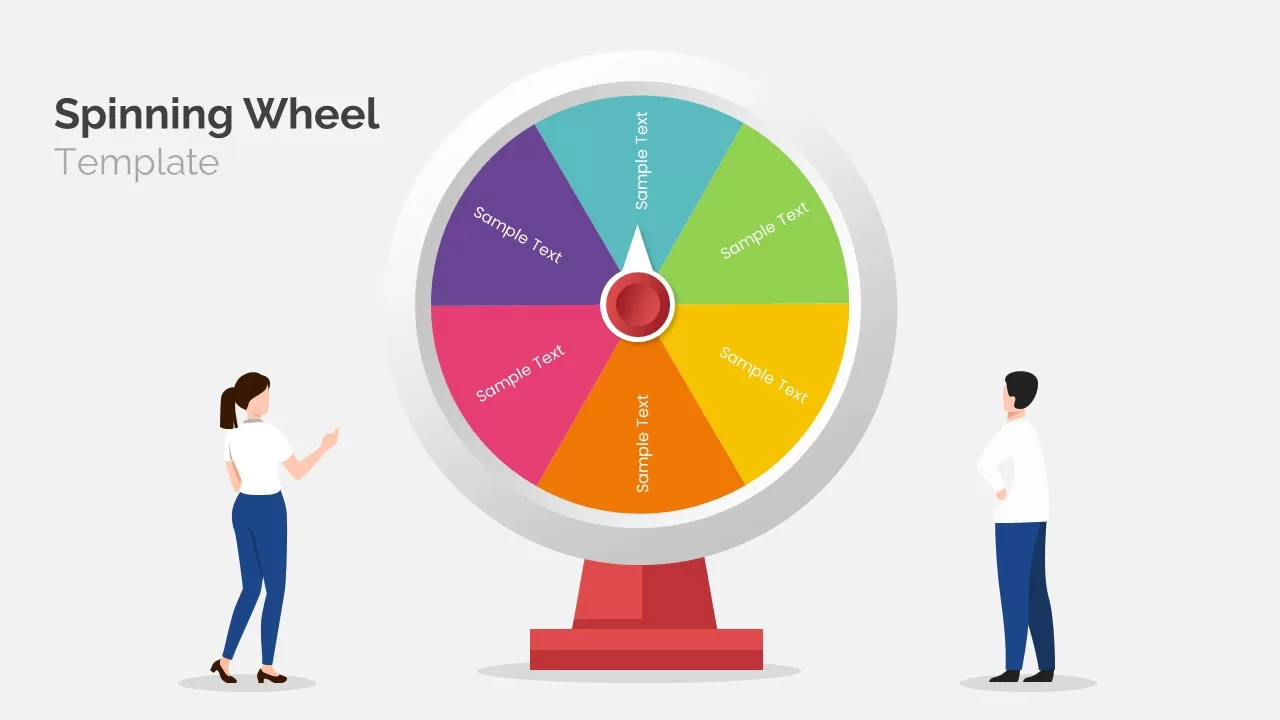
Animated Spinning Wheel Infographic Pack Template for PowerPoint & Google Slides
Circular
Competitive Landscape Comparison Template Pack for PowerPoint & Google Slides
Comparison
Root Cause Analysis Infographic Pack Template for PowerPoint & Google Slides
Process
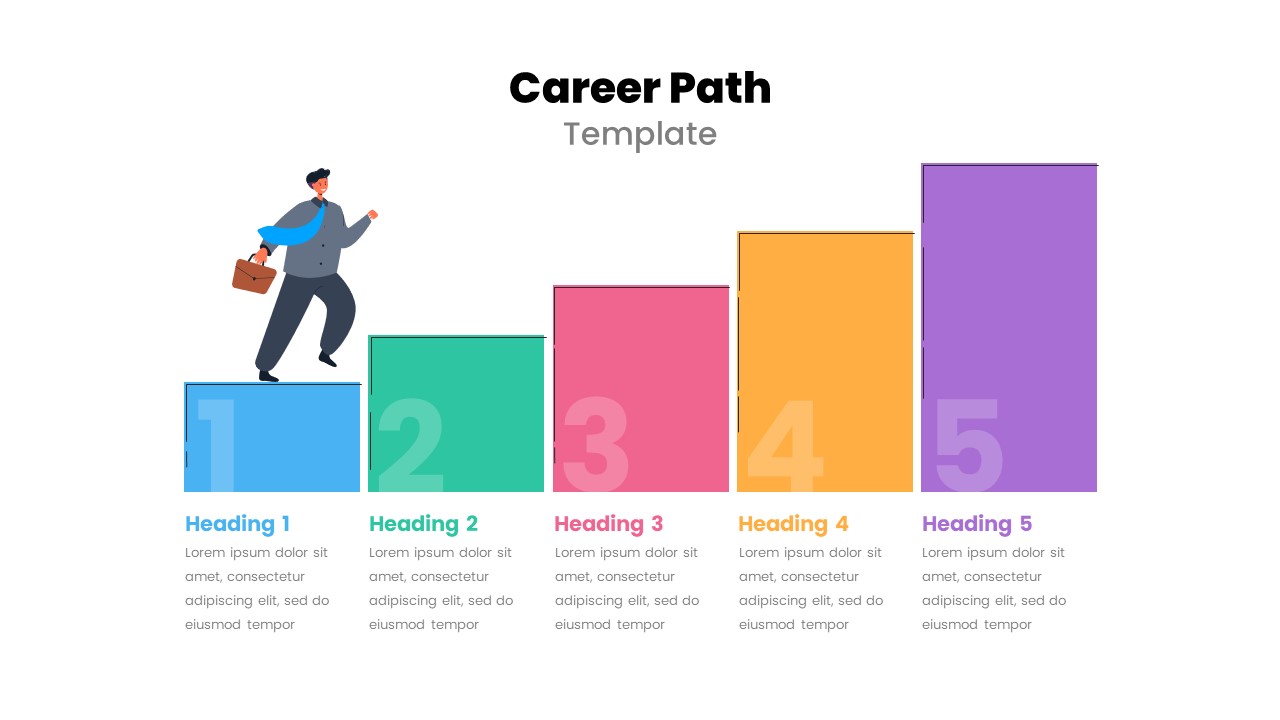
Free Career Path Multipurpose Slide Pack Template for PowerPoint & Google Slides
Roadmap
Free
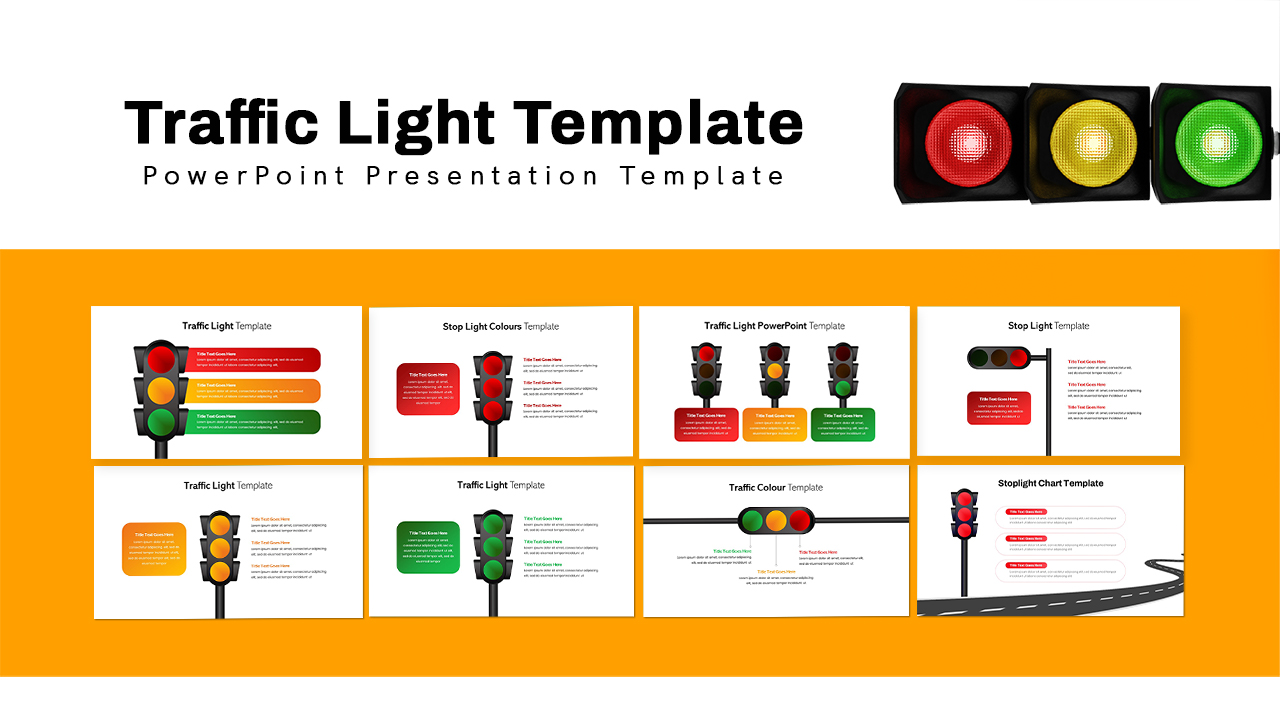
Traffic Light Infographic Pack Template for PowerPoint & Google Slides
Pitch Deck
Newspaper Template Pack for PowerPoint & Google Slides
Business Proposal
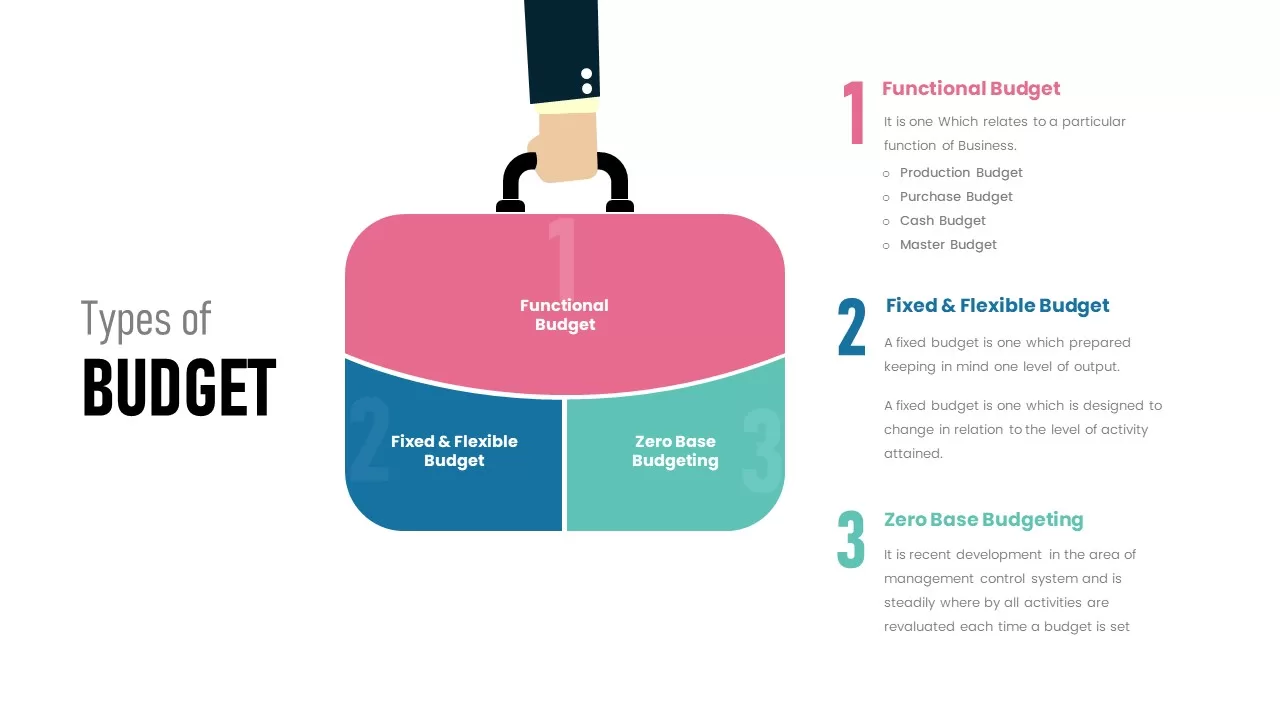
Types of Budget Infographic Pack Template for PowerPoint & Google Slides
Comparison
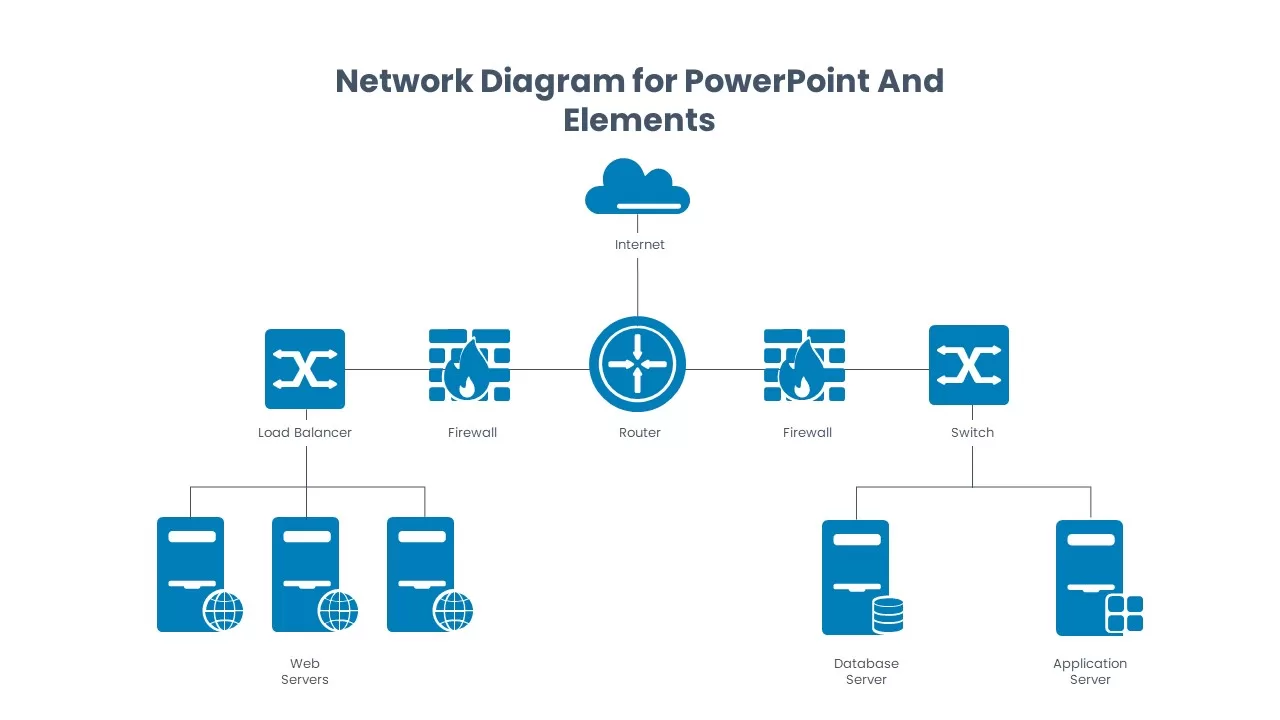
Network Diagram Elements and Icons Pack Template for PowerPoint & Google Slides
Information Technology
Data-driven GDP Growth Infographic Pack Template for PowerPoint & Google Slides
Infographics

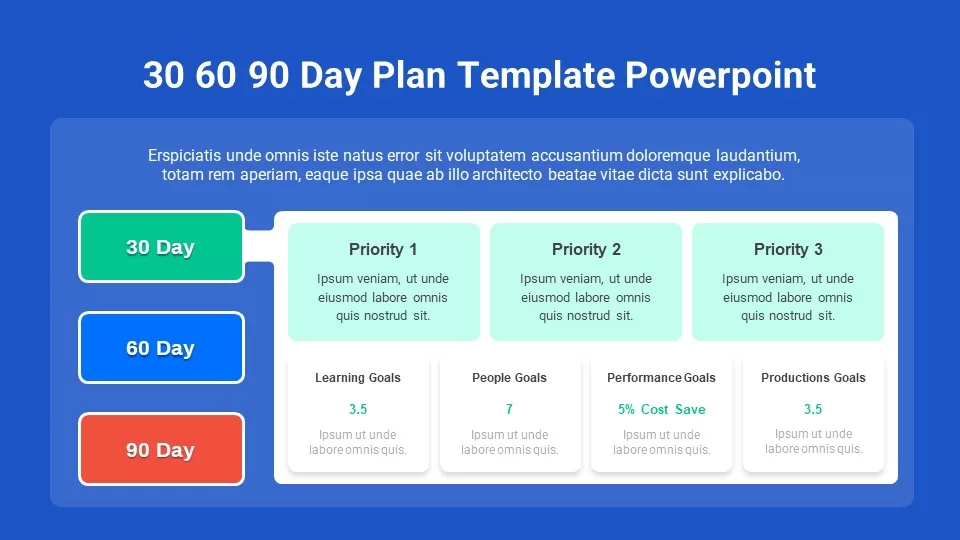
Free 30-60-90 Day Plan Slide Pack Template for PowerPoint & Google Slides
Project Status
Free
Free Veterans Day Patriotic Slide Pack Template for PowerPoint & Google Slides
Graphics
Free
Transformation Roadmap Infographic Pack Template for PowerPoint & Google Slides
Timeline
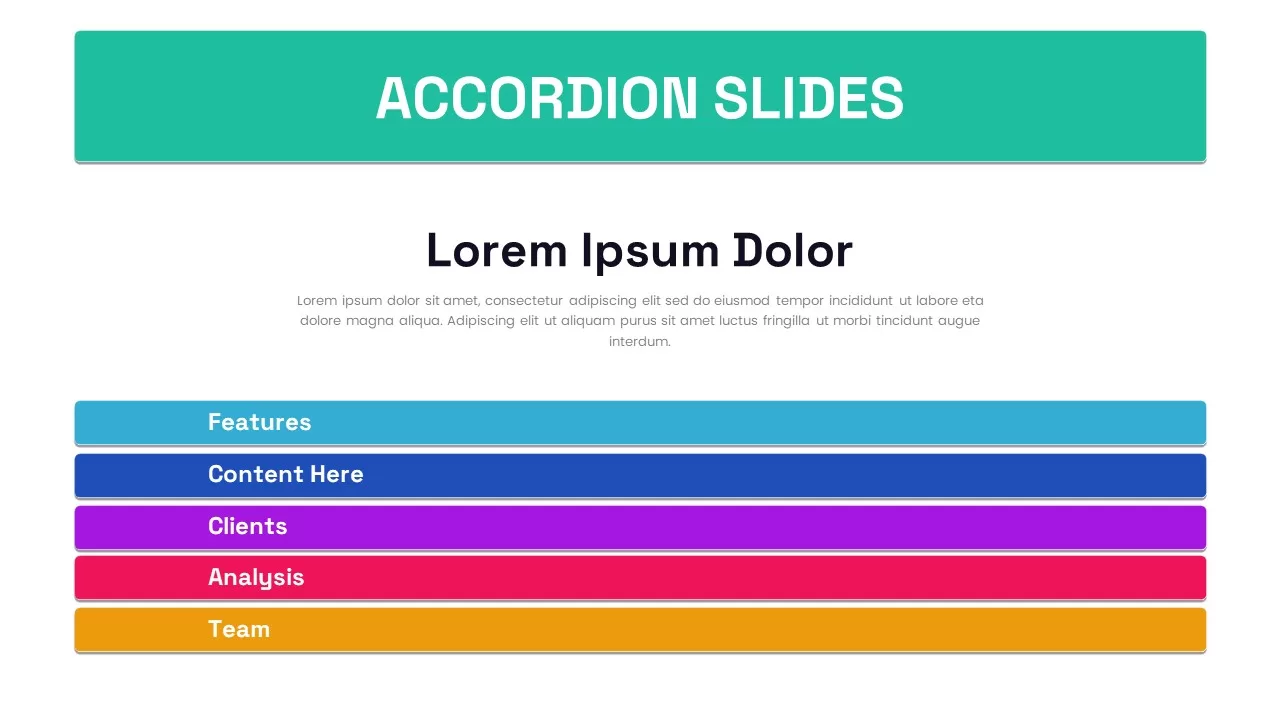
Six-Slide Animated Accordion Pack Template for PowerPoint & Google Slides
Business
Business Icon Pack Template for PowerPoint & Google Slides
Graphics
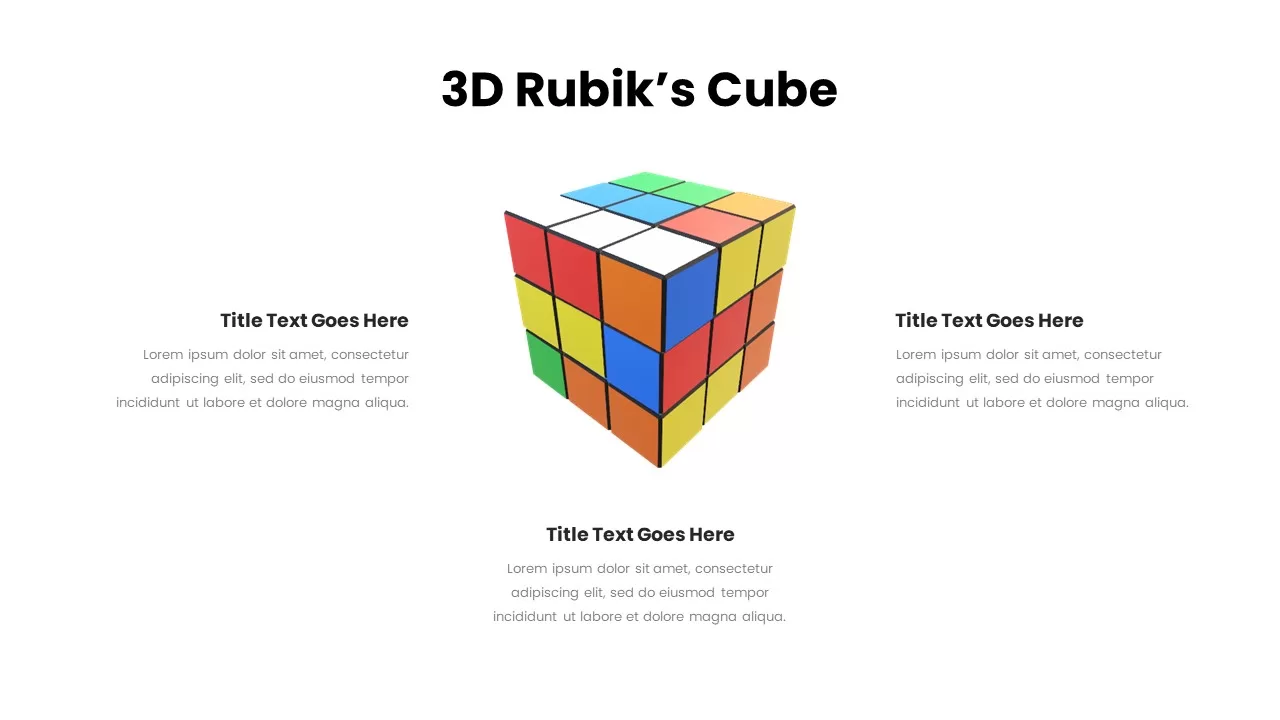
Dynamic 3D Rubik’s Cube Diagram Pack Template for PowerPoint & Google Slides
Infographics
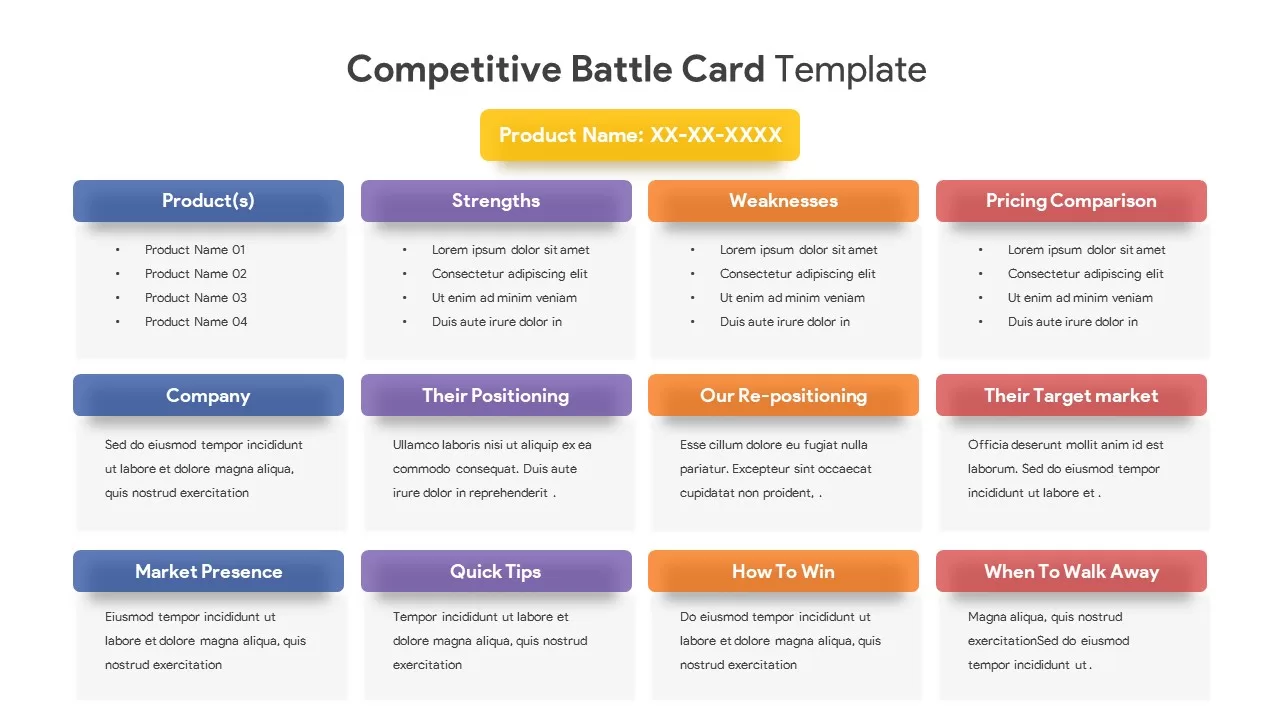
Competitive Battle Card Infographic Pack Template for PowerPoint & Google Slides
Competitor Analysis
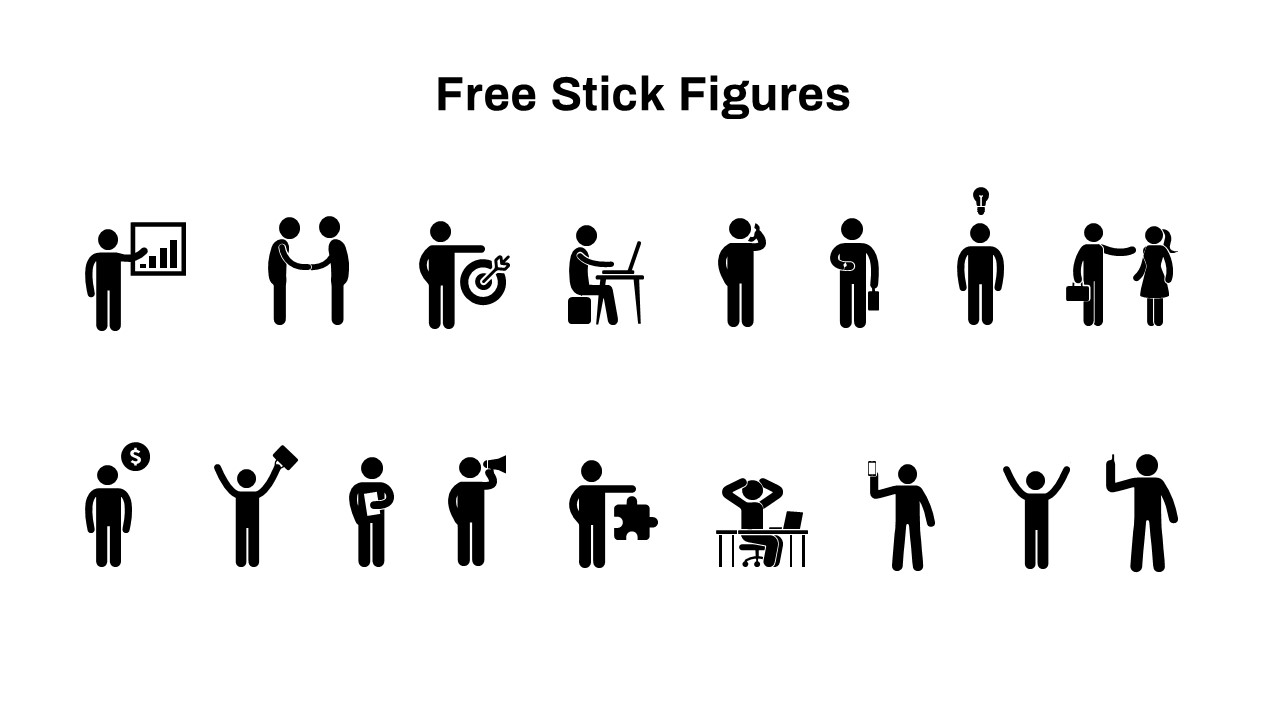
Free Stick Figure Icon Pack Slide Template for PowerPoint & Google Slides
Graphics
Free
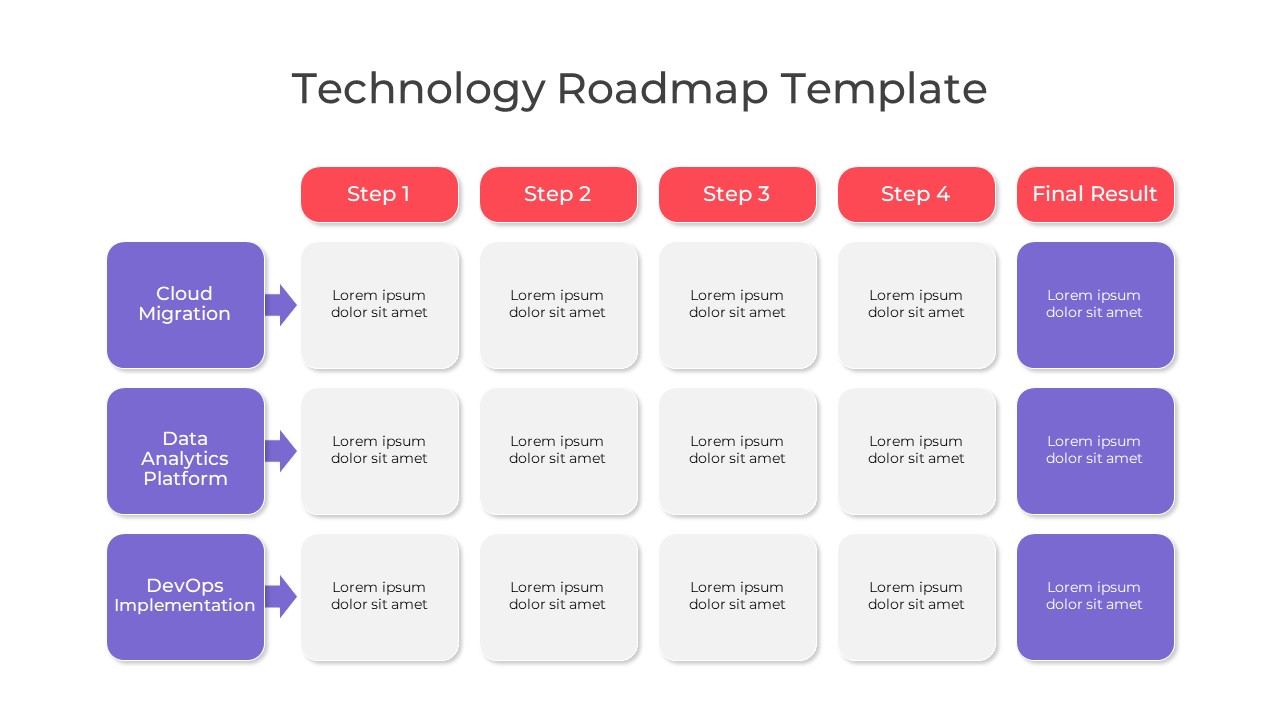
Multi-Color Technology Roadmap Template Pack for PowerPoint & Google Slides
Roadmap
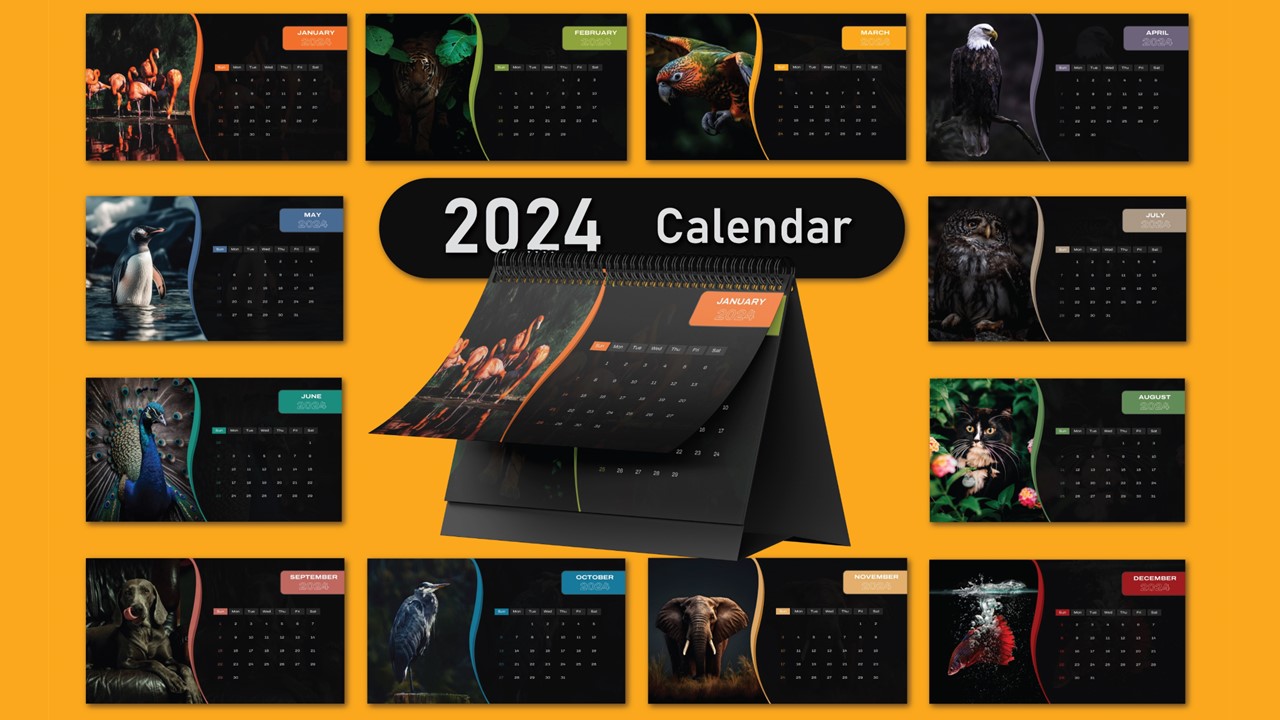
Free Colorful Animal 2024 Calendar Slide Pack Template for PowerPoint & Google Slides
Infographics
Free
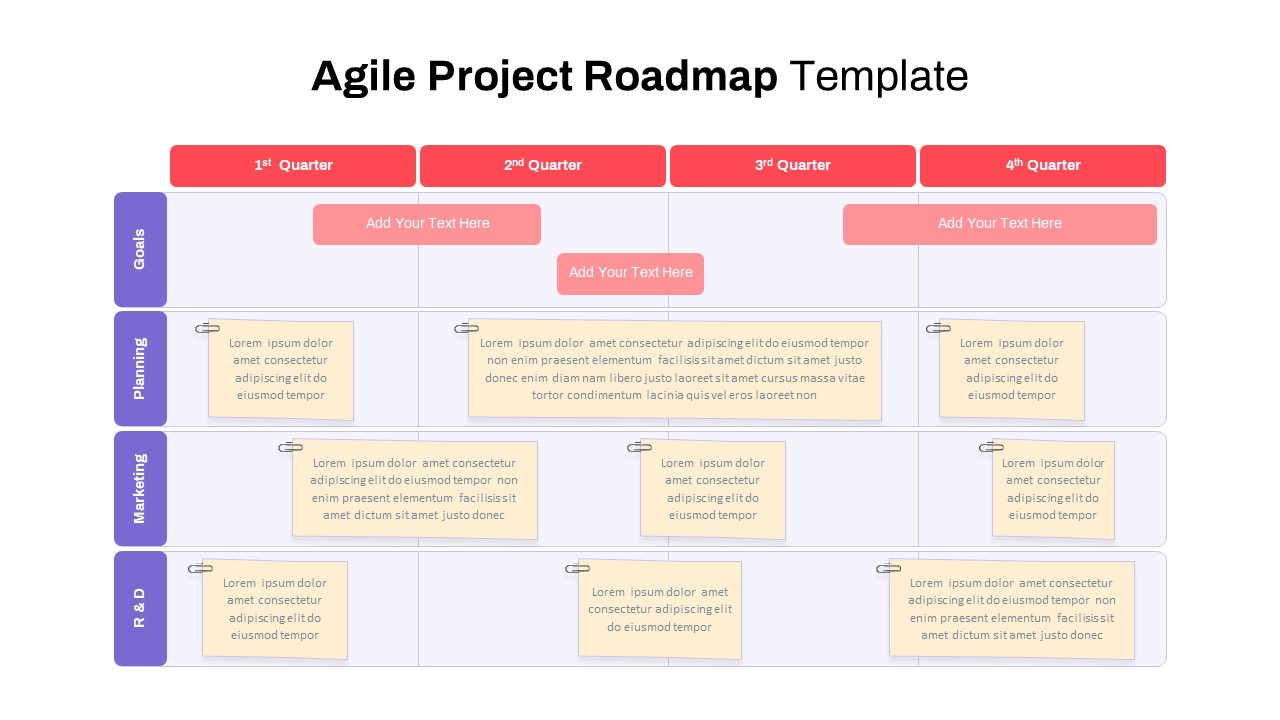
Agile Project Roadmap Timeline Template Pack for PowerPoint & Google Slides
Scrum
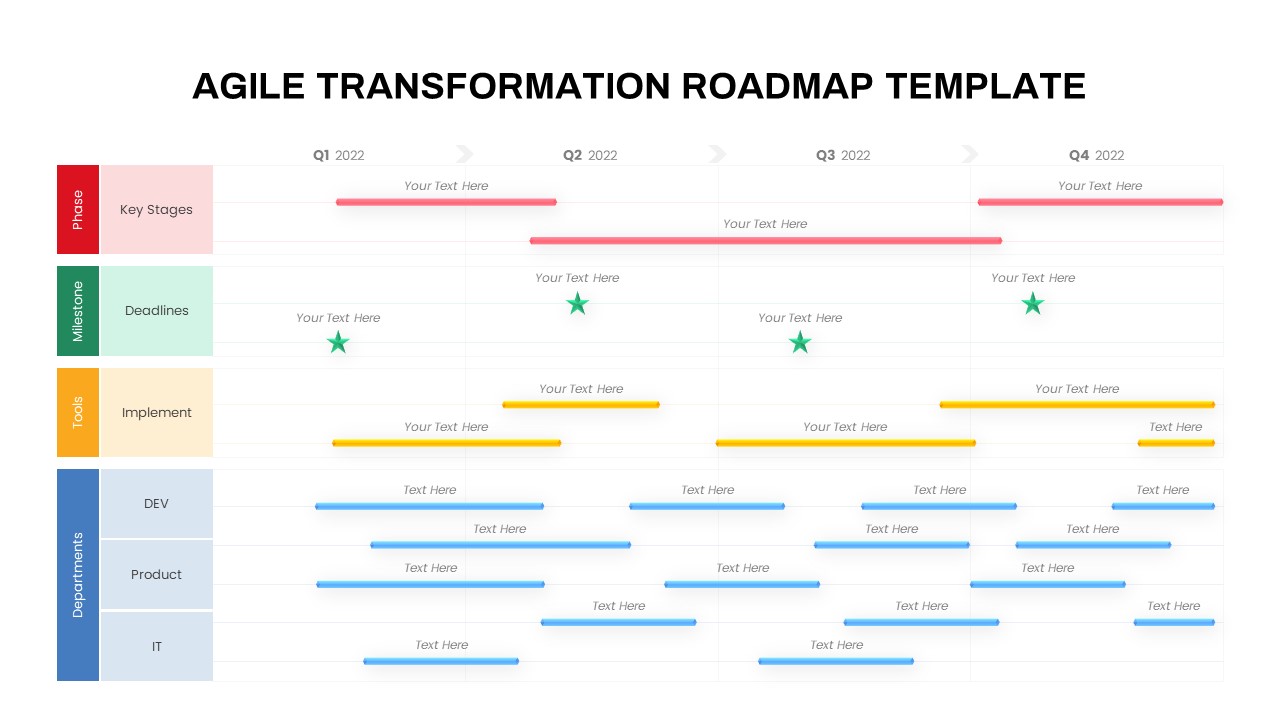
Agile Transformation Roadmap Slide Pack Template for PowerPoint & Google Slides
Roadmap

Free Colorful Infographic Slide Pack Template for PowerPoint & Google Slides
Roadmap
Free
Advanced Data Flow Diagram Pack Template for PowerPoint & Google Slides
Flow Charts
Free Multi-Step Funnel Infographic Slide Pack Template for PowerPoint & Google Slides
Funnel
Free
Free 4 Safety Equipment Infographic Pack Template for PowerPoint & Google Slides
Pitch Deck
Free
Free Three and Four Pillar Infographic Pack Template for PowerPoint & Google Slides
Process
Free
Versatile Startup Roadmap Slide Pack Template for PowerPoint & Google Slides
Timeline
3D Building Blocks Infographic Pack Template for PowerPoint & Google Slides
Infographics
Comprehensive RAID Log Slide Pack Template for PowerPoint & Google Slides
Project
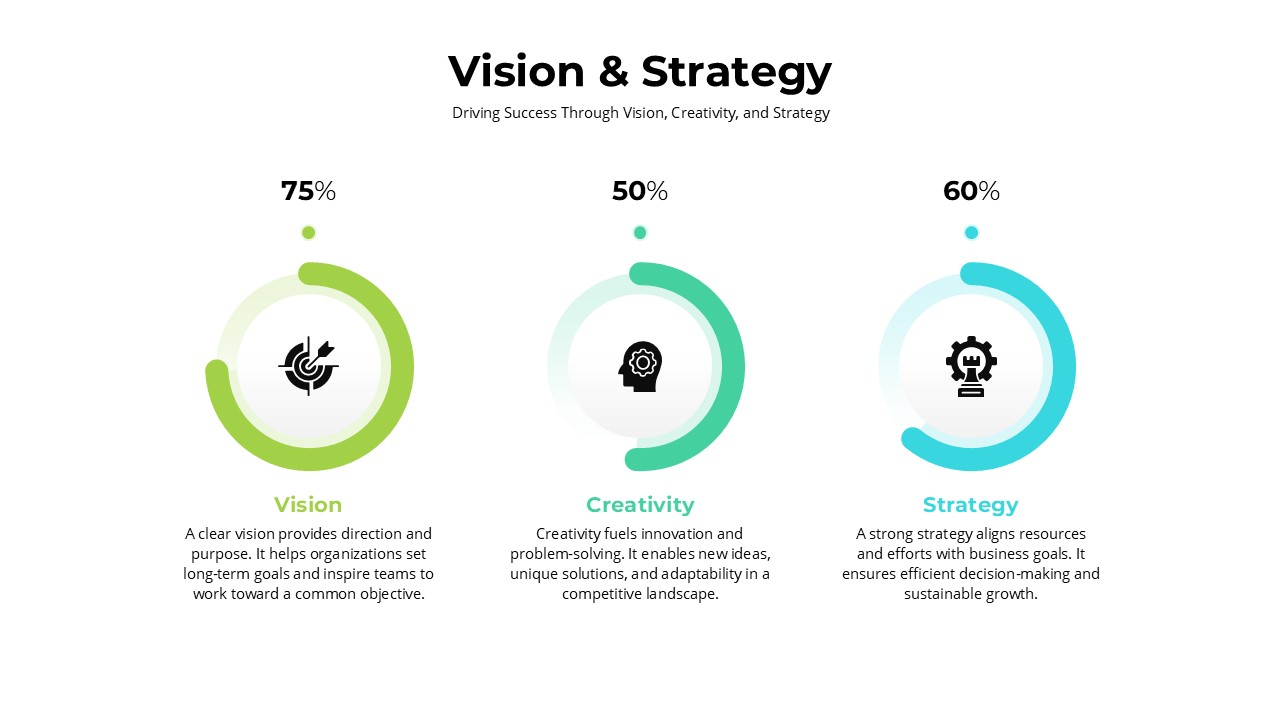
Vision & Strategy Infographic Pack Template for PowerPoint & Google Slides
Vision and Mission
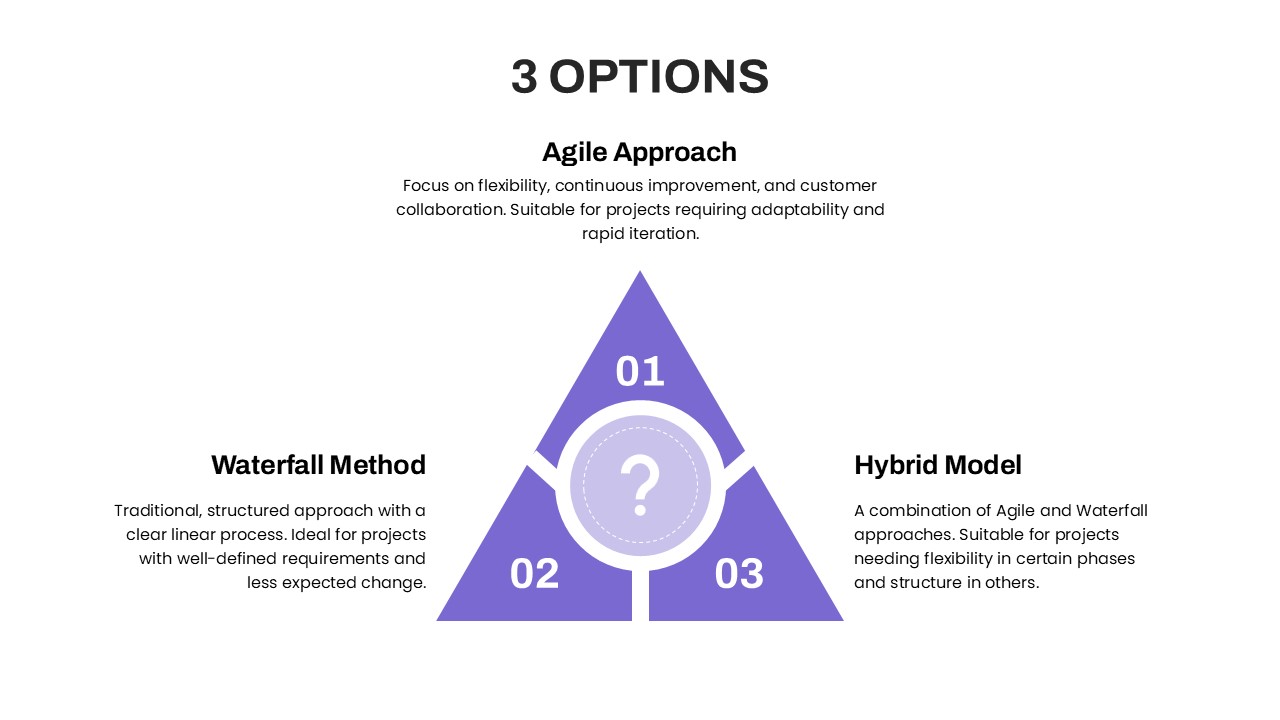
Three Options Infographic Pack Template for PowerPoint & Google Slides
Process
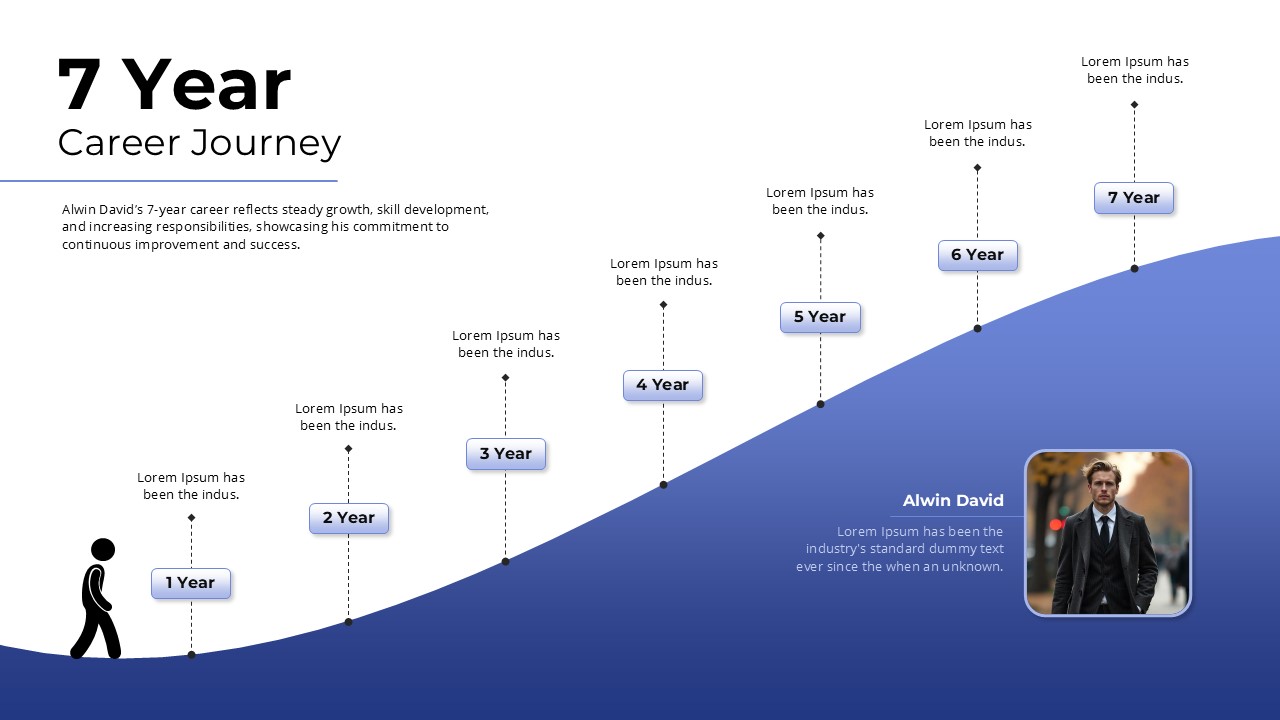
Career Journey Infographic Pack Template for PowerPoint & Google Slides
Timeline
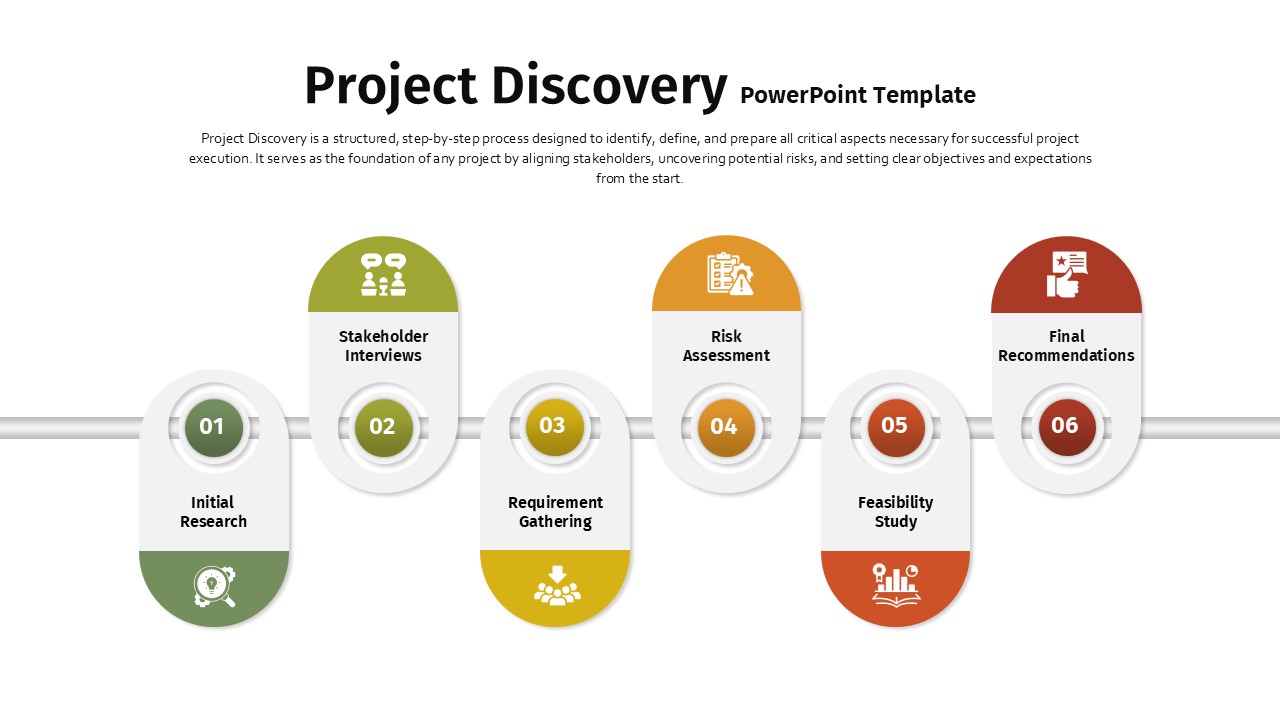
Project Discovery Infographic Pack Template for PowerPoint & Google Slides
Timeline
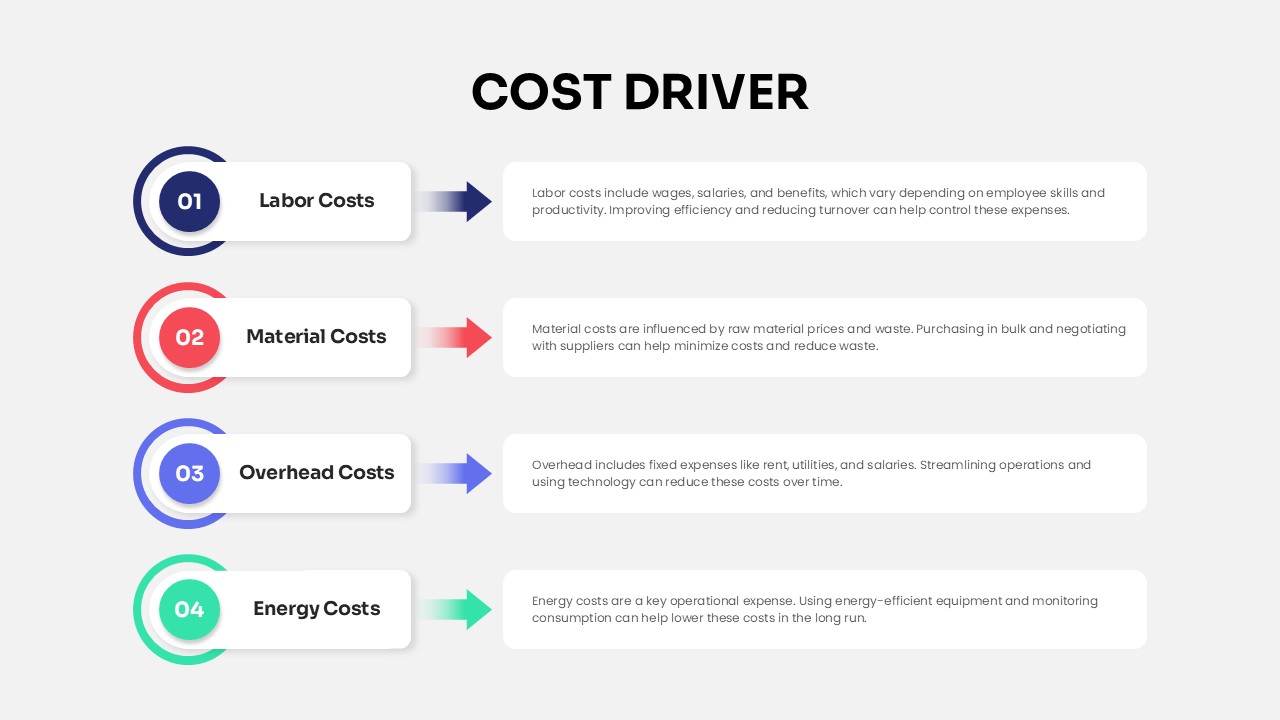
Cost Driver Infographic Slide Pack Template for PowerPoint & Google Slides
Process
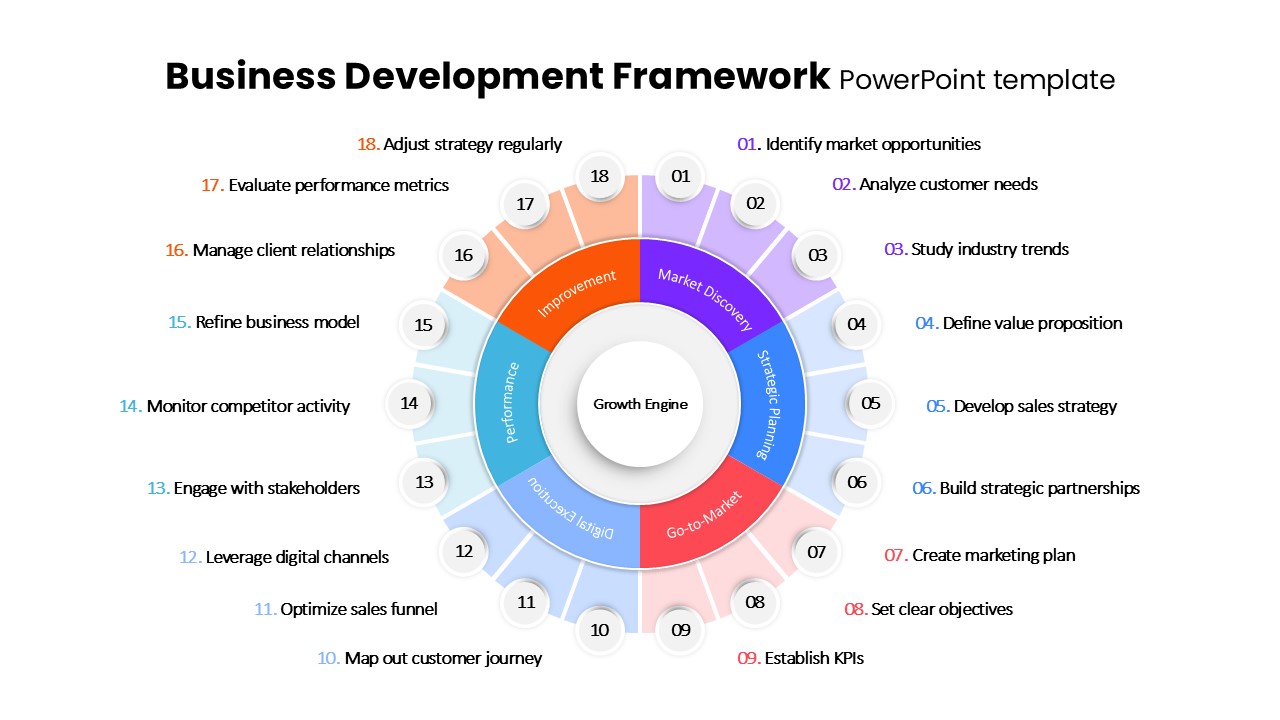
Business Development Framework Pack Template for PowerPoint & Google Slides
Business Strategy
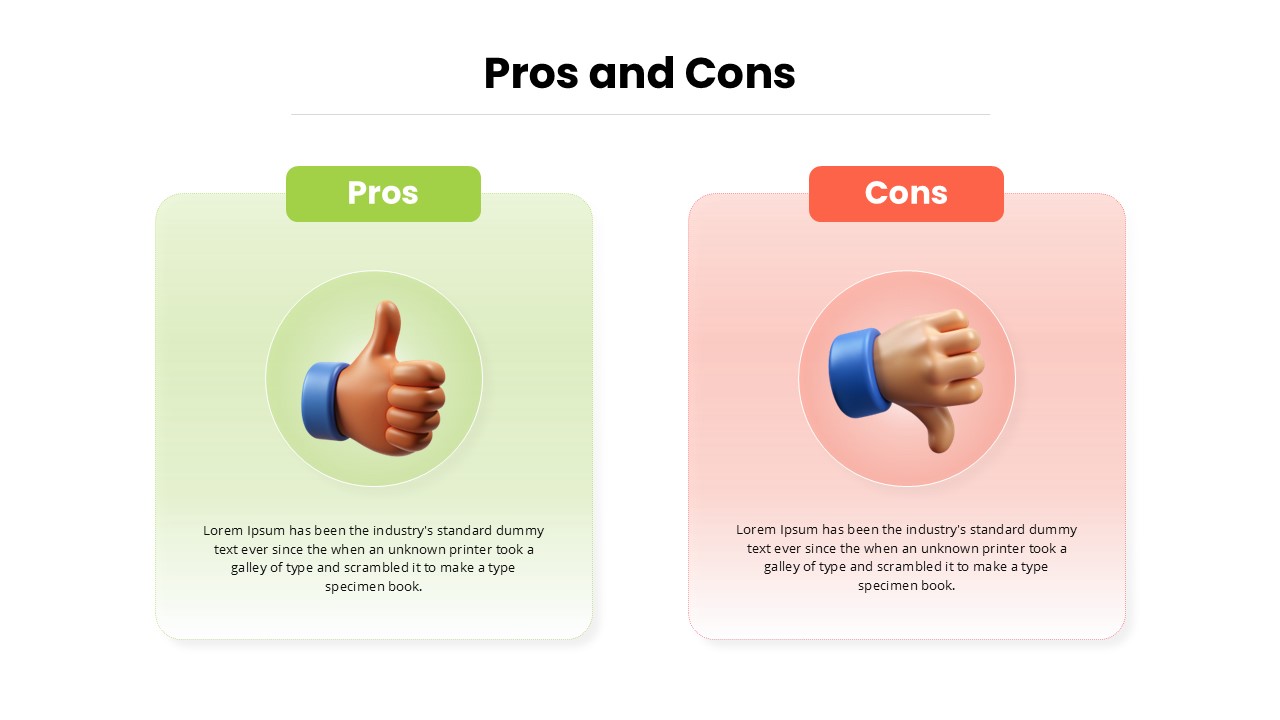
Pros and Cons Infographic Slide Pack Template for PowerPoint & Google Slides
Comparison