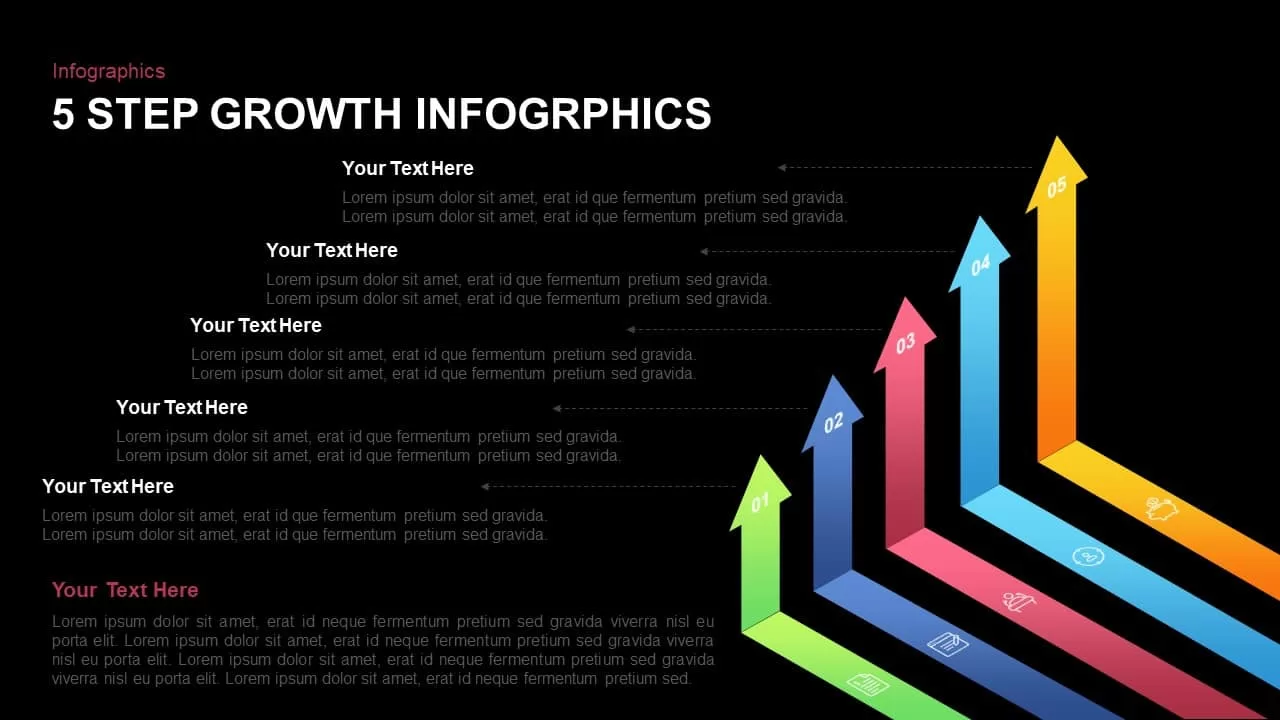
5-Step Growth Arrow Infographics Template for PowerPoint & Google Slides

Description
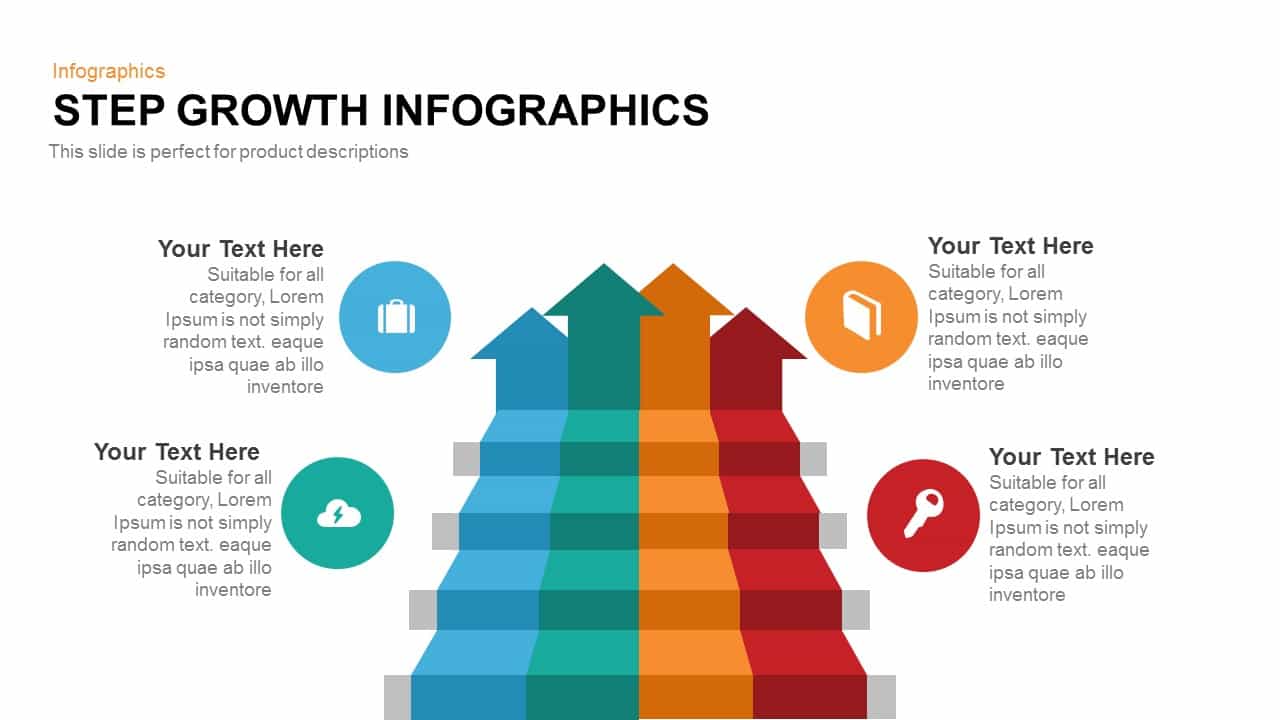
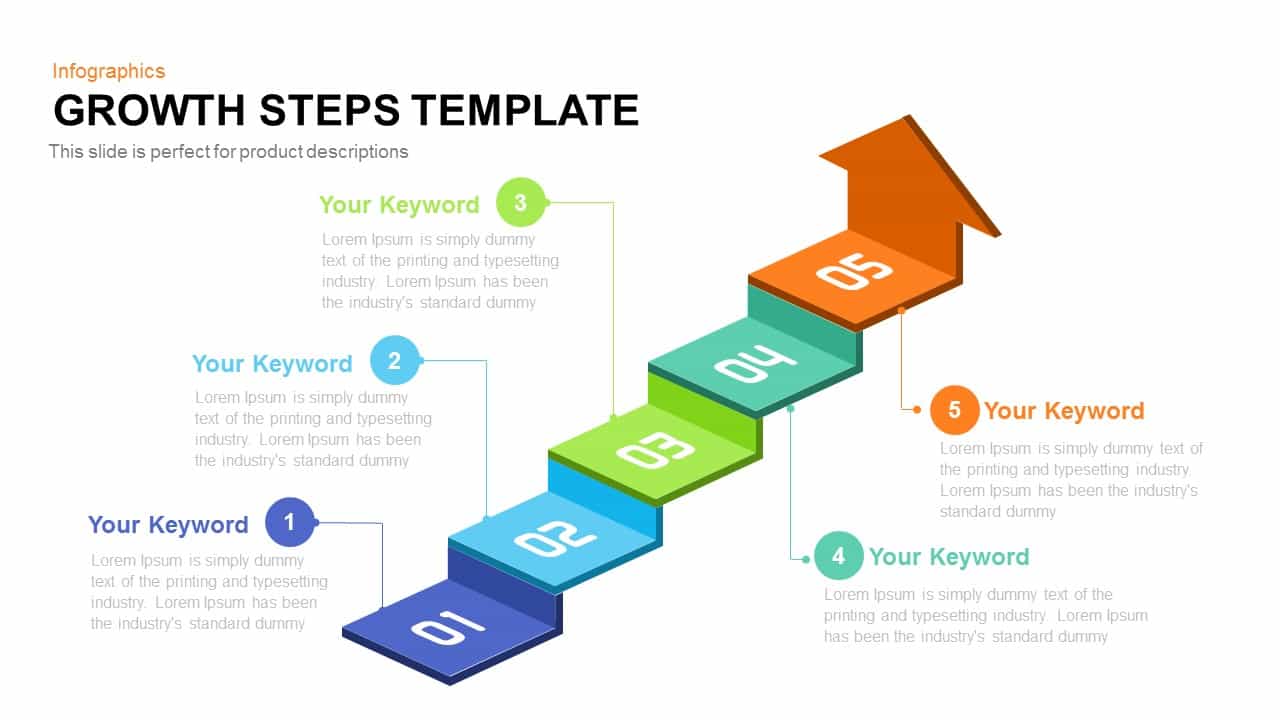
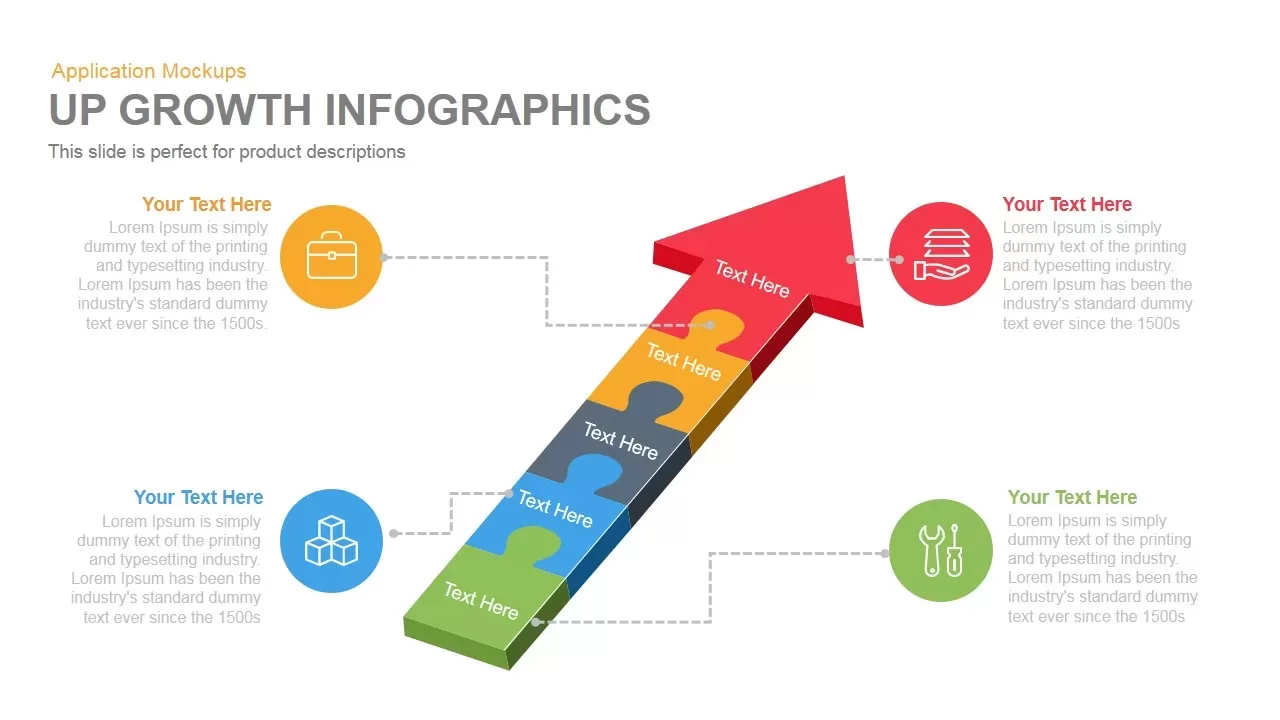
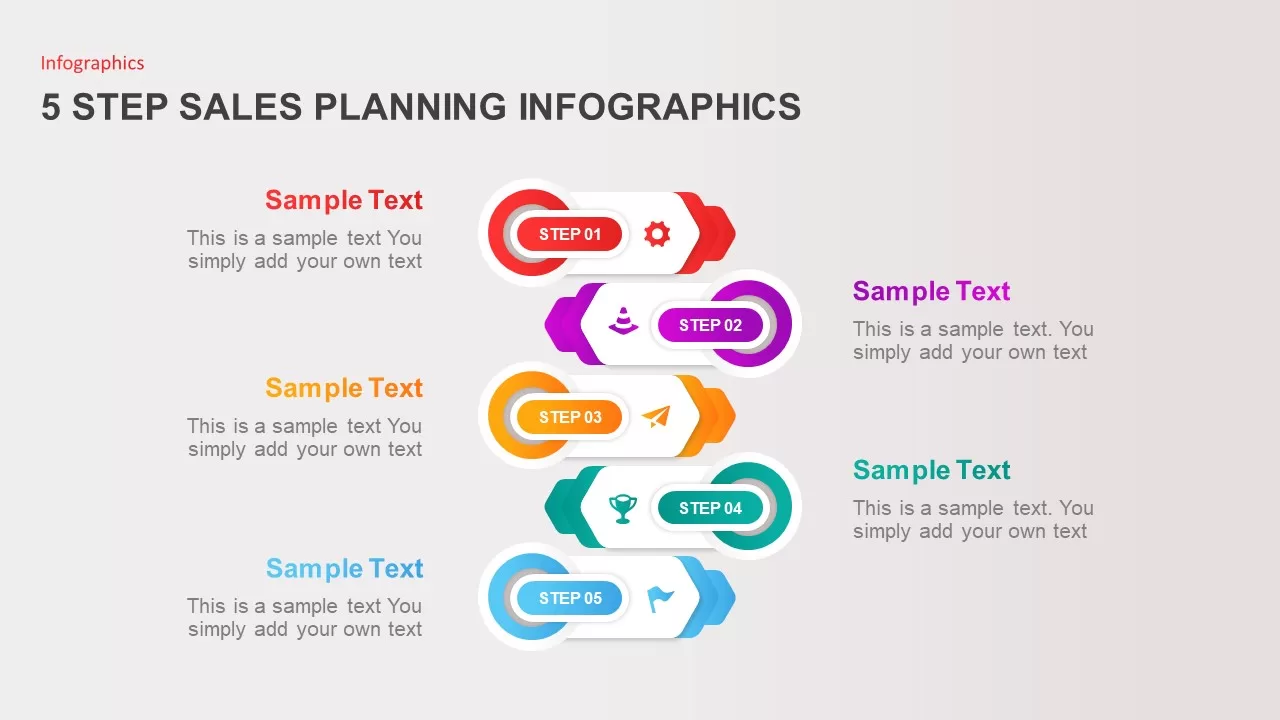
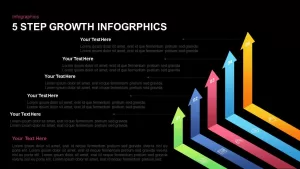
Leverage this 5-step growth arrow infographic slide to illustrate sequential performance milestones or development phases with visual clarity. This modern template features five vertical arrow shapes in distinct gradient hues—green, blue, pink, light blue, and orange—staggered to create a 3D depth effect and numbered from one to five. Each arrow incorporates a minimalist icon placeholder at the tip for category visuals, while dashed connector lines link to text blocks on the left, enabling detailed annotations, metrics, or strategic insights. The clean white background, subtle shadow effects, and generous spacing ensure a professional look and rapid audience comprehension. The staggered 3D perspective enhances depth perception and draws attention to each progression stage.
Engineered for maximum flexibility, this slide uses editable vector shapes, master layouts, and defined placeholders that let you swap arrow colors, adjust connector positions, or replace icons in seconds. Update step titles, insert performance data, or apply your brand’s theme palette with a single click. Built-in alignment guides preserve proportional spacing, and icon color adapts to background gradients automatically. Built-in visualization enhancements, such as subtle drop shadows and consistent stroke widths, reinforce clarity and visual depth.
Optimized for both PowerPoint and Google Slides, this graphic renders seamlessly across devices and preserves formatting integrity during collaboration. Beyond growth tracking, this versatile framework is ideal for process overviews, project roadmaps, onboarding sequences, or KPI presentations. Simply duplicate arrows to extend your sequence, reorder steps to suit your narrative, or repurpose connector lines to highlight dependencies. Whether you’re delivering boardroom presentations, training sessions, or investor pitches, this 5-step growth arrow infographic empowers you to communicate complex timelines, strategic plans, or performance benchmarks clearly and effectively.
Who is it for
Marketing teams, product managers, and business analysts will find this 5-step growth arrow infographic invaluable for illustrating performance milestones, development phases, or strategic roadmaps. Consultants, trainers, and educators can also use it to guide audiences through progressive insights in workshops, presentations, or training modules.
Other Uses
Repurpose this framework for process mappings, product launch timelines, onboarding sequences, or KPI presentations. Adapt arrow connectors to highlight dependencies in project plans, resource allocation, or sales funnel stages. Simply adjust labels and icons to tailor the slide for any sequential narrative or metric-driven scenario.
Login to download this file

Item ID
SB01328
Related Templates

Growth Arrow for Progress & Growth template for PowerPoint & Google Slides
Arrow

Dynamic Growth Arrow Step Infographic Template for PowerPoint & Google Slides
Process
Modern Step Growth Infographics Template for PowerPoint & Google Slides
Process
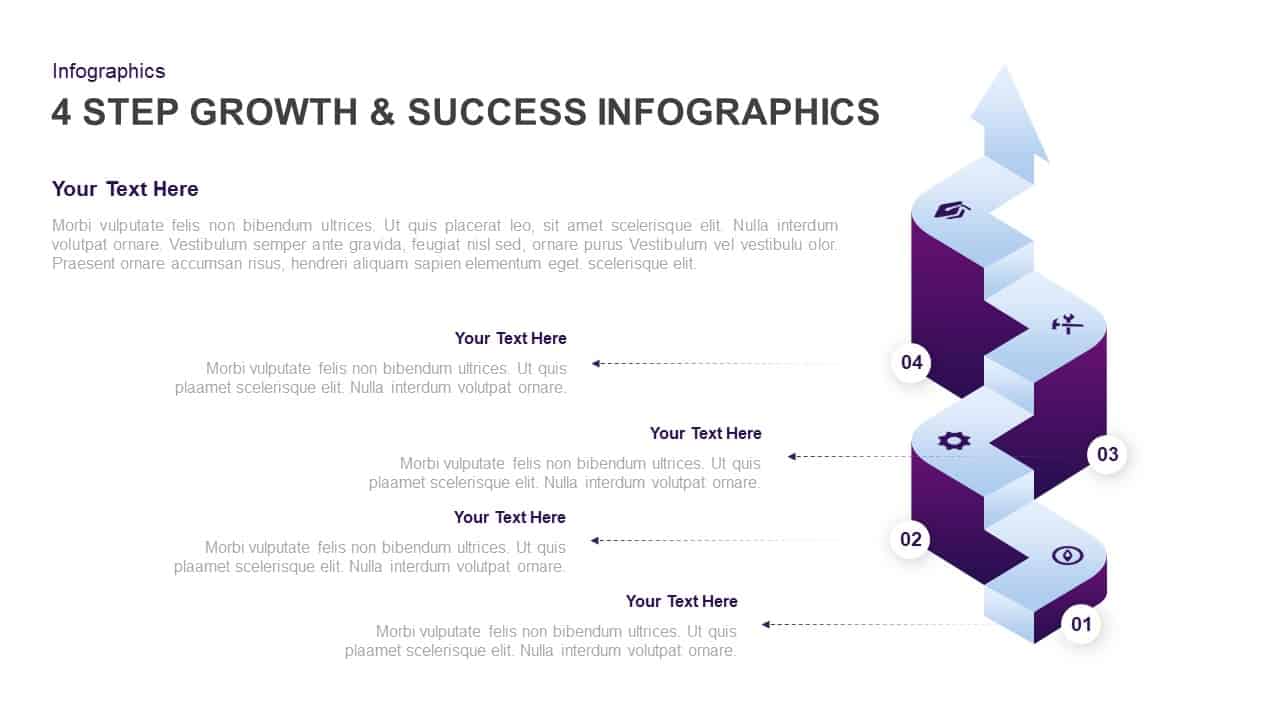
4-Step Growth & Success Infographics Template for PowerPoint & Google Slides
Accomplishment

Arrow Step Infographics Workflow Template for PowerPoint & Google Slides
Arrow
Five 3D Growth Arrow Infographic Slide Template for PowerPoint & Google Slides
Arrow

Improvement Growth Arrow Metaphor Template for PowerPoint & Google Slides
Bar/Column
Five-Stage Growth Arrow Infographic Template for PowerPoint & Google Slides
Arrow
3D Curved Arrow Growth Process Slide Template for PowerPoint & Google Slides
Process
Success and Growth Stair Arrow Diagram for PowerPoint & Google Slides
Process
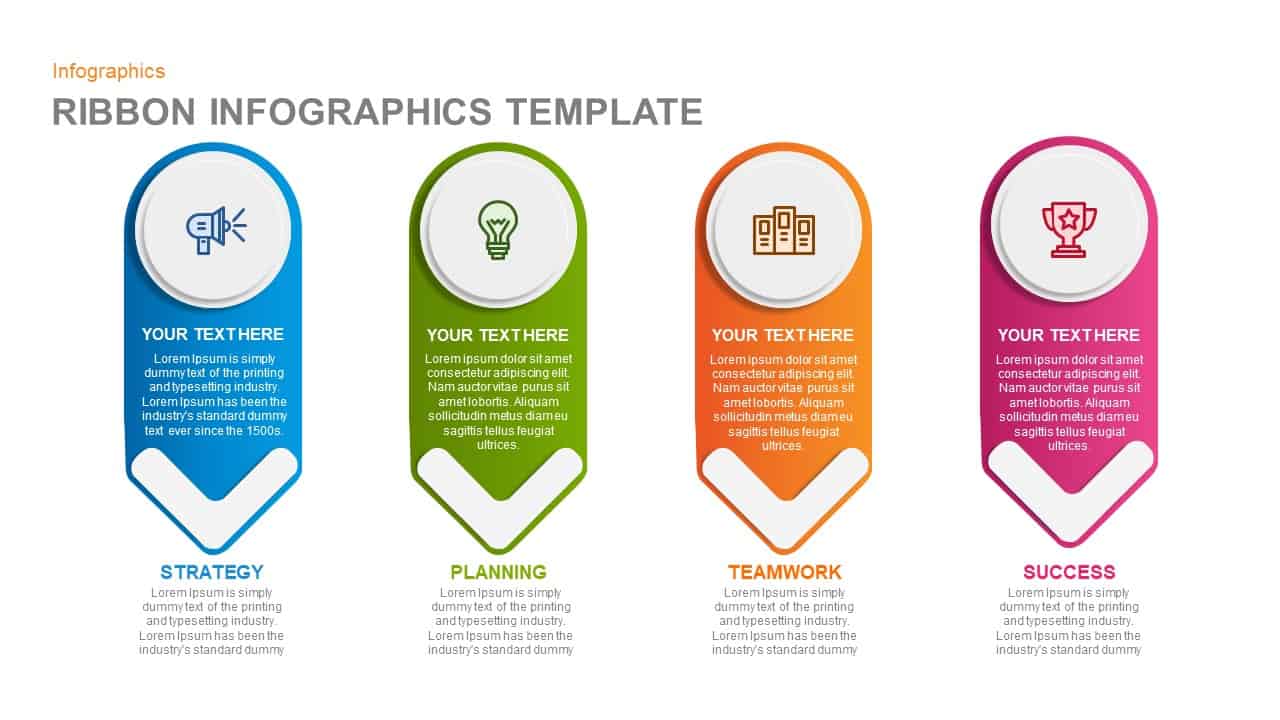
Ribbon Infographics Step-by-Step Process Template for PowerPoint & Google Slides
Process
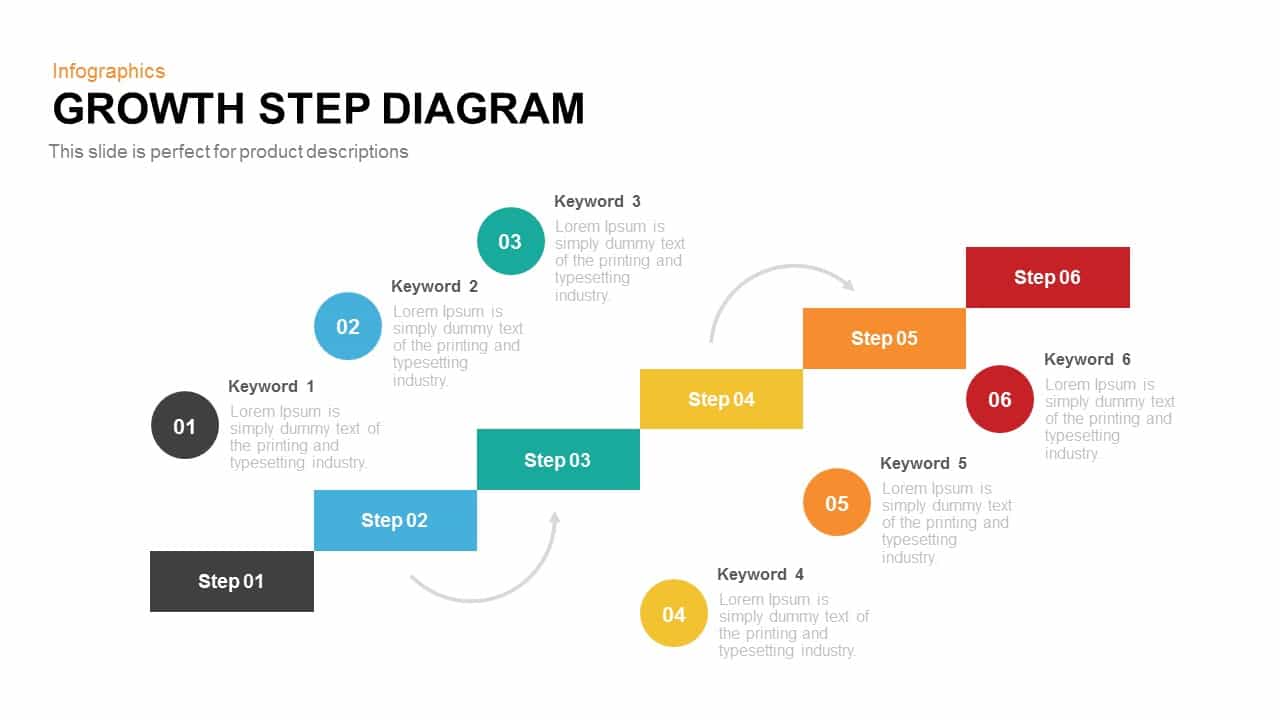
Growth Step Diagram template for PowerPoint & Google Slides
Infographics
5-Step Growth Staircase Infographic Template for PowerPoint & Google Slides
Process
Five-Step Growth Stage Staircase Diagram Template for PowerPoint & Google Slides
Process
Modern Five-Step Growth Diagram Template for PowerPoint & Google Slides
Process
4 Step Revenue Growth Flow Diagram Template for PowerPoint & Google Slides
Process
Five-Step Growth Infographic Slide Template for PowerPoint & Google Slides
Process
Five-Step Growth Timeline Infographic Template for PowerPoint & Google Slides
Timeline
Growth Infographics template for PowerPoint & Google Slides
Arrow
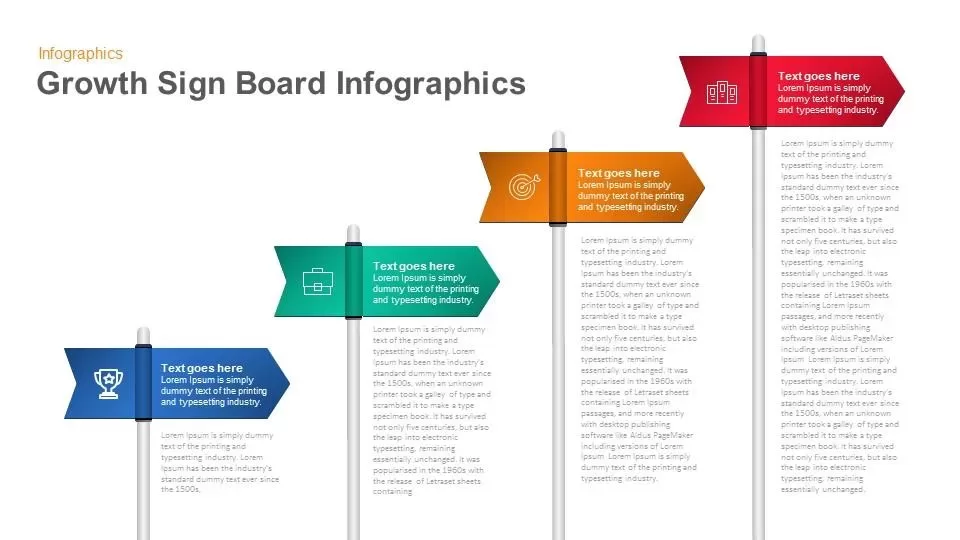
Growth Sign Board Infographics template for PowerPoint & Google Slides
Timeline
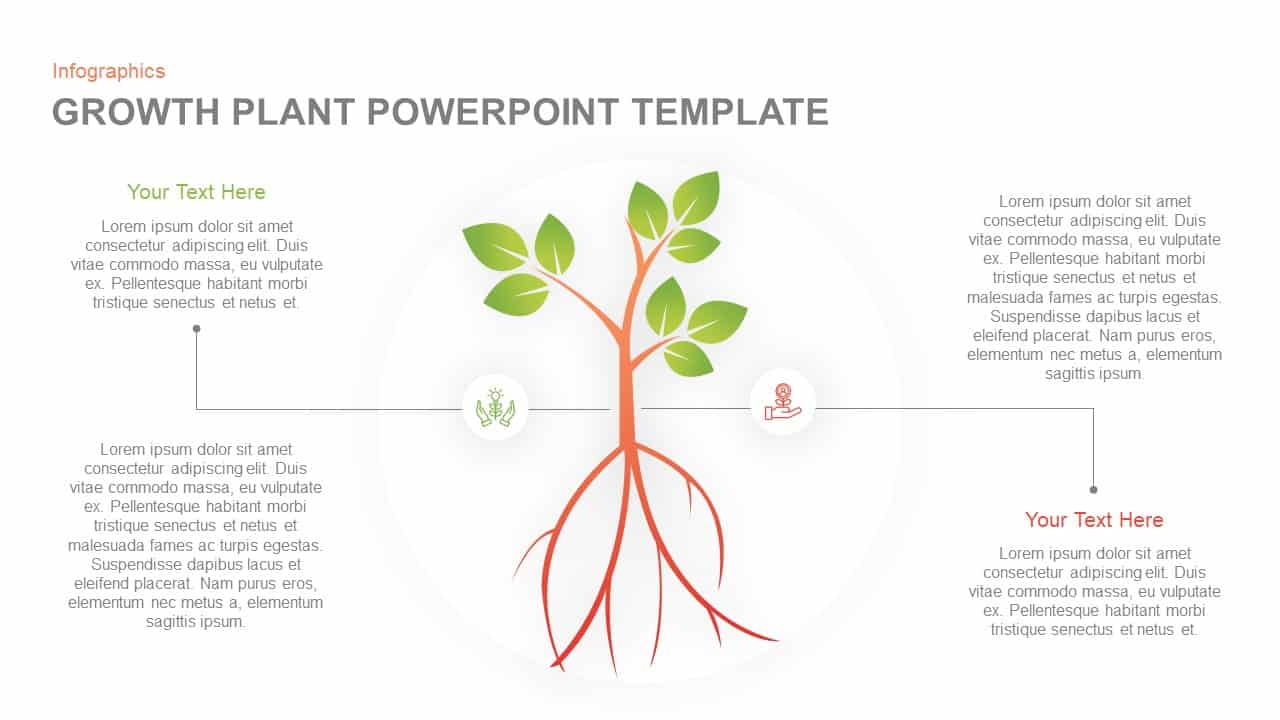
Growth Plant Infographics template for PowerPoint & Google Slides
Process
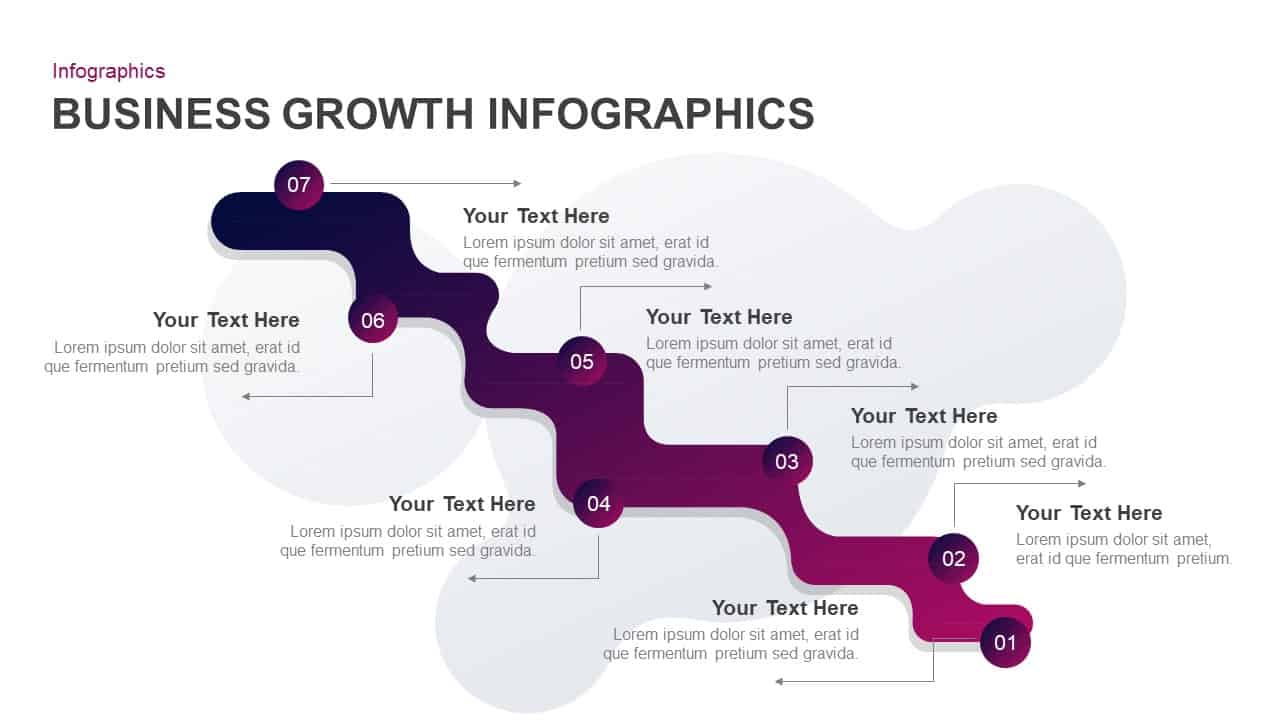
Business Growth Infographics Template for PowerPoint & Google Slides
Roadmap
Business Growth Plant Infographics Pack Template for PowerPoint & Google Slides
Process
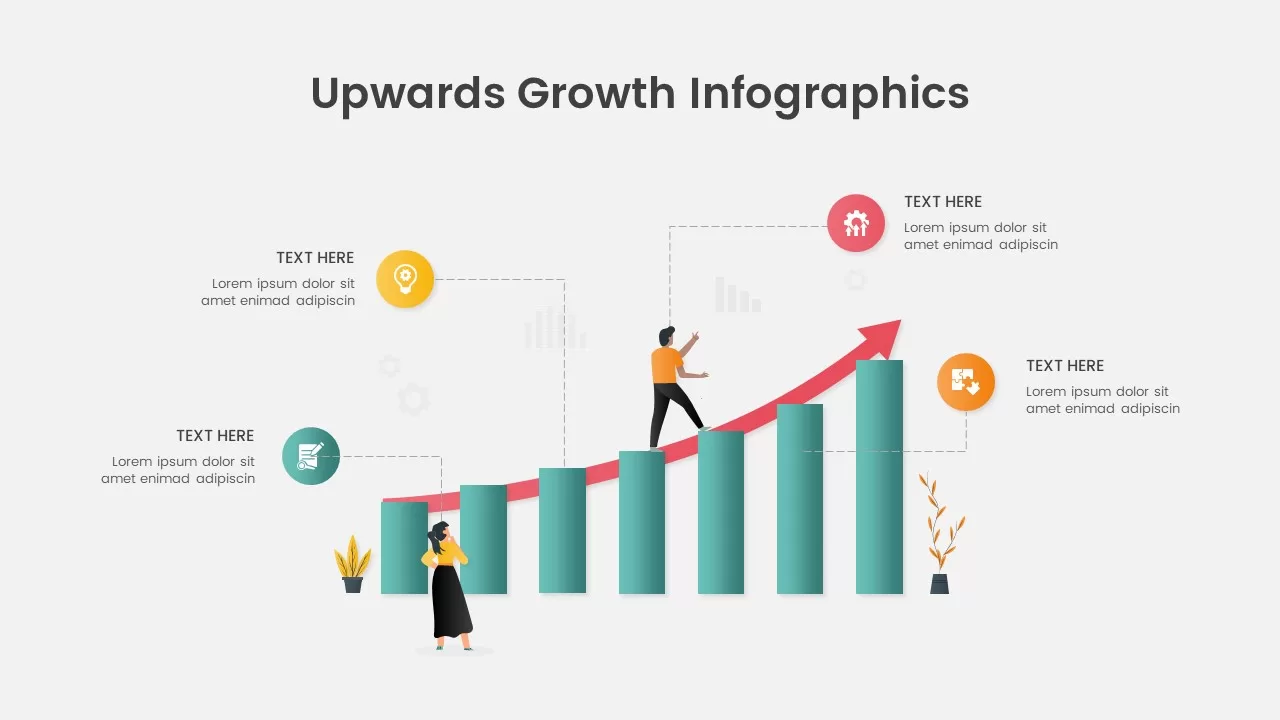
Upwards Growth Infographics for PowerPoint & Google Slides
Infographics
4 Step Arrow Diagram template for PowerPoint & Google Slides
Arrow
5-Step Arrow Diagram template for PowerPoint & Google Slides
Arrow
6-Step Arrow Process Diagram Template for PowerPoint & Google Slides
Process
8-Step Circular Arrow Diagram Template for PowerPoint & Google Slides
Arrow
Six-Step Two-Sided Arrow Diagram Template for PowerPoint & Google Slides
Process
Four-Step Arrow Process Infographic Template for PowerPoint & Google Slides
Arrow
Four-Option 4-Step Arrow Infographic Template for PowerPoint & Google Slides
Arrow
Six-Step Linear Arrow Process Diagram Template for PowerPoint & Google Slides
Process
Eight-Step Inward Arrow Diagram Template for PowerPoint & Google Slides
Arrow
Multi-Color Five-Step Curved Arrow Template for PowerPoint & Google Slides
Process
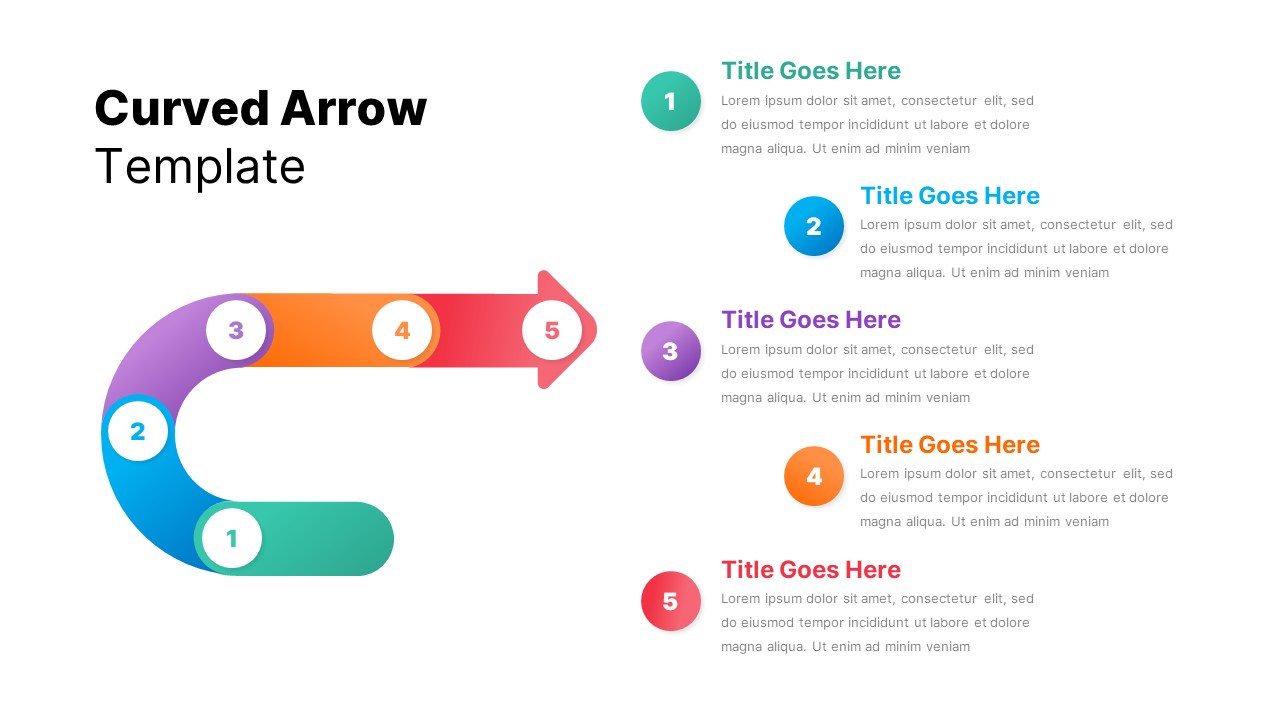
5-Step Curved Arrow Infographic Template for PowerPoint & Google Slides
Arrow
Four-Step Curved Arrow Process Template for PowerPoint & Google Slides
Process
Three-Step Wavy Arrow Flow Template for PowerPoint & Google Slides
Process
Three-Step Curved Arrow Process Diagram Template for PowerPoint & Google Slides
Arrow
Hand-Drawn Four-Step Curved Arrow Diagram Template for PowerPoint & Google Slides
Arrow
Four-Step Curved Arrow Diagram Template for PowerPoint & Google Slides
Arrow
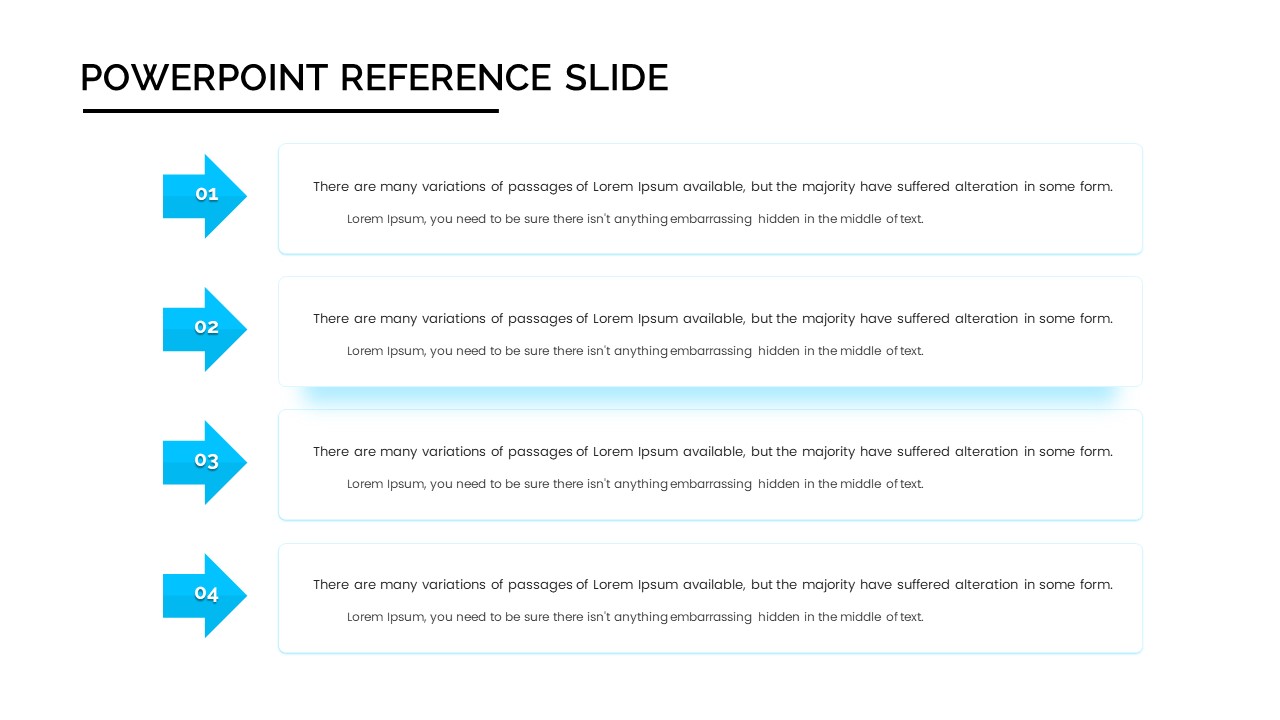
Four-Step Arrow Reference Diagram Slide Template for PowerPoint & Google Slides
Arrow
Arrow Infographics template for PowerPoint & Google Slides
Infographics
3D Arrow Infographics Circular Flow Template for PowerPoint & Google Slides
Arrow
3D Four Arrow Infographics Diagram Template for PowerPoint & Google Slides
Arrow
5-Stage Arrow Infographics Process Flow Template for PowerPoint & Google Slides
Arrow
Four Arrow Square Infographics Template for PowerPoint & Google Slides
Arrow
Four Swoosh Arrow Infographics template for PowerPoint & Google Slides
Arrow
Eight-Segment 3D Arrow Infographics Template for PowerPoint & Google Slides
Arrow
Five Arrow Infographics Diagram Template for PowerPoint & Google Slides
Arrow
3D Four-Directional Arrow Infographics Template for PowerPoint & Google Slides
Arrow
Five-Stage Arrow Infographics Timeline Template for PowerPoint & Google Slides
Arrow
Timeline Arrow Infographics Diagram Template for PowerPoint & Google Slides
Timeline
Six-Stage Time Arrow Infographics Template for PowerPoint & Google Slides
Arrow
3D Arrow Infographics template for PowerPoint & Google Slides
Arrow
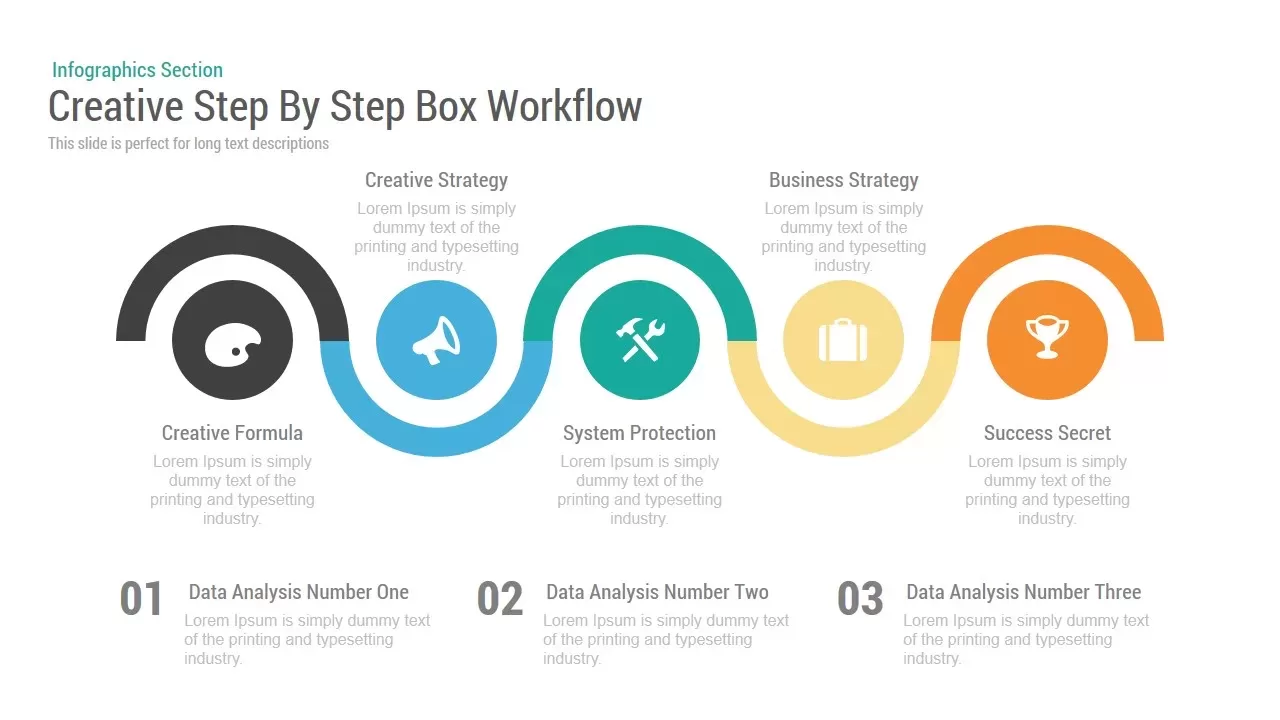
Creative Step By Step Workflow template for PowerPoint & Google Slides
Process
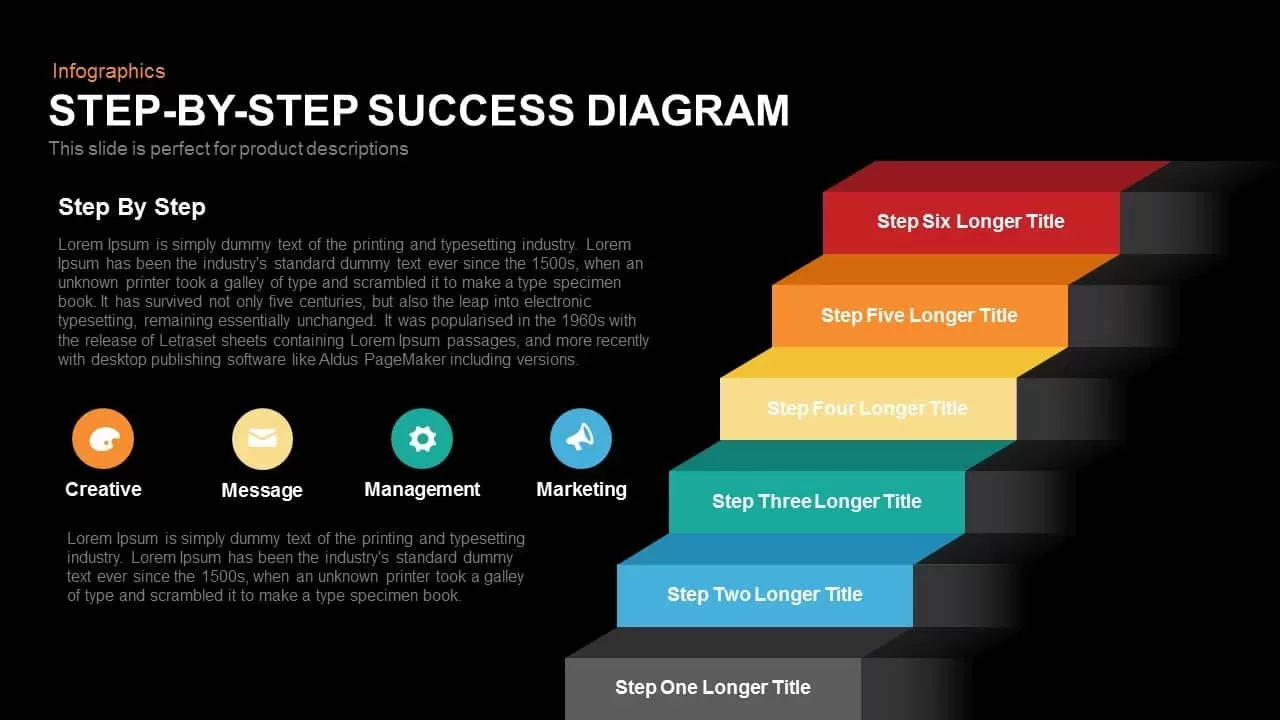
Step-by-Step Success Staircase Diagram template for PowerPoint & Google Slides
Process
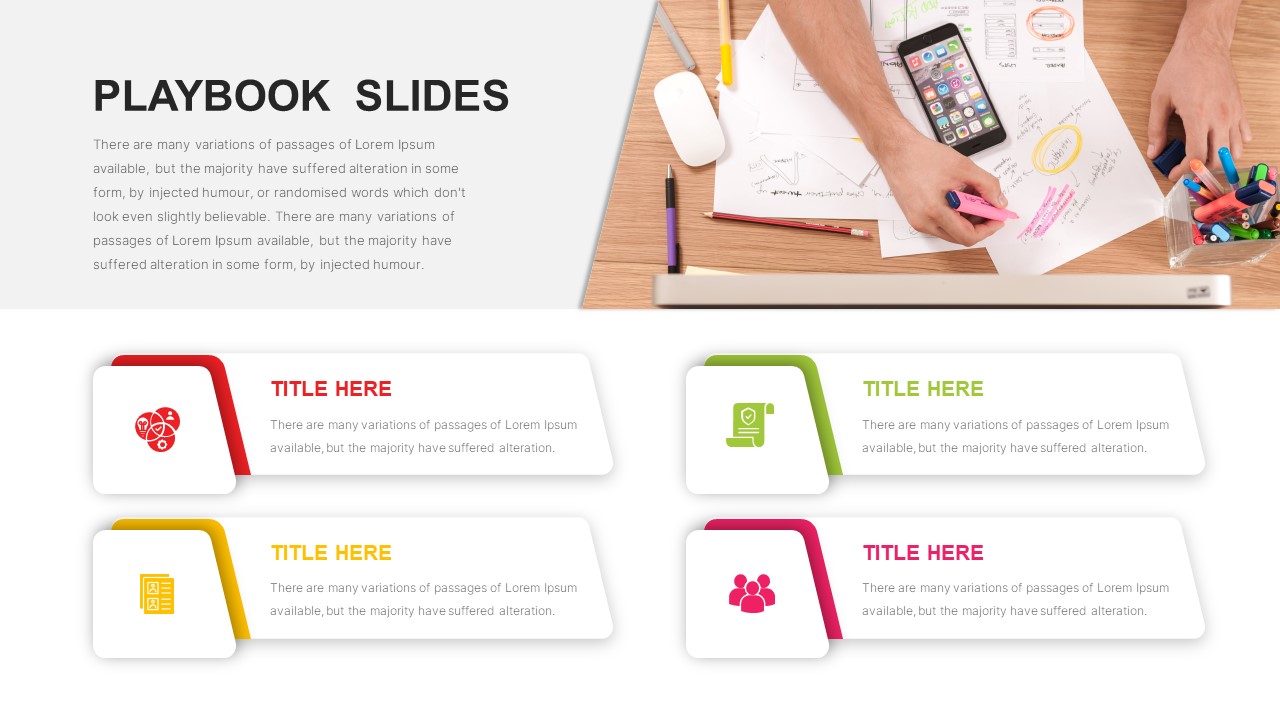
Sales Playbook Step-by-Step Process Template for PowerPoint & Google Slides
Process
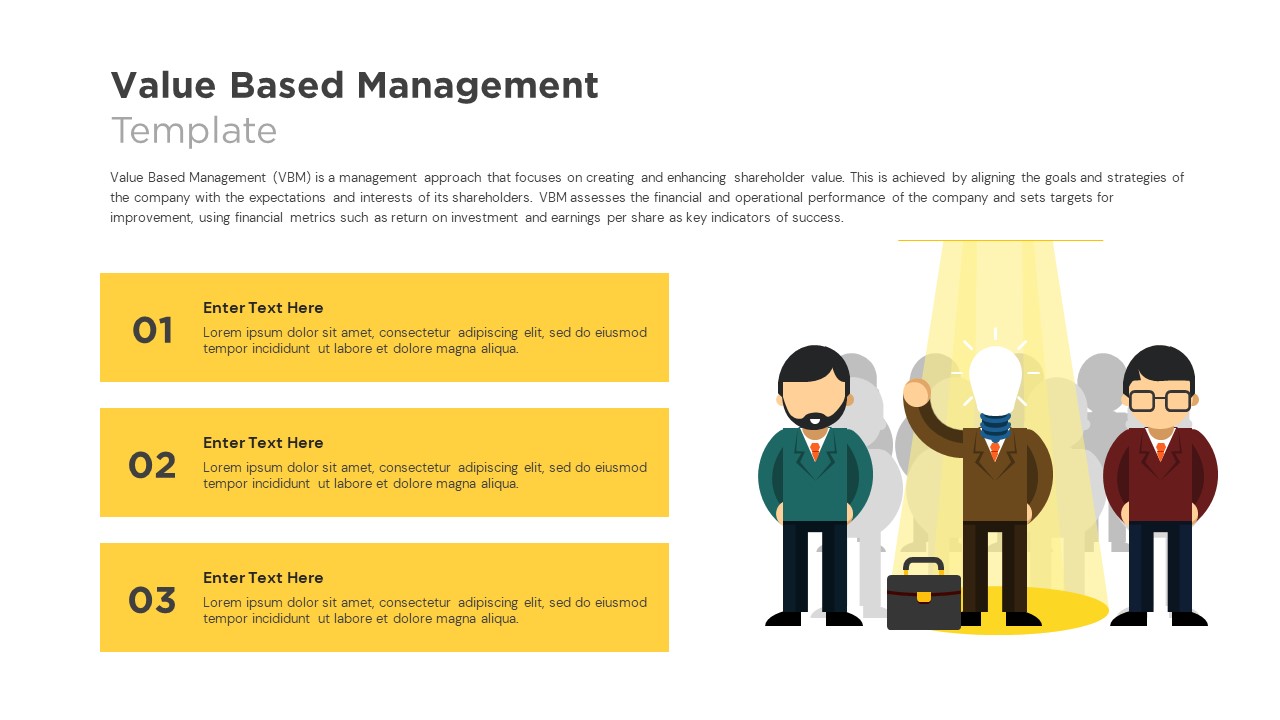
Value Based Management Step-by-Step Template for PowerPoint & Google Slides
Business Strategy
Top 10 Step-by-Step Image & Text Layouts Template for PowerPoint & Google Slides
Graphics
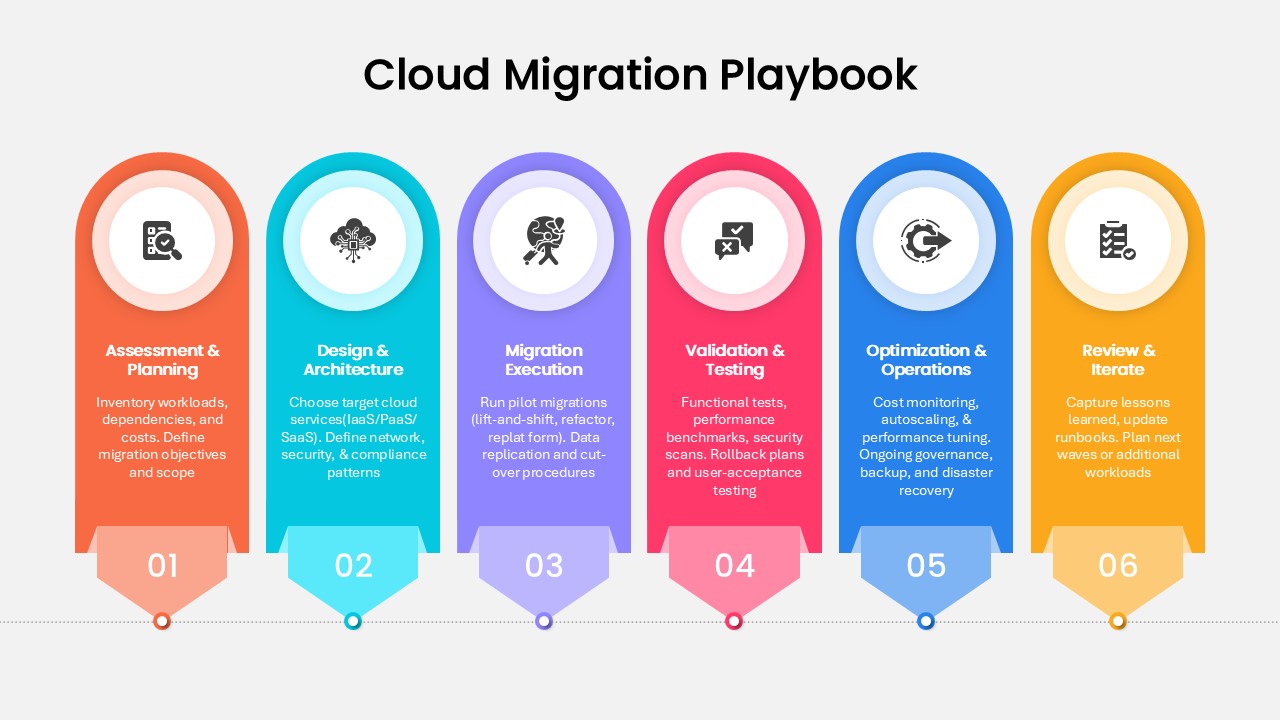
Step-by-Step Cloud Migration Playbook Template for PowerPoint & Google Slides
Cloud Computing
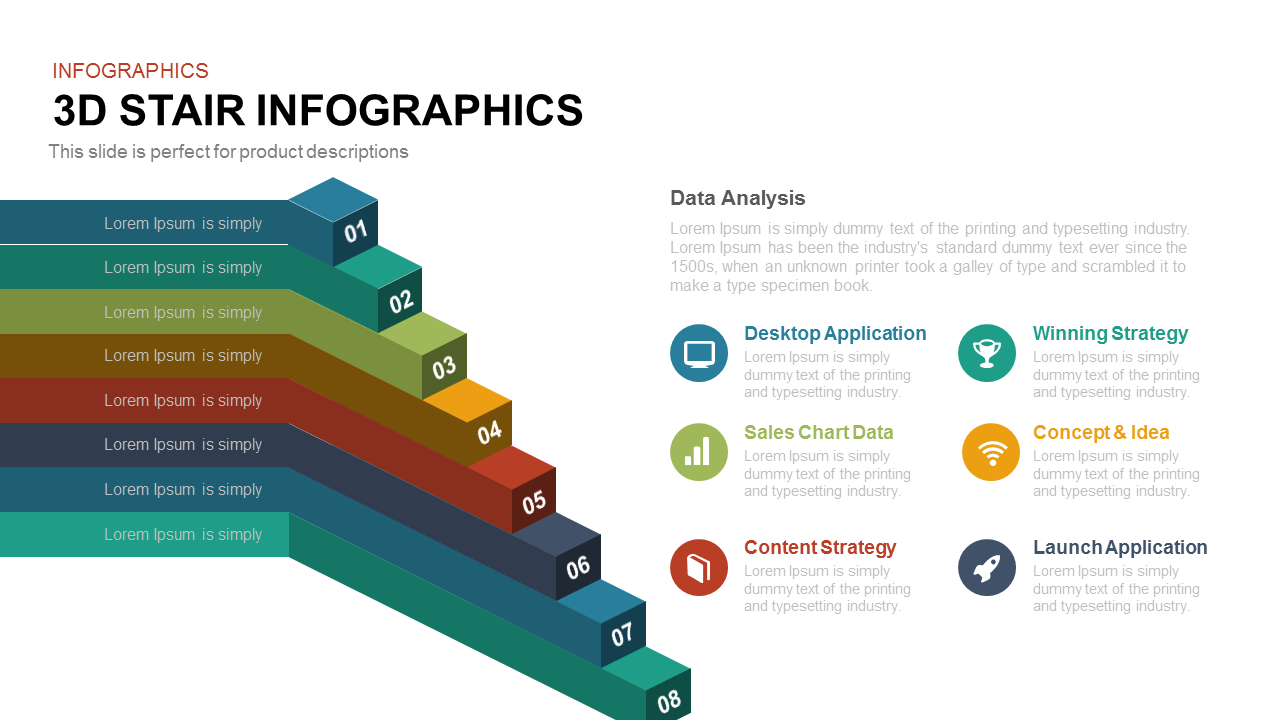
8-Step 3D Stair Infographics Slide template for PowerPoint & Google Slides
Process
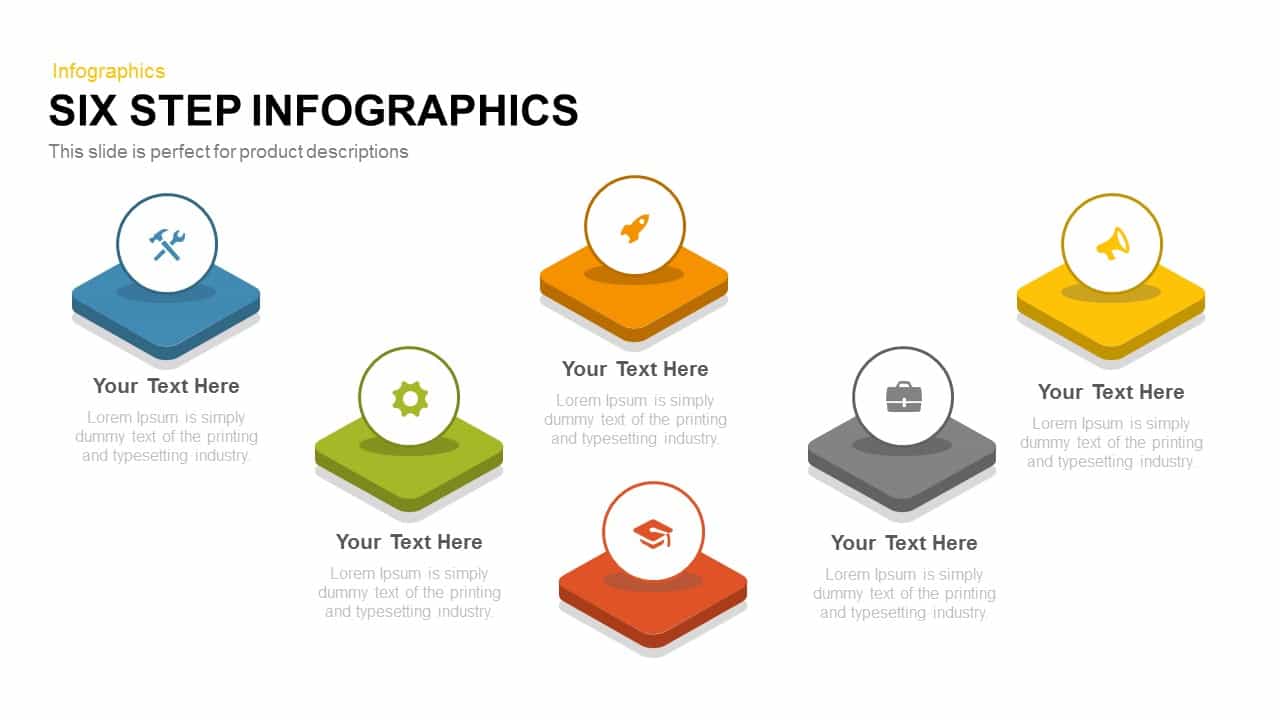
Six-Step Infographics Template for PowerPoint & Google Slides
Process
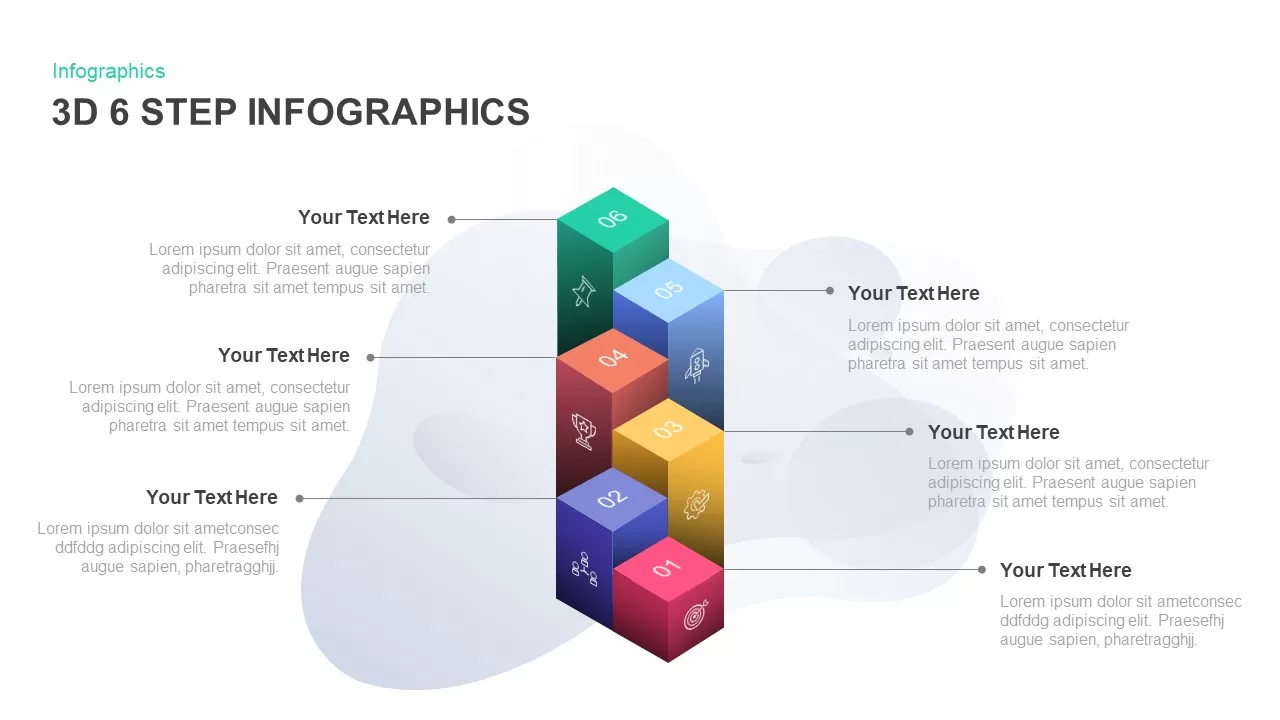
3D 6-Step Infographics Process Diagram Template for PowerPoint & Google Slides
Infographics
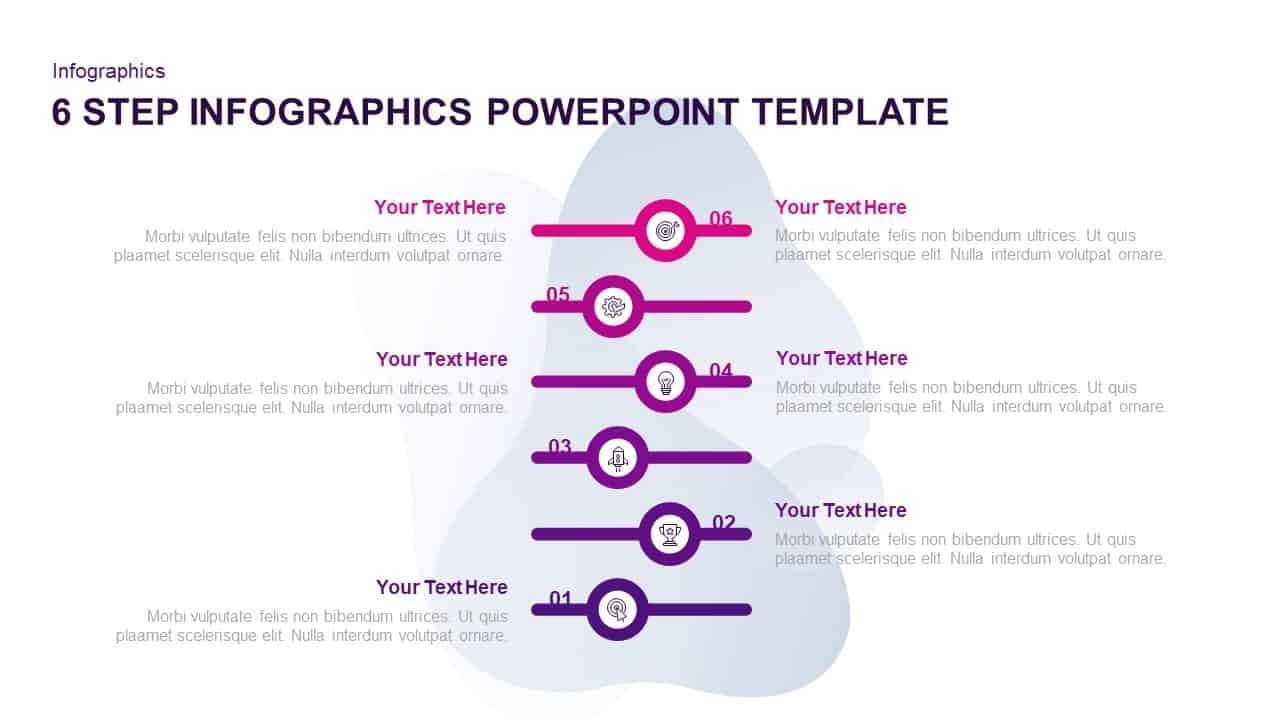
Six-Step Purple Gradient Infographics Template for PowerPoint & Google Slides
Process
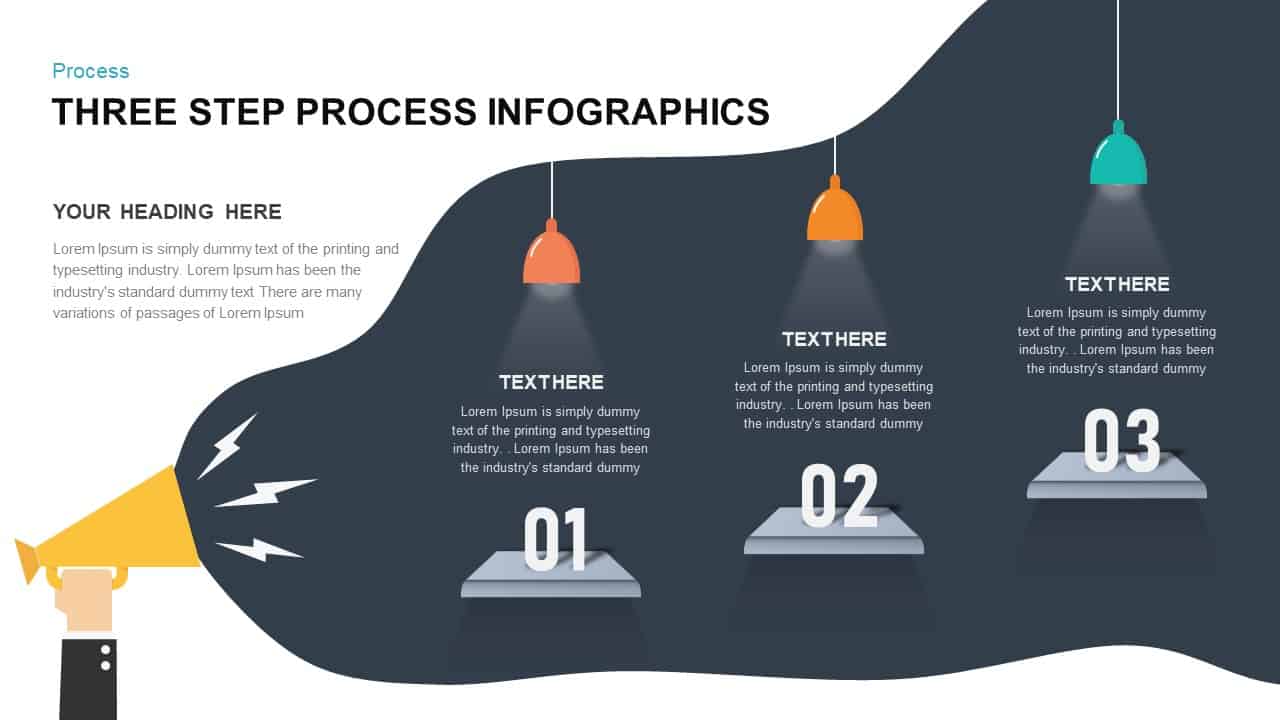
Three-Step Process Infographics Template for PowerPoint & Google Slides
Process

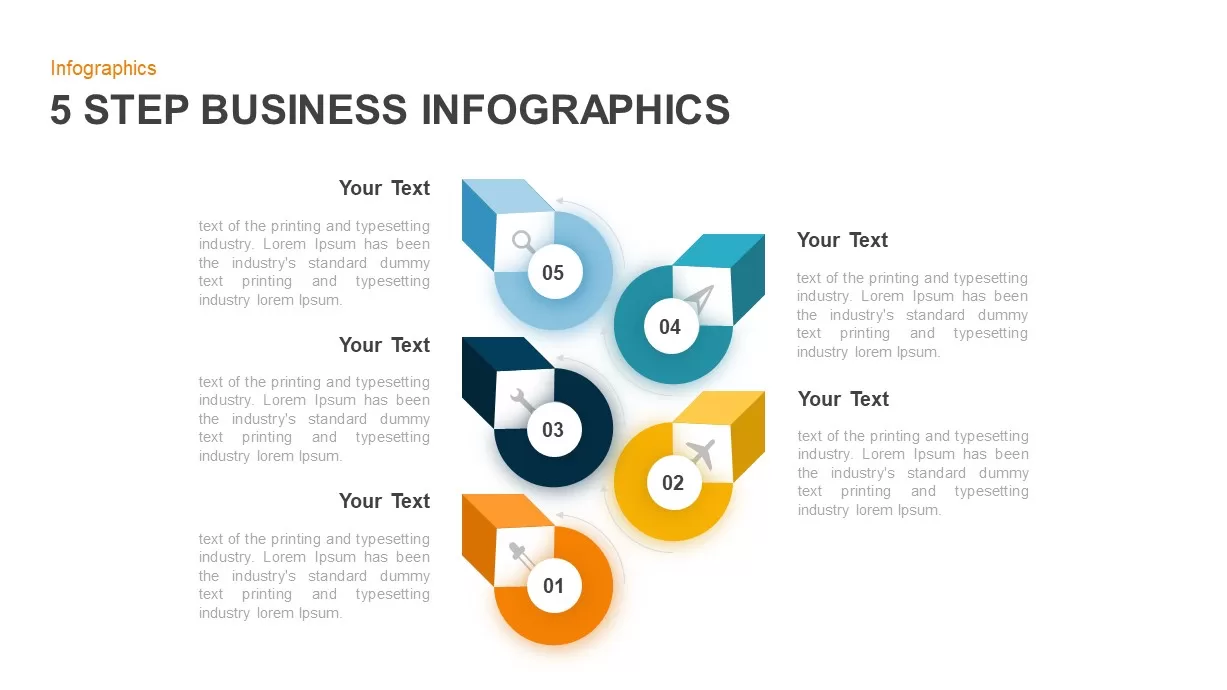
Five-Step Business Infographics Template for PowerPoint & Google Slides
Infographics
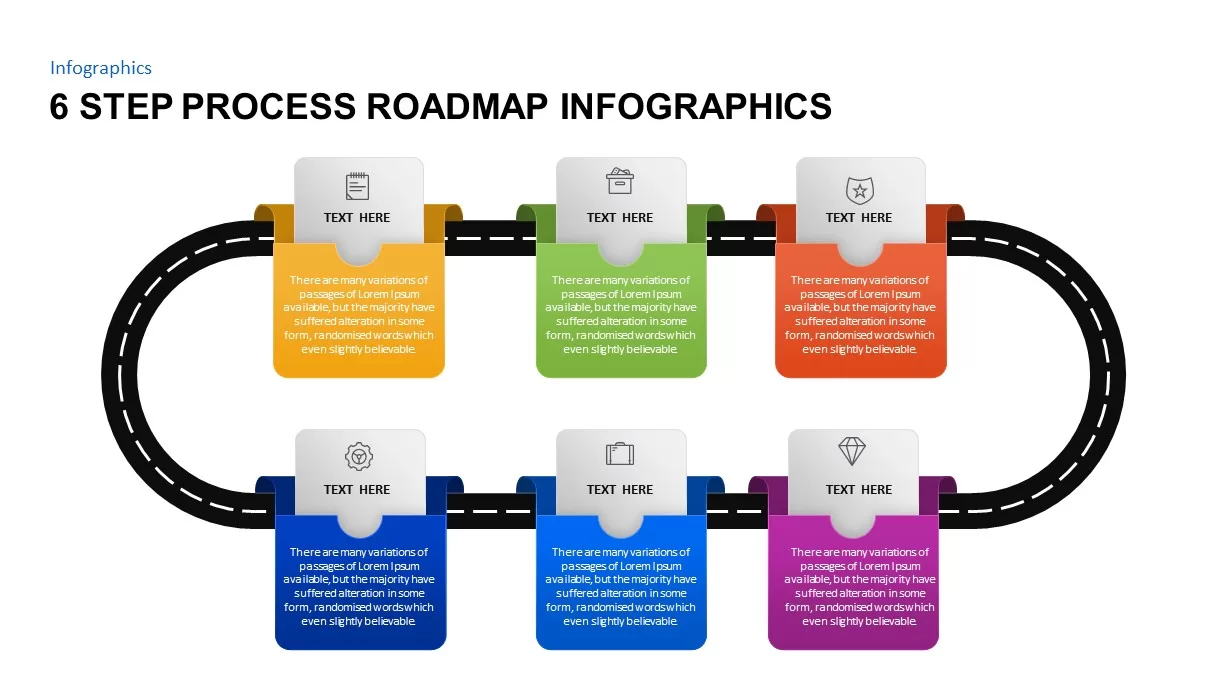
6 Step Process Roadmap Infographics Template for PowerPoint & Google Slides
Roadmap
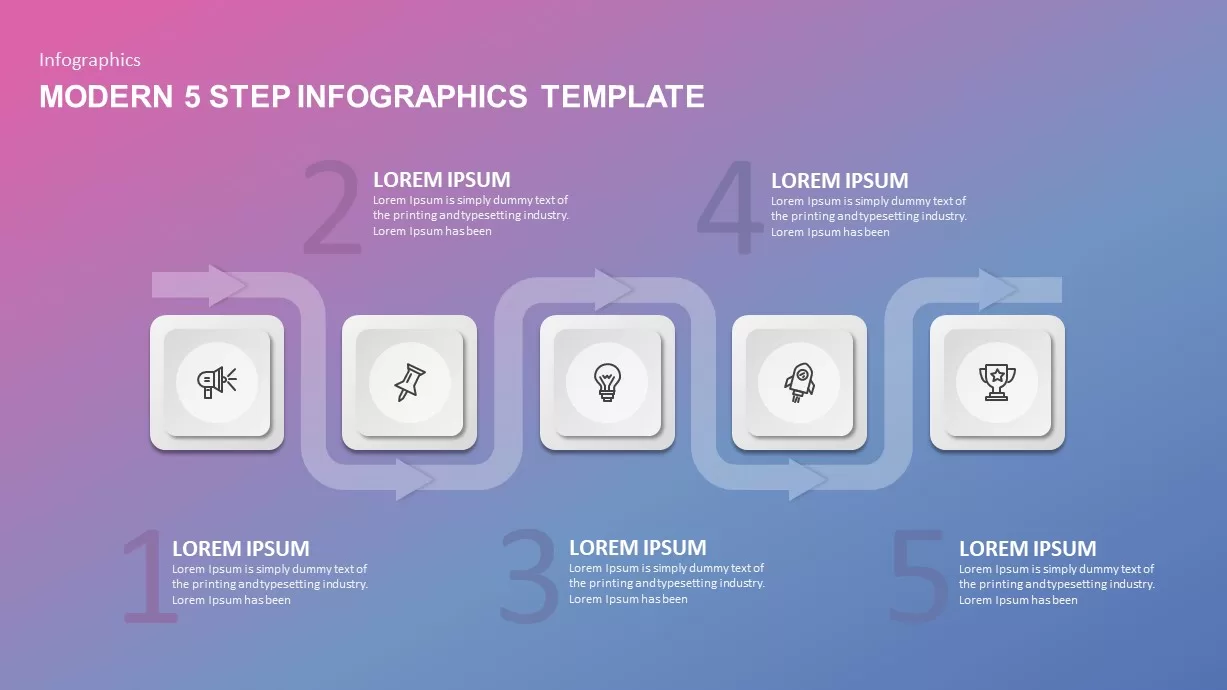
Modern 5-Step Flow Infographics Template for PowerPoint & Google Slides
Process
Four-Step Circular Process Infographics Template for PowerPoint & Google Slides
Circular
Five-Step Circular Badge Infographics Template for PowerPoint & Google Slides
Circular
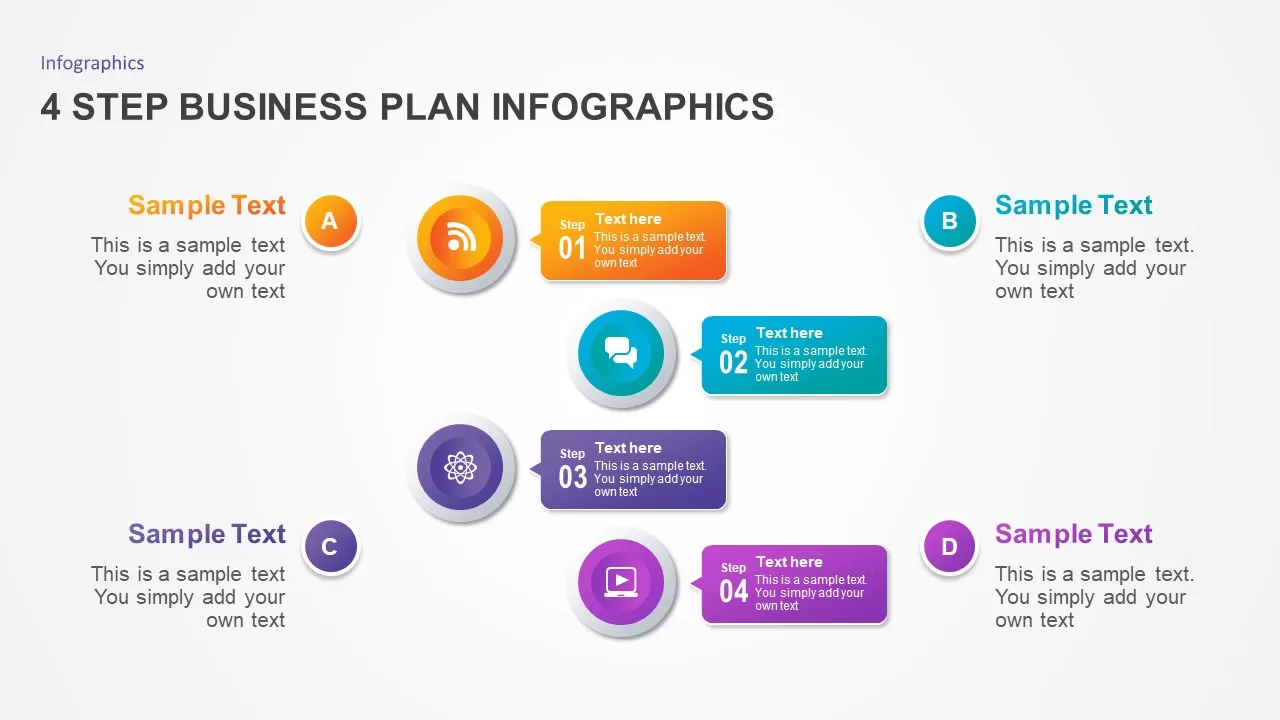
Four-Step Business Plan Infographics Template for PowerPoint & Google Slides
Business Plan
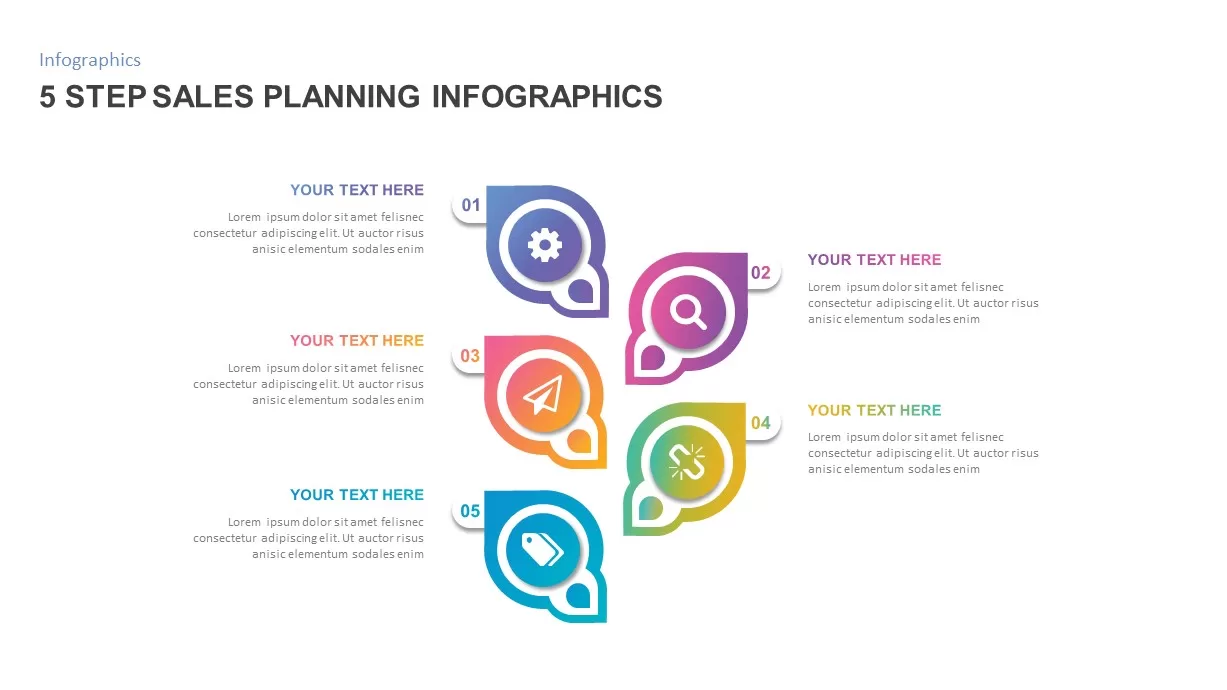
5 Step Sales Planning Infographics Template for PowerPoint & Google Slides
Process
Six-Step Circular Diagram Infographics Template for PowerPoint & Google Slides
Circular
8-Step Circular Diagram Infographics Template for PowerPoint & Google Slides
Circular
3, 4, and 5 Step Gear Infographics Template for PowerPoint & Google Slides
Process
8-Step Circular Gear Infographics Diagram for PowerPoint & Google Slides
Process
4 and 5 Step Honeycomb Infographics for PowerPoint & Google Slides
Process
5 Step Sales Planning Infographics for PowerPoint & Google Slides
Infographics
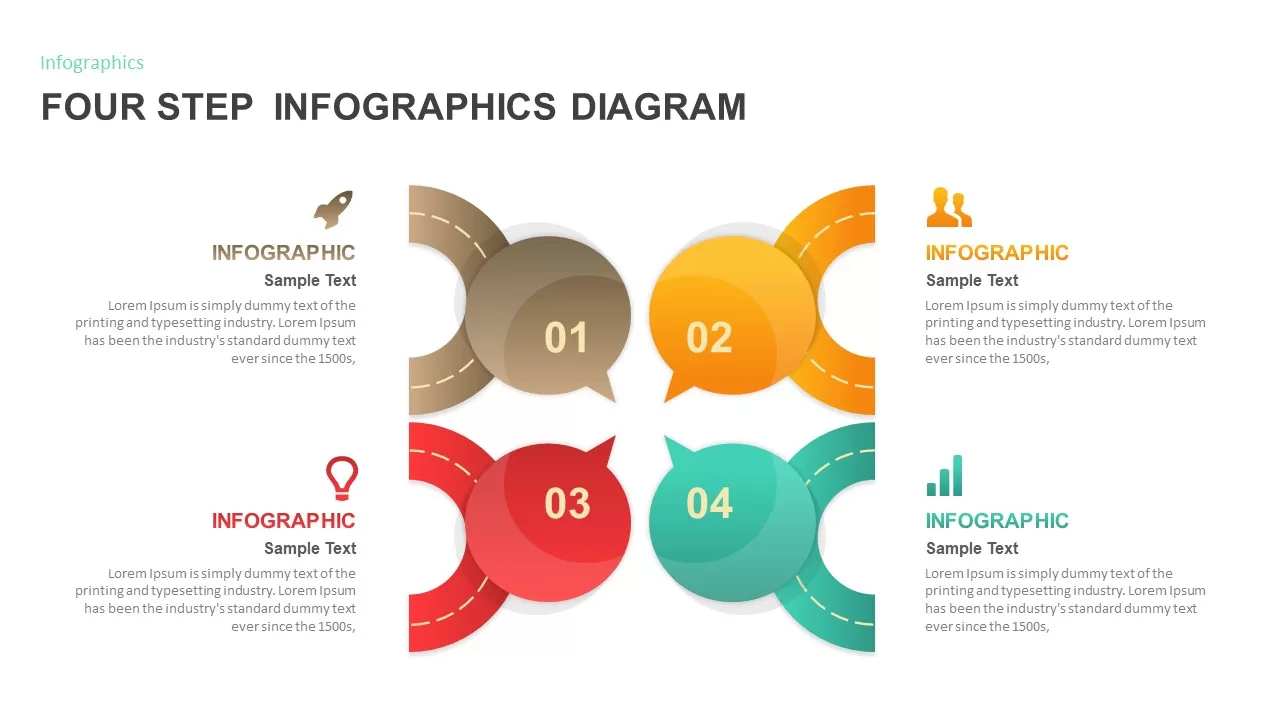
Four Step Infographics Diagram for PowerPoint & Google Slides
Process
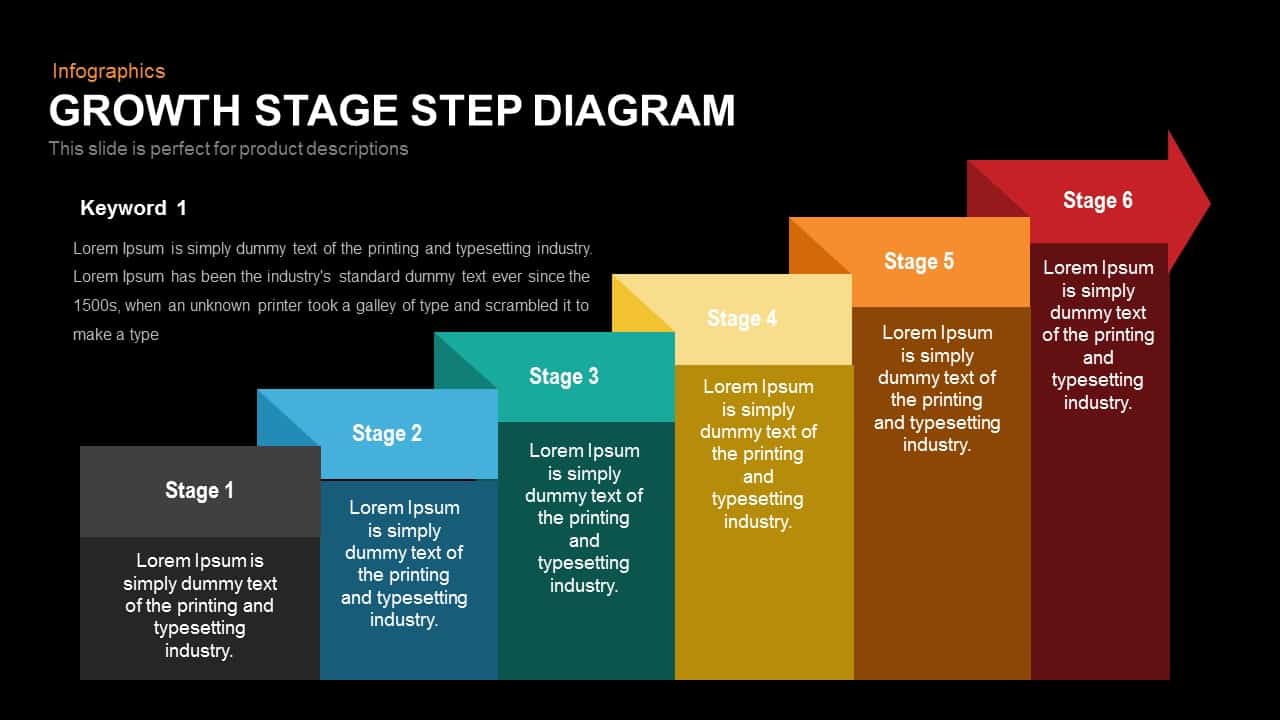
Growth Stage Diagram template for PowerPoint & Google Slides
Process
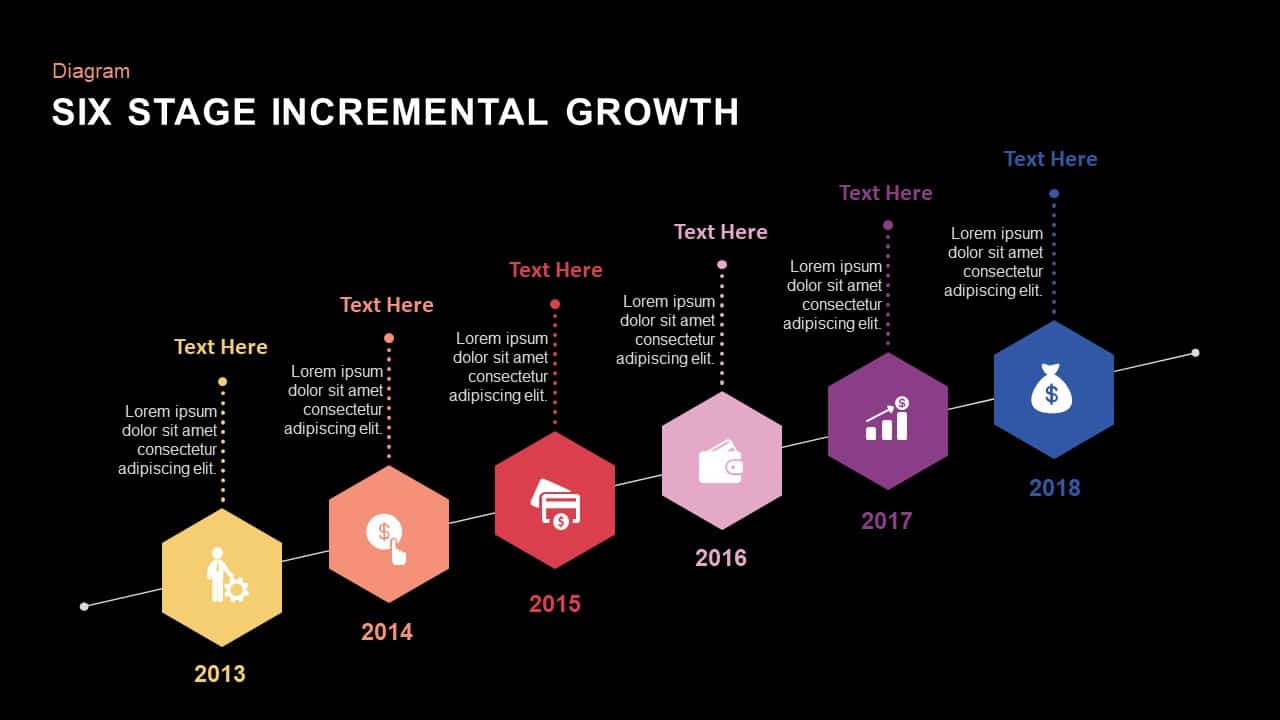
Six Stage Incremental Growth template for PowerPoint & Google Slides
Timeline
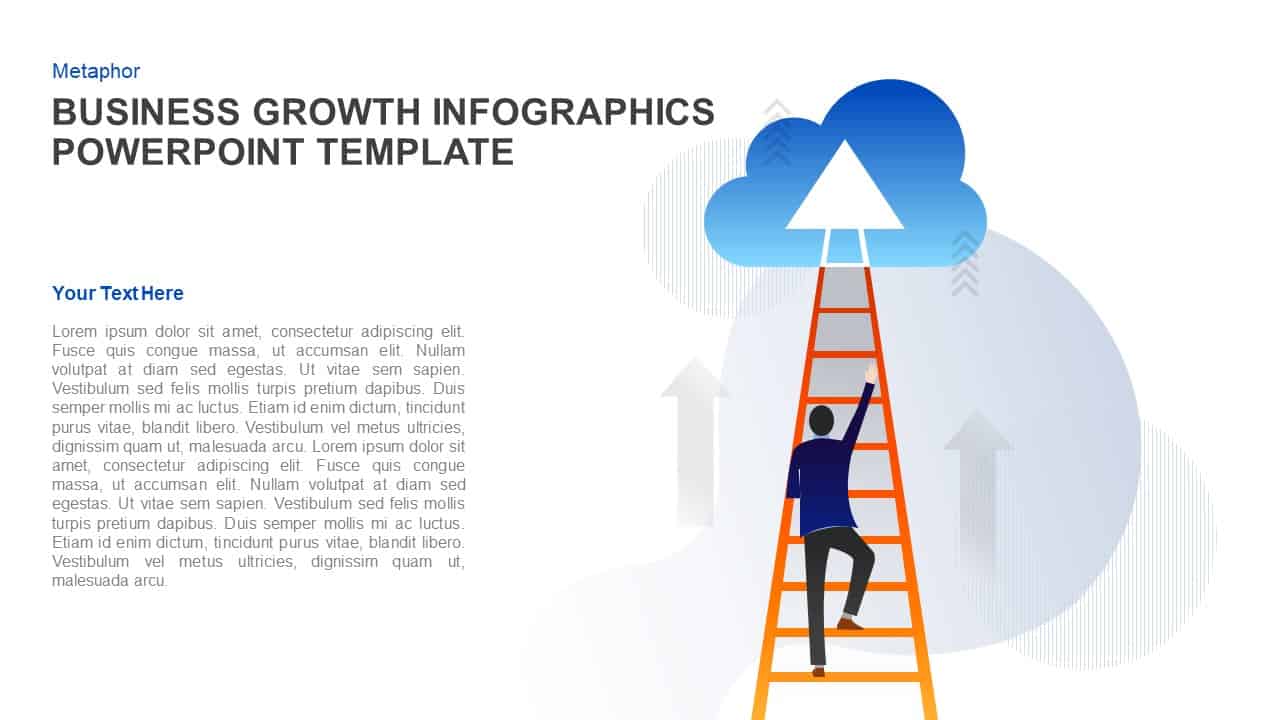
Business Growth Ladder to Cloud Metaphor Template for PowerPoint & Google Slides
Vision and Mission
Greiner Growth Model Six-Phase Diagram Template for PowerPoint & Google Slides
Business Models
Sales Growth Dashboard: KPI Gauge & Line Template for PowerPoint & Google Slides
Revenue
5-Stage Financial Growth Timeline Template for PowerPoint & Google Slides
Timeline
Data-driven GDP Growth Infographic Pack Template for PowerPoint & Google Slides
Infographics
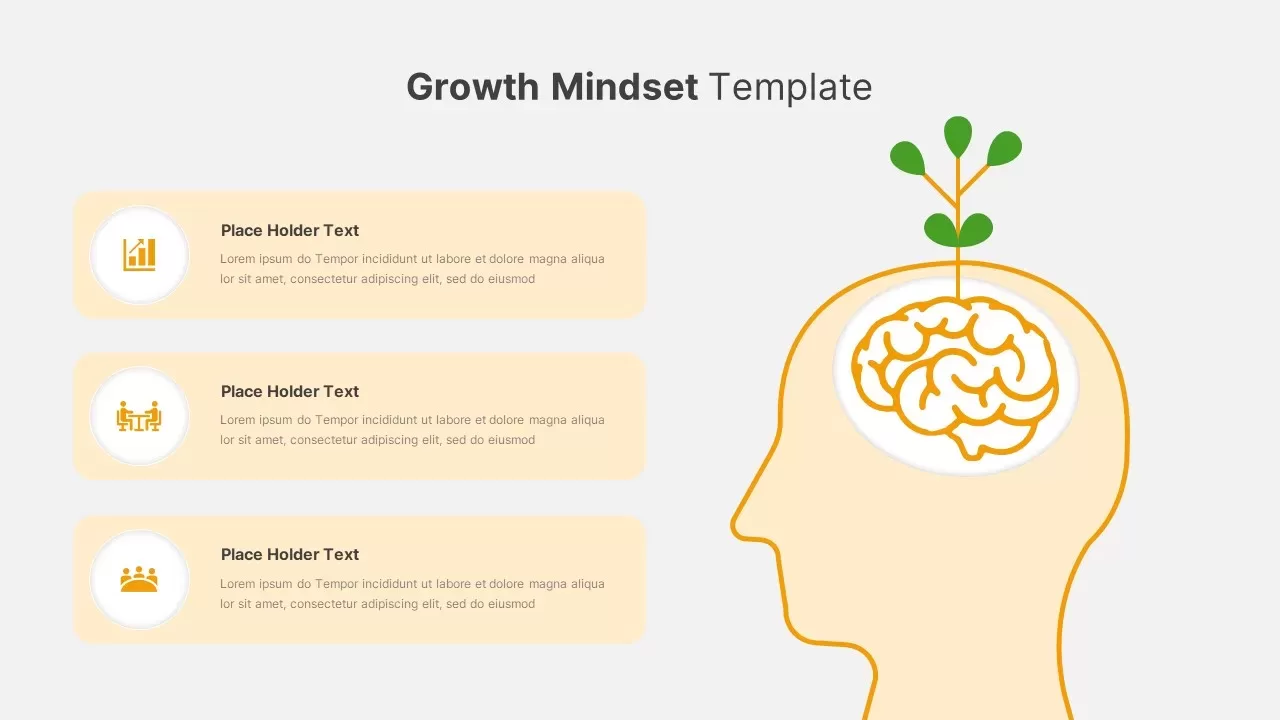
Growth Mindset Illustration Template for PowerPoint & Google Slides
Goals
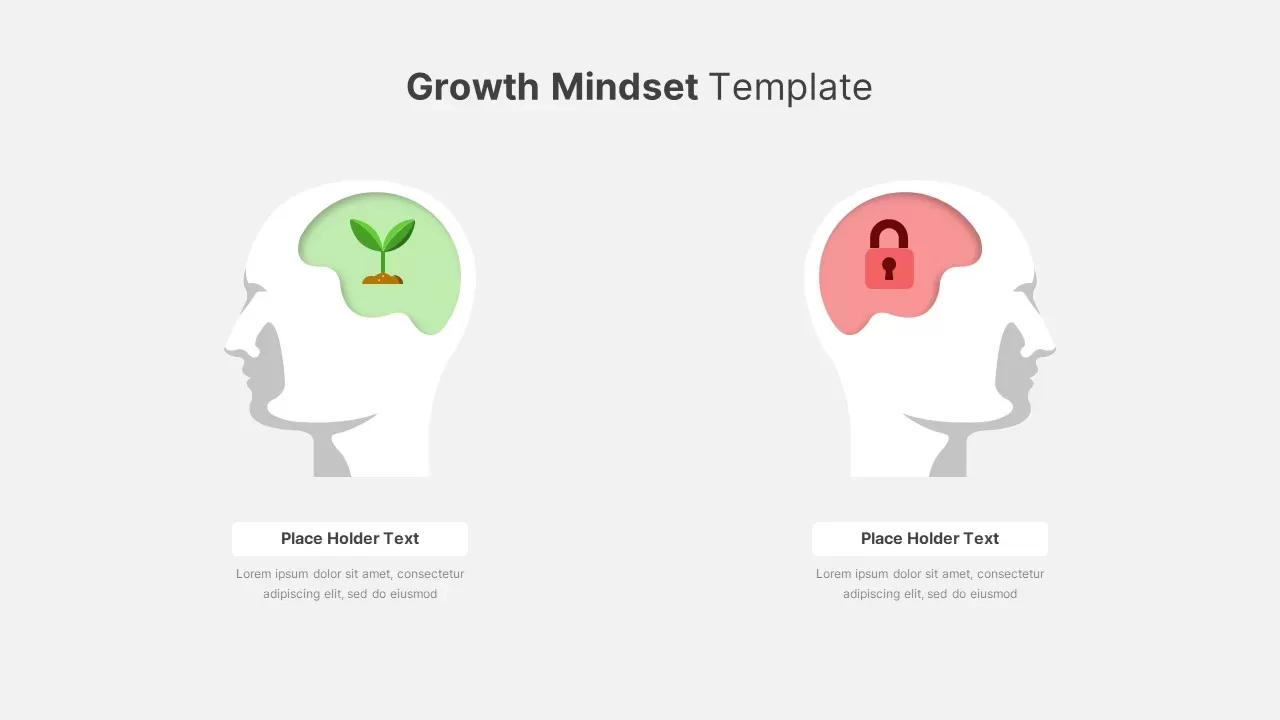
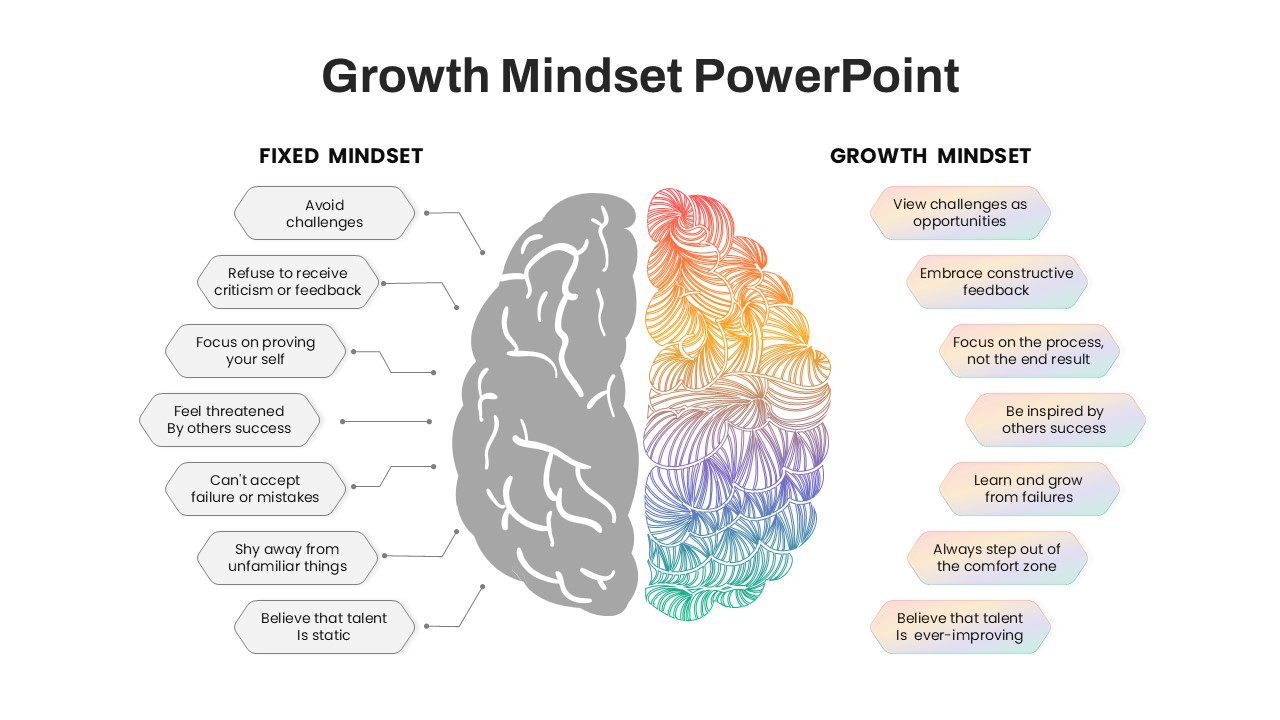
Growth vs Fixed Mindset Diagram Template for PowerPoint & Google Slides
Comparison
Abraham Maslow Growth Quote Slide Template for PowerPoint & Google Slides
Vision and Mission
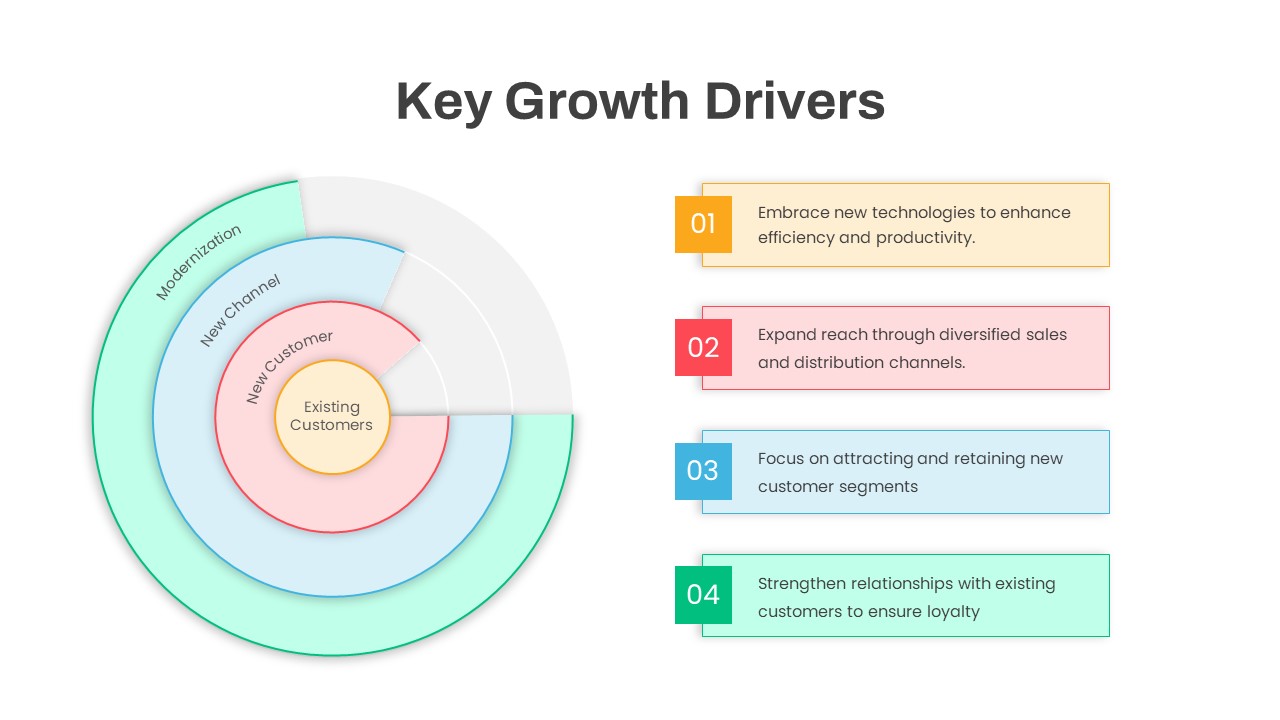
Circular Key Growth Drivers Diagram Template for PowerPoint & Google Slides
Circular
Business Growth Strategies Matrix Template for PowerPoint & Google Slides
Comparison
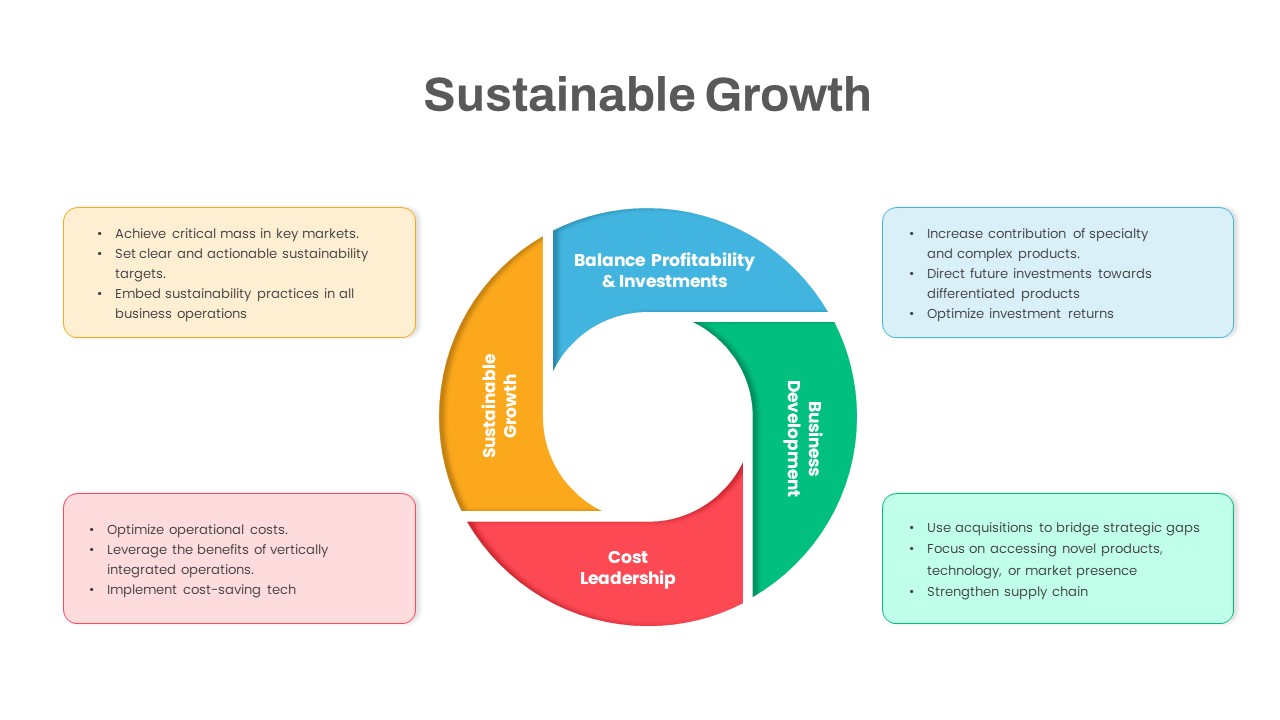
Sustainable Growth Circular Diagram Template for PowerPoint & Google Slides
Circular
Fixed vs Growth Mindset Matrix Template for PowerPoint & Google Slides
Comparison
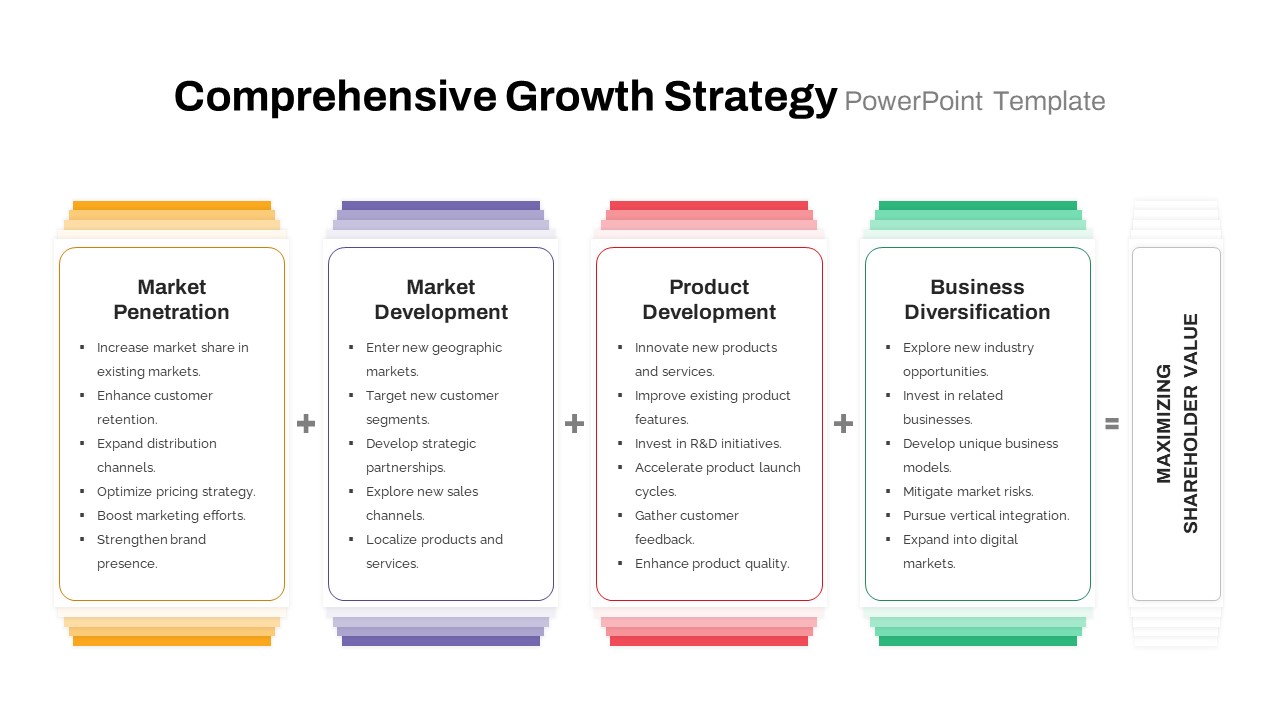
Comprehensive Growth Strategy Cards Template for PowerPoint & Google Slides
Infographics
Modern Growth Hacking Venn Diagram Template for PowerPoint & Google Slides
Circular
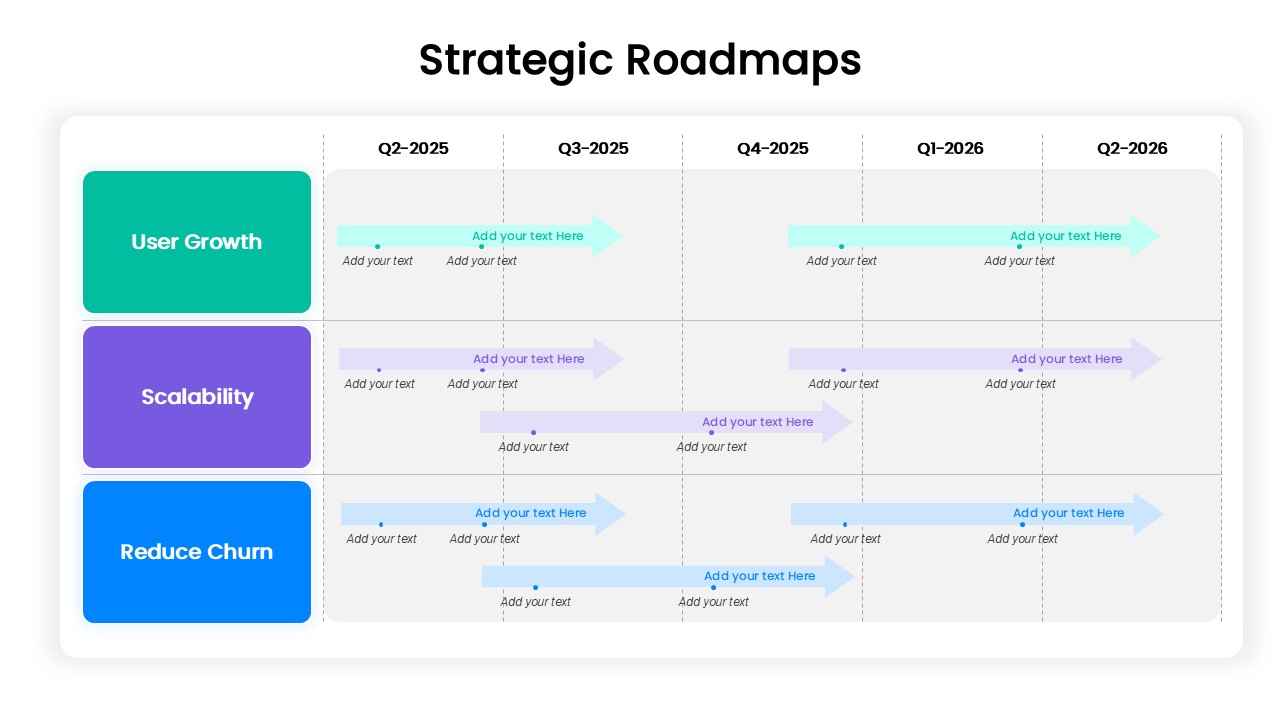
Strategic Roadmap for User Growth, Scalability, and Reducing Churn template for PowerPoint & Google Slides
Business
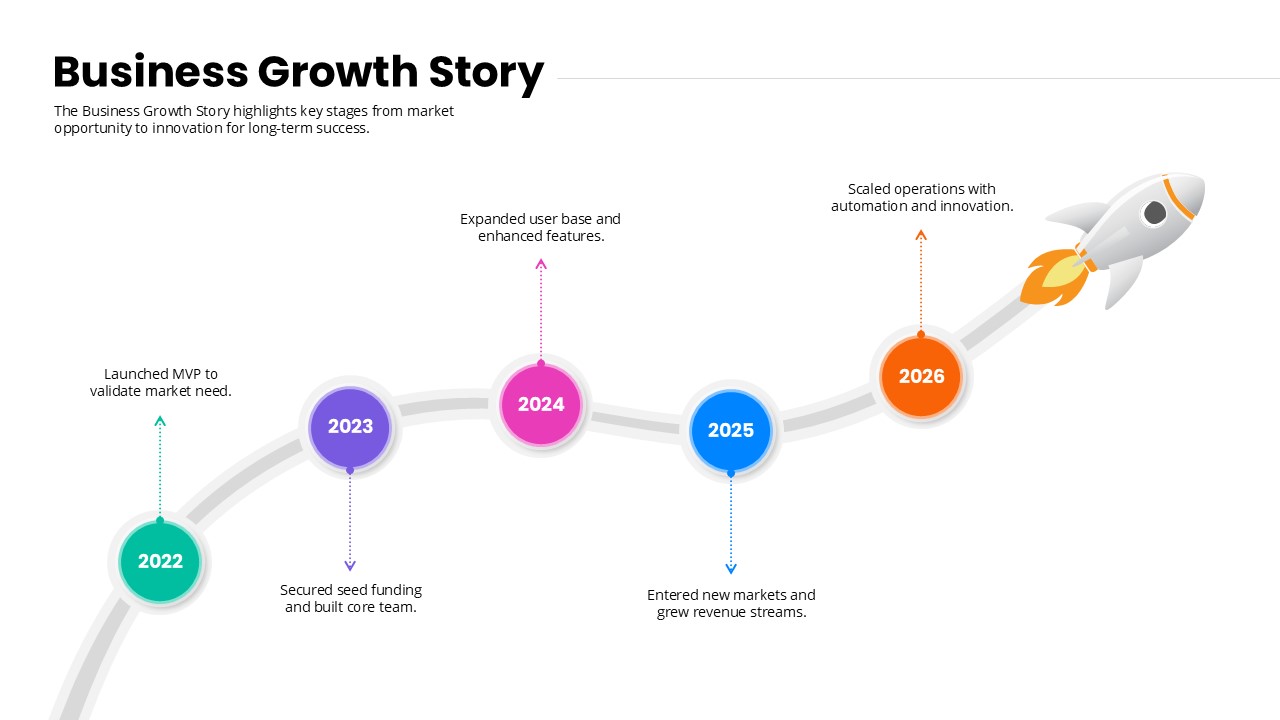
Business Growth Story timeline template for PowerPoint & Google Slides
Timeline
Personal Growth Overview Template for PowerPoint & Google Slides
Business
Ansoff Growth Matrix Template for PowerPoint & Google Slides
Business Strategy
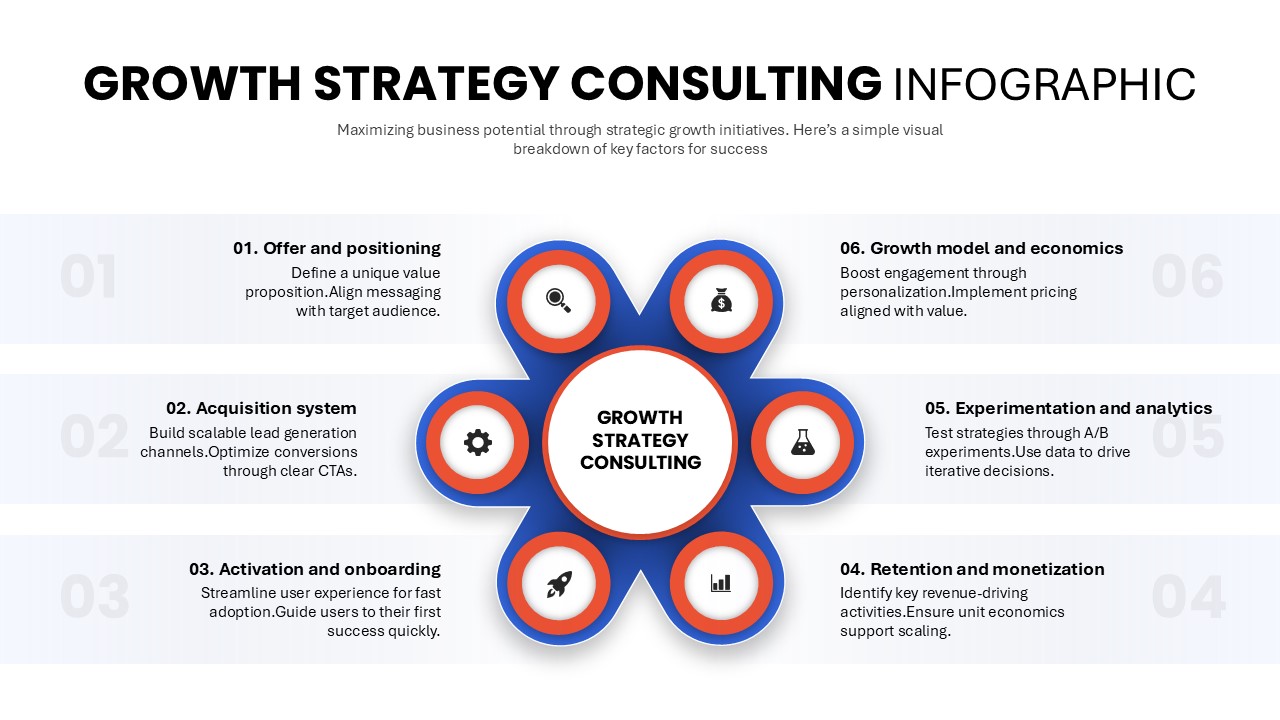
Growth Strategy Consulting Infographic Template for PowerPoint & Google Slides
Process