5 Stage Timeline Infographic Slide Template for PowerPoint & Google Slides
Description
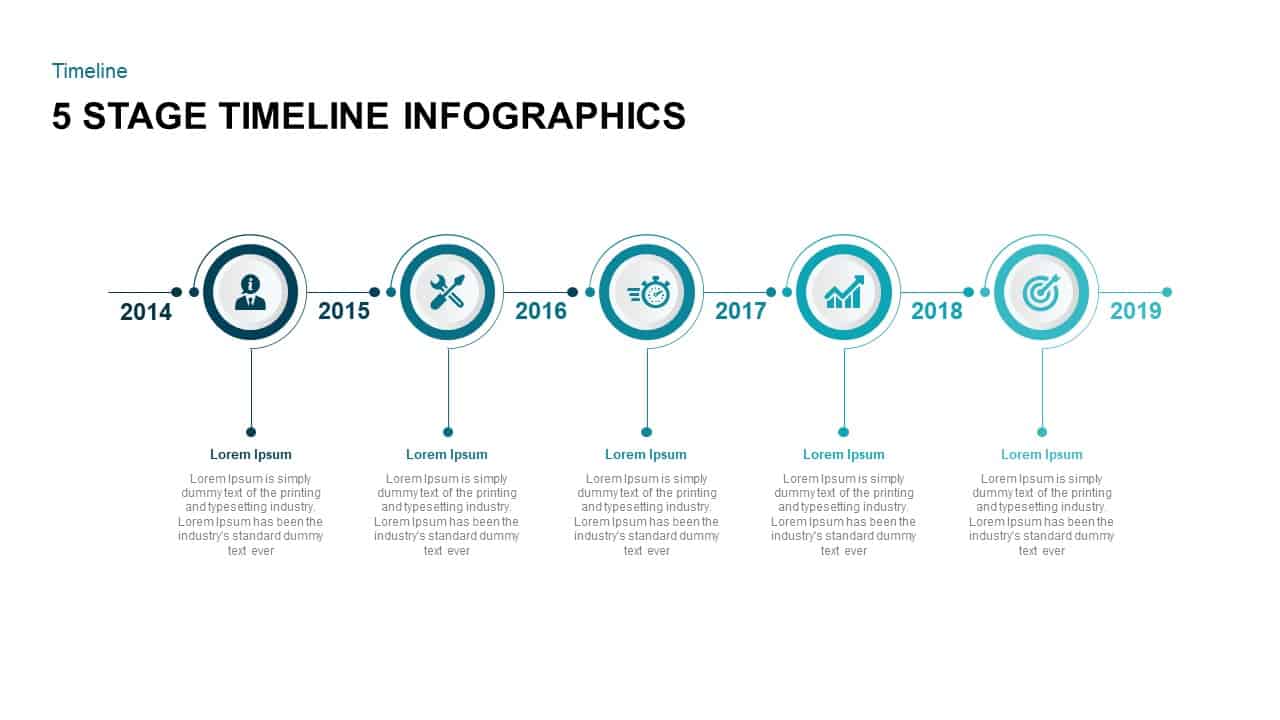
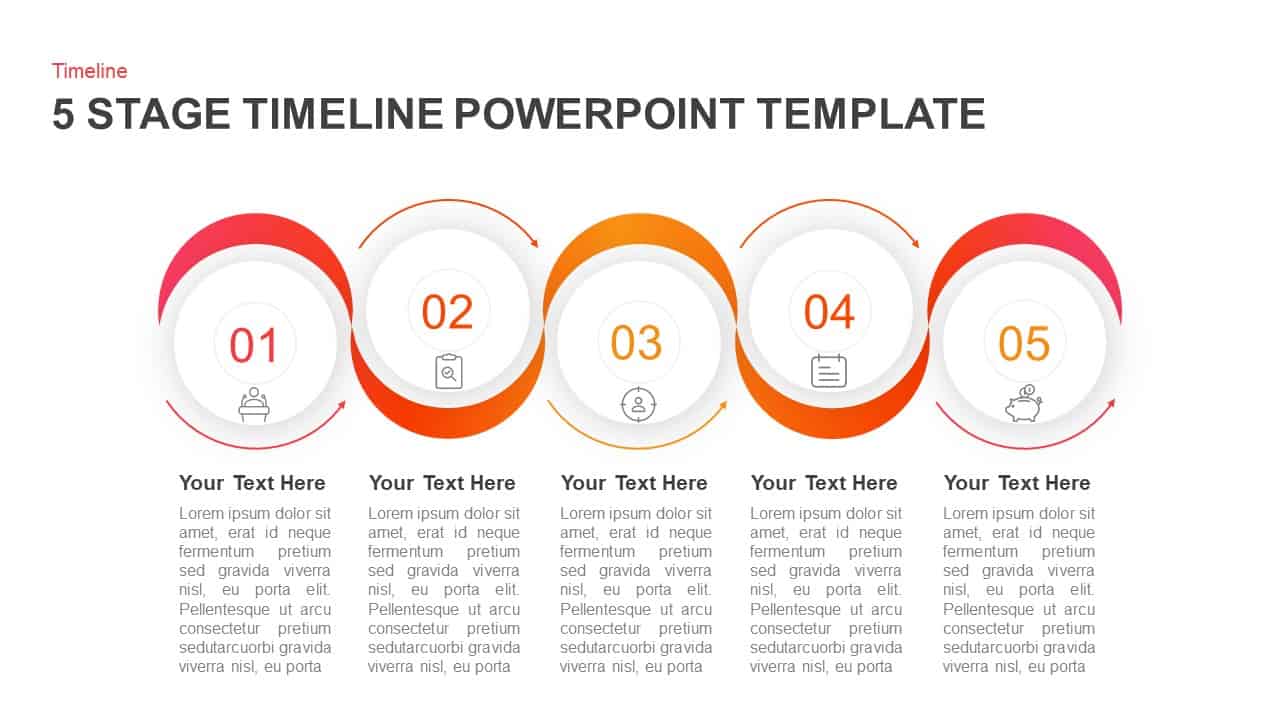
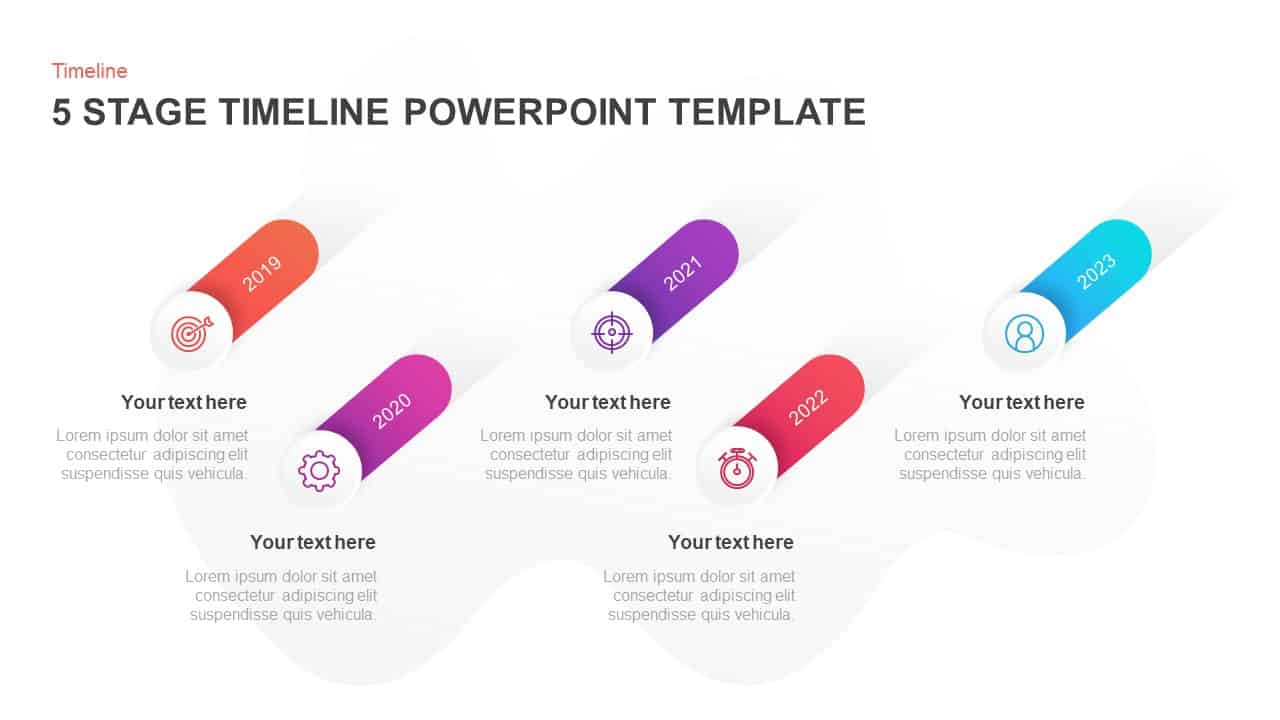
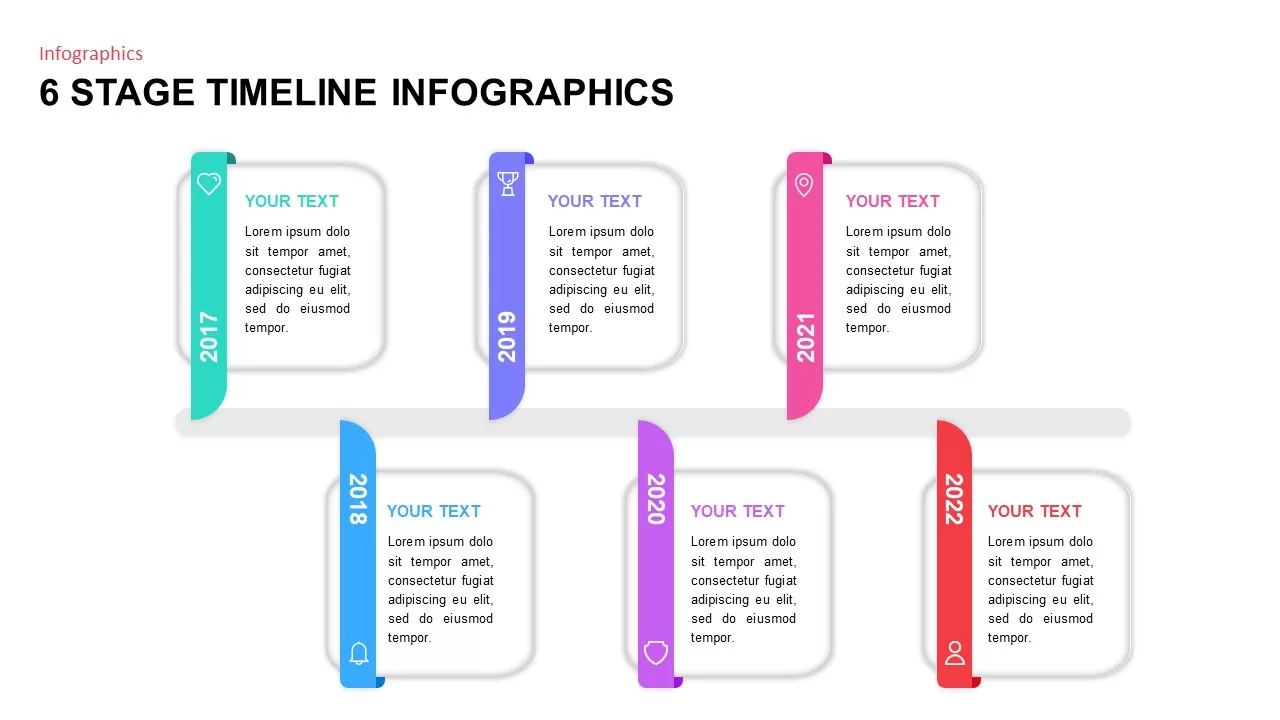
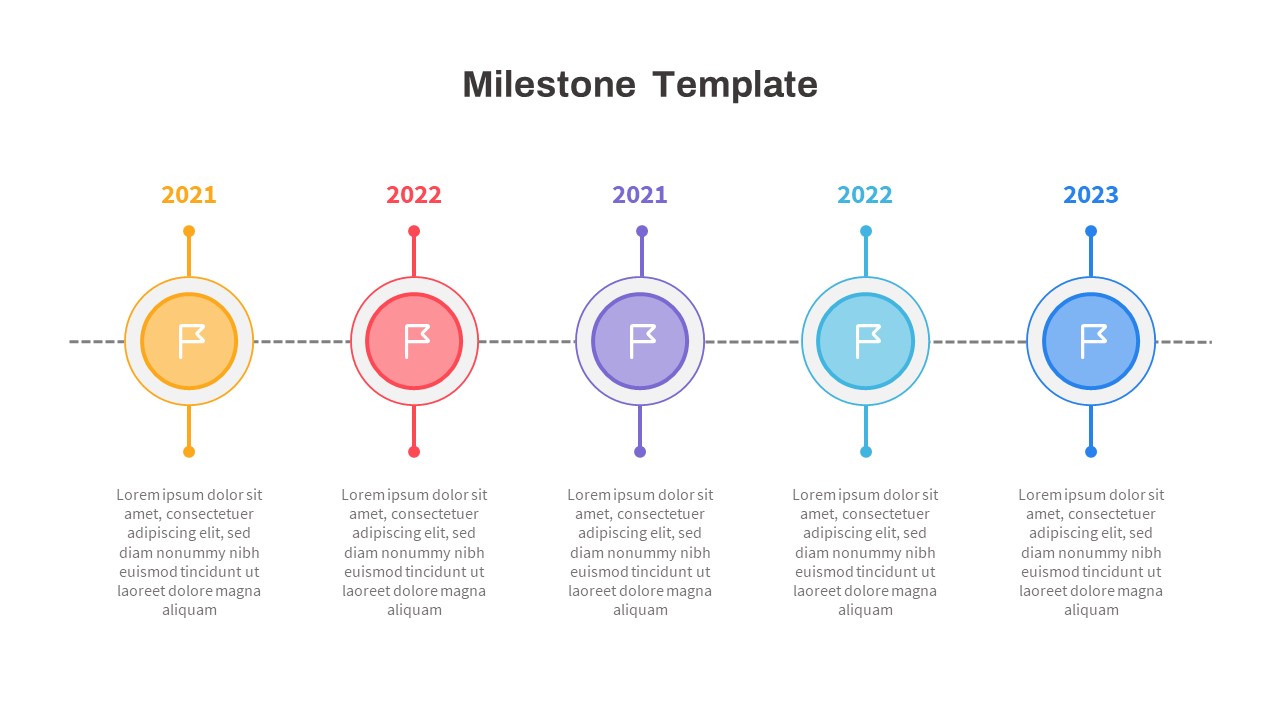
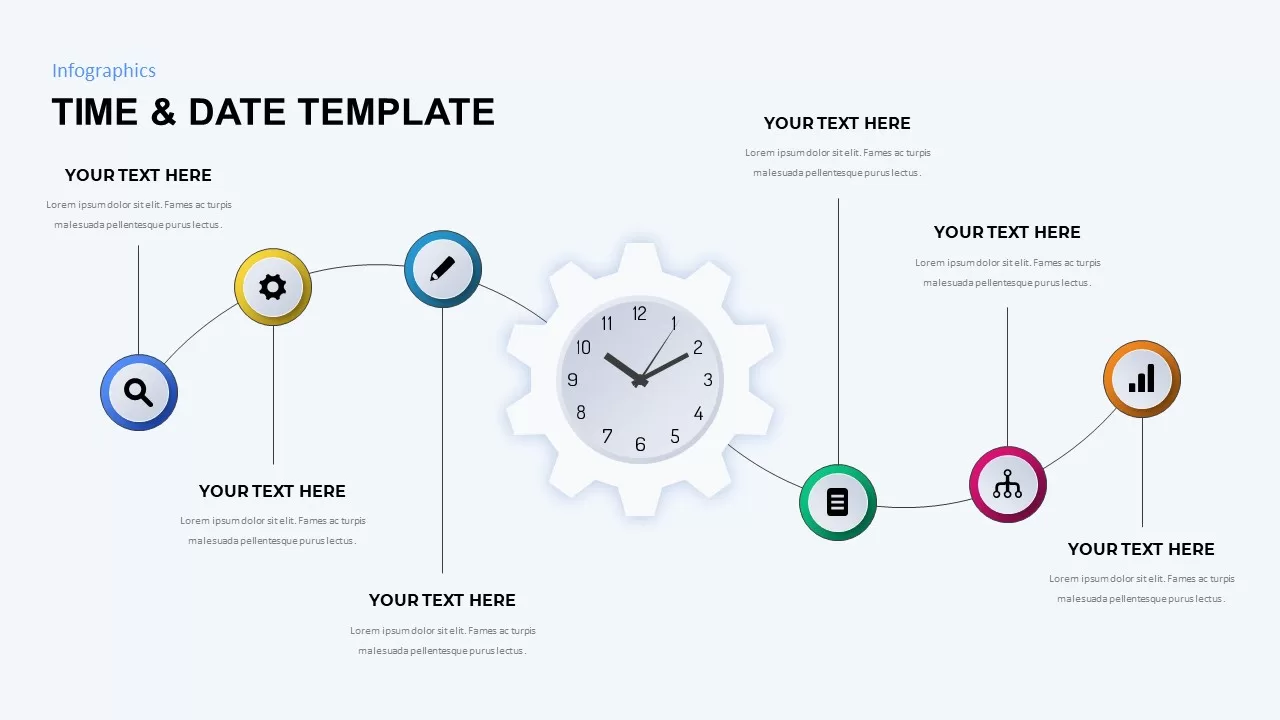
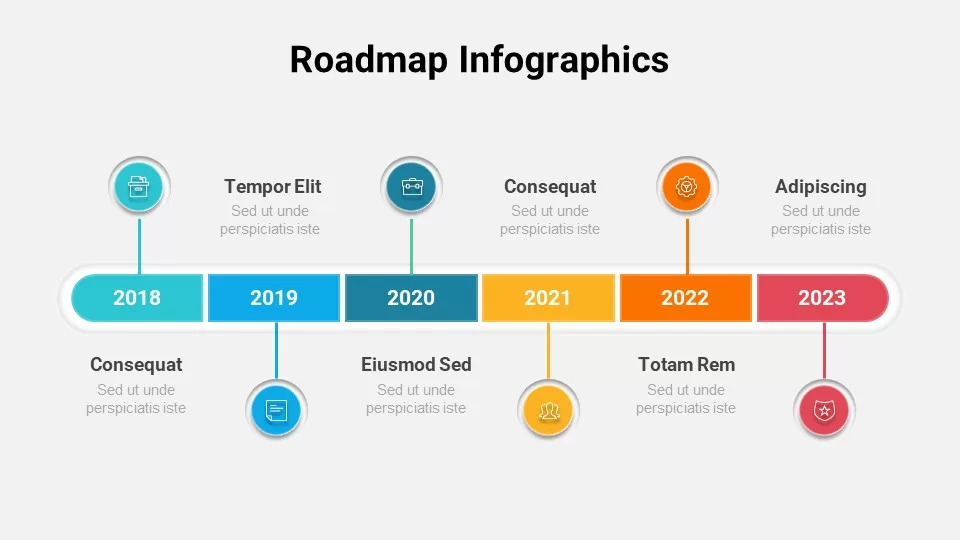
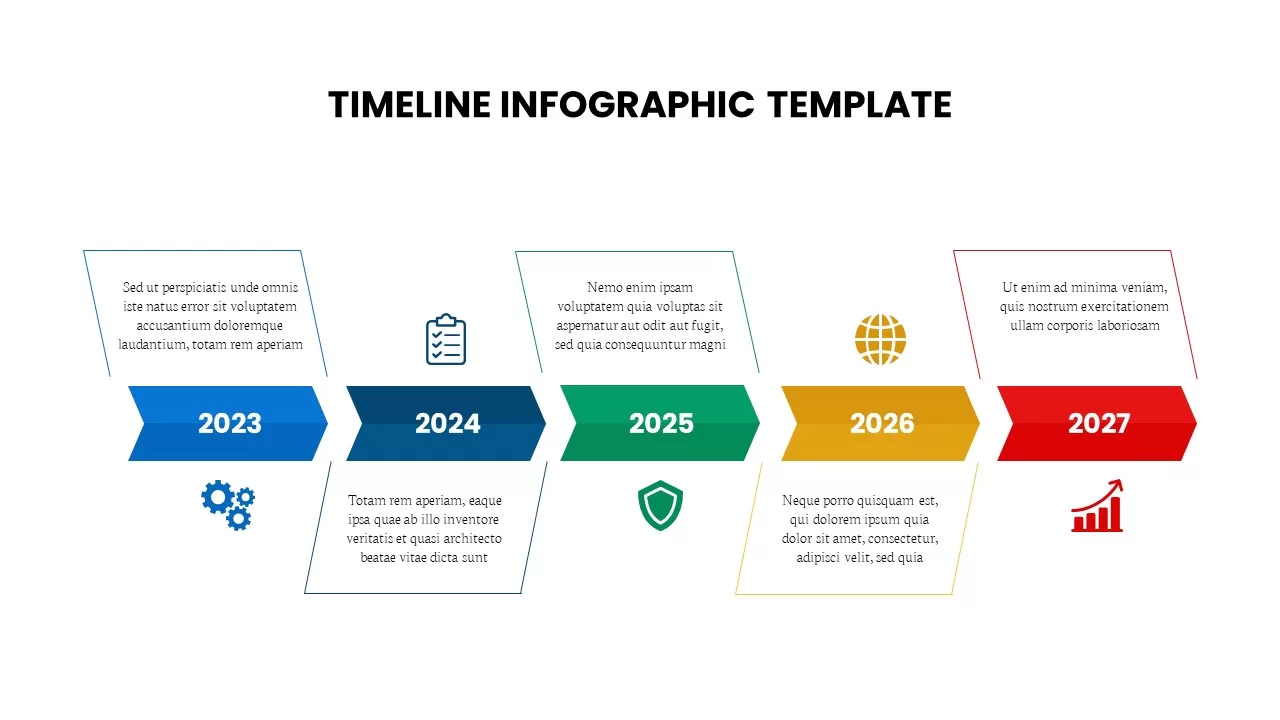
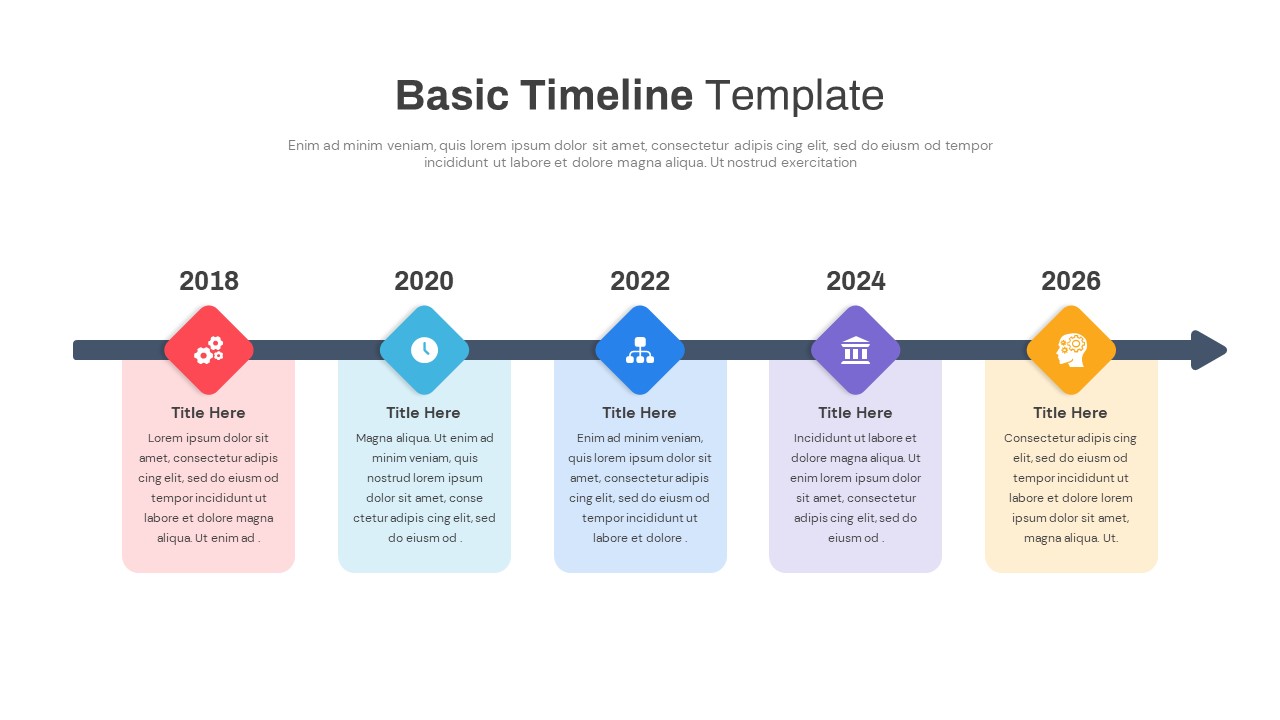
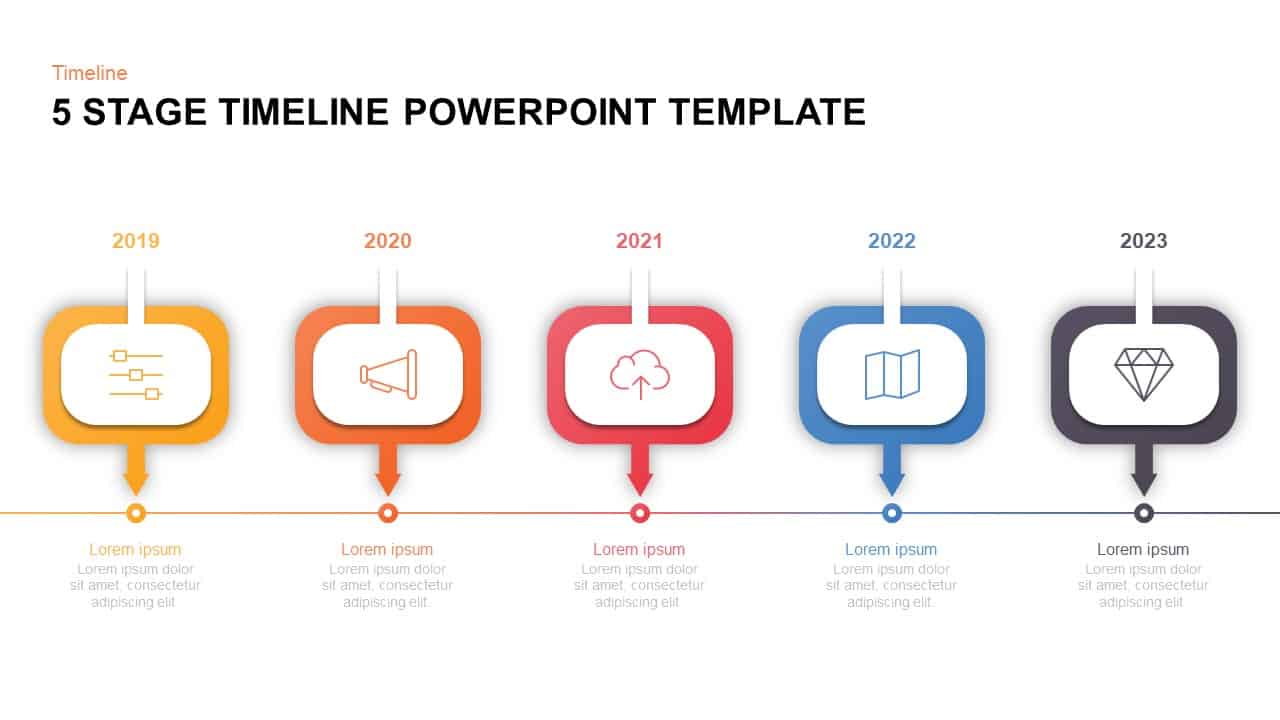
This slide showcases a vibrant five-stage timeline infographic designed to map sequential milestones from 2019 to 2023 along a horizontal axis. Each year appears in a distinct colored callout—orange for 2019, tangerine for 2020, coral for 2021, blue for 2022, and charcoal for 2023—paired with matching icons that symbolize milestones such as configuration adjustments, marketing outreach, cloud deployment, geographic mapping, and premium deliverables. Arrows connect each callout to a timeline marker, providing clear visual cues for each phase. The clean white background, crisp typography, and subtle drop shadows lend a modern, professional aesthetic that complements a variety of corporate or creative themes. Fully editable vector shapes, text placeholders, and master-slide integration let you swap icons, adjust colors, or update labels in seconds without disrupting layout consistency.
In addition to traditional timelines, you can repurpose this slide to showcase five-step processes, phase-based strategies, product launch schedules, or training program milestones. Its balanced design promotes audience retention by guiding the eye along a linear narrative, while customizable placeholders let you adapt content for marketing roadmaps, change management plans, or performance review cycles. Optimized for both PowerPoint and Google Slides, this slide maintains full-resolution clarity across devices and eliminates formatting headaches, making it ideal for boardroom presentations, stakeholder briefings, workshop facilitation, or academic lectures. The thoughtful combination of color accents, iconography, and whitespace drives focus and supports data-driven storytelling, helping you align teams around key objectives and project timelines.
Built with editable timelines and flexible layouts, this infographic supports easy timeline extension or contraction, allowing you to adjust the number of stages or modify duration labels while preserving alignment. Simply duplicate or remove the callout shapes to fit your project’s scope. The slide’s intuitive structure reduces preparation time and elevates your presentation with a polished, engaging visual narrative.
Who is it for
This template is ideal for project managers, product managers, operations teams, business analysts, marketing directors, consultants, and educators who need to communicate sequential milestones, strategic roadmaps, or historical progressions with clarity and visual impact.
Other Uses
Beyond project timelines, repurpose this infographic for five-phase roadmaps, product development cycles, marketing campaign schedules, training program agendas, or quarterly business reviews. Adjust labels and icons to suit use cases like launch planning, budget forecasting, risk assessments, or organizational change timelines.
Login to download this file

Item ID
SB01323
Related Templates

5-Stage Timeline Infographic Slide Template for PowerPoint & Google Slides
Timeline
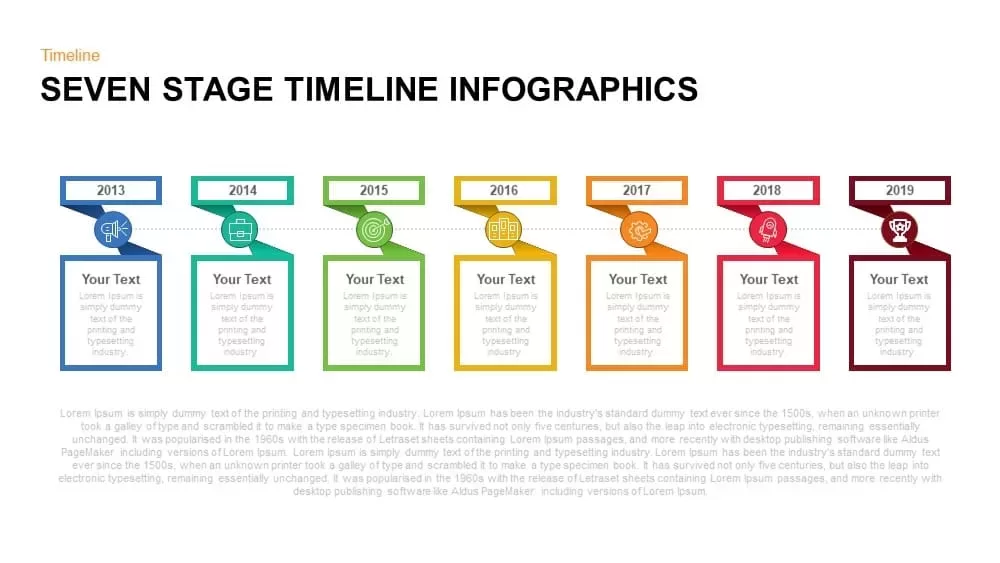
7-Stage Colorful Timeline Infographic Template for PowerPoint & Google Slides
Timeline
Three Four Five Stage Timeline Infographic Template for PowerPoint & Google Slides
Timeline
Six-Stage Hexagon Timeline Infographic Template for PowerPoint & Google Slides
Timeline

Timeline Infographic Design Seven Stage template for PowerPoint & Google Slides
Timeline
Animated 5-Stage Puzzle Timeline Infographic Template for PowerPoint & Google Slides
Timeline
5 Stage Circular Timeline Infographic Template for PowerPoint & Google Slides
Timeline
Six-Stage Timeline Infographic Template for PowerPoint & Google Slides
Timeline
Seven-Stage Hexagon Timeline Infographic Template for PowerPoint & Google Slides
Timeline
Six-Stage Road Map Infographic Timeline Template for PowerPoint & Google Slides
Roadmap
Six-Stage Timeline Infographics Slide Template for PowerPoint & Google Slides
Timeline
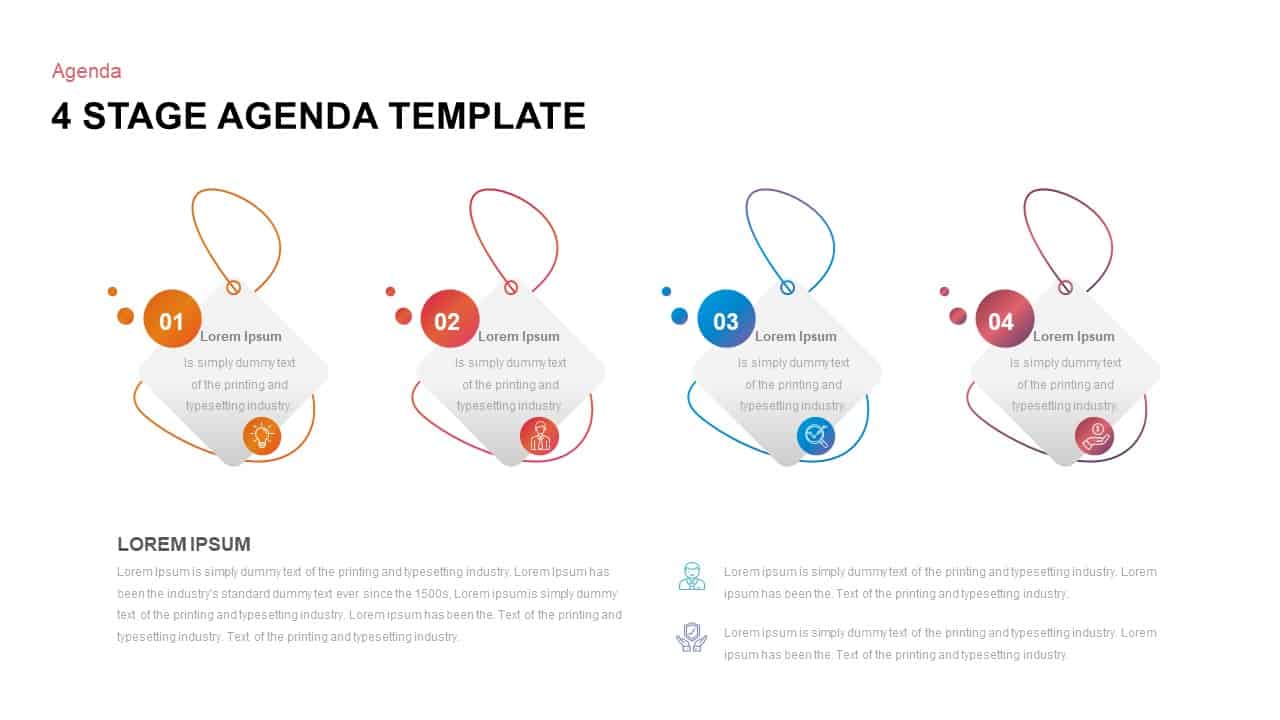
Four-Stage Agenda Infographic Slide Template for PowerPoint & Google Slides
Agenda
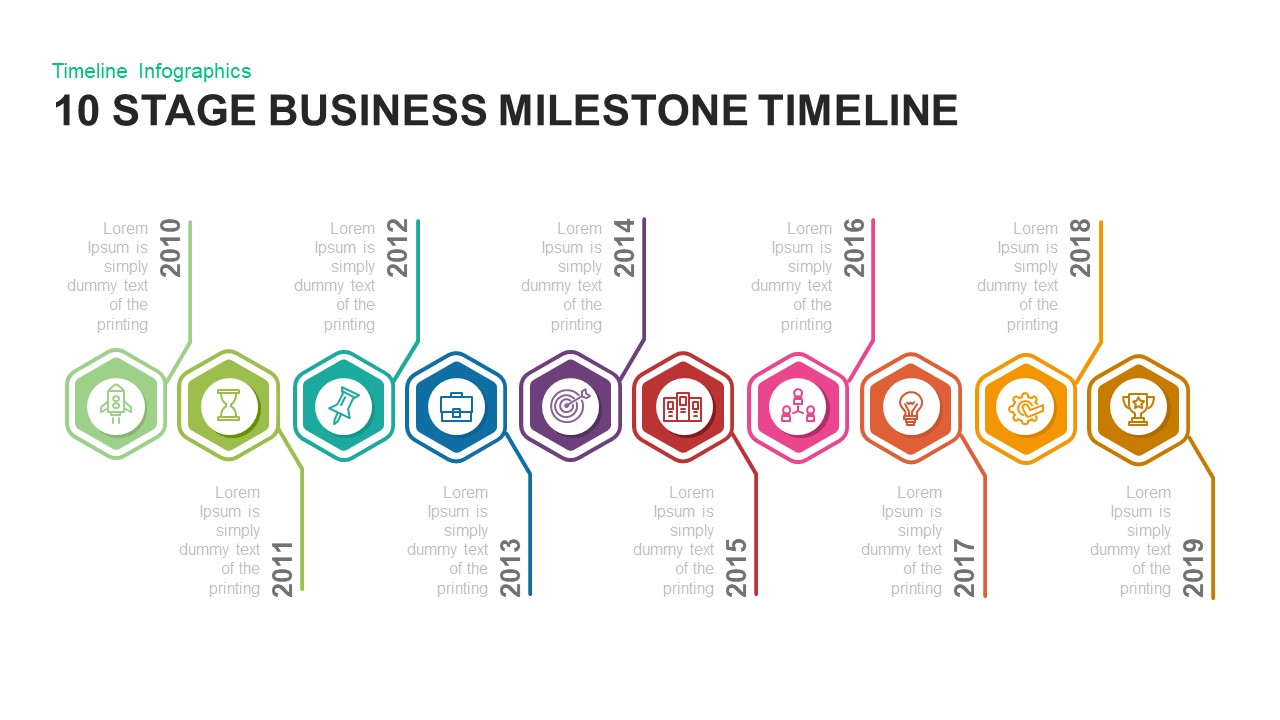
10 Stage Business Milestone Timeline PowerPoint Template for PowerPoint & Google Slides
Timeline
Multi-Stage Timeline Infographics Template for PowerPoint & Google Slides
Timeline
Five-Stage Arrow Infographics Timeline Template for PowerPoint & Google Slides
Arrow
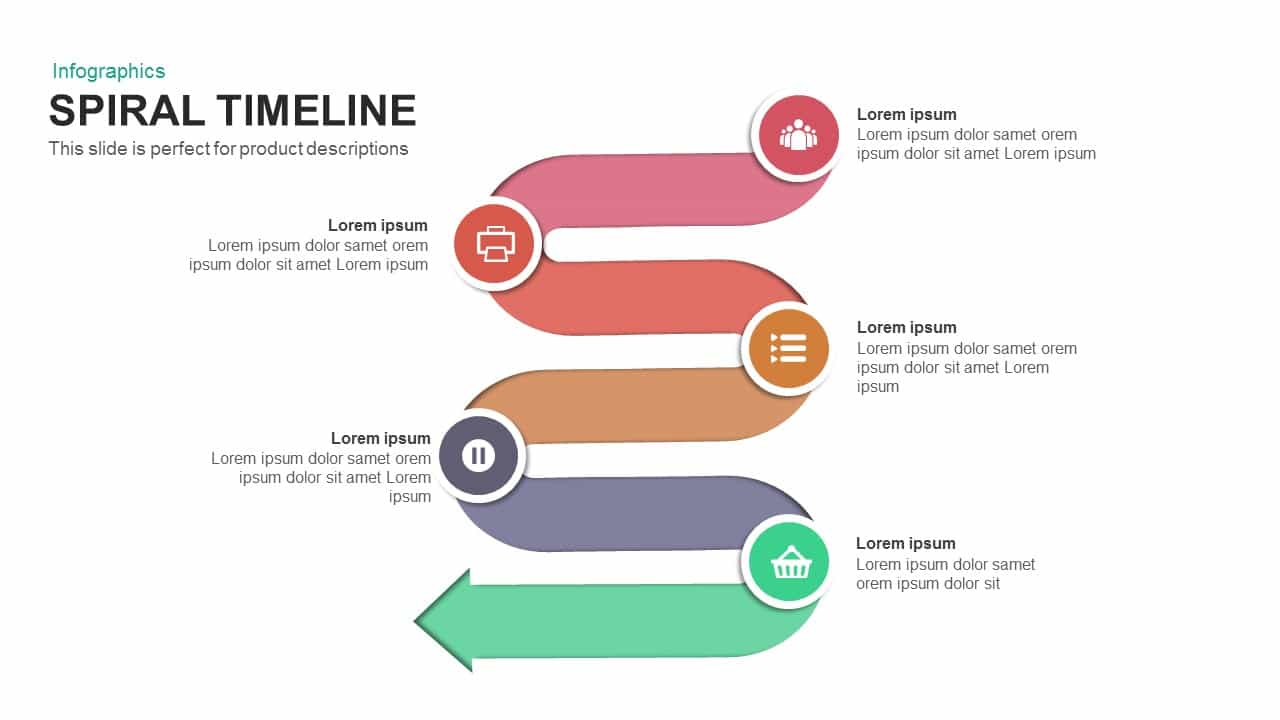
Six-Stage Colorful Spiral Timeline Template for PowerPoint & Google Slides
Timeline
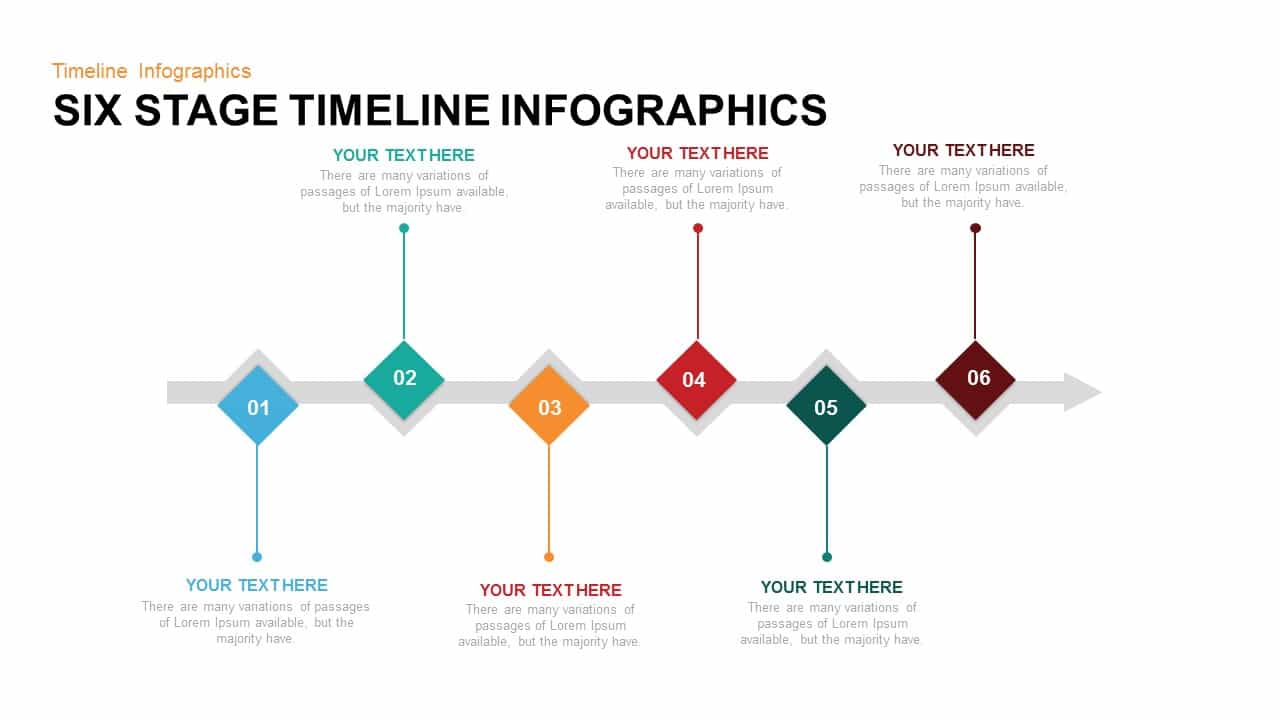
Six Stage Timeline Infographics Template for PowerPoint & Google Slides
Timeline

Seven-Stage Timeline Infographics Template for PowerPoint & Google Slides
Timeline
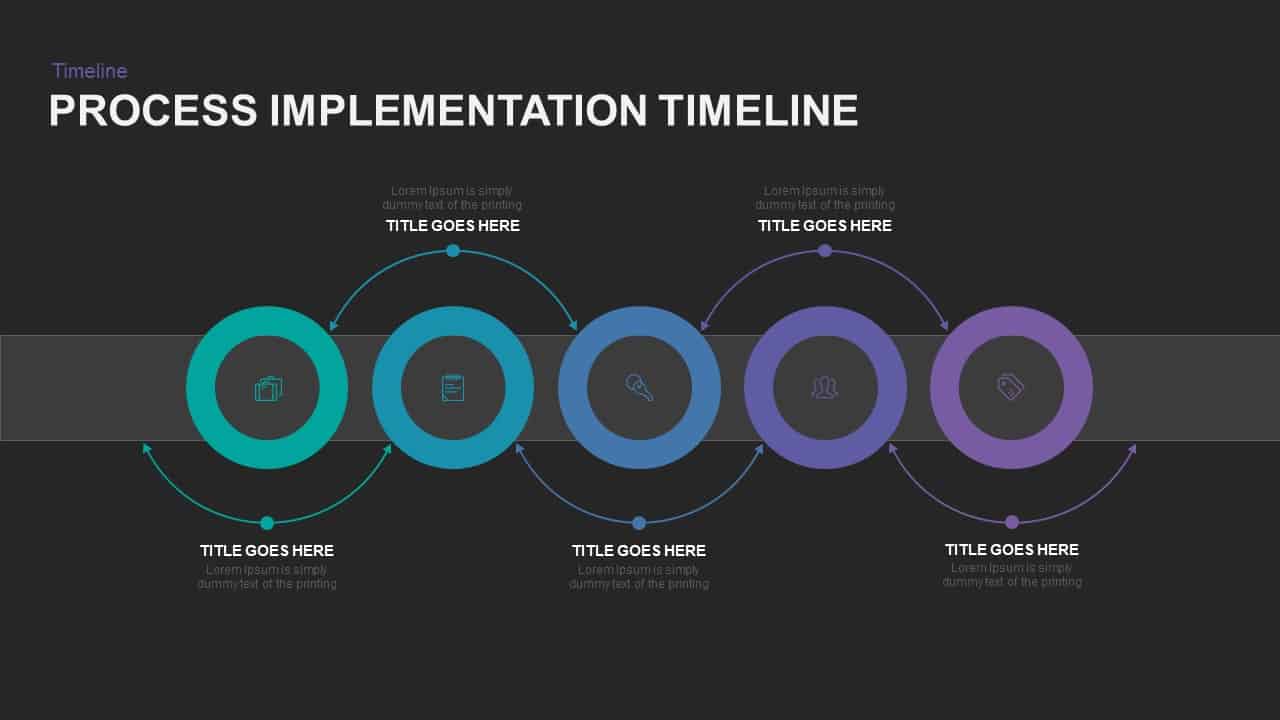
5-Stage Process Implementation Timeline Template for PowerPoint & Google Slides
Timeline
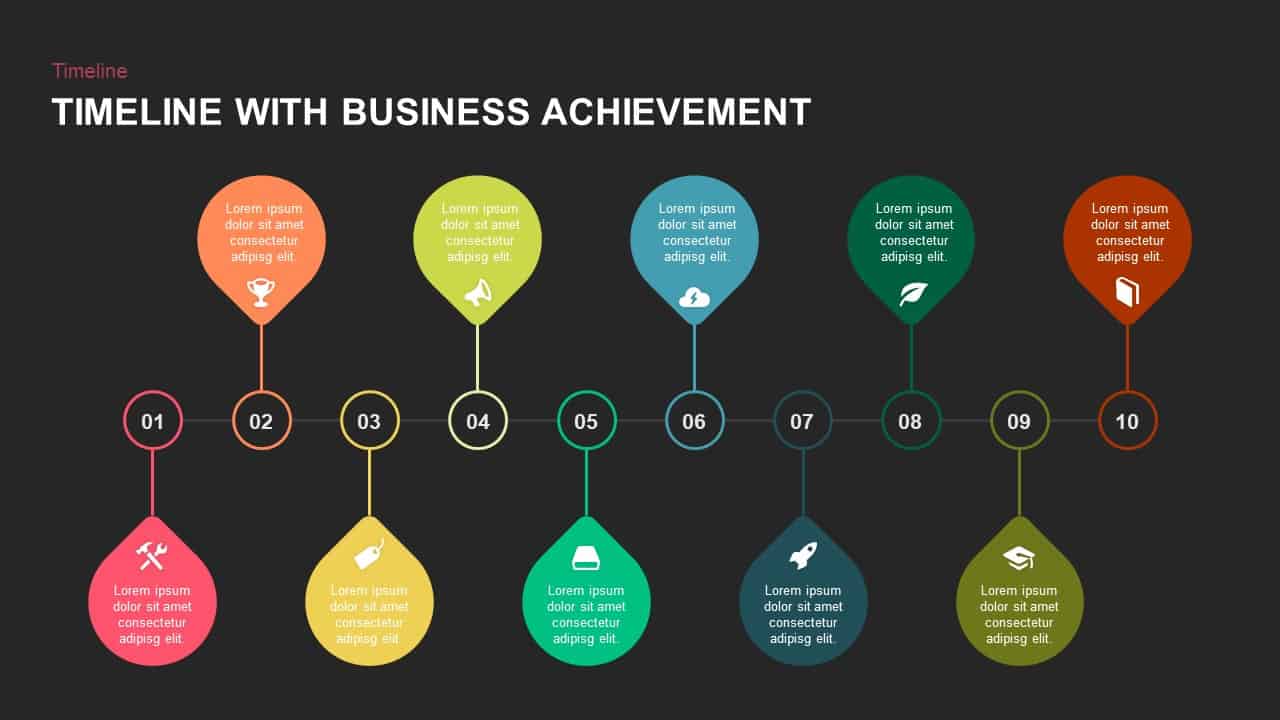
10-Stage Timeline with Business Achievements Template for PowerPoint & Google Slides
Timeline
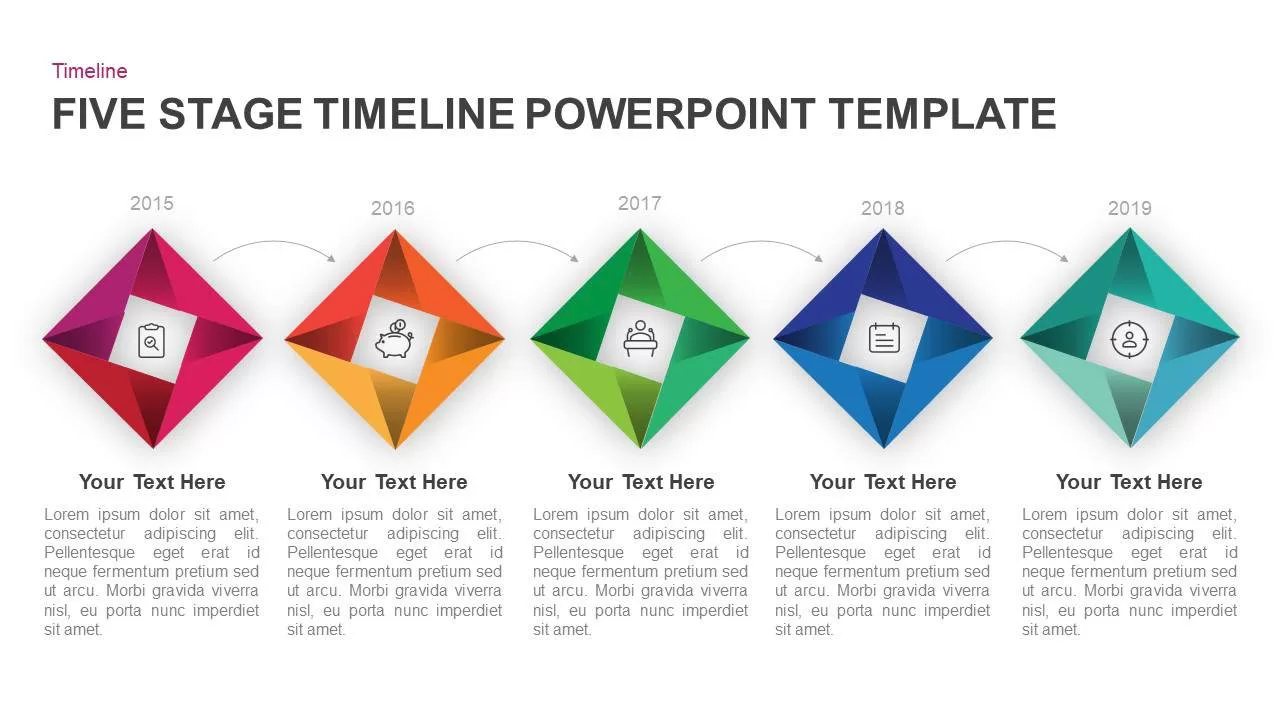
Five-Stage Diamond Timeline Chart Template for PowerPoint & Google Slides
Timeline
5 Stage Agenda Timeline Carousel Template for PowerPoint & Google Slides
Agenda
5-Stage Hot-Air Balloon Timeline Template for PowerPoint & Google Slides
Timeline
Six-Stage Arrow Timeline Diagram Template for PowerPoint & Google Slides
Timeline
Five-Stage Slanted Timeline Diagram Template for PowerPoint & Google Slides
Timeline
Five-Stage Sequential Tags Timeline Template for PowerPoint & Google Slides
Timeline
Six Stage Agenda Timeline Diagram template for PowerPoint & Google Slides
Agenda
5-Stage Financial Growth Timeline Template for PowerPoint & Google Slides
Timeline
Clock-Timeline Nine-Stage Agenda Template for PowerPoint & Google Slides
Agenda
6 Stage Timeline Infographics template for PowerPoint & Google Slides
Timeline
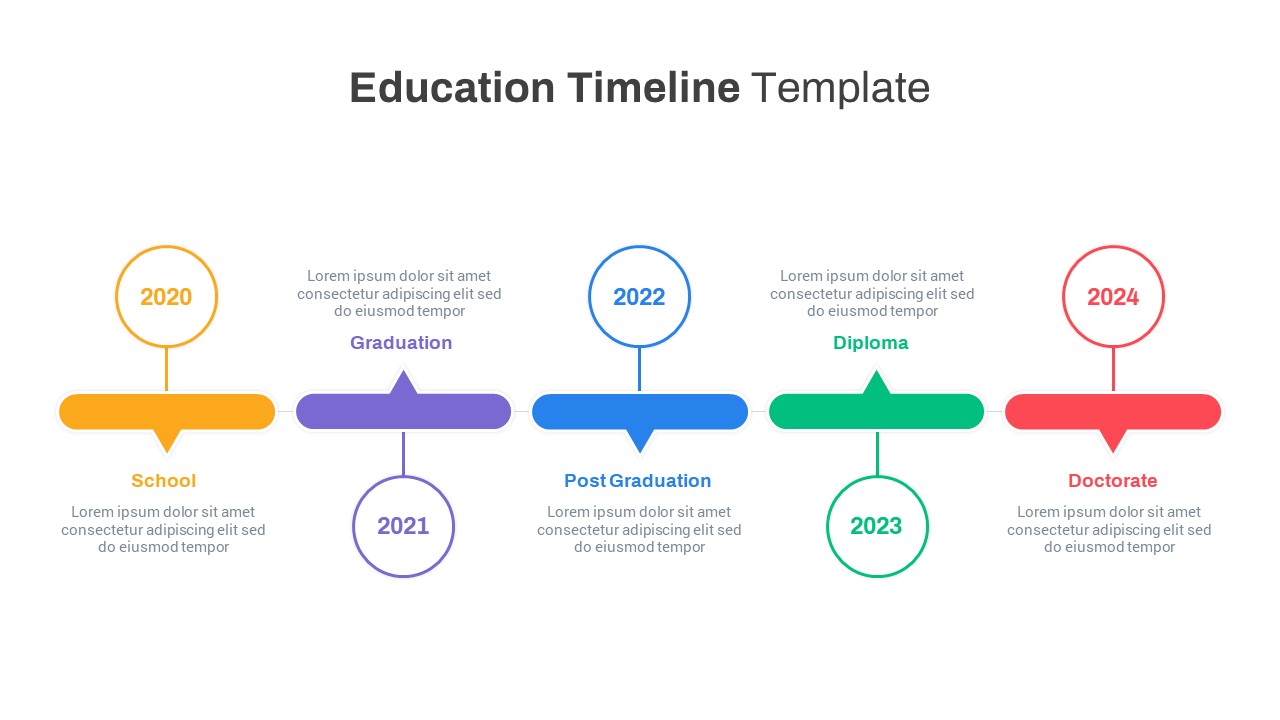
Colorful Five-Stage Education Timeline Template for PowerPoint & Google Slides
Timeline
Free Multicolor Five-Stage Milestone Timeline Template for PowerPoint & Google Slides
Timeline
Free
Six Stage Timeline Diagram for PowerPoint & Google Slides
Timeline
Stage Infographic template for PowerPoint & Google Slides
Process
6 Stage Process Diagram Infographic Template for PowerPoint & Google Slides
Process

Tree Growth Stage Infographic Template for PowerPoint & Google Slides
Timeline
Five-Stage People Infographic Chart template for PowerPoint & Google Slides
Process
Four-Stage Linear Infographic Diagram Template for PowerPoint & Google Slides
Process
Eight-Stage Circular Process Infographic Template for PowerPoint & Google Slides
Circular
Colorful Four-Stage Infographic Process Template for PowerPoint & Google Slides
Process
Seven-Stage Circular Infographic Template for PowerPoint & Google Slides
Circular
Five Stage Process Diagram Infographic Template for PowerPoint & Google Slides
Process
Five-Stage Growth Arrow Infographic Template for PowerPoint & Google Slides
Arrow
Seven Stage Semicircle Infographic Template for PowerPoint & Google Slides
Process
6-Stage Funnel Diagram Infographic Template for PowerPoint & Google Slides
Funnel
Four-Stage Business Success Infographic Template for PowerPoint & Google Slides
Process
Five-Stage Circular Infographic Diagram Template for PowerPoint & Google Slides
Process
Four-Stage Circular Diagram Infographic Template for PowerPoint & Google Slides
Circular
5 Stage Cone Agenda Infographic Template for PowerPoint & Google Slides
Agenda
Gradient 5-Stage Funnel Infographic Template for PowerPoint & Google Slides
Funnel
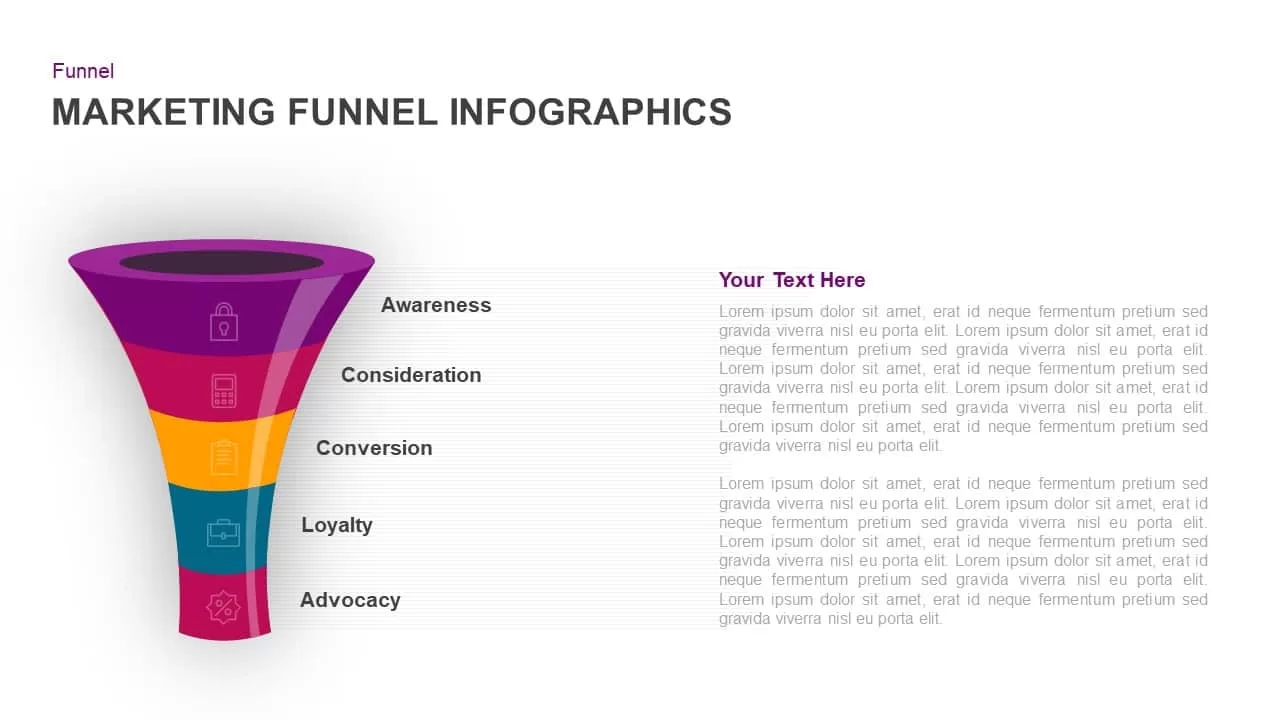
Five-Stage Marketing Funnel Infographic Template for PowerPoint & Google Slides
Funnel
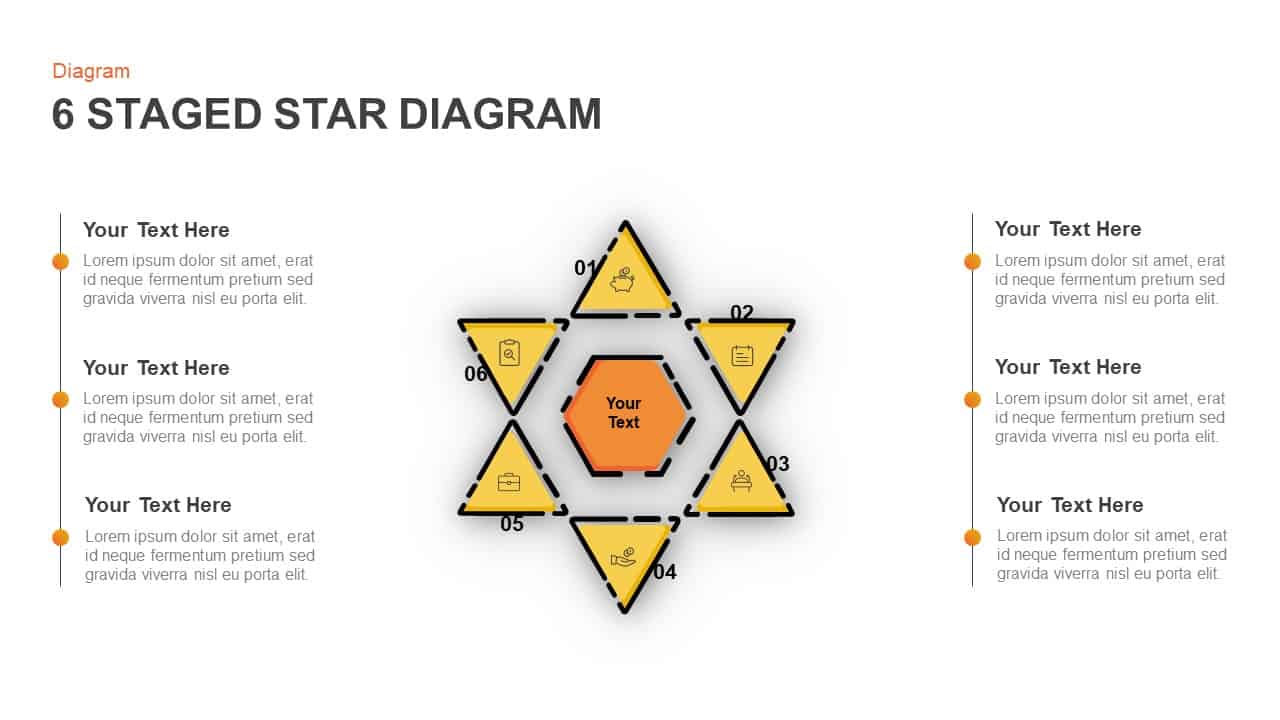
Six-Stage Star Diagram Infographic Template for PowerPoint & Google Slides
Process
Four-Stage Funnel Diagram Infographic Template for PowerPoint & Google Slides
Funnel
Four-Stage Funnel Diagram Infographic Template for PowerPoint & Google Slides
Funnel
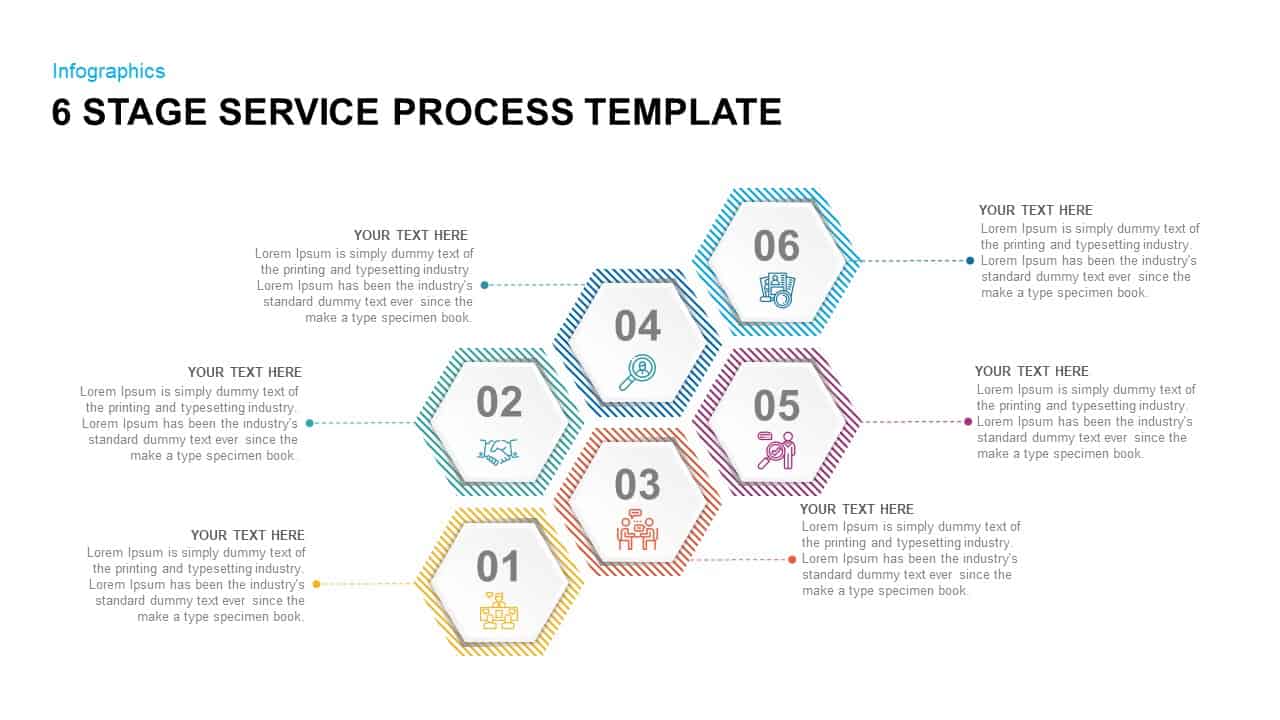
6 Stage Service Process Infographic Template for PowerPoint & Google Slides
Process
Four-Stage Circle Arrow Infographic Template for PowerPoint & Google Slides
Circular
Five-Stage Circular Arrow Infographic Template for PowerPoint & Google Slides
Circular
Four-Stage Circle Arrow Infographic Template for PowerPoint & Google Slides
Circular
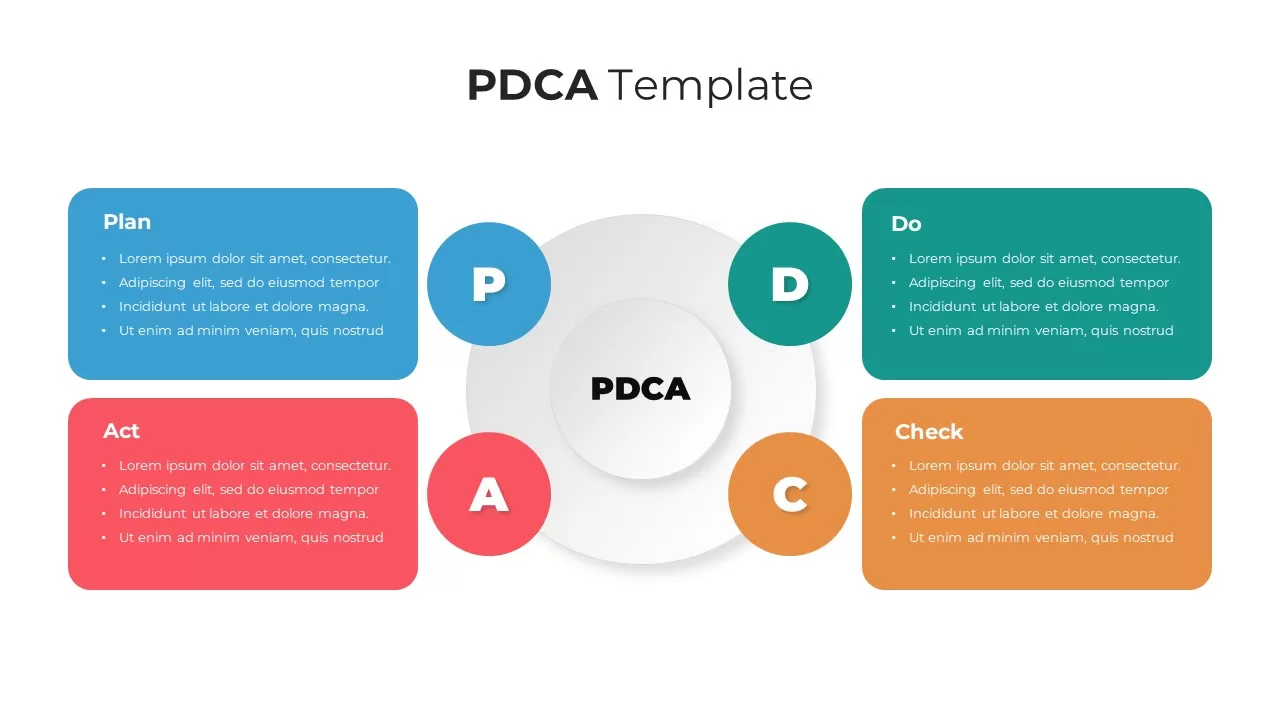
PDCA Four-Stage Cycle Infographic Template for PowerPoint & Google Slides
Process
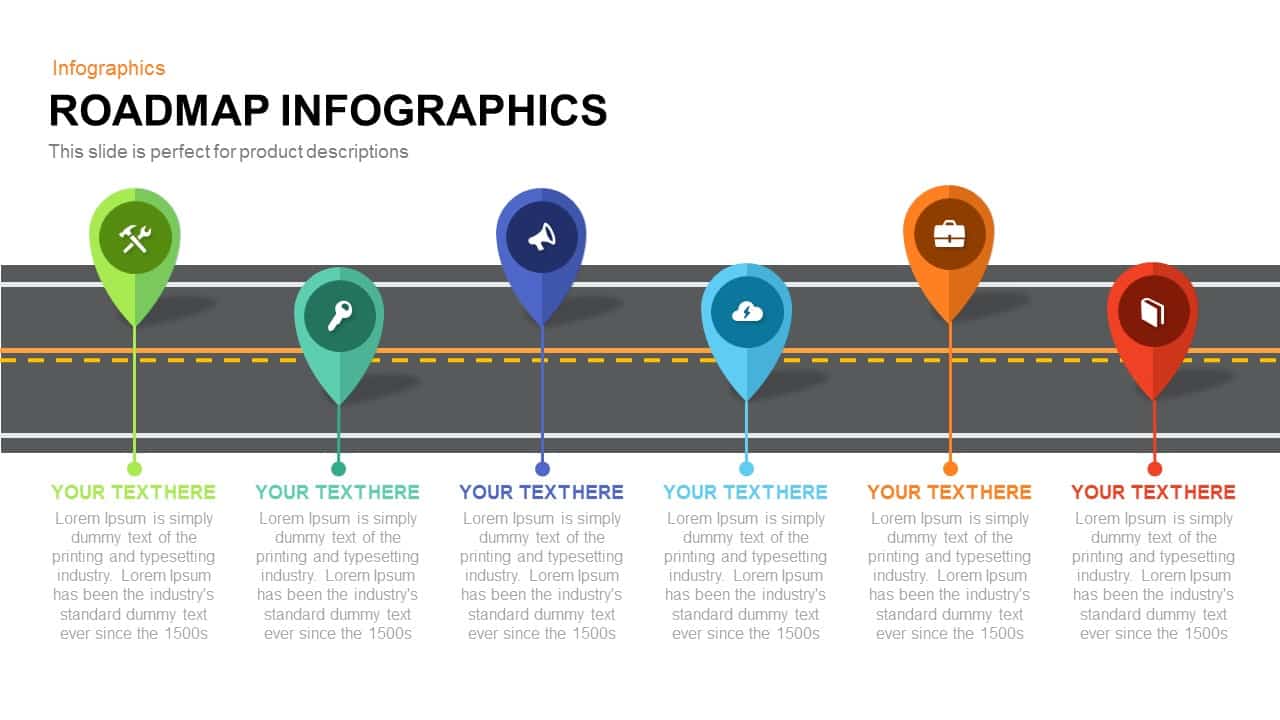
Roadmap Infographic Timeline Slide Template for PowerPoint & Google Slides
Roadmap
Arrow Timeline Infographic Slide Template for PowerPoint & Google Slides
Timeline
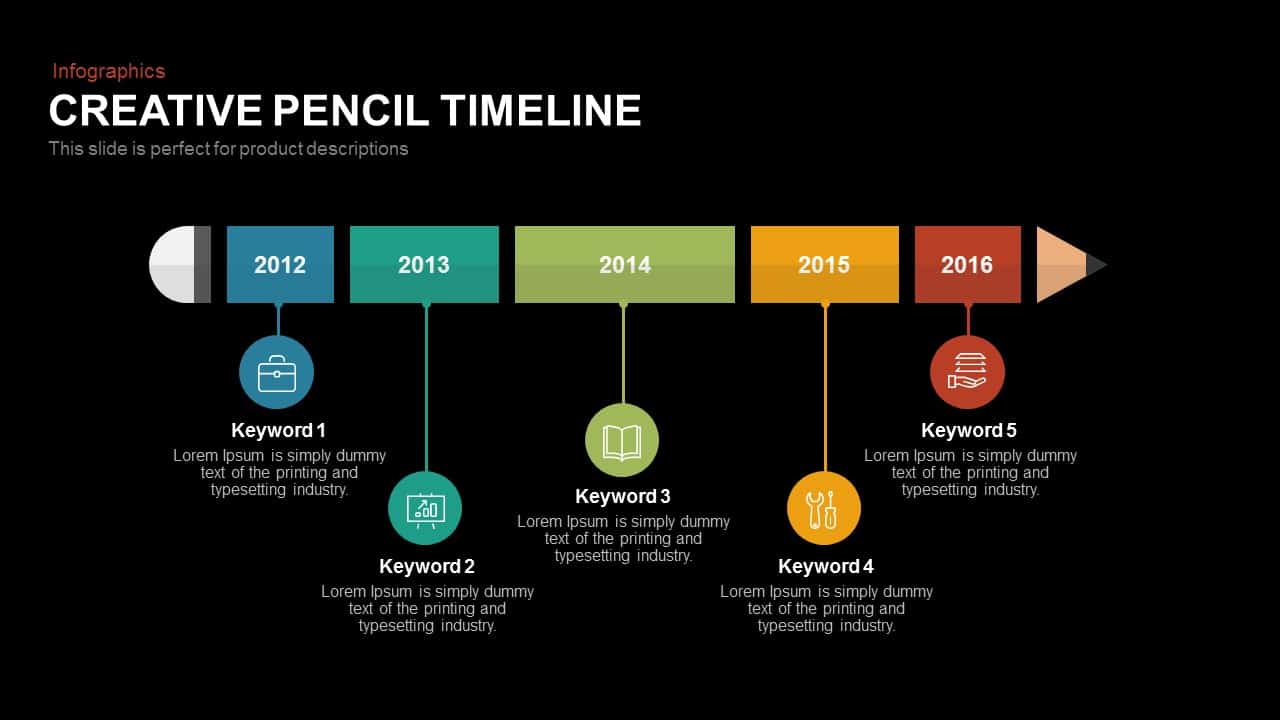
Creative Pencil Timeline Infographic Template for PowerPoint & Google Slides
Timeline
Curved Five-Section Timeline Infographic template for PowerPoint & Google Slides
Timeline
Curved Road Map Timeline Infographic Template for PowerPoint & Google Slides
Roadmap
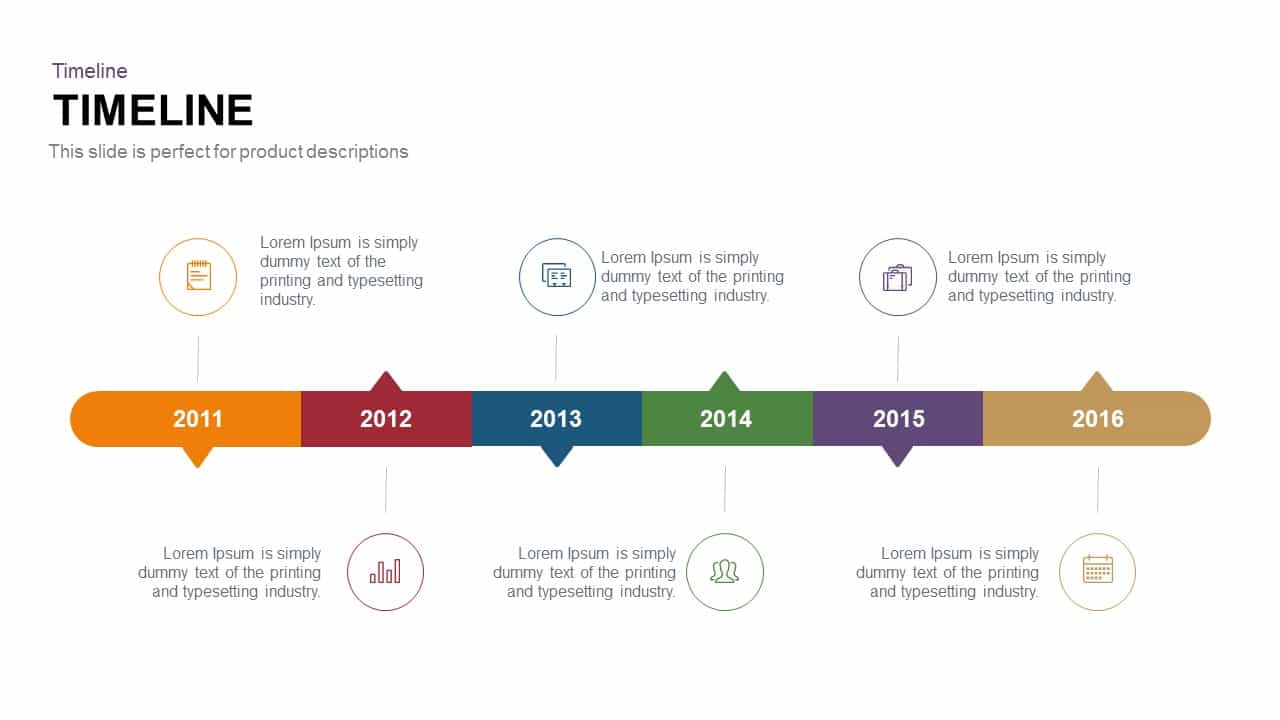
Horizontal Timeline Infographic Template for PowerPoint & Google Slides
Timeline
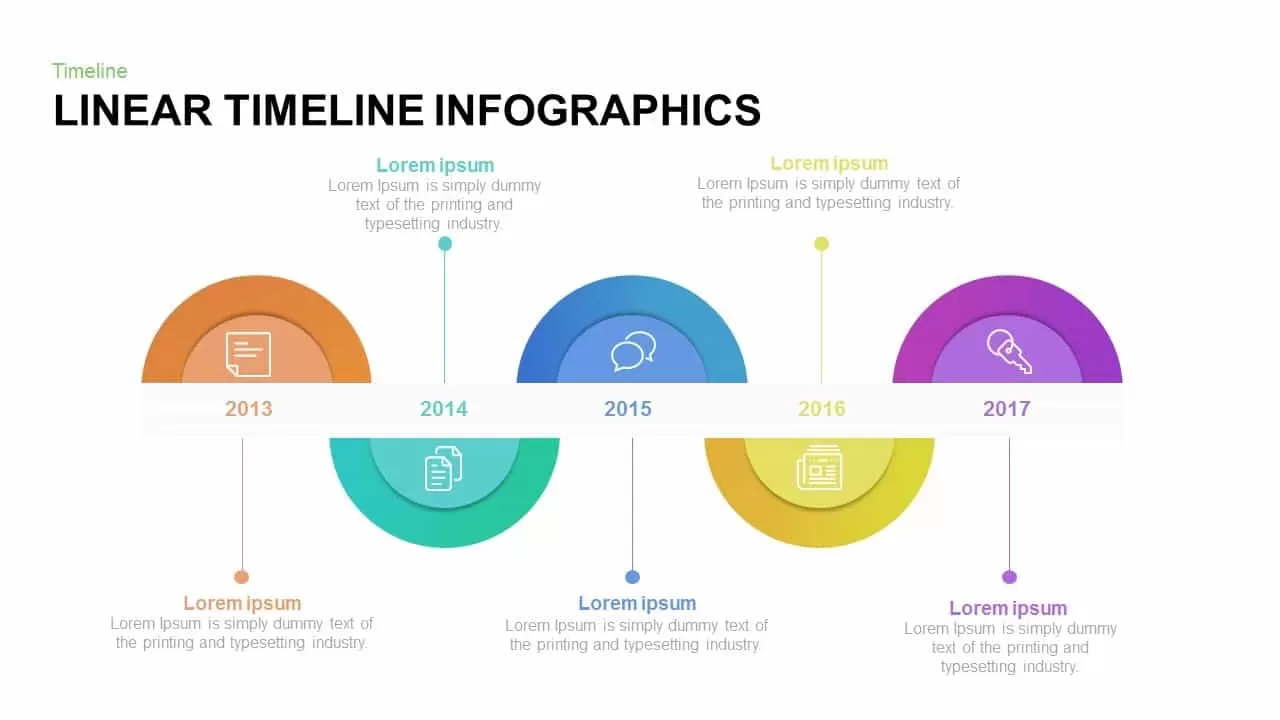
Professional Linear Timeline Infographic Template for PowerPoint & Google Slides
Timeline
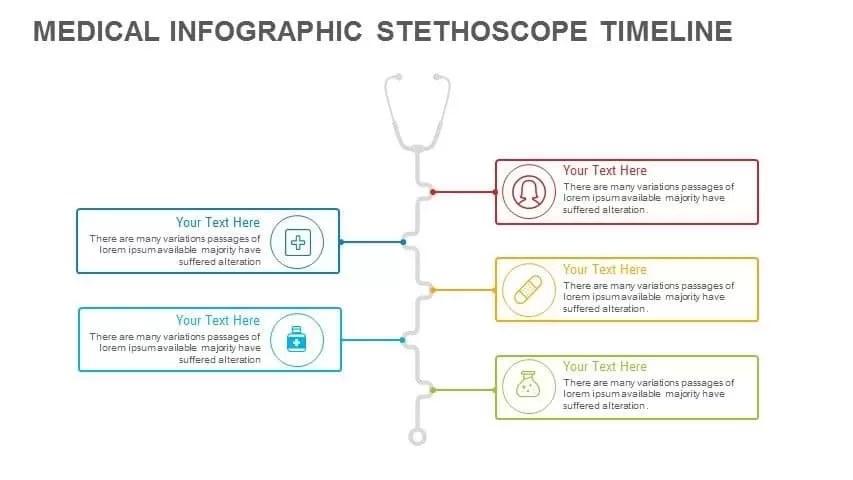
Medical Stethoscope Timeline Infographic Template for PowerPoint & Google Slides
Timeline
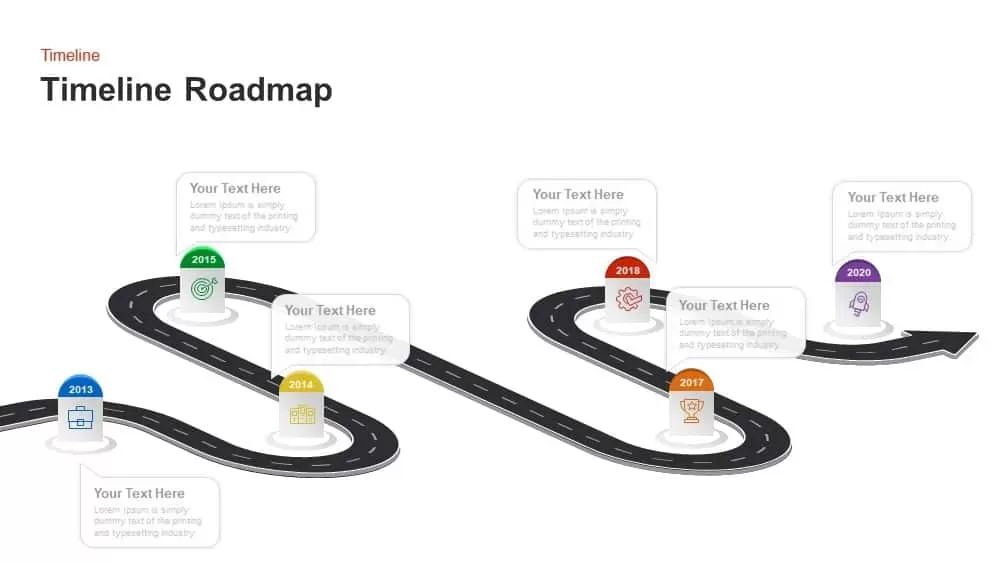
Timeline Roadmap Milestones Infographic Template for PowerPoint & Google Slides
Roadmap
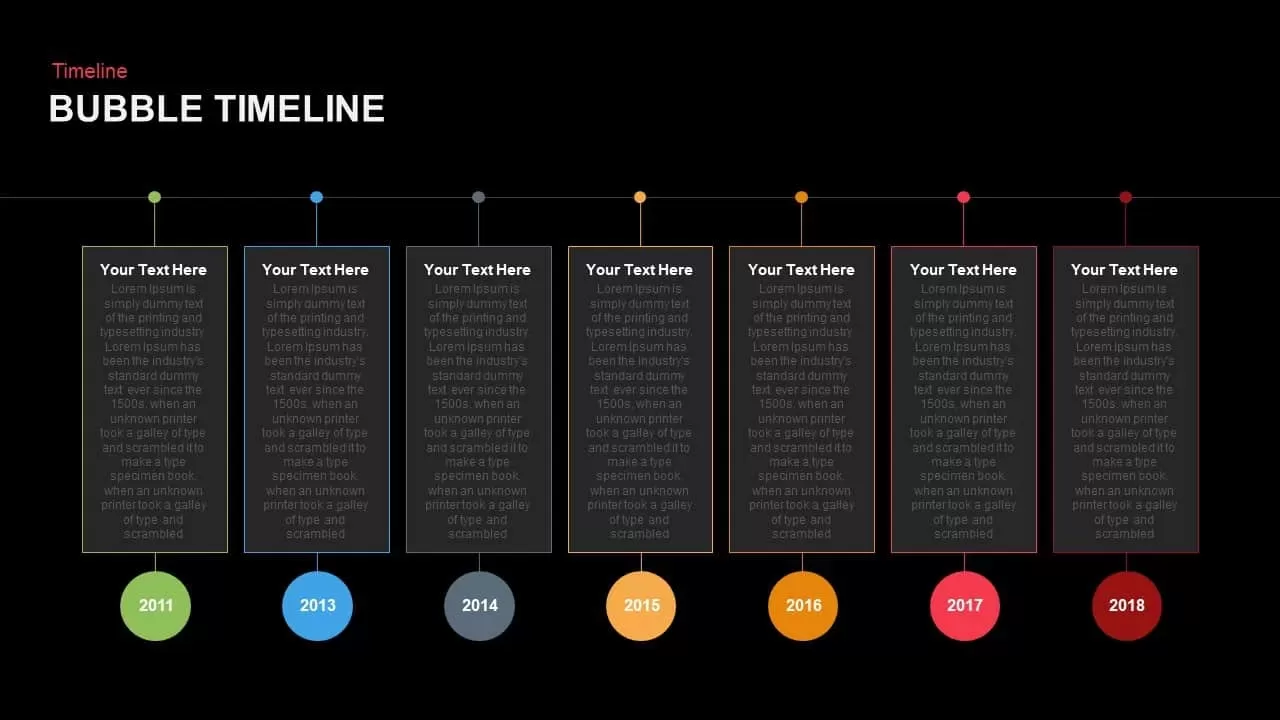
Modern Bubble Timeline Infographic Template for PowerPoint & Google Slides
Timeline
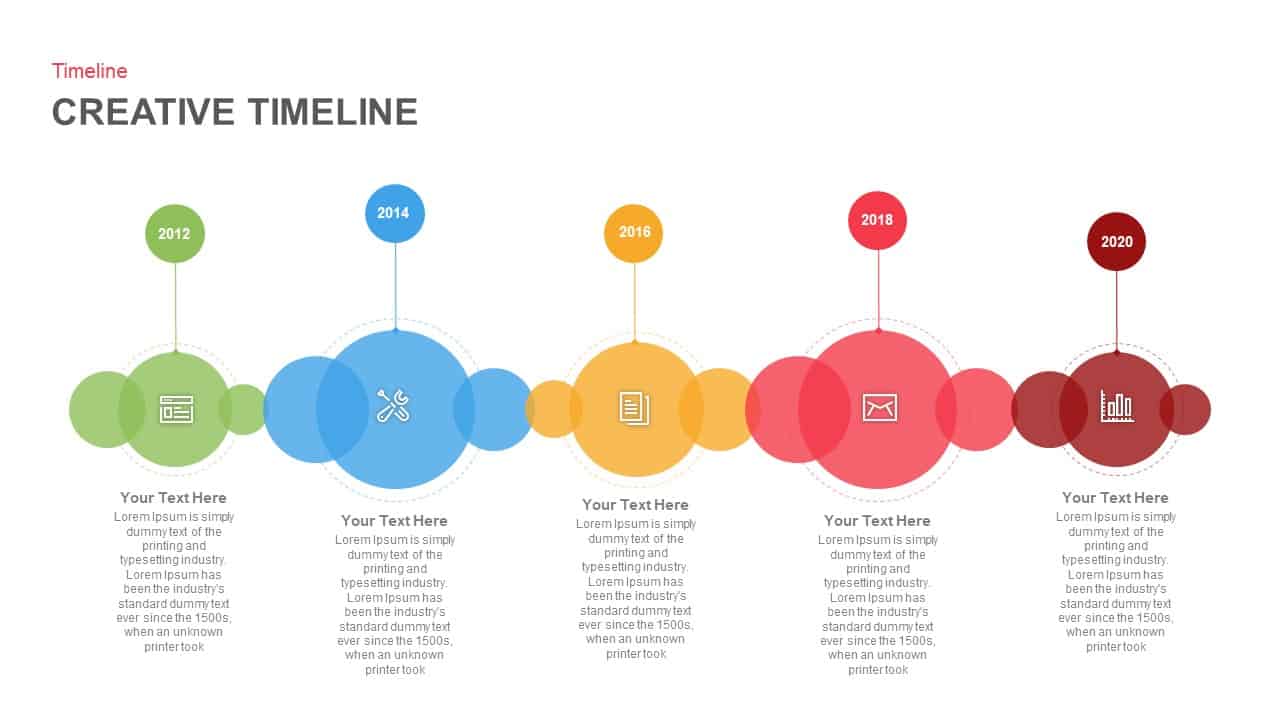
Creative Bubble Timeline Infographic Template for PowerPoint & Google Slides
Timeline
Multi-Year Timeline Infographic Template for PowerPoint & Google Slides
Timeline
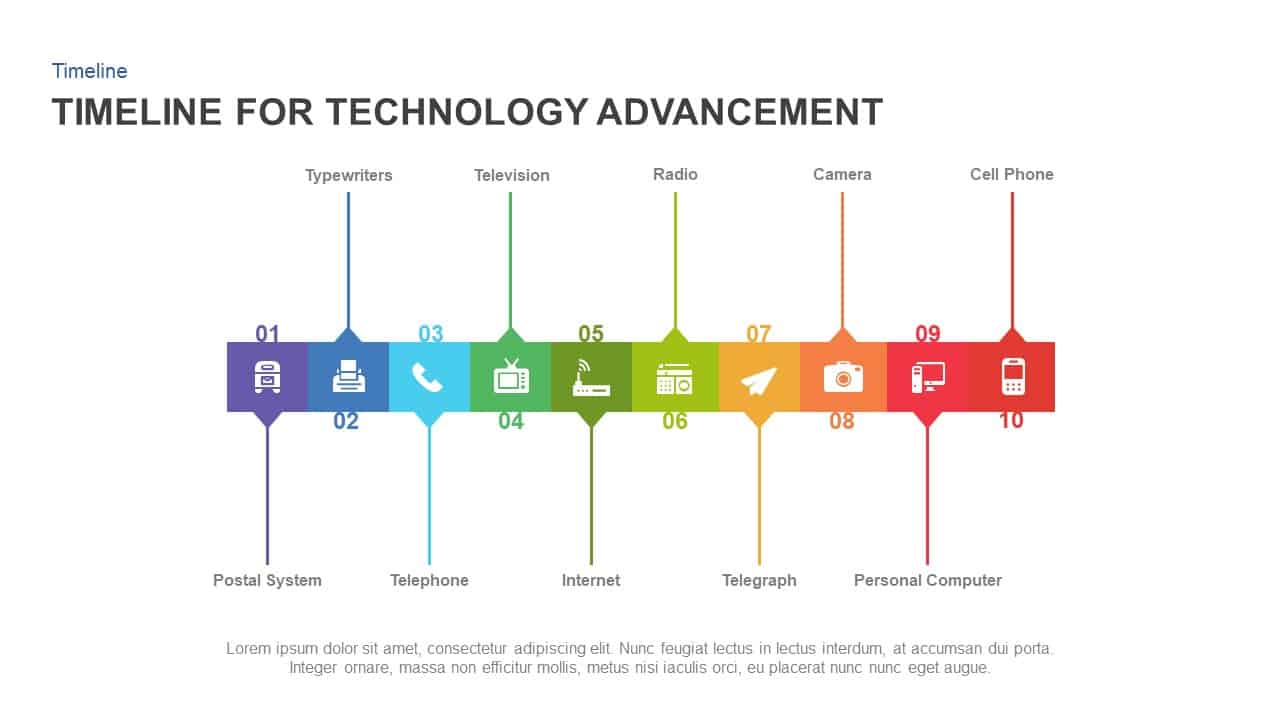
Technology Advancement Timeline Infographic Template for PowerPoint & Google Slides
Information Technology
Five-Year Gradient Timeline Infographic Template for PowerPoint & Google Slides
Timeline
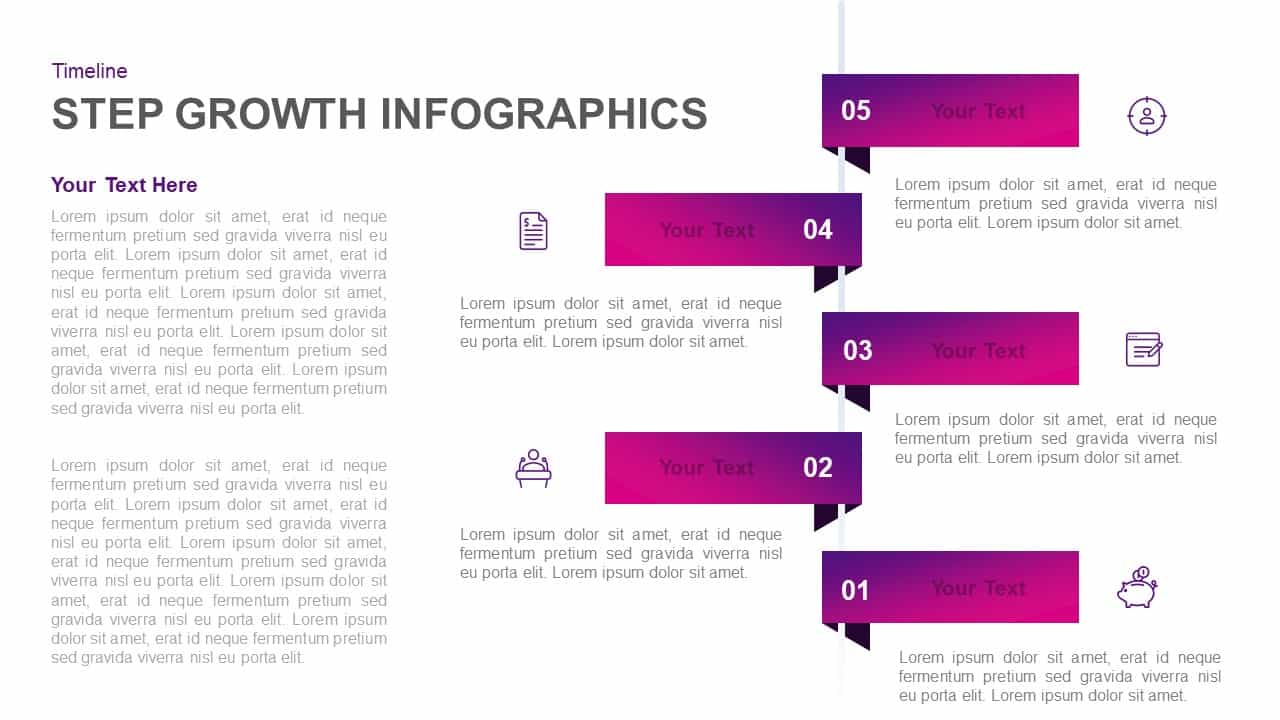
Five-Step Growth Timeline Infographic Template for PowerPoint & Google Slides
Timeline
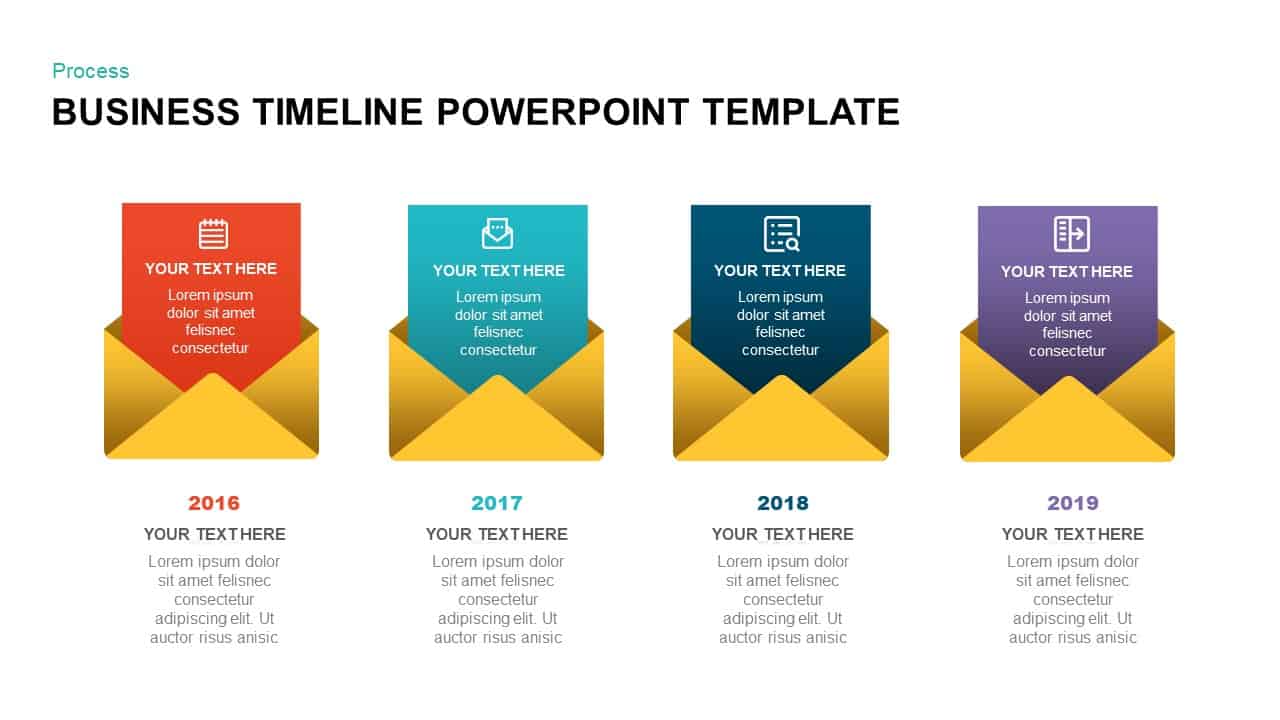
Business Timeline Envelope Infographic Template for PowerPoint & Google Slides
Timeline
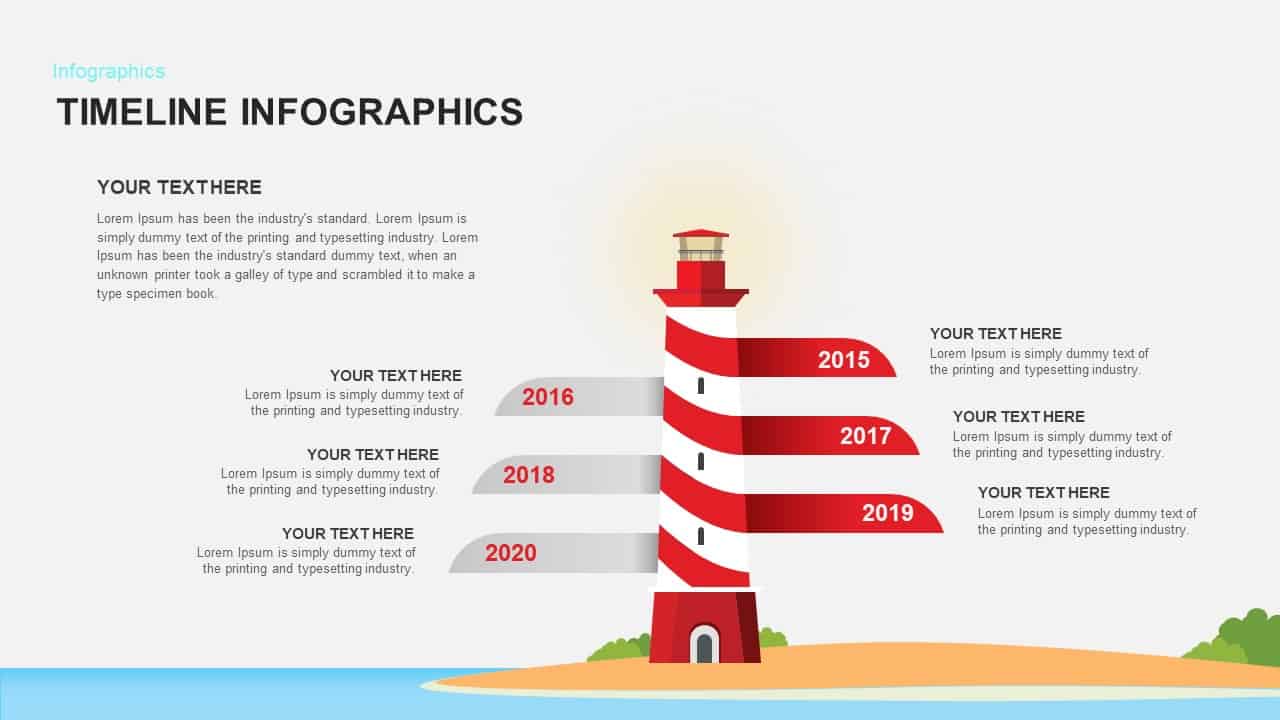
Lighthouse Timeline Infographic Template for PowerPoint & Google Slides
Timeline
Time & Date Infographic Timeline Template for PowerPoint & Google Slides
Decks
Pill-Style 30-60-90 Timeline Infographic Template for PowerPoint & Google Slides
Timeline
Project Update & Timeline Infographic Template for PowerPoint & Google Slides
Business
Modern Green Timeline Infographic Template for PowerPoint & Google Slides
Timeline
Free Multi-Year Arrow Timeline Infographic Template for PowerPoint & Google Slides
Timeline
Free
Free Five-Step Circular Timeline Infographic Template for PowerPoint & Google Slides
Timeline
Free
Free Colorful Roadmap Timeline Infographic Template for PowerPoint & Google Slides
Roadmap
Free
Timeline Infographic Steps template for PowerPoint & Google Slides
Business Plan
Six Core Values Infographic Timeline Template for PowerPoint & Google Slides
Comparison
Colorful Agenda Timeline Infographic Template for PowerPoint & Google Slides
Agenda
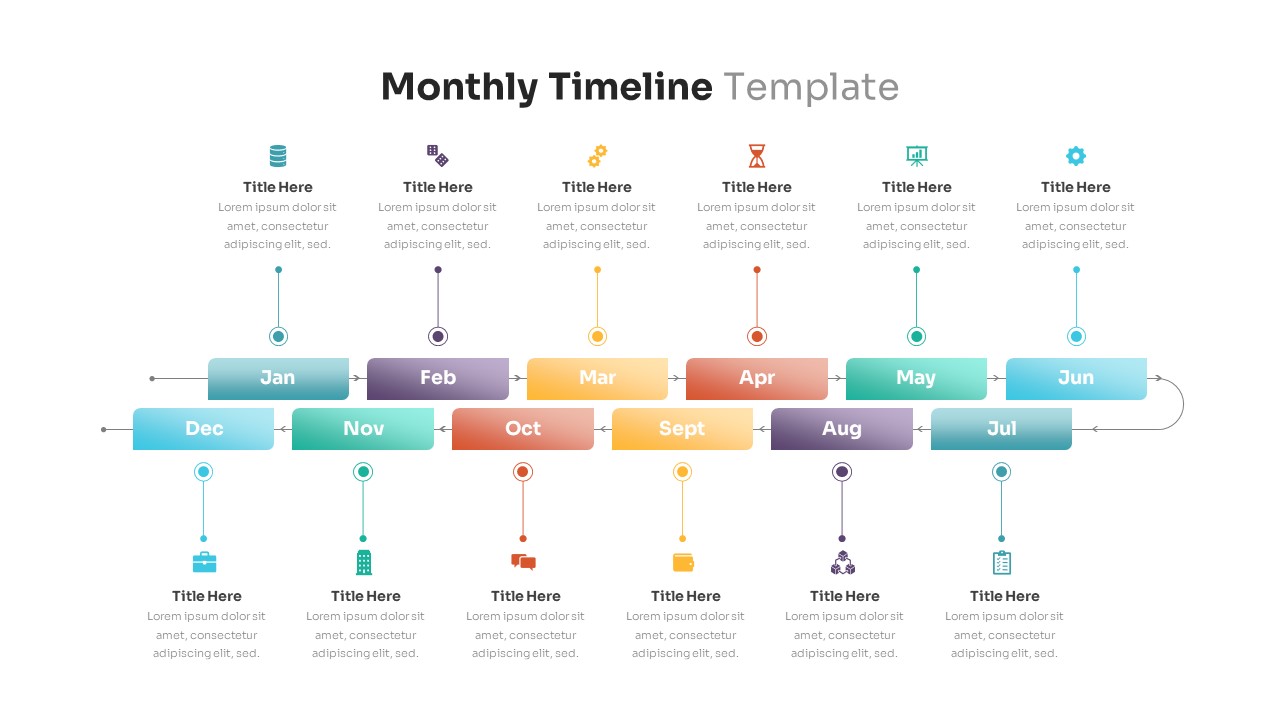
Editable Monthly Timeline Infographic Template for PowerPoint & Google Slides
Timeline
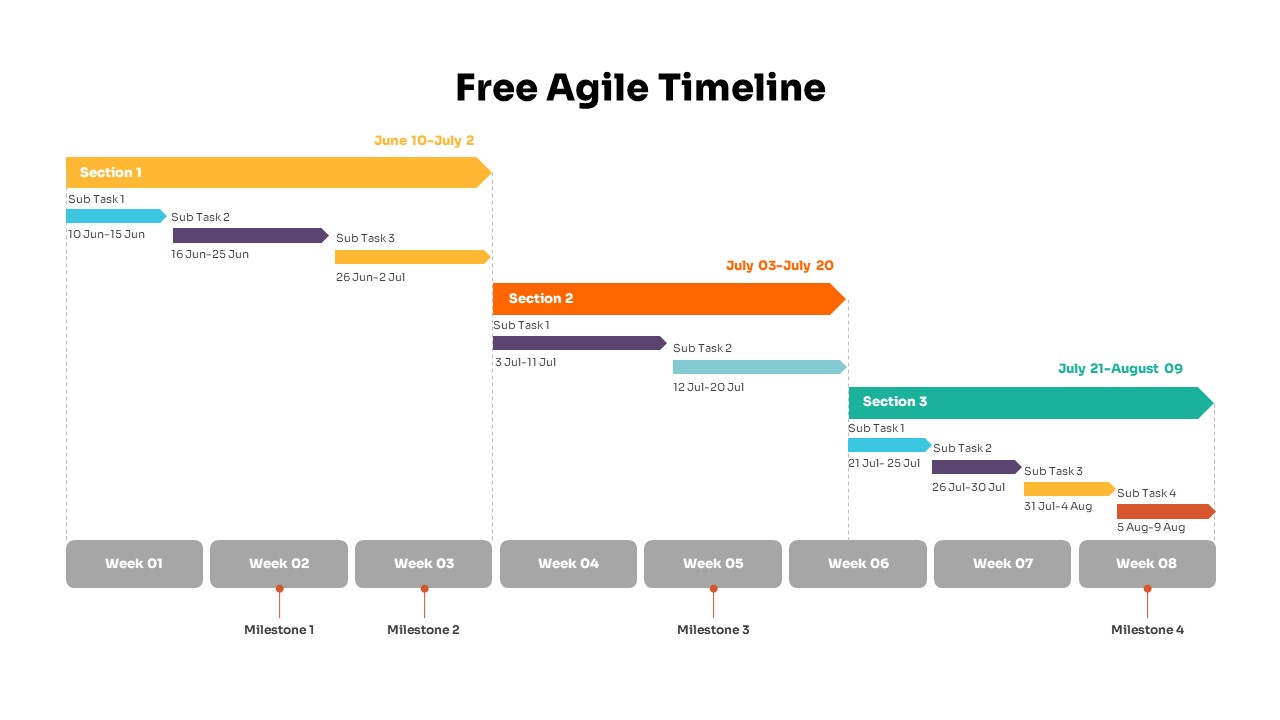
Colorful Agile Timeline Infographic Template for PowerPoint & Google Slides
Timeline
Free
Dynamic Chevron Timeline Infographic Template for PowerPoint & Google Slides
Timeline
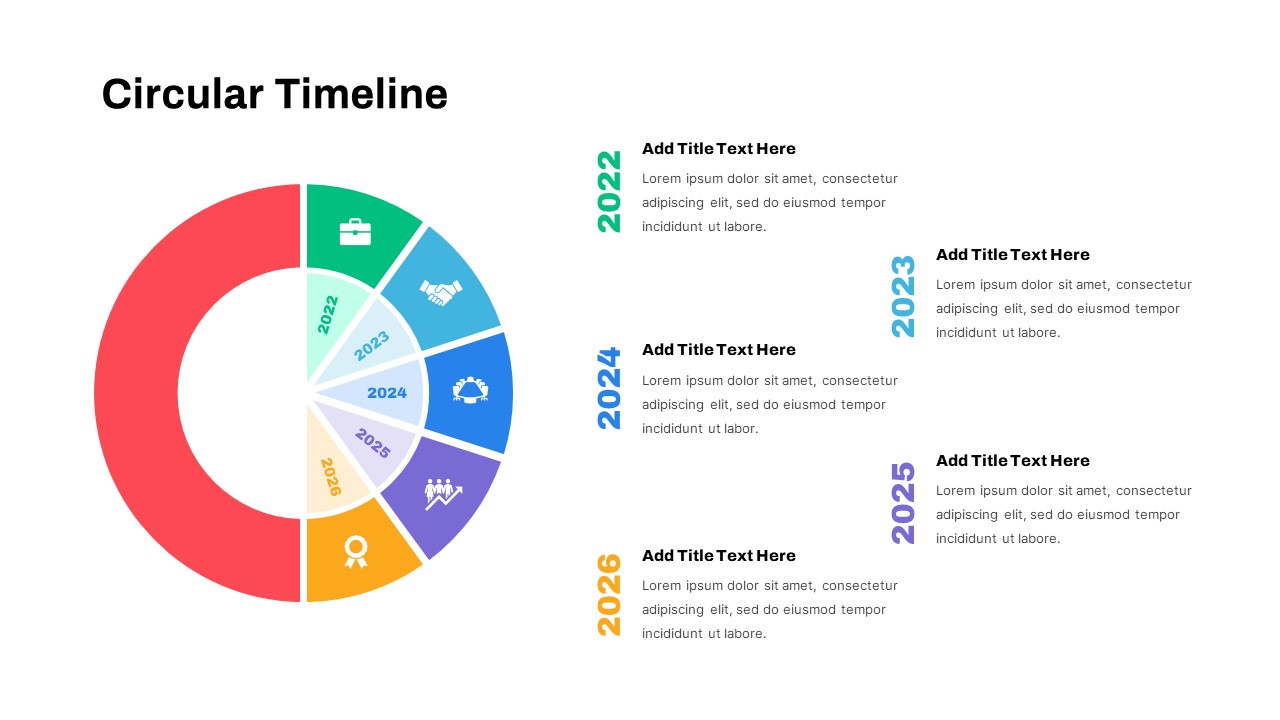
Circular Timeline Infographic Template for PowerPoint & Google Slides
Timeline
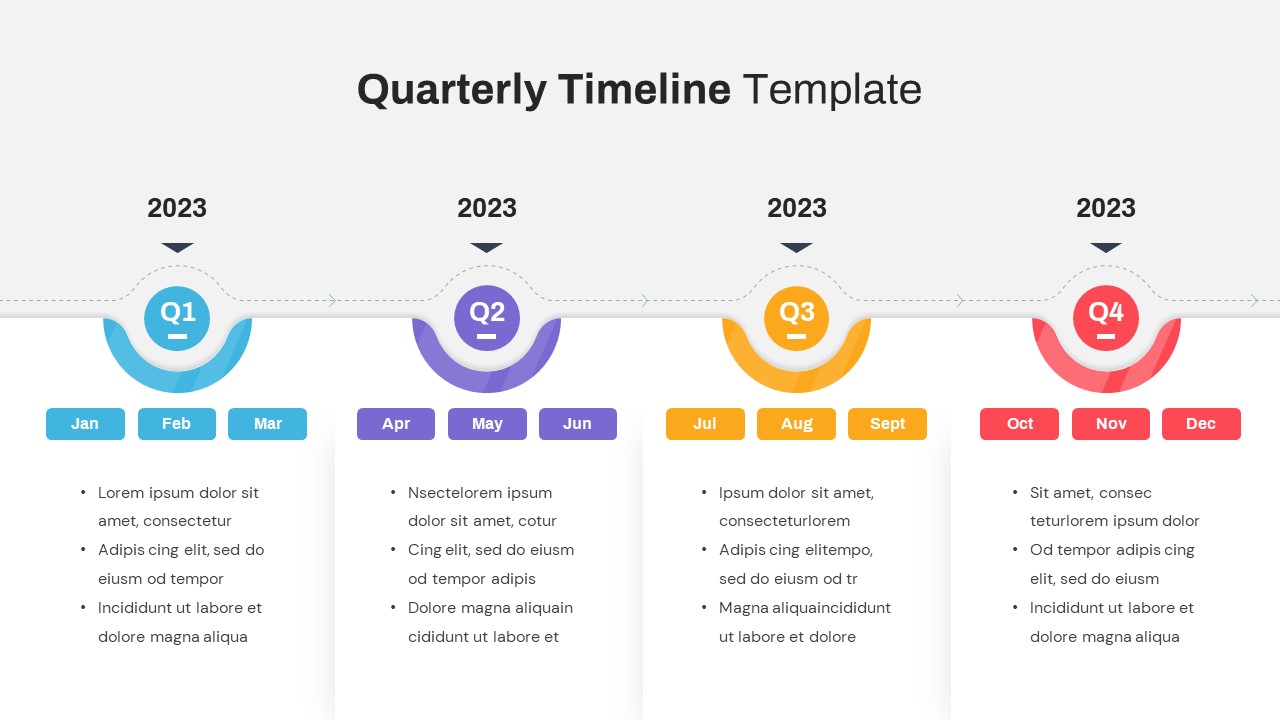
Quarterly Timeline Infographic Template for PowerPoint & Google Slides
Timeline
Minimalist Timeline Infographic Template for PowerPoint & Google Slides
Timeline
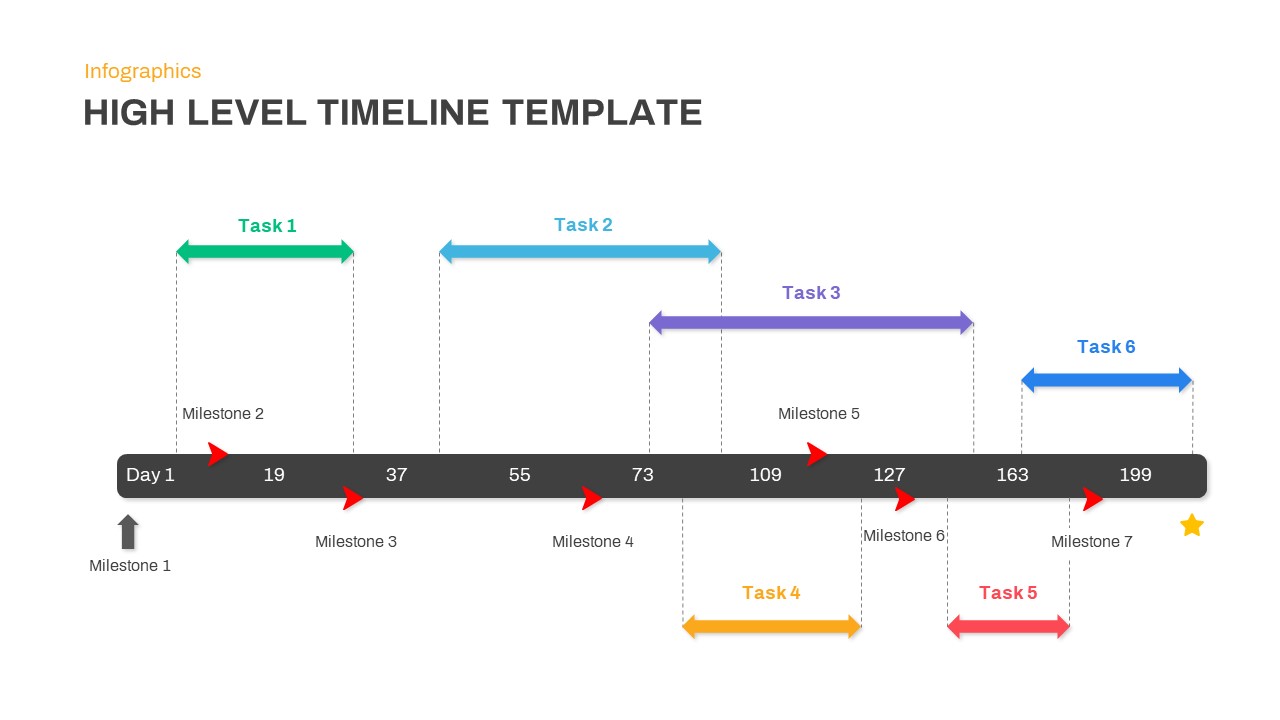
High-Level Timeline Infographic Template for PowerPoint & Google Slides
Timeline
Modern Six-Point Timeline Infographic Template for PowerPoint & Google Slides
Timeline
Fishbone Timeline Infographic Series Template for PowerPoint & Google Slides
Manufacturing
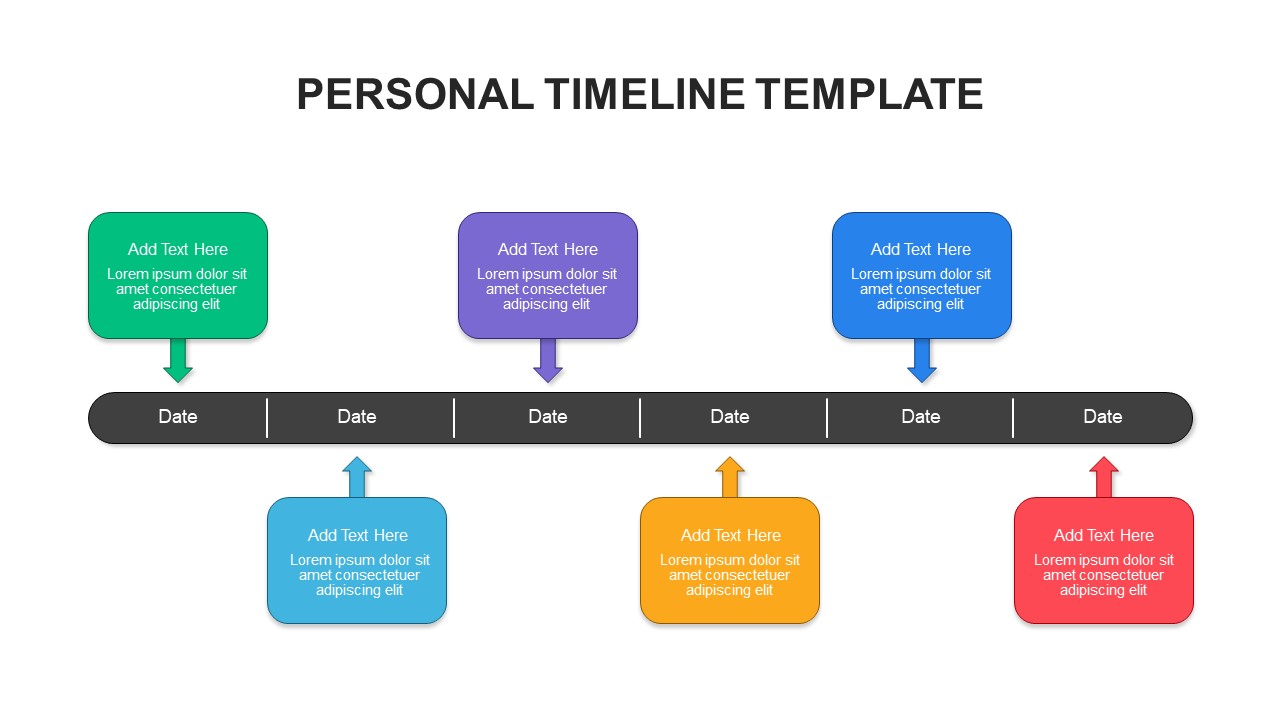
Personal Timeline Infographic Template for PowerPoint & Google Slides
Timeline
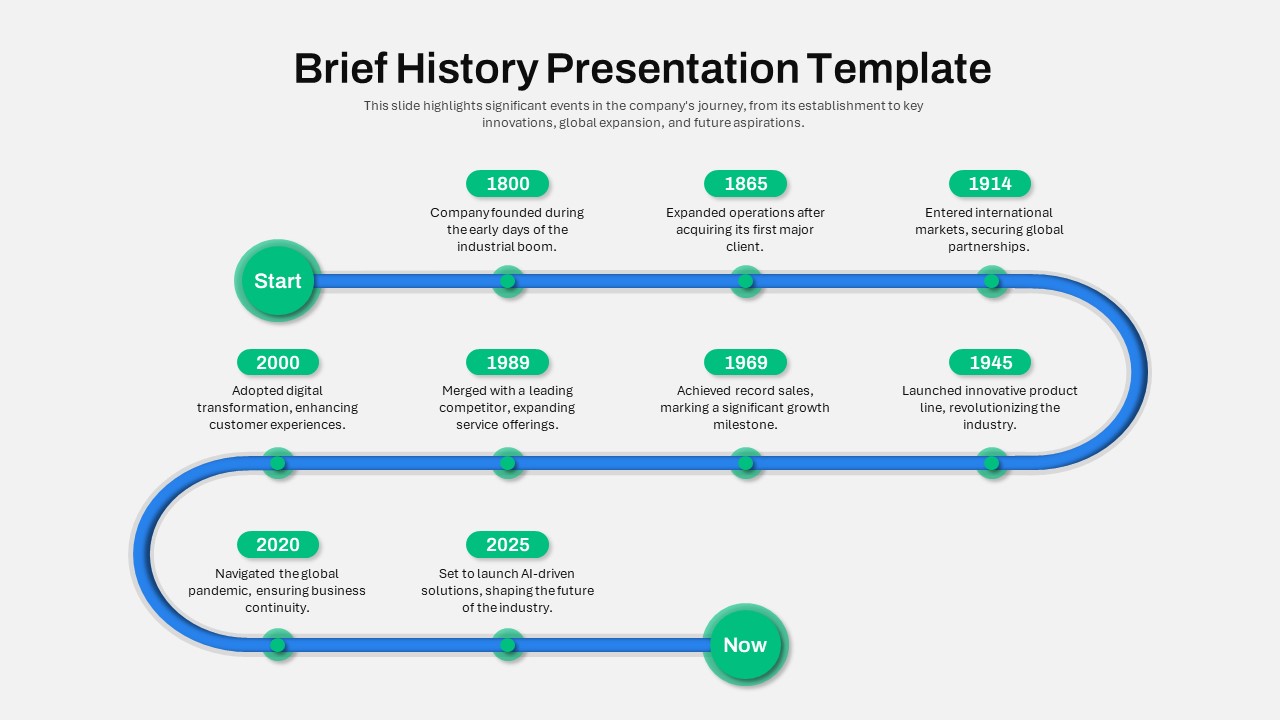
Brief History Timeline Infographic Template for PowerPoint & Google Slides
Timeline
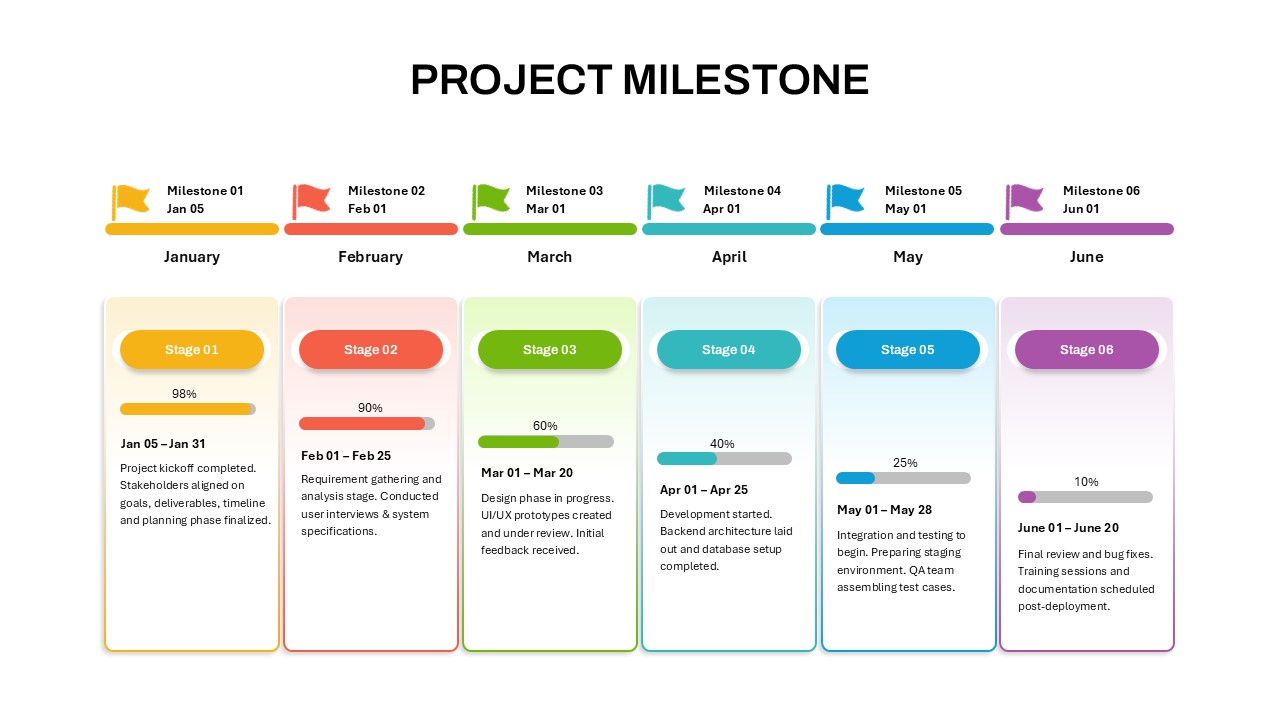
Project Milestone Timeline Infographic Template for PowerPoint & Google Slides
Timeline
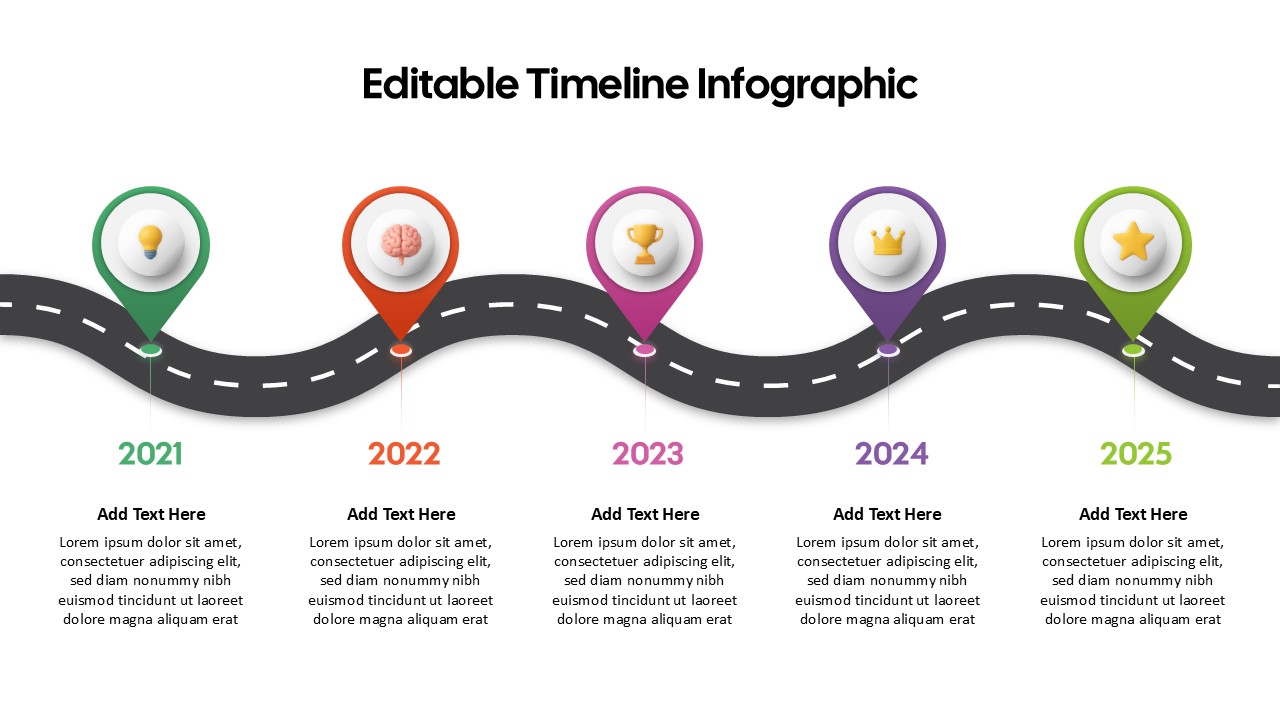
Curved Road Timeline Infographic Template for PowerPoint & Google Slides
Timeline
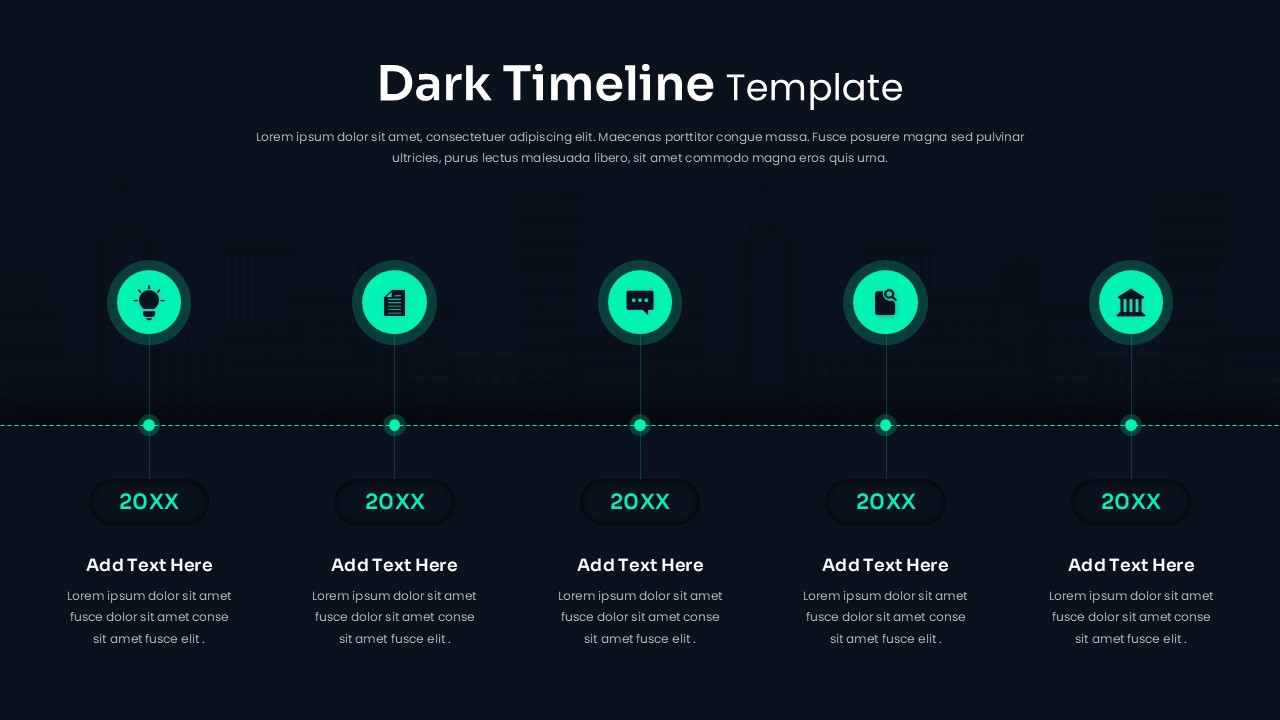
Dark Horizontal Timeline Infographic Template for PowerPoint & Google Slides
Timeline