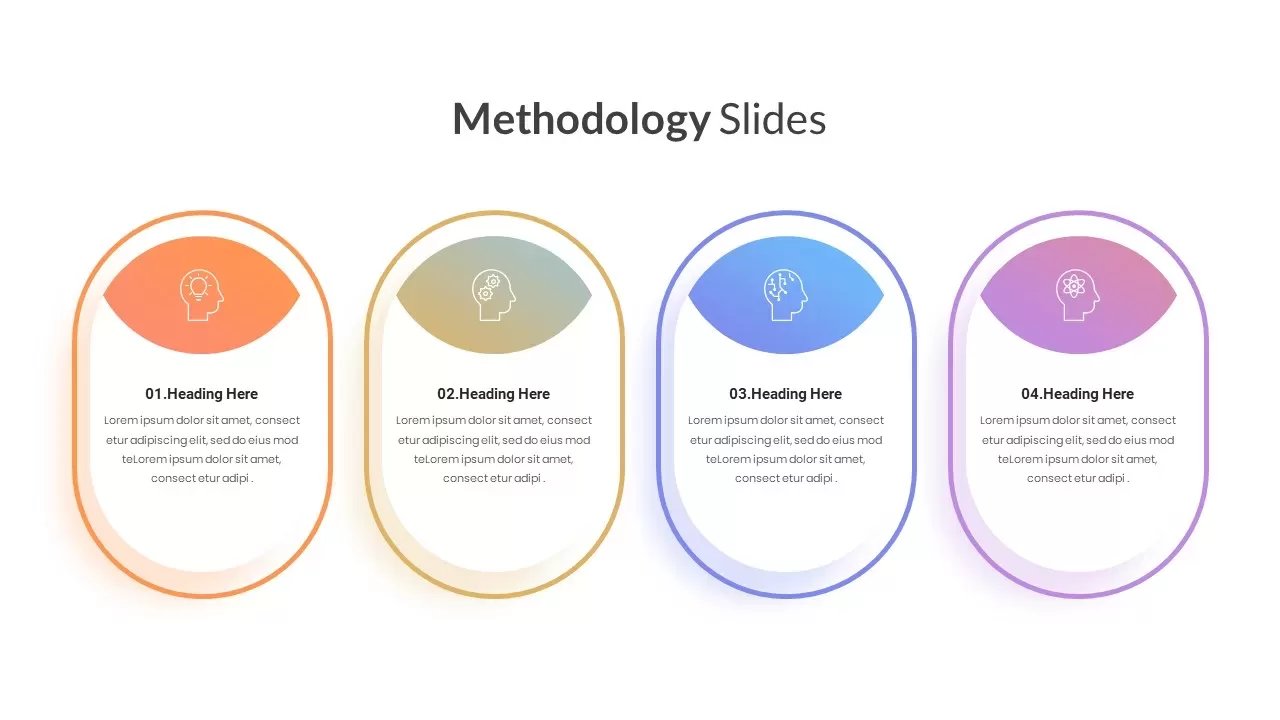
Colorful Five-Stage Methodology Diagram Template for PowerPoint & Google Slides

Description
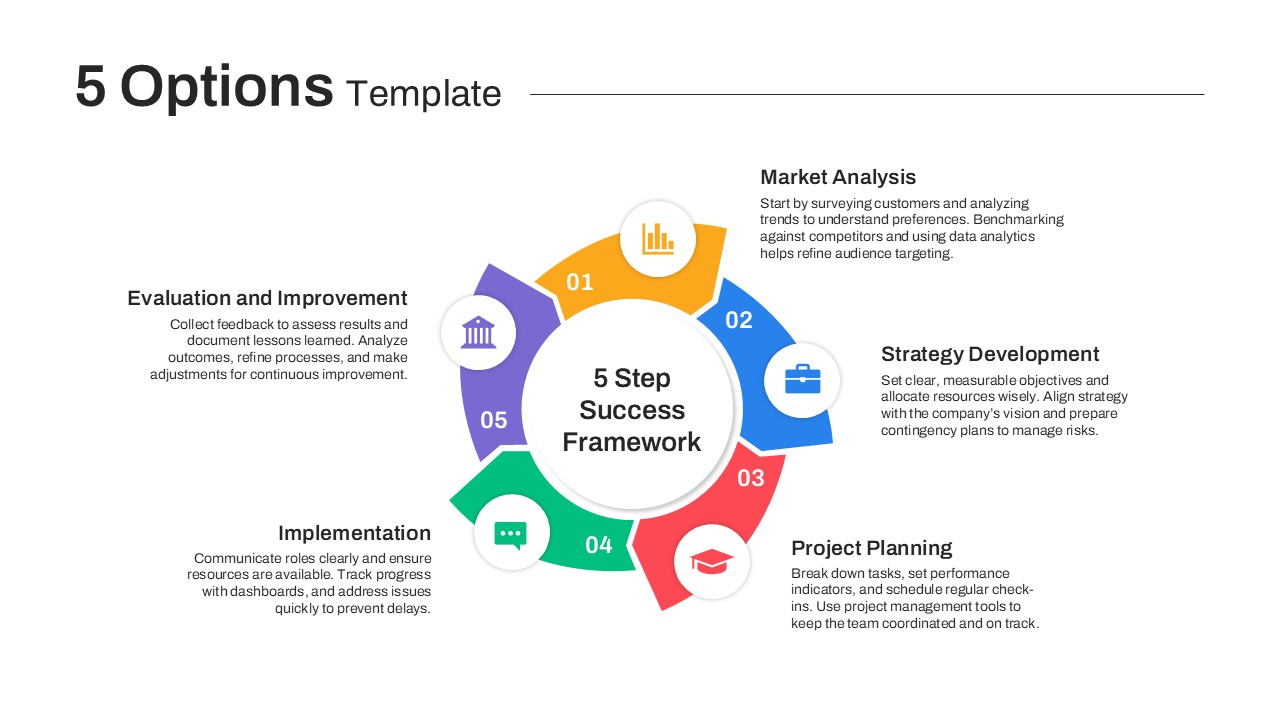
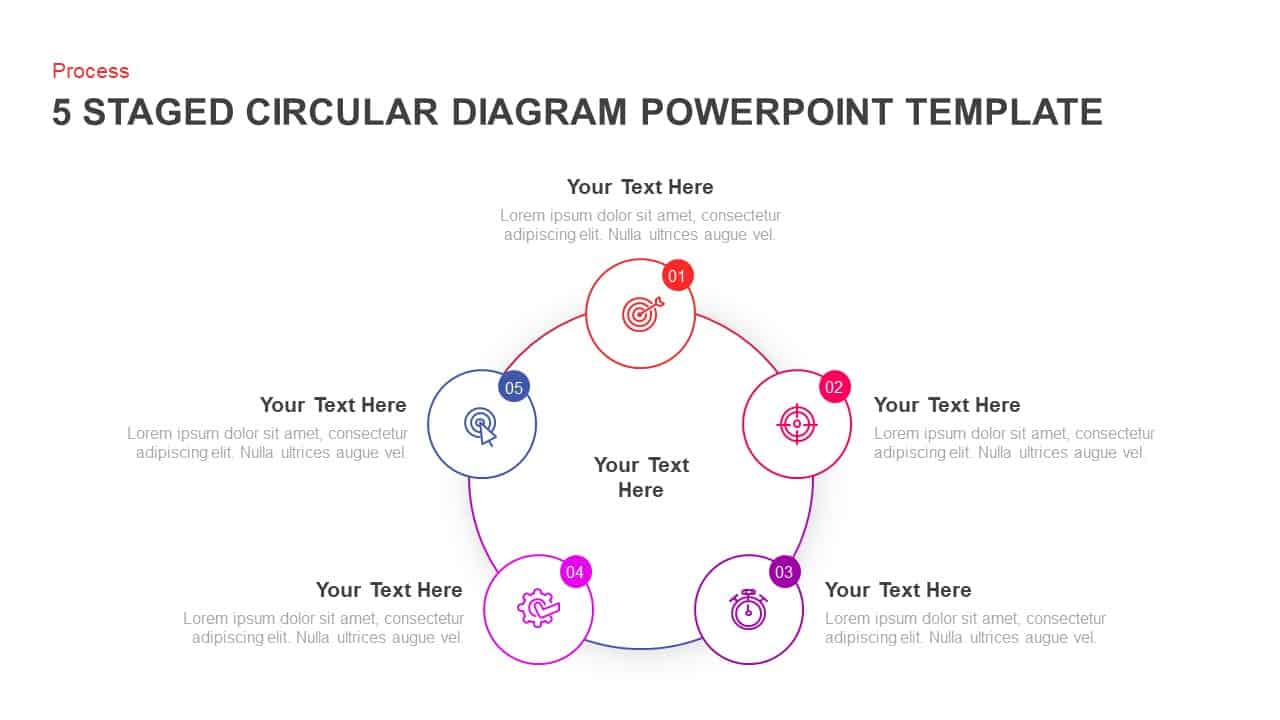
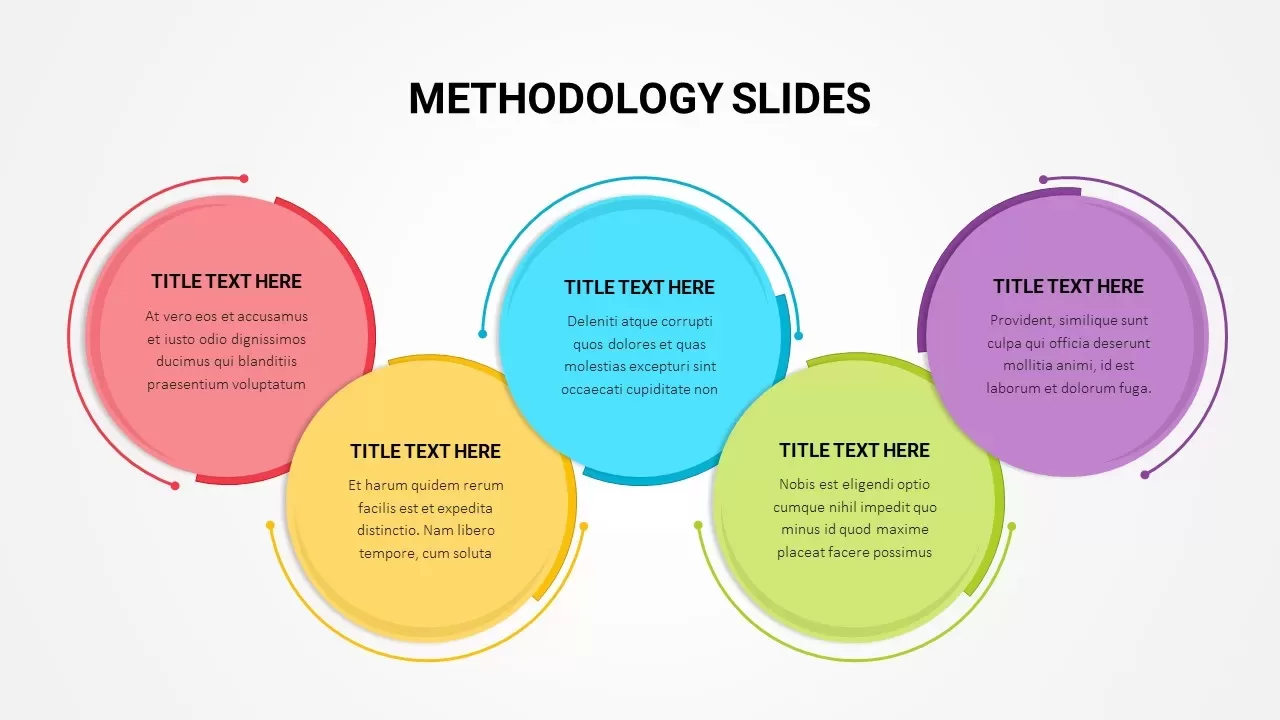
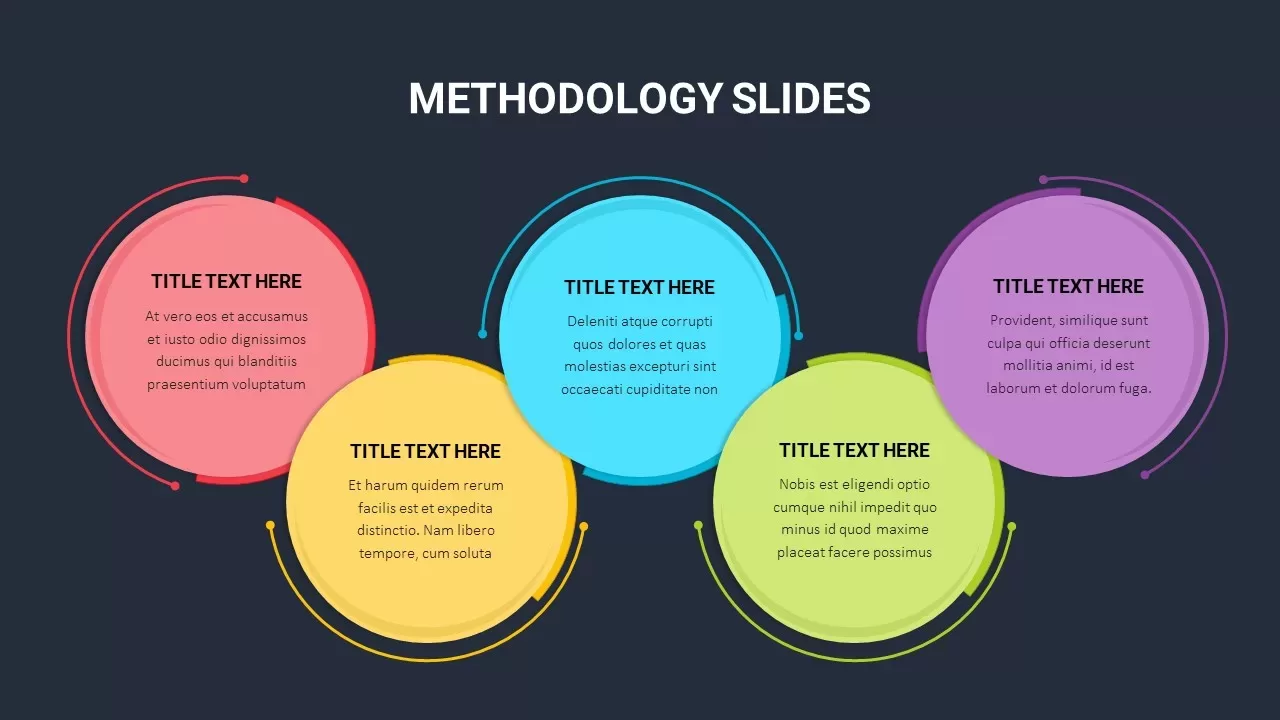
This methodology slide presents a five-stage process as overlapping, gradient-filled circular panels for PowerPoint & Google Slides. Each bold circle is accented by a partial outline arc and carries an icon placeholder above a heading and descriptive text area, allowing you to visually distinguish ideation, analysis, execution, review, and optimization phases. The warm-to-cool palette—ranging from coral through sunflower yellow and cyan to lime green and lavender—ensures each step stands out while maintaining visual harmony against a clean white canvas. Built on master slides with fully editable vector shapes, you can swap icons, adjust colors, and update text without disrupting the layout. Optional fade-in animations are preconfigured to reveal each stage in sequence, guiding audiences through your methodology with clarity and engagement.
Who is it for
Project managers, business consultants, and process engineers will value this diagram for illustrating structured workflows, best-practice frameworks, and multi-phase strategies. Product development teams and design agencies can map research sprints, prototyping cycles, or launch milestones. Educators and trainers can leverage its clear visual flow for classroom modules or corporate workshops.
Other Uses
Beyond core methodologies, repurpose this slide to chart customer journey stages, risk-management cycles, or quarterly planning segments. Replace the icons to showcase marketing funnels, sales pipelines, or onboarding steps. Duplicate and recolor the circles to expand the model for six or more phases, or use the layout for stakeholder approval gates and cross-functional dependencies.
Login to download this file

Item ID
SB03018
Related Templates

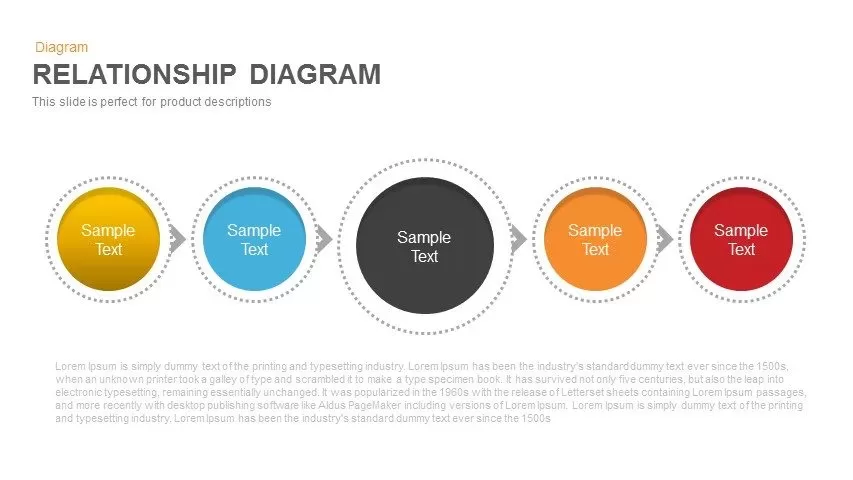
Colorful Five-Stage Relationship Diagram Template for PowerPoint & Google Slides
Process

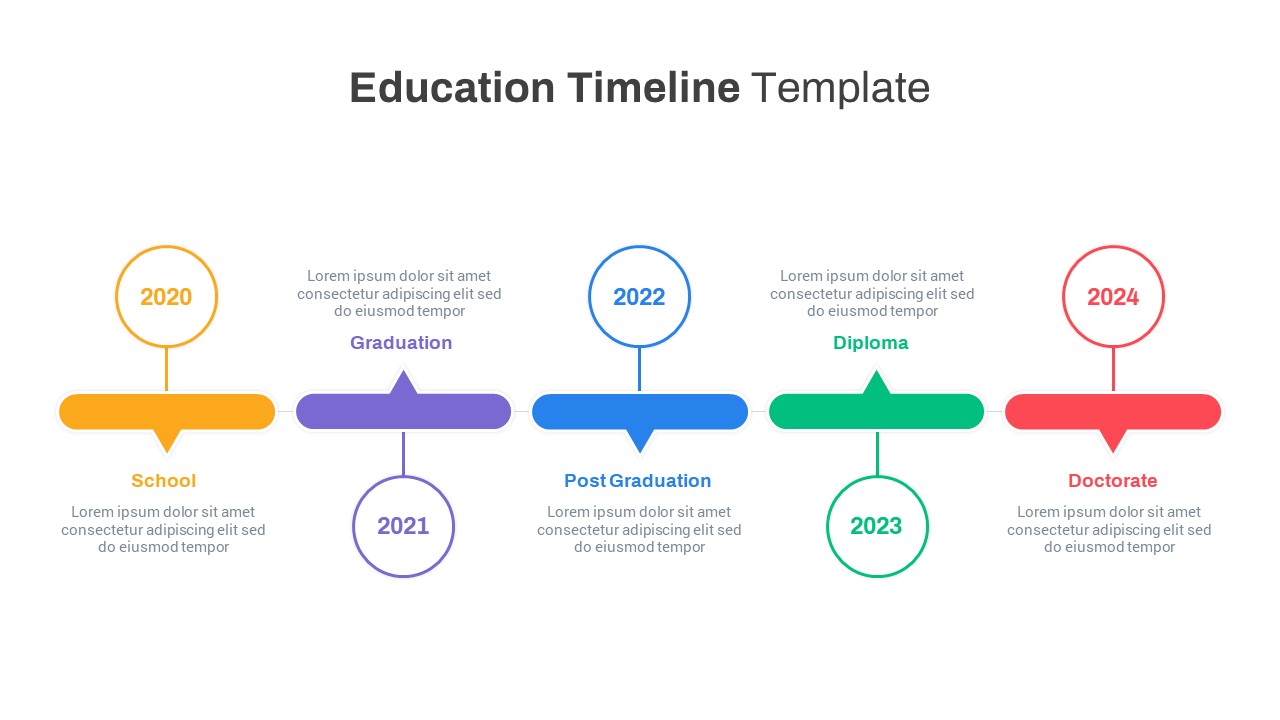
Colorful Five-Stage Education Timeline Template for PowerPoint & Google Slides
Timeline
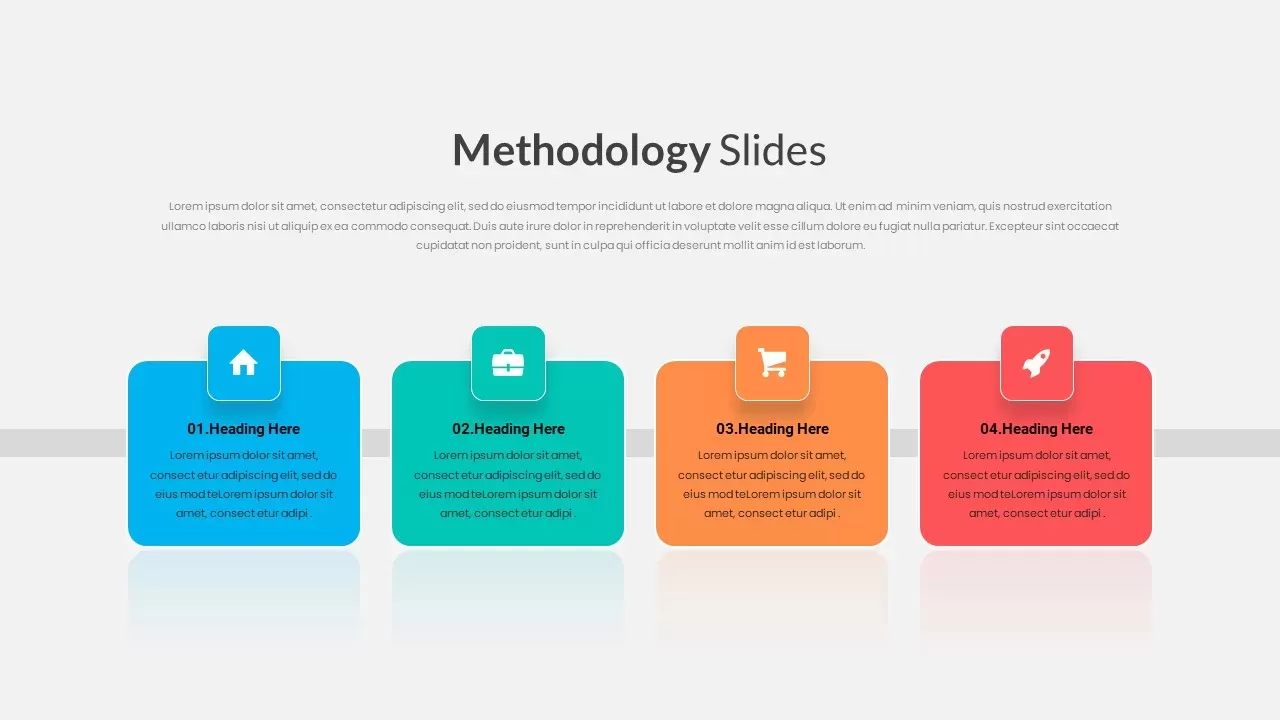
4 Step Vibrant Colorful Methodology Template for PowerPoint & Google Slides
Process
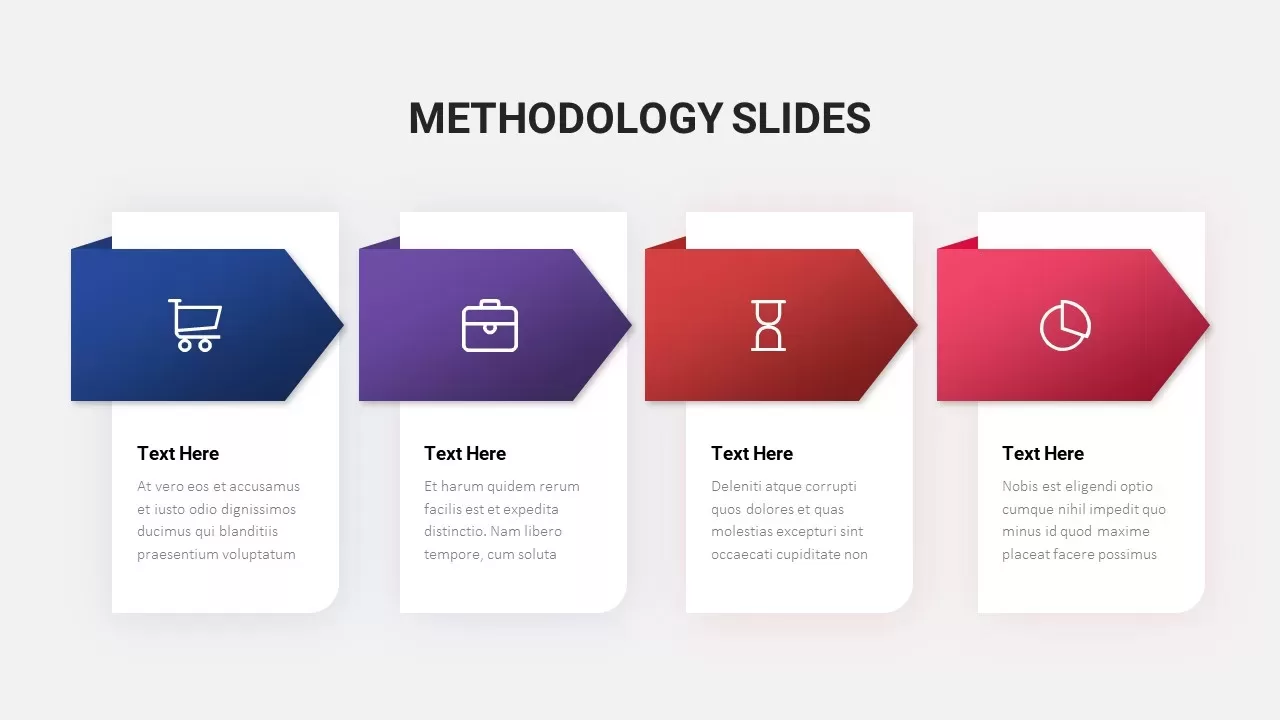
Colorful Arrow Methodology Steps Template for PowerPoint & Google Slides
Process
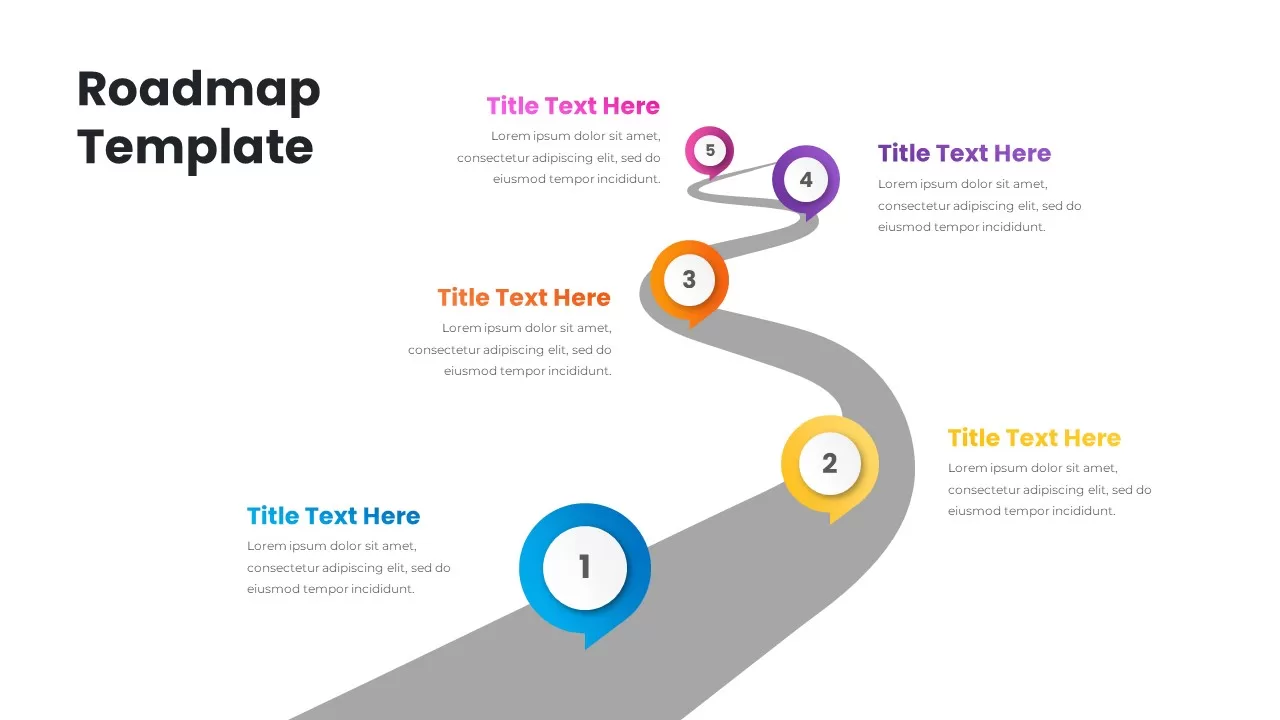
Colorful Five-Step Roadmap Diagram Template for PowerPoint & Google Slides
Roadmap
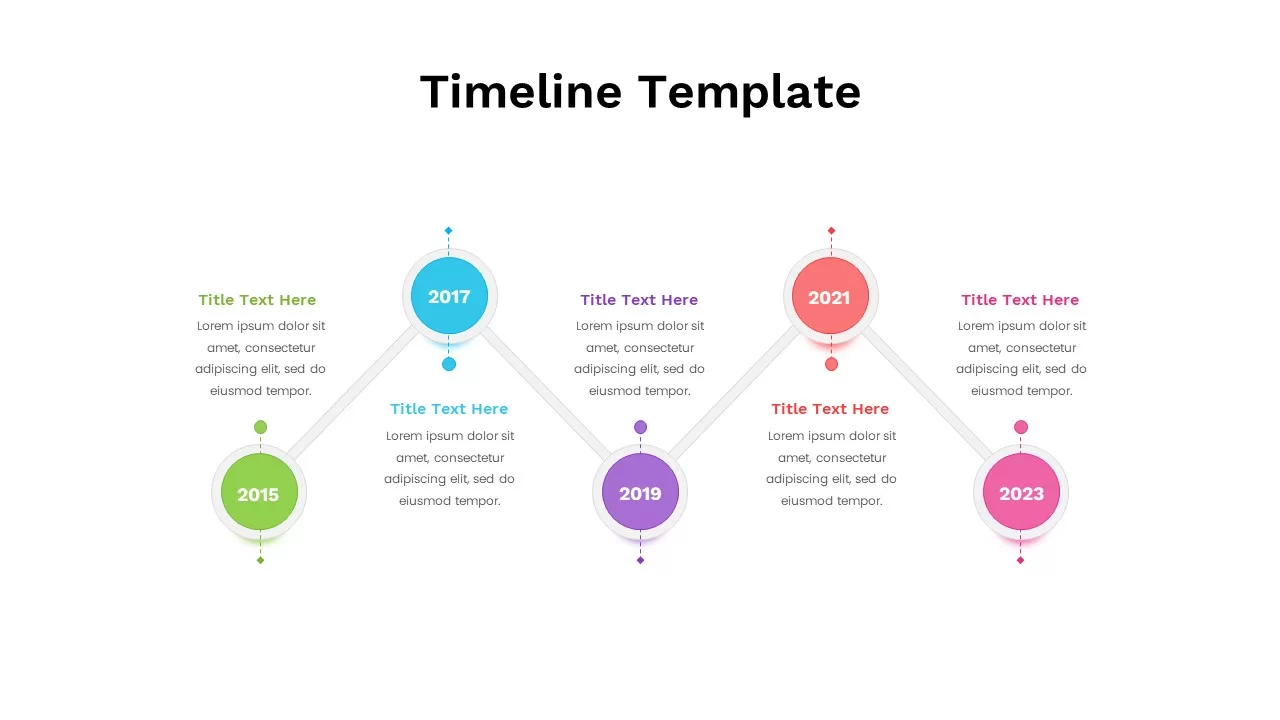
Colorful Five-Year Timeline Layout Template for PowerPoint & Google Slides
Timeline
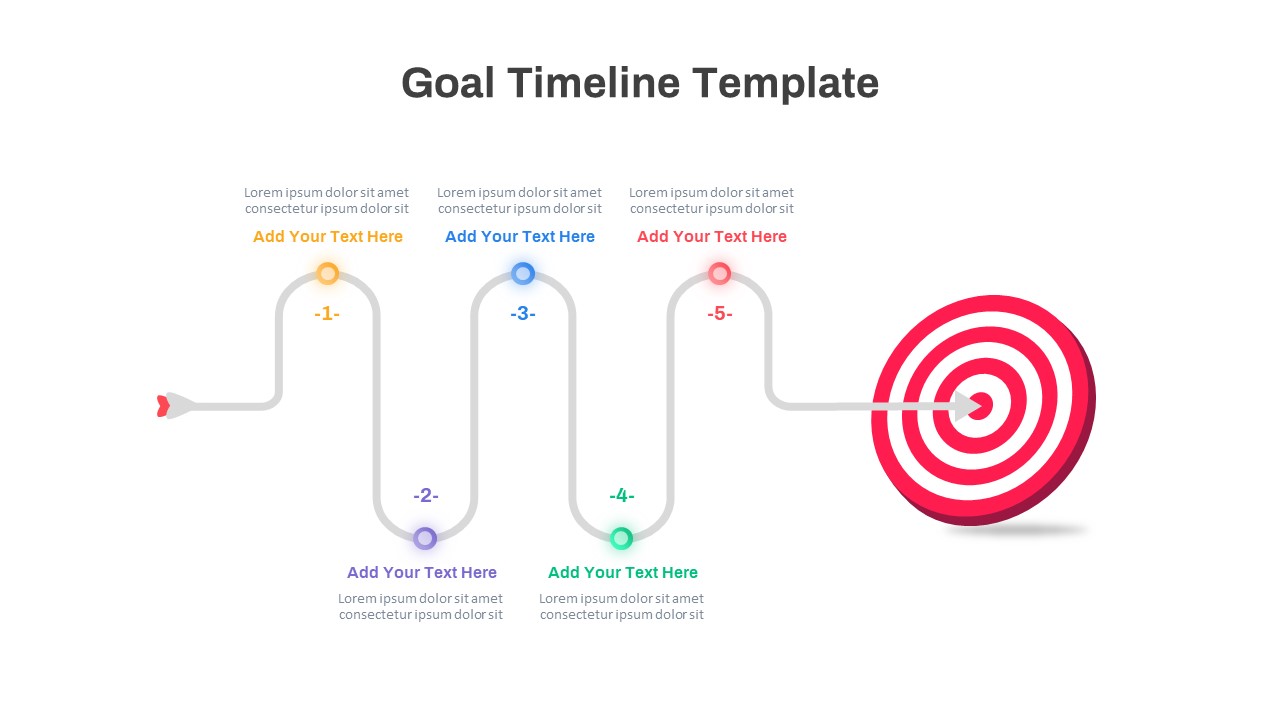
Colorful Five-Step Goal Timeline Template for PowerPoint & Google Slides
Timeline
Colorful Five-Option Ribbon Infographic Template for PowerPoint & Google Slides
Process
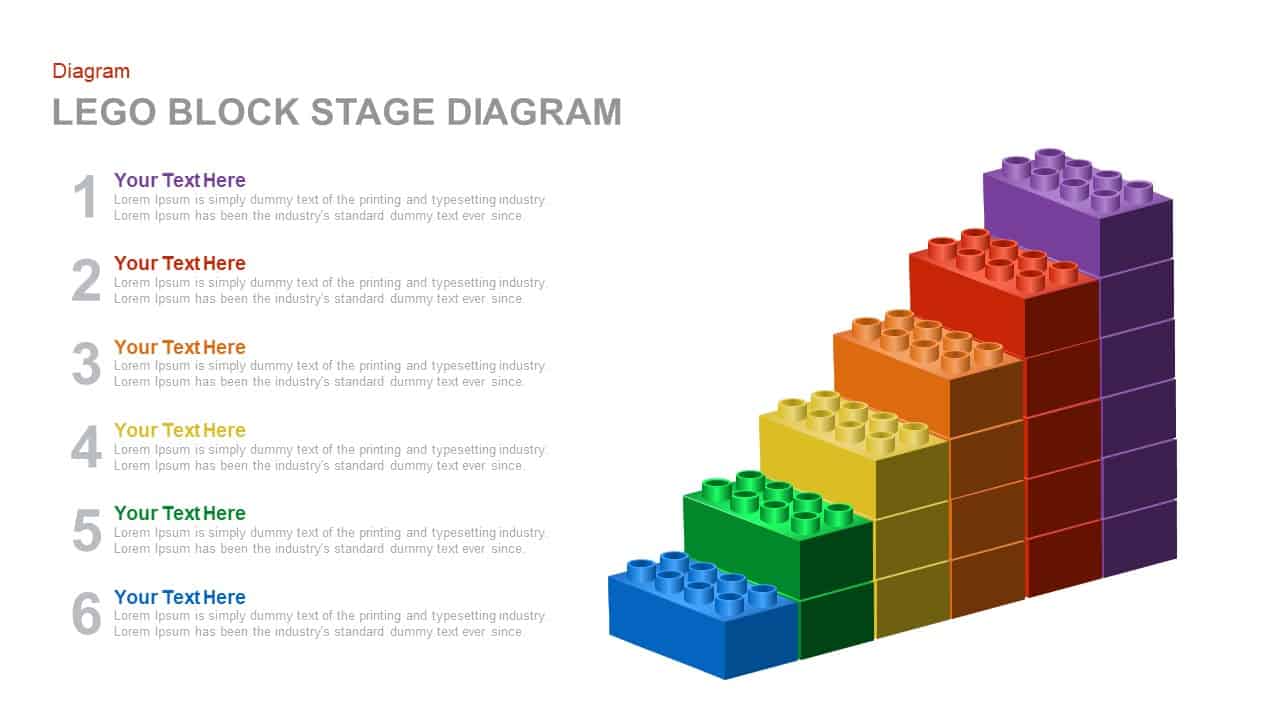
Colorful LEGO Block Stage Diagram Template for PowerPoint & Google Slides
Process
Colorful 8-Stage Droplet Process Flow Diagram Template for PowerPoint & Google Slides
Process
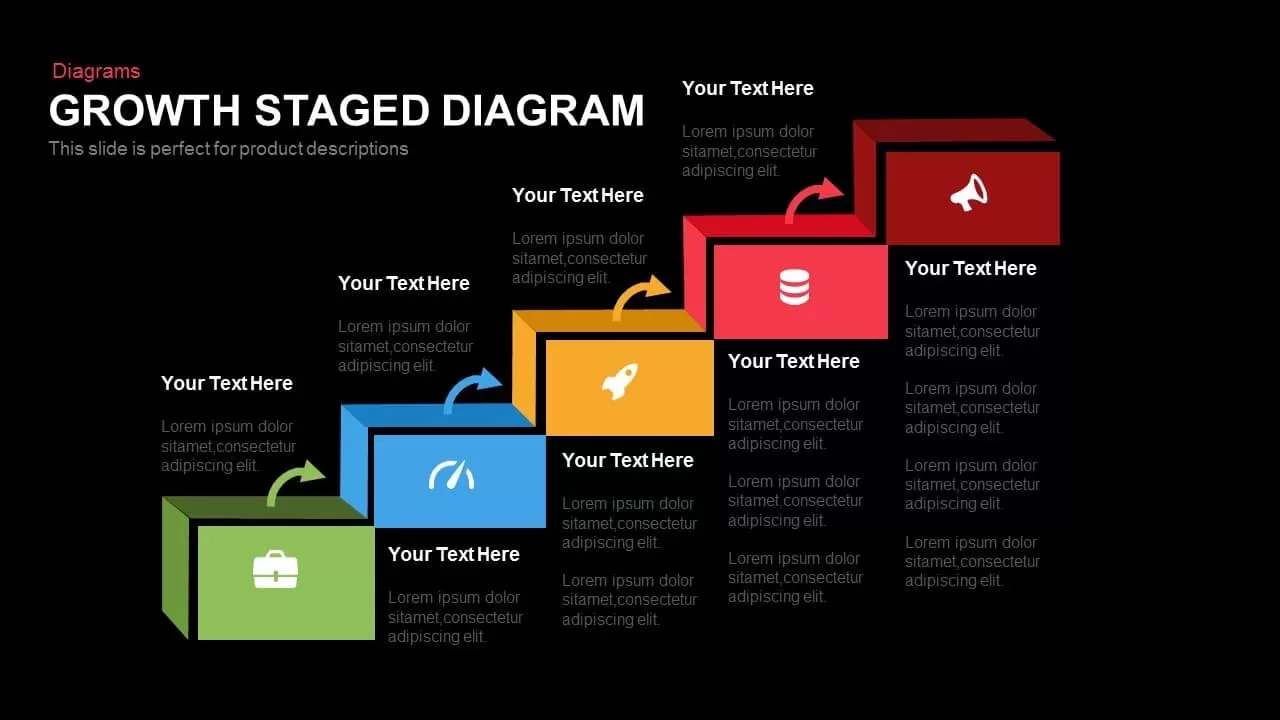
Five-Step Growth Stage Staircase Diagram Template for PowerPoint & Google Slides
Process
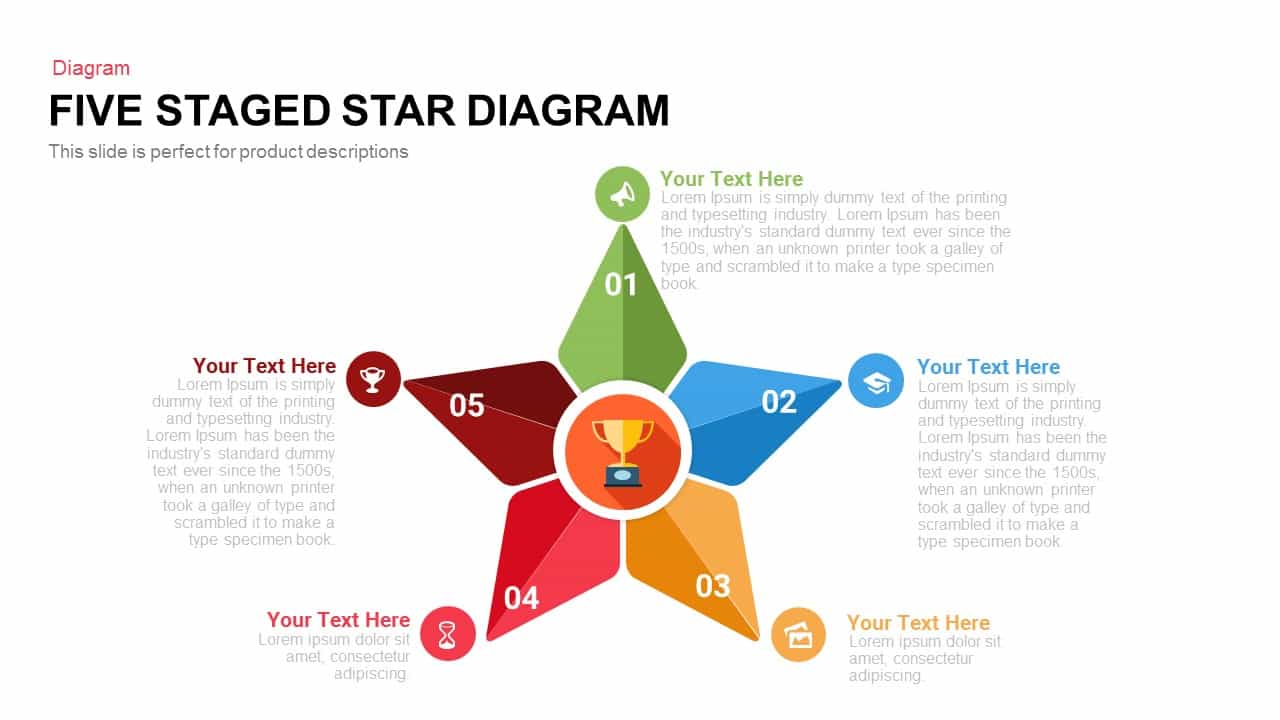
Five-Stage Star Diagram for Milestones Template for PowerPoint & Google Slides
Process
Five-Stage Pyramid Infographics Diagram Template for PowerPoint & Google Slides
Pyramid
Five-Stage Zig-Zag Arrow Diagram Template for PowerPoint & Google Slides
Process
Modern Five-Stage Cycle Process Diagram Template for PowerPoint & Google Slides
Process
Engaging Five-Stage Process Diagram Template for PowerPoint & Google Slides
Process
Four and Five-Stage Funnel Diagram Template for PowerPoint & Google Slides
Funnel
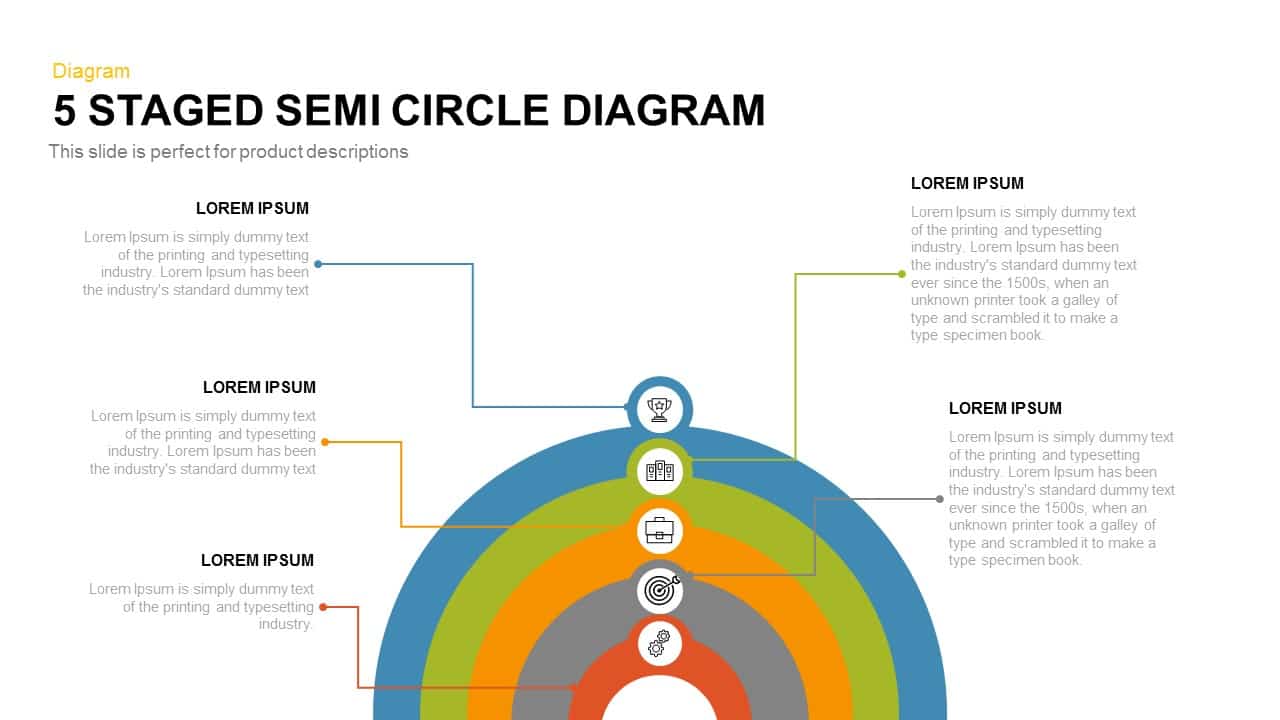
Five-Stage Semi-Circle Diagram Template for PowerPoint & Google Slides
Process
Five-Stage Circle Arrow Diagram Template for PowerPoint & Google Slides
Circular
Five-Stage Pentagon Arrow Diagram Template for PowerPoint & Google Slides
Arrow
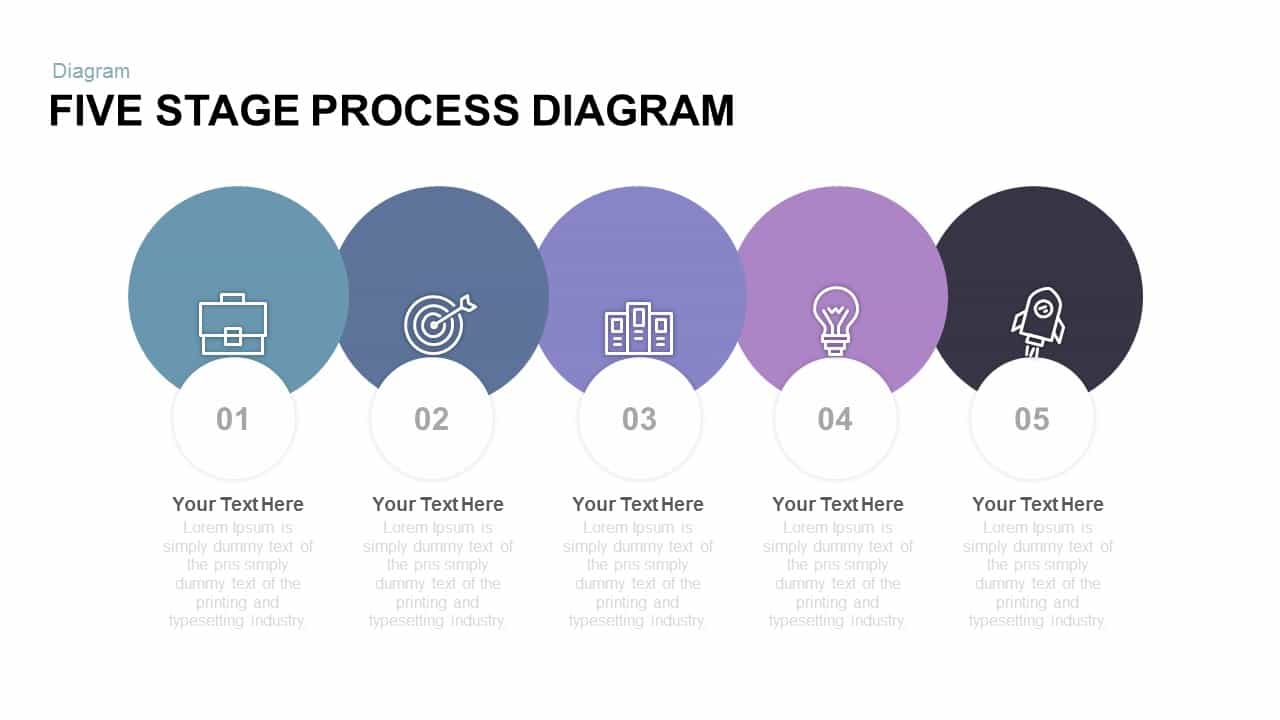
Five Stage Process Diagram Infographic Template for PowerPoint & Google Slides
Process
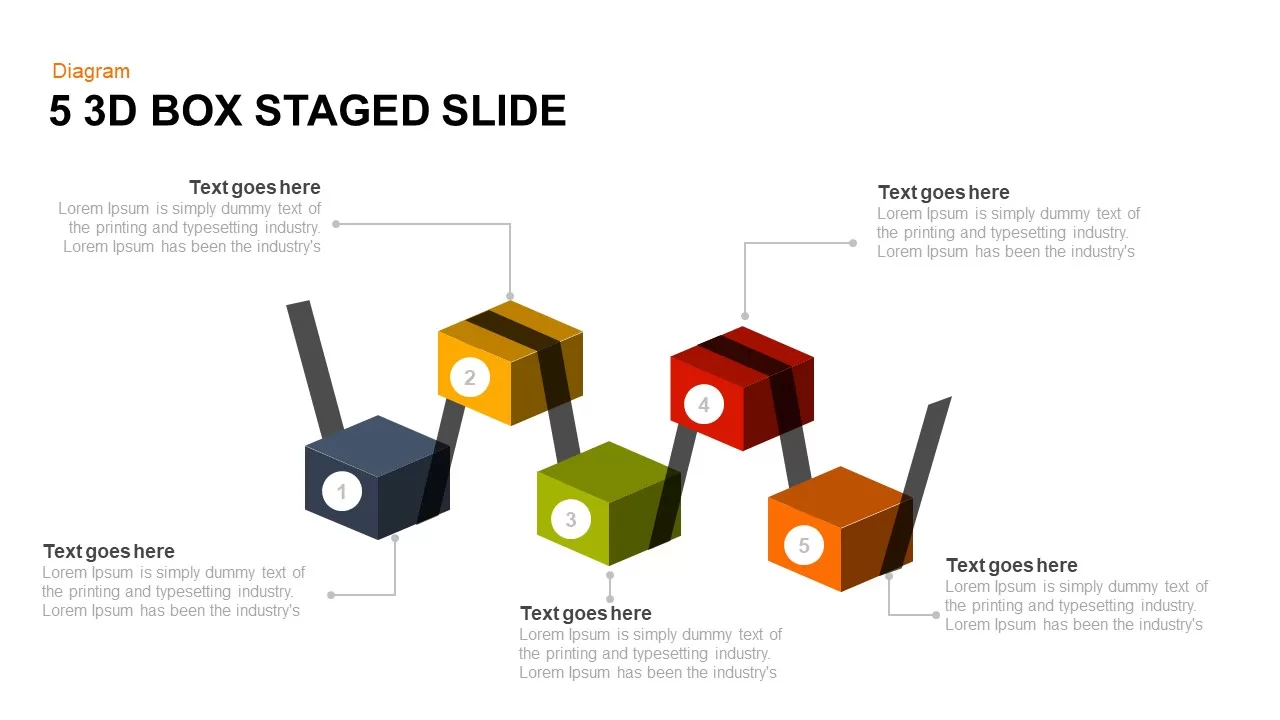
Five-Stage 3D Box Flow Diagram Template for PowerPoint & Google Slides
Process
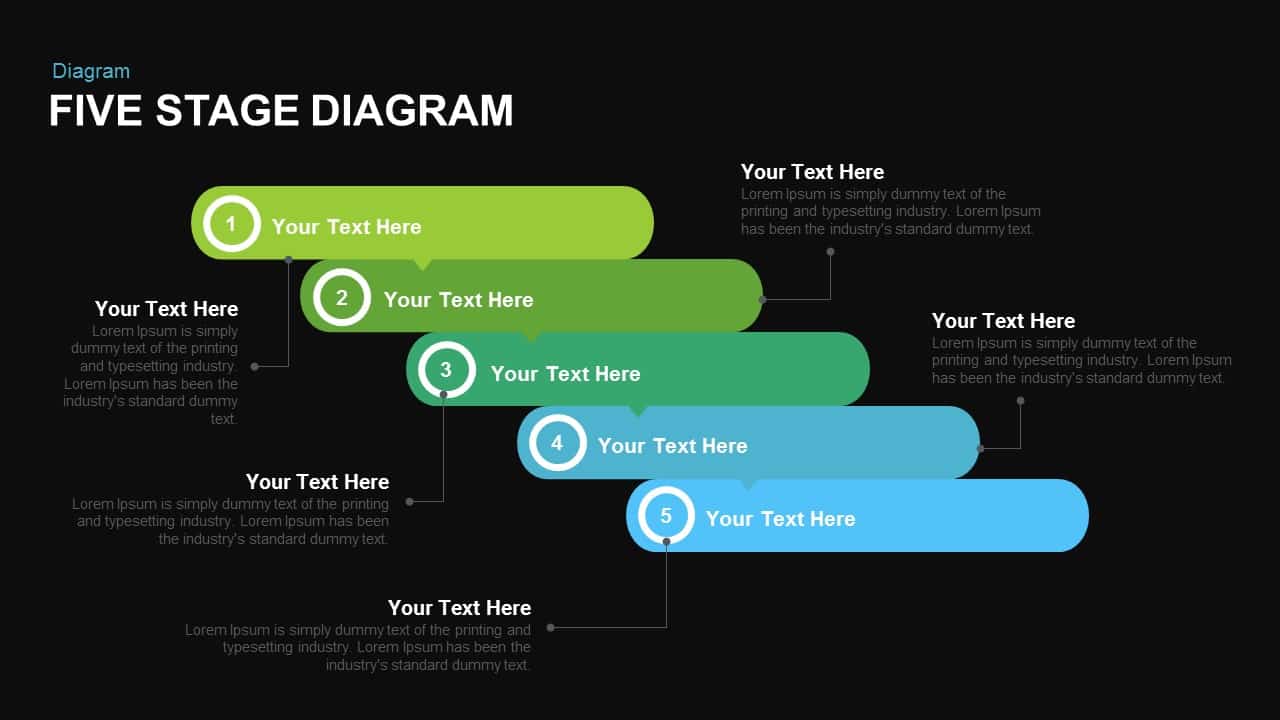
Five Stage Process Diagram template for PowerPoint & Google Slides
Process
Free

Five-Stage Cyclic Process Arrow Diagram Template for PowerPoint & Google Slides
Process
Five-Stage Process Diagram Template for PowerPoint & Google Slides
Process
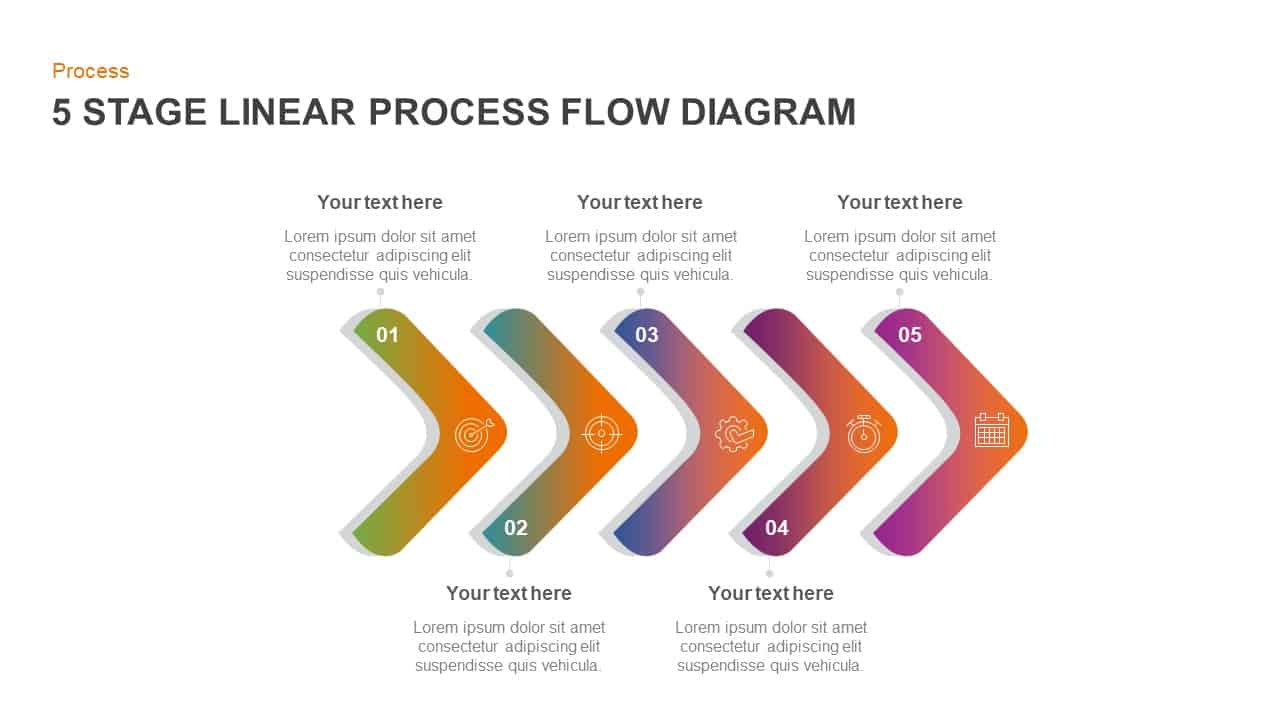
Five Stage Linear Process Flow Diagram Template for PowerPoint & Google Slides
Process
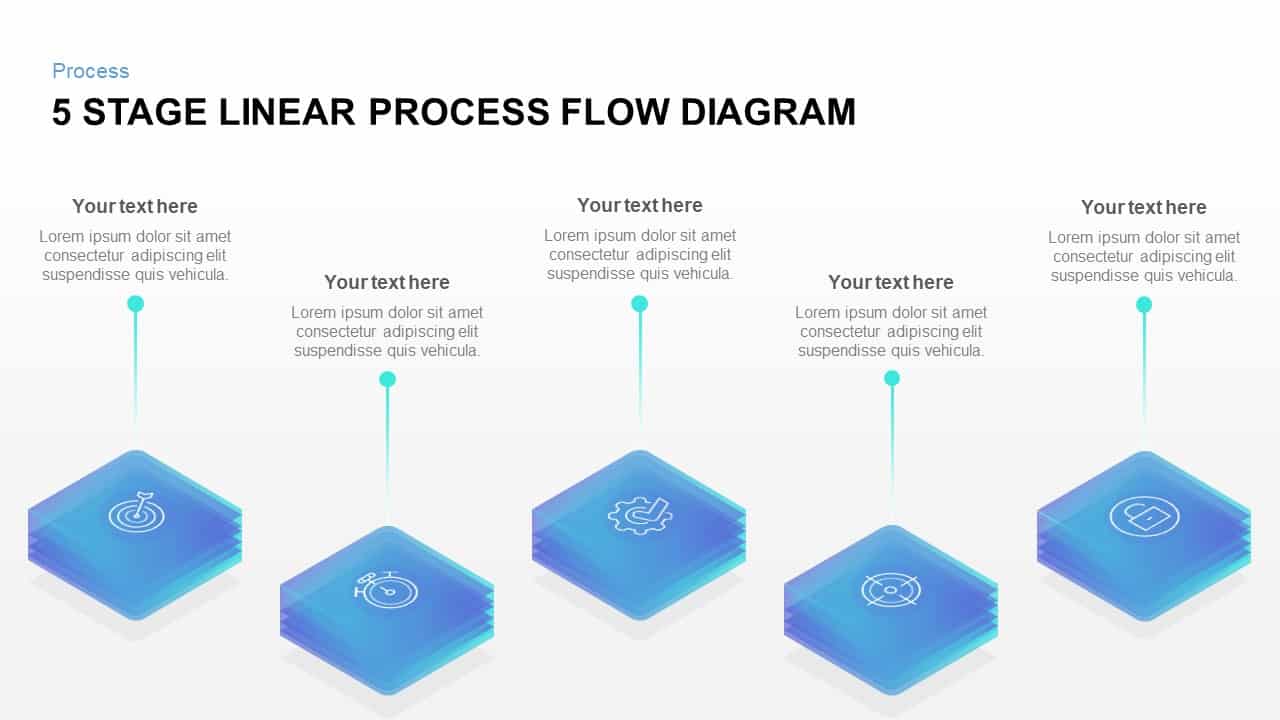
Five-Stage Linear Process Flow Diagram Template for PowerPoint & Google Slides
Process
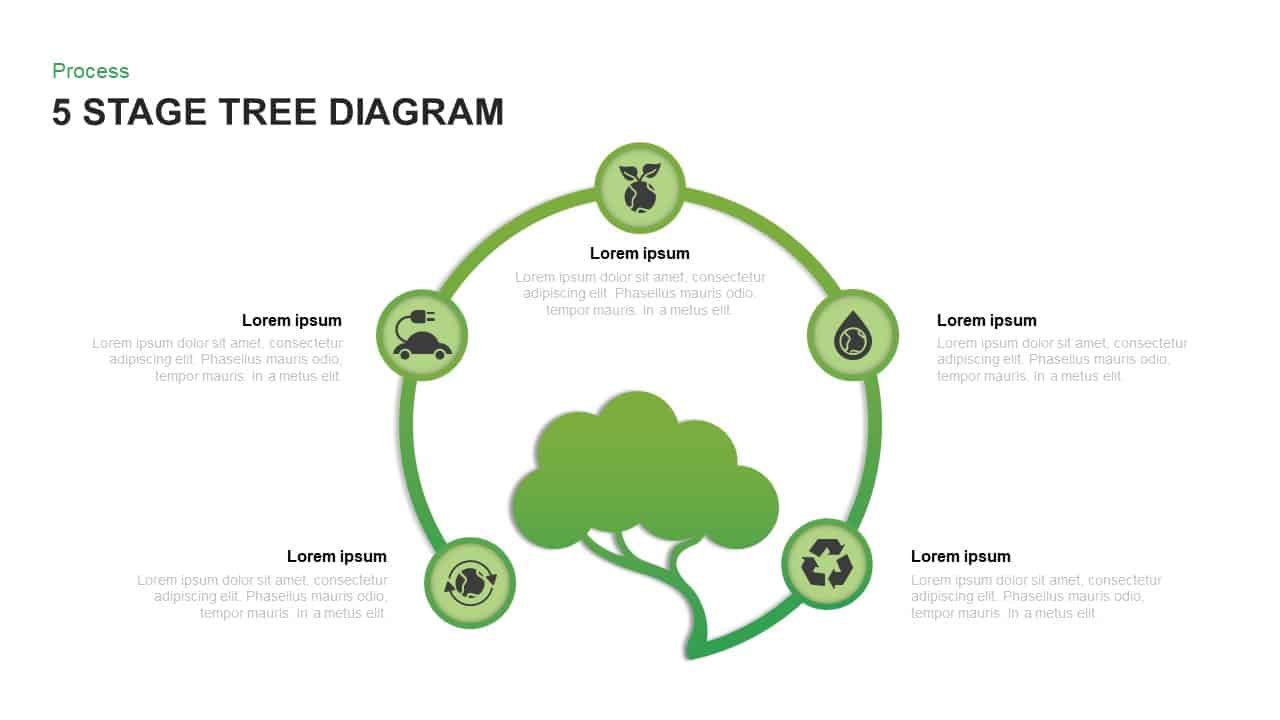
Five-Stage Eco Tree Process Diagram Template for PowerPoint & Google Slides
Process
Five-Stage Circular Infographic Diagram Template for PowerPoint & Google Slides
Process
Five-Stage Circular Process Diagram Template for PowerPoint & Google Slides
Circular
Five-Stage Agenda Flow Diagram Template for PowerPoint & Google Slides
Agenda
Five Stage Circular Arrow Diagram Template for PowerPoint & Google Slides
Process
Five-Stage Circular Process Flow Diagram Template for PowerPoint & Google Slides
Circular
Five-Stage Slanted Timeline Diagram Template for PowerPoint & Google Slides
Timeline
Five-Stage Circular Flow Diagram Template for PowerPoint & Google Slides
Circular
Five-Stage Pipe Process Diagram Template for PowerPoint & Google Slides
Process
Five-Stage Process Flow Diagram Template for PowerPoint & Google Slides
Process
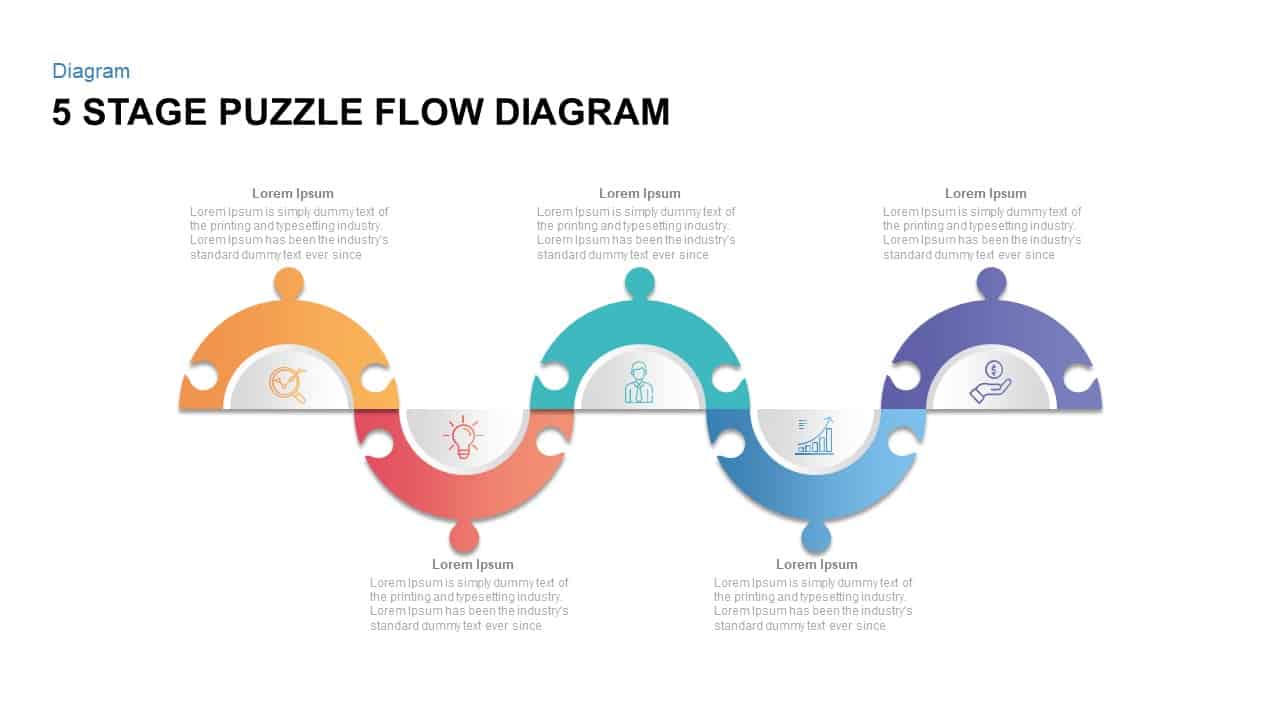
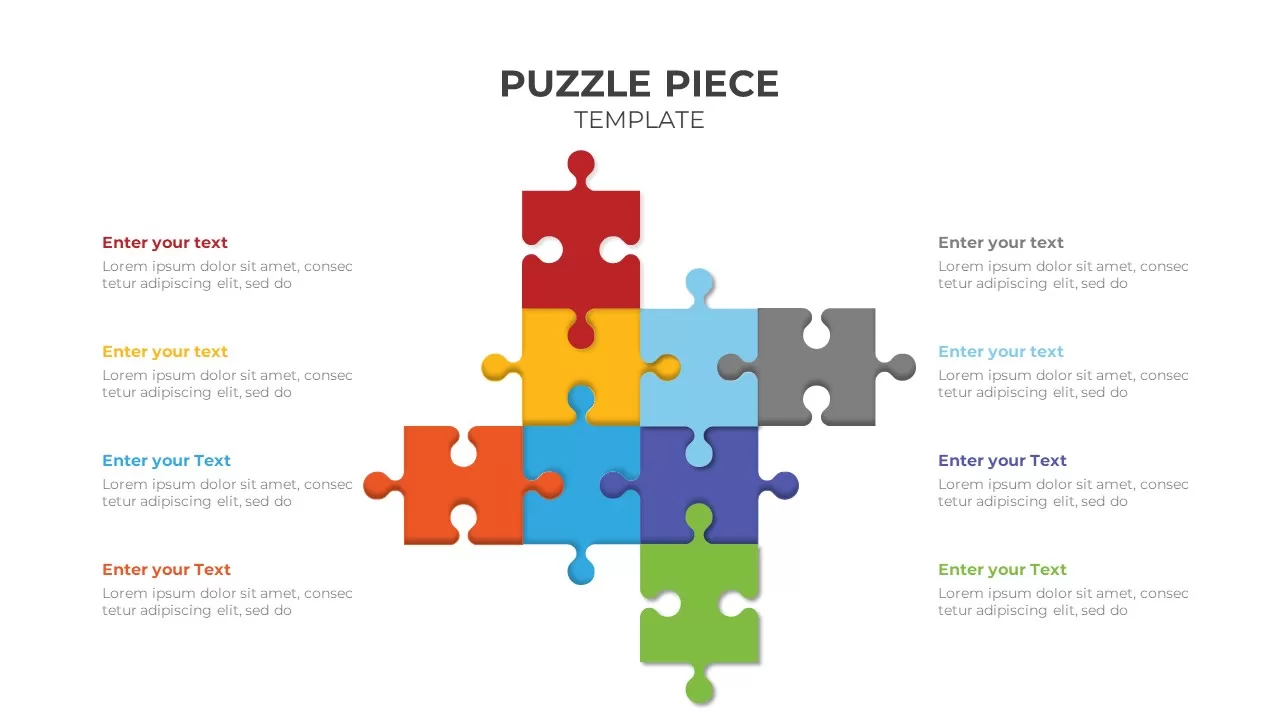
Five Stage Puzzle Flow Diagram Template for PowerPoint & Google Slides
Process
Five-Stage Digital Maturity Model Diagram Template for PowerPoint & Google Slides
Process
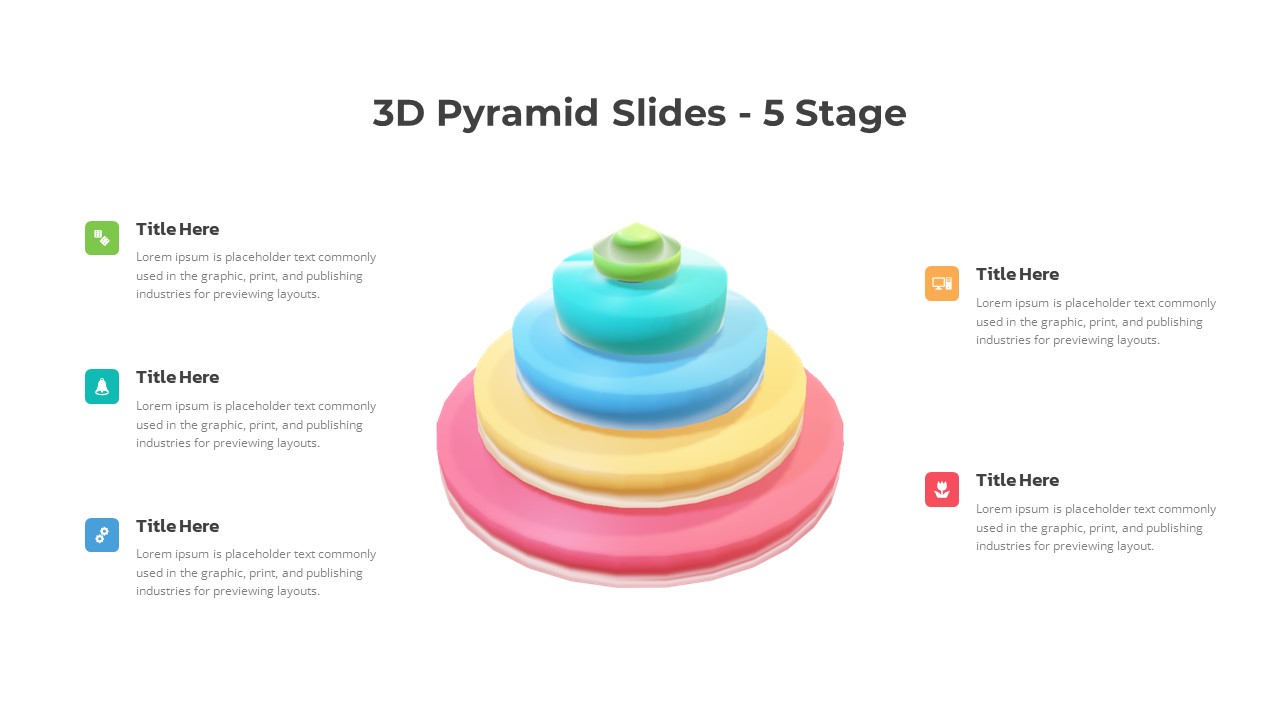
3D Five-Stage Pyramid Diagram Slide Template for PowerPoint & Google Slides
Pyramid
Five and Six Step Line Linear Stage Diagram for PowerPoint & Google Slides
Infographics
7-Stage Colorful Timeline Infographic Template for PowerPoint & Google Slides
Timeline
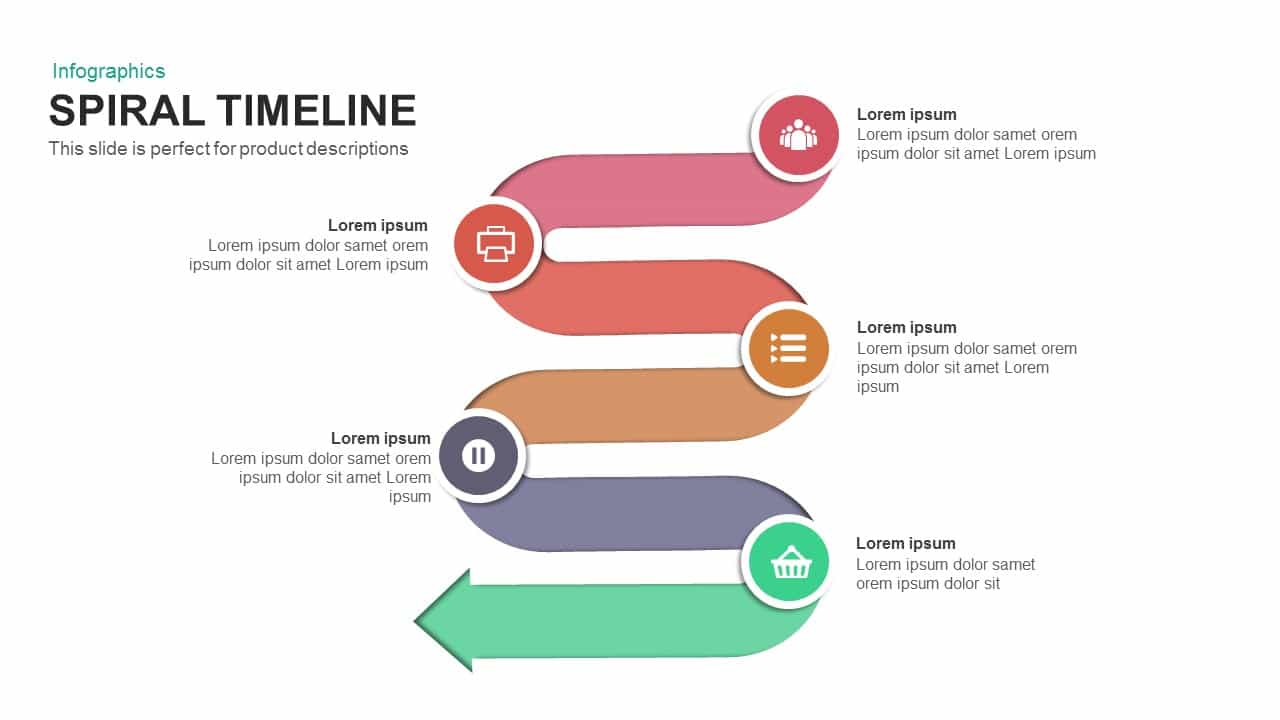
Six-Stage Colorful Spiral Timeline Template for PowerPoint & Google Slides
Timeline
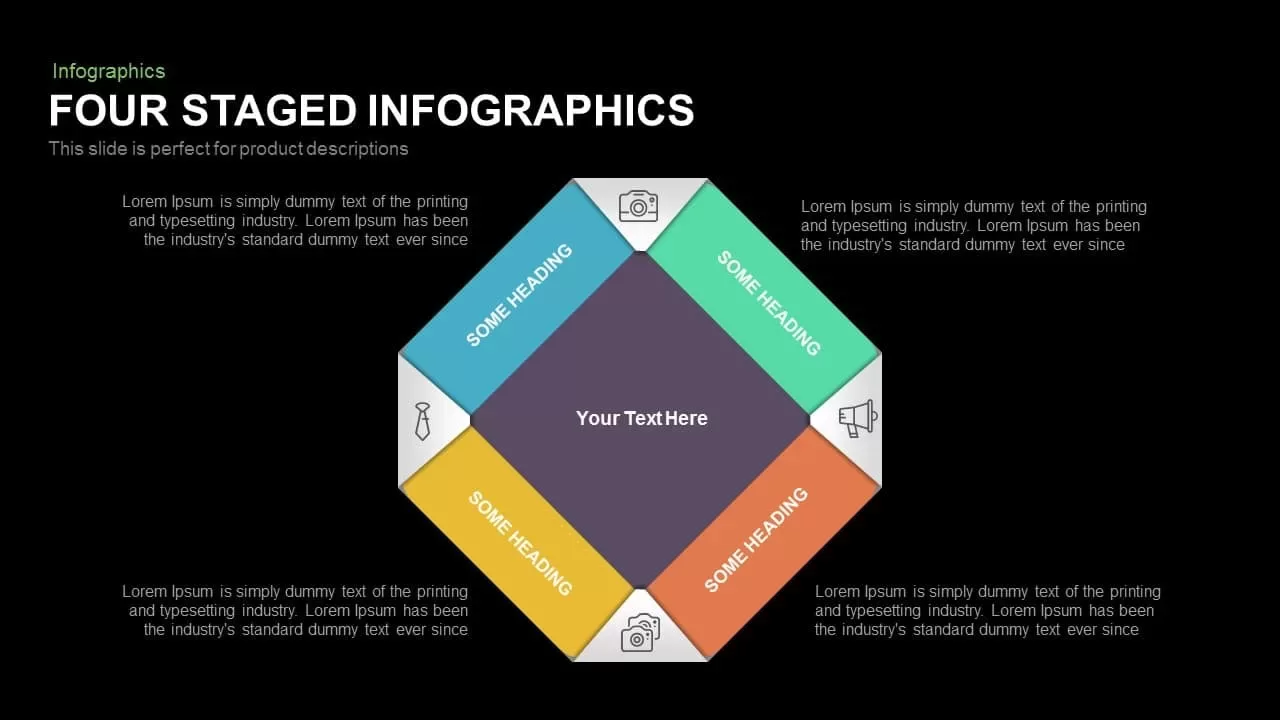
Colorful Four-Stage Infographic Process Template for PowerPoint & Google Slides
Process
Colorful Nine-Stage Agenda Slide Template for PowerPoint & Google Slides
Agenda
Five Stage Linear Process Flow Template for PowerPoint & Google Slides
Process
Three Four Five Stage Timeline Infographic Template for PowerPoint & Google Slides
Timeline
Five-Stage People Infographic Chart template for PowerPoint & Google Slides
Process
Five-Stage Arrow Infographics Timeline Template for PowerPoint & Google Slides
Arrow
Five-Stage Hexagon Process Infographics template for PowerPoint & Google Slides
Process
Five-Stage Direct Flow Arrow Process Template for PowerPoint & Google Slides
Arrow
Five-Stage Growth Arrow Infographic Template for PowerPoint & Google Slides
Arrow
Wavy Five-Stage Transformation Flow Template for PowerPoint & Google Slides
Process
Isometric Five-Stage Process Flow Template for PowerPoint & Google Slides
Process
Five-Stage Pyramid Infographics Process Template for PowerPoint & Google Slides
Pyramid
Gradient Chevron Five-Stage Process Flow Template for PowerPoint & Google Slides
Arrow
Five-Stage Vertical Bar Process Template for PowerPoint & Google Slides
Process
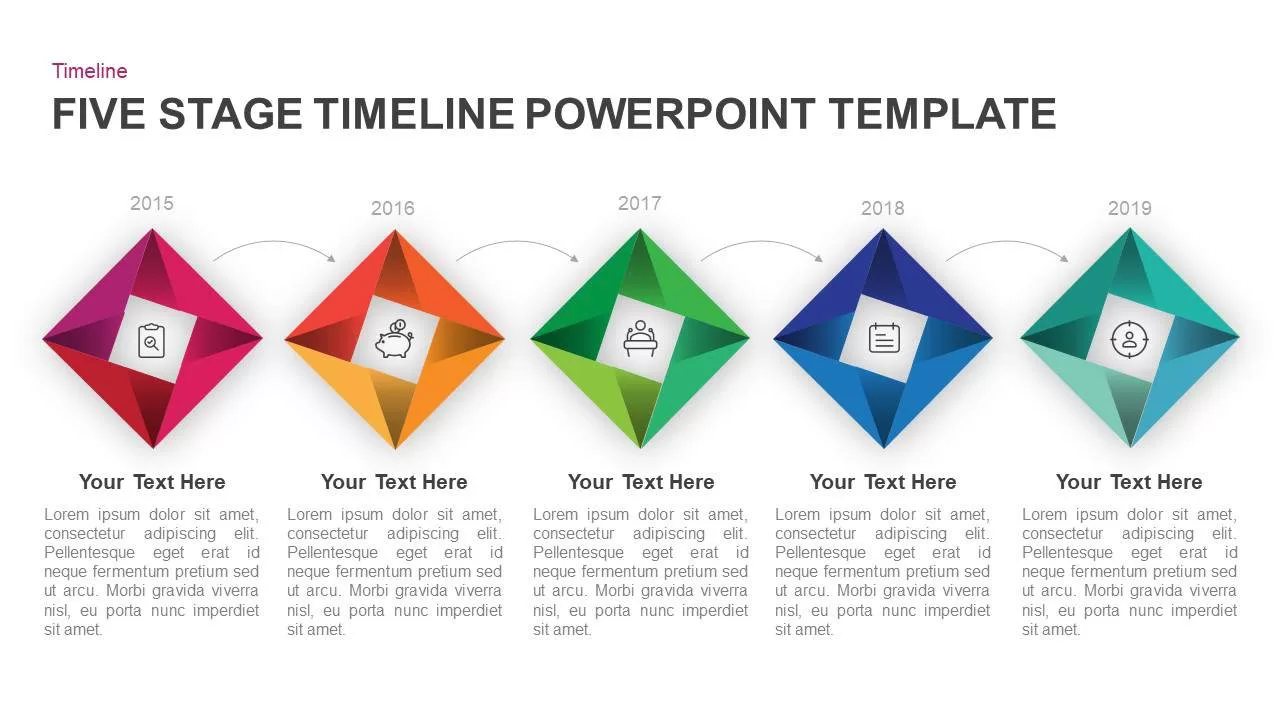
Five-Stage Diamond Timeline Chart Template for PowerPoint & Google Slides
Timeline
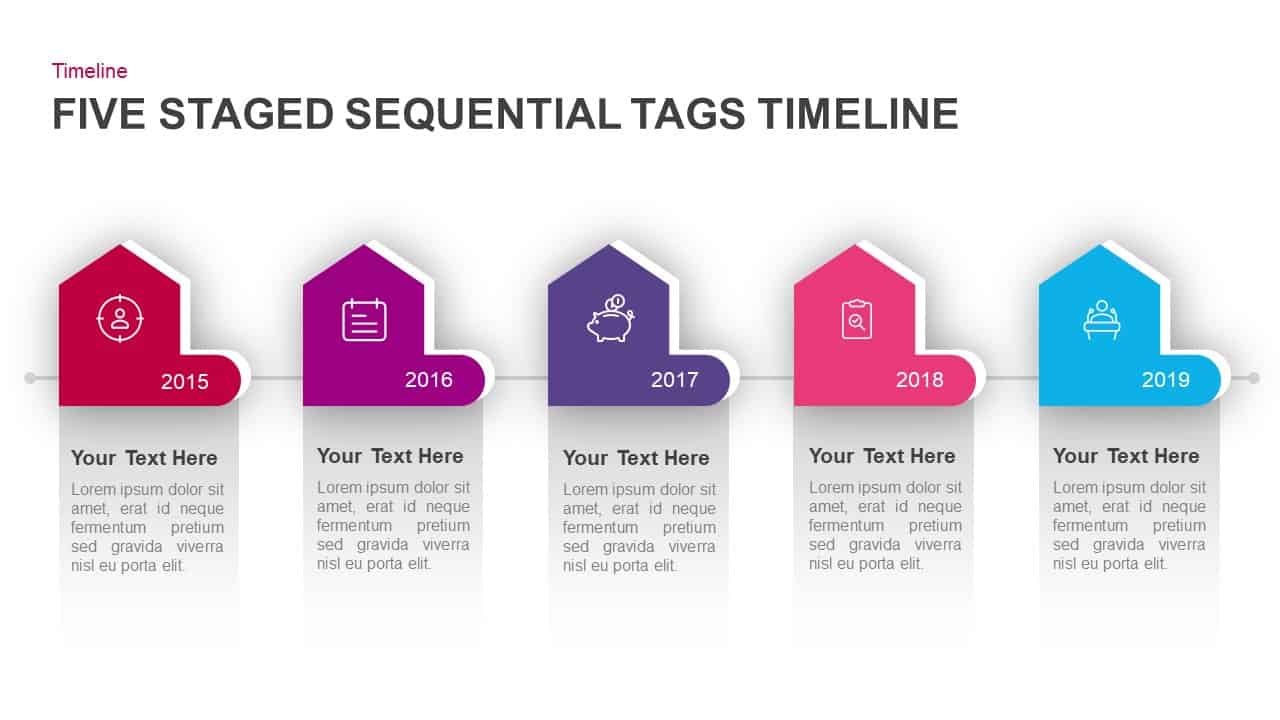
Five-Stage Sequential Tags Timeline Template for PowerPoint & Google Slides
Timeline
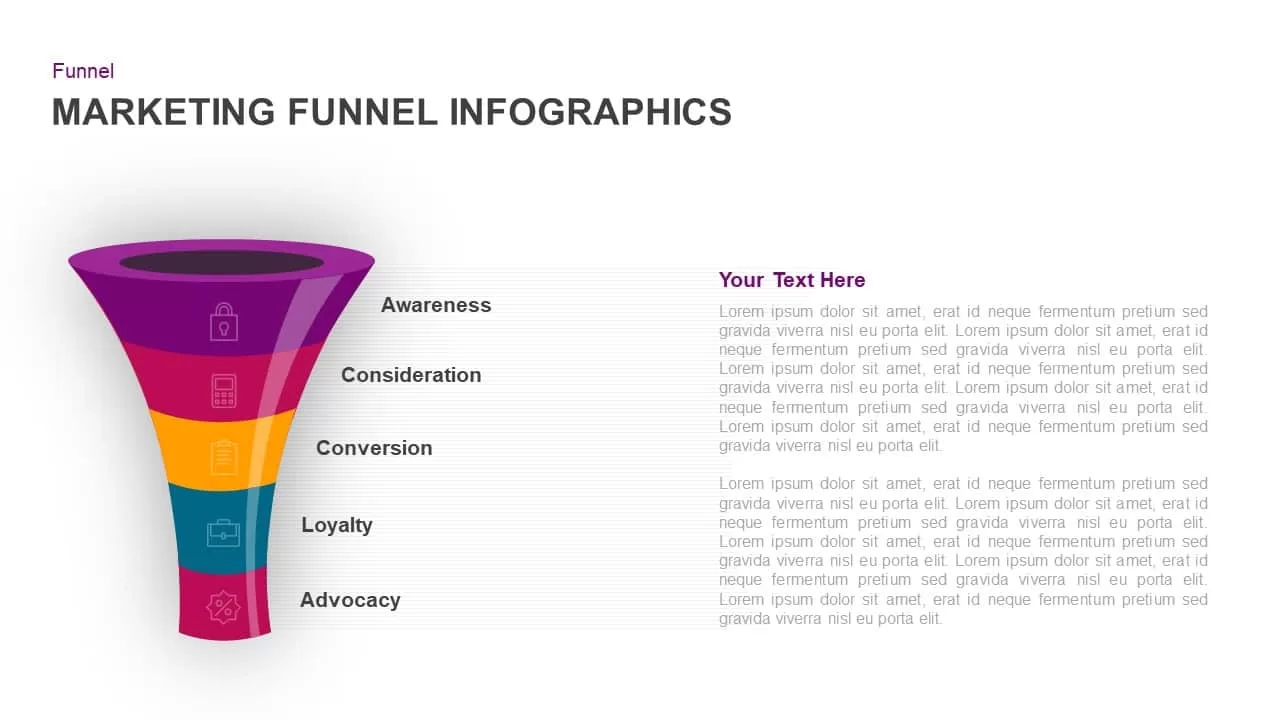
Five-Stage Marketing Funnel Infographic Template for PowerPoint & Google Slides
Funnel
Five-Stage Circular Arrow Infographic Template for PowerPoint & Google Slides
Circular
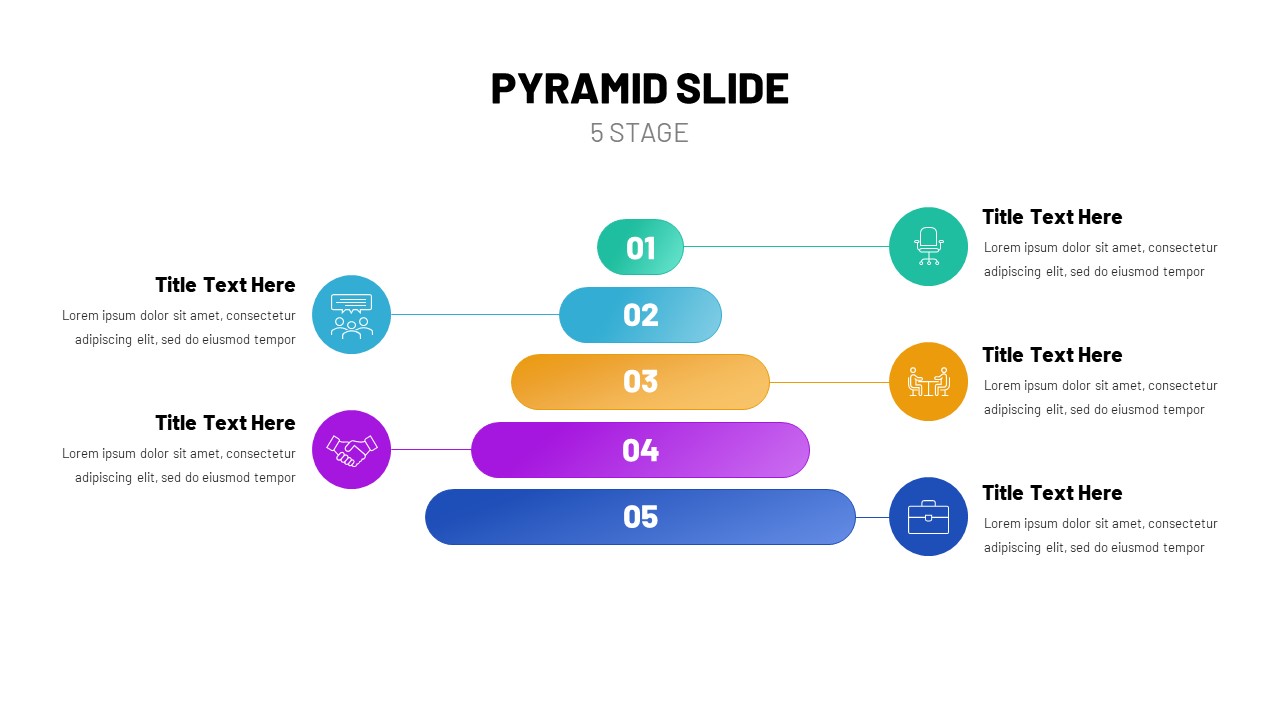
Five-Stage Pyramid Process Slide Template for PowerPoint & Google Slides
Pyramid
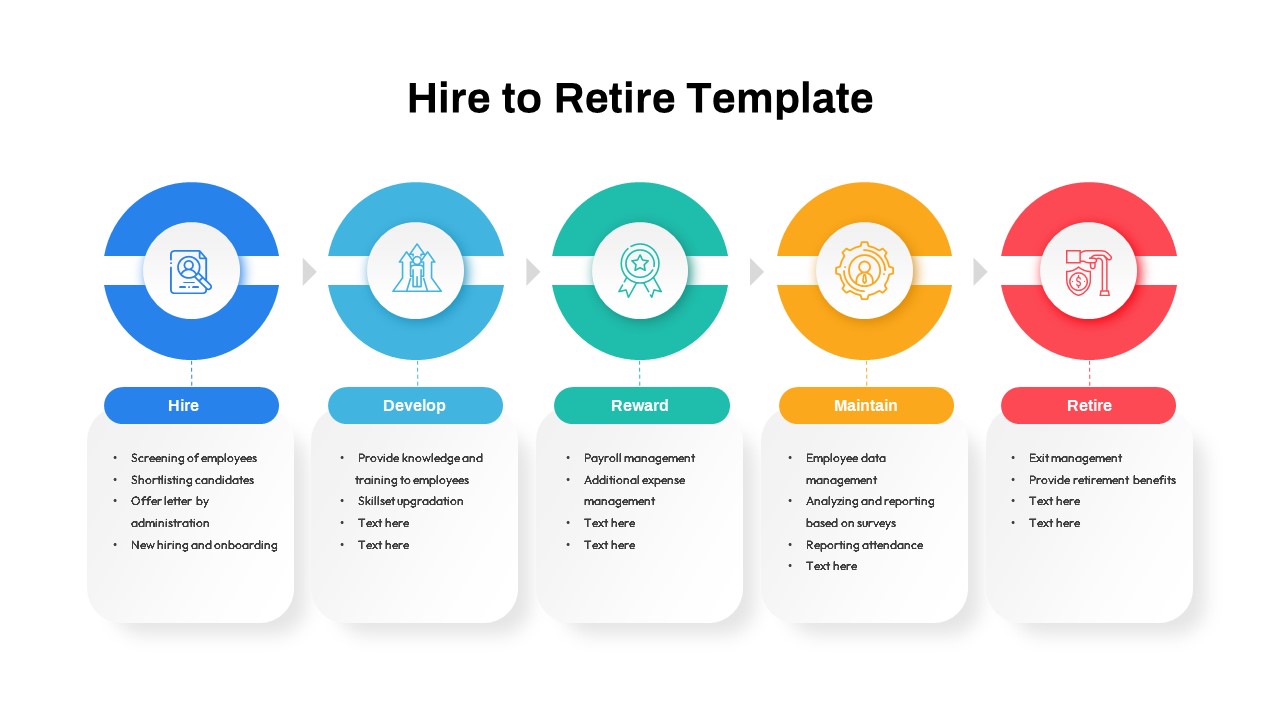
Five-Stage Hire to Retire HR Lifecycle Template for PowerPoint & Google Slides
Recruitment
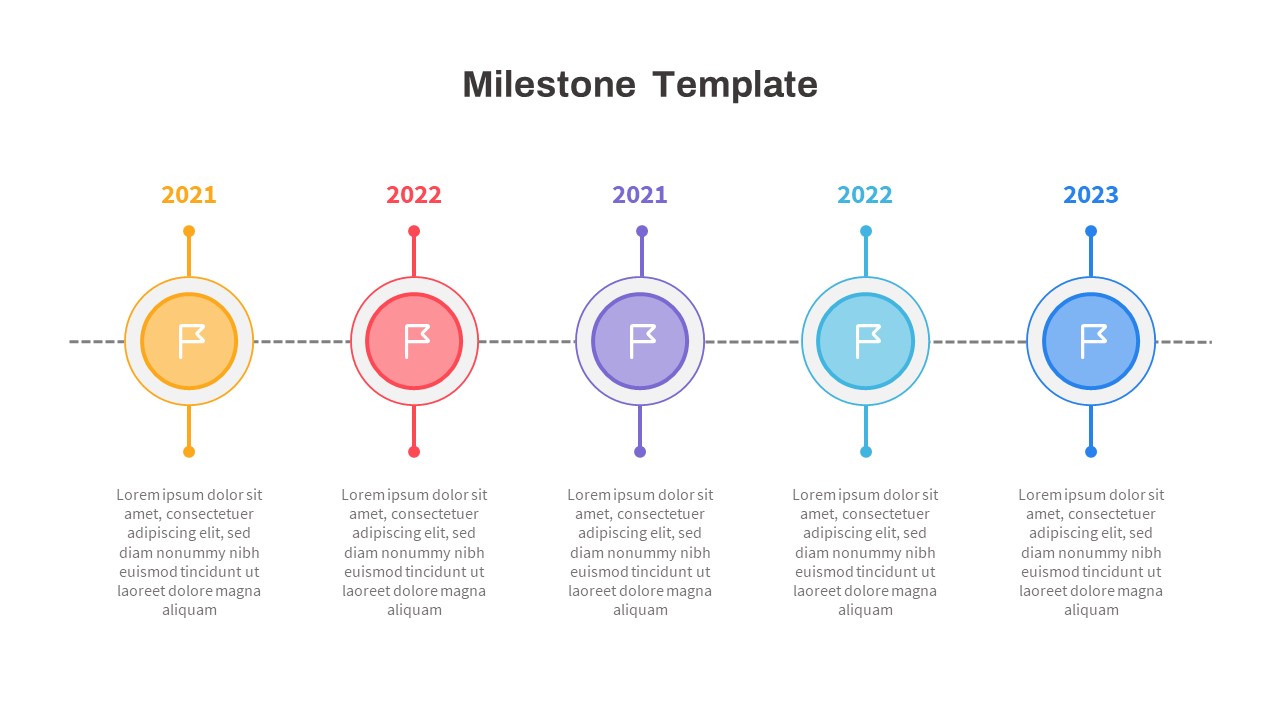
Free Multicolor Five-Stage Milestone Timeline Template for PowerPoint & Google Slides
Timeline
Free
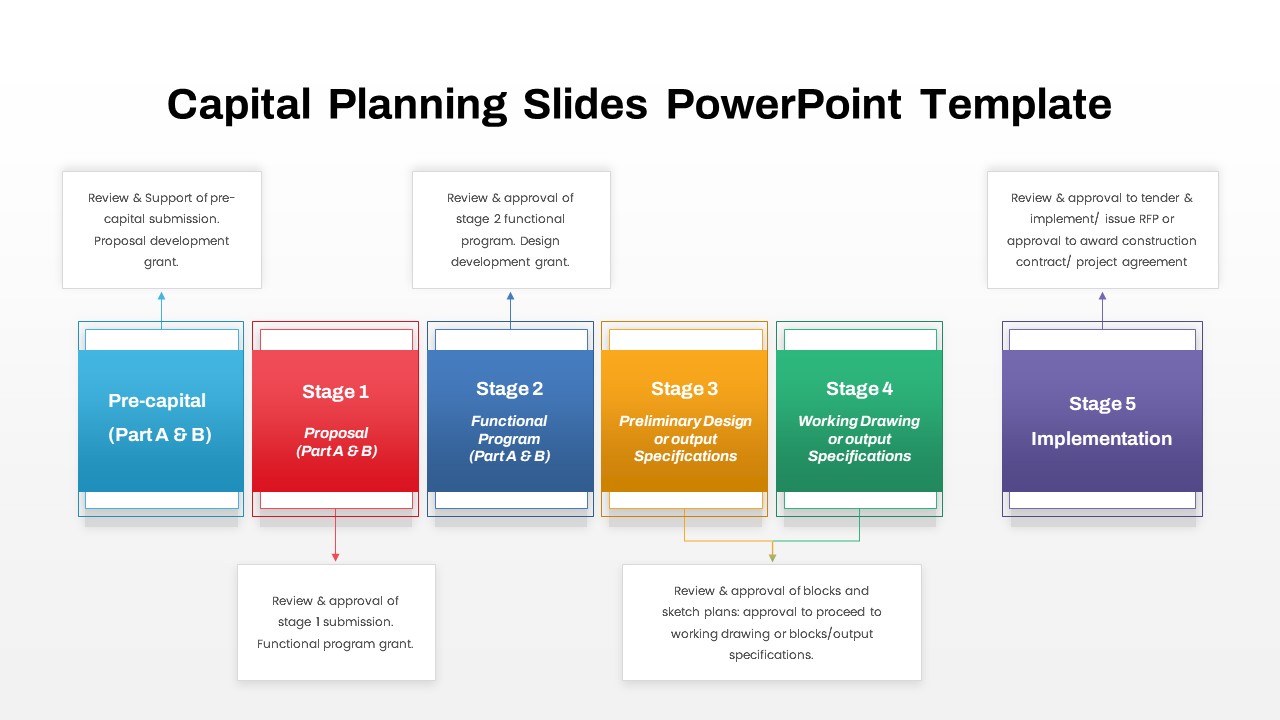
Capital Planning Five-Stage Process template for PowerPoint & Google Slides
Process
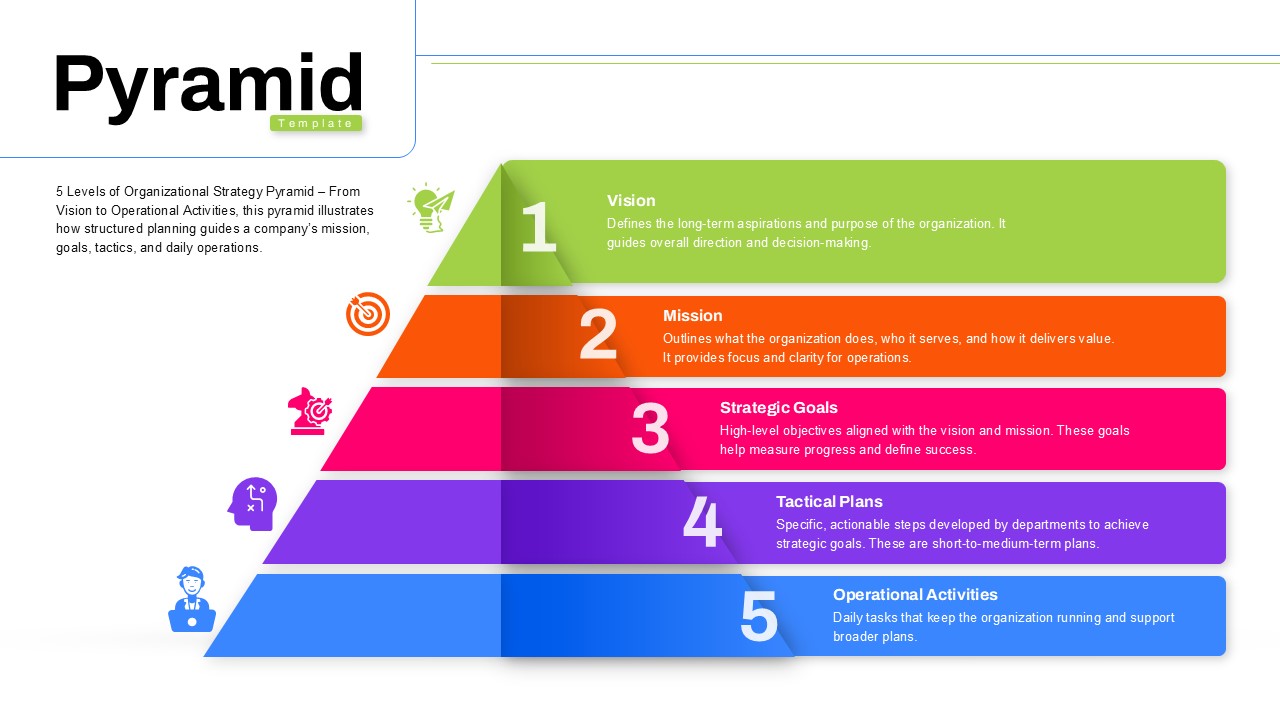
Five-Stage Pyramid Template for PowerPoint & Google Slides
Pyramid

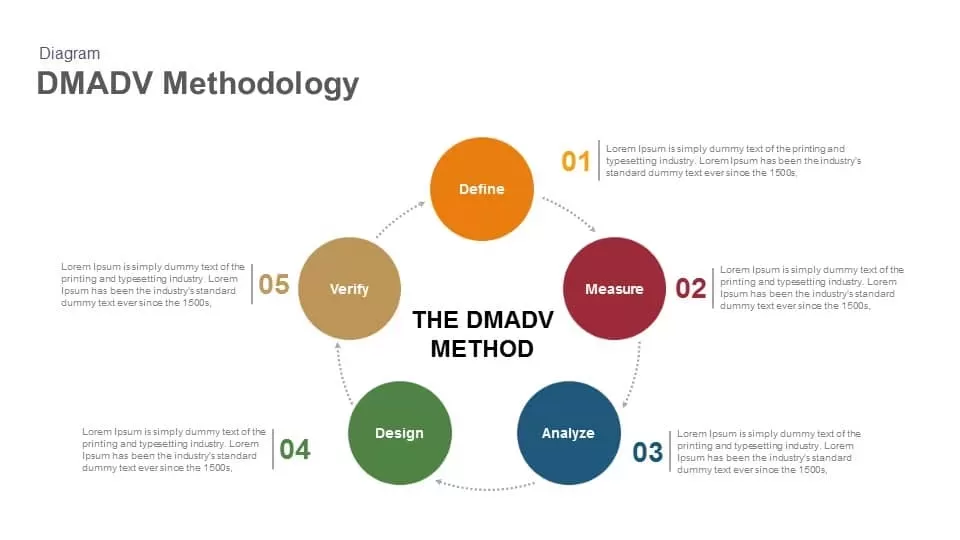
DMADV Methodology Diagram template for PowerPoint & Google Slides
Process
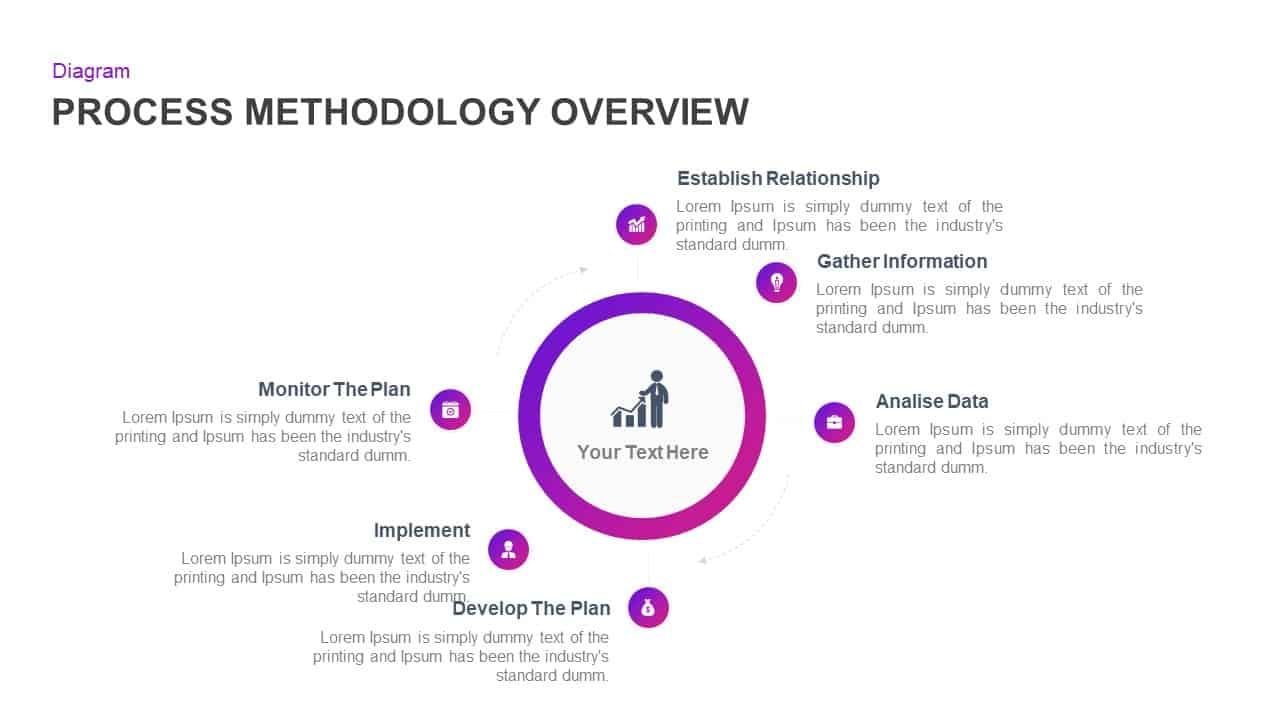
Process Methodology Overview Diagram Template for PowerPoint & Google Slides
Process

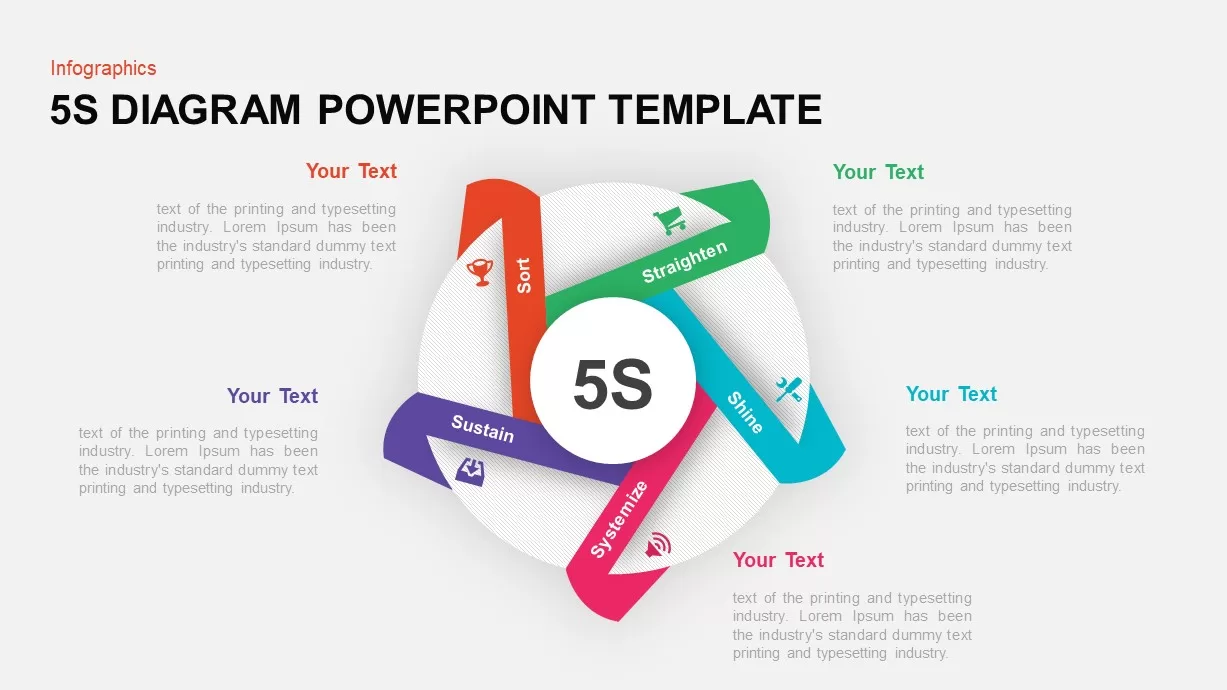
5S Lean Methodology Circular Diagram Template for PowerPoint & Google Slides
Process
4-Step Methodology Diagram Template for PowerPoint & Google Slides
Process
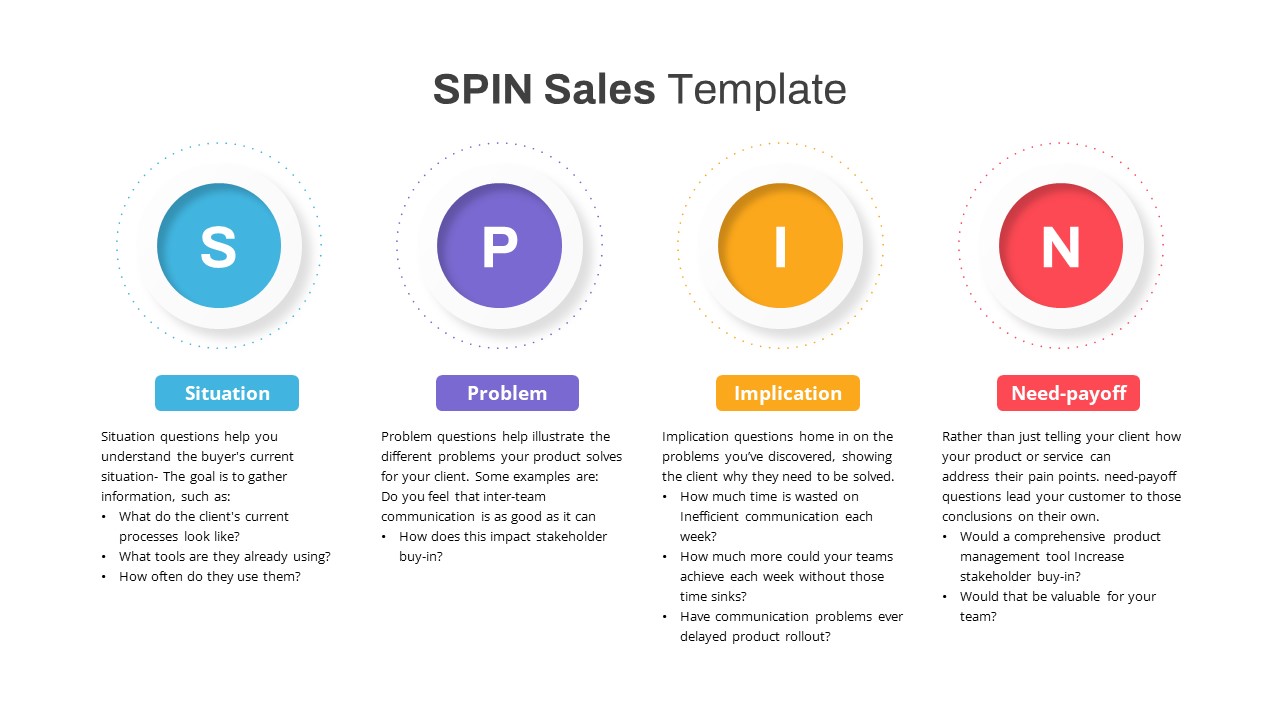
SPIN Sales Methodology Diagram Template for PowerPoint & Google Slides
Process
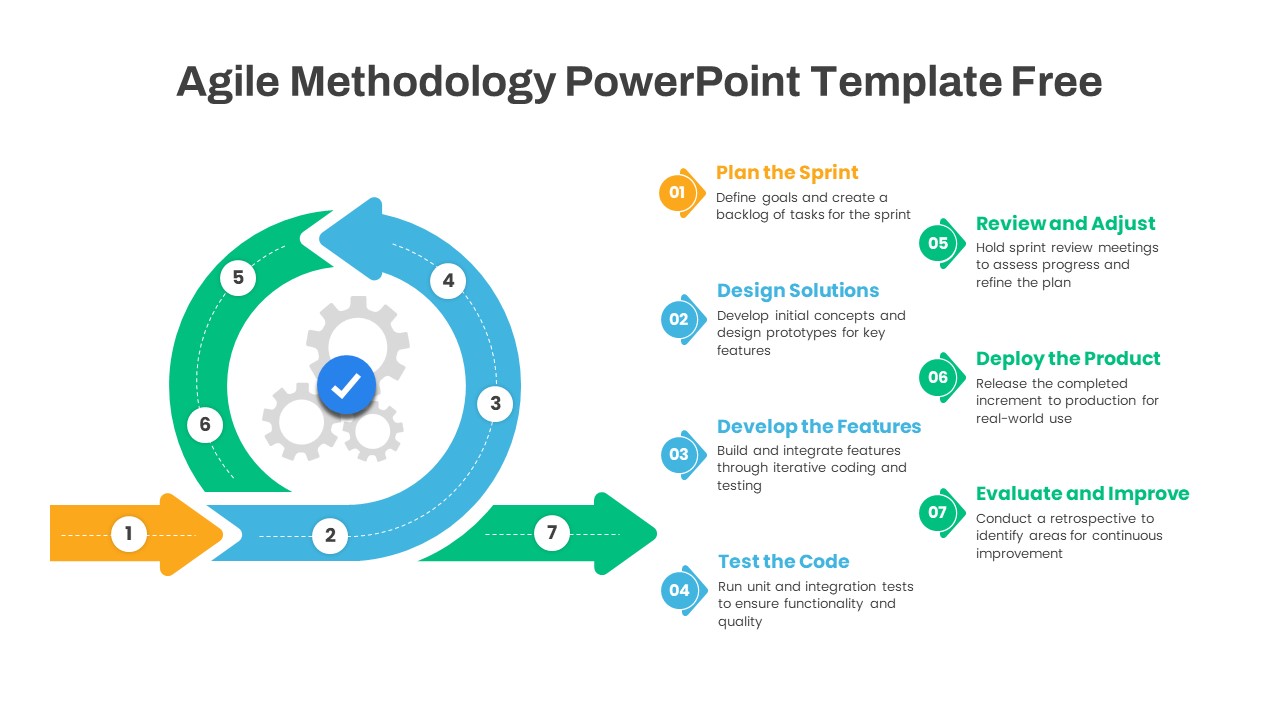
Agile Methodology Cycle Diagram Template for PowerPoint & Google Slides
Project
Free
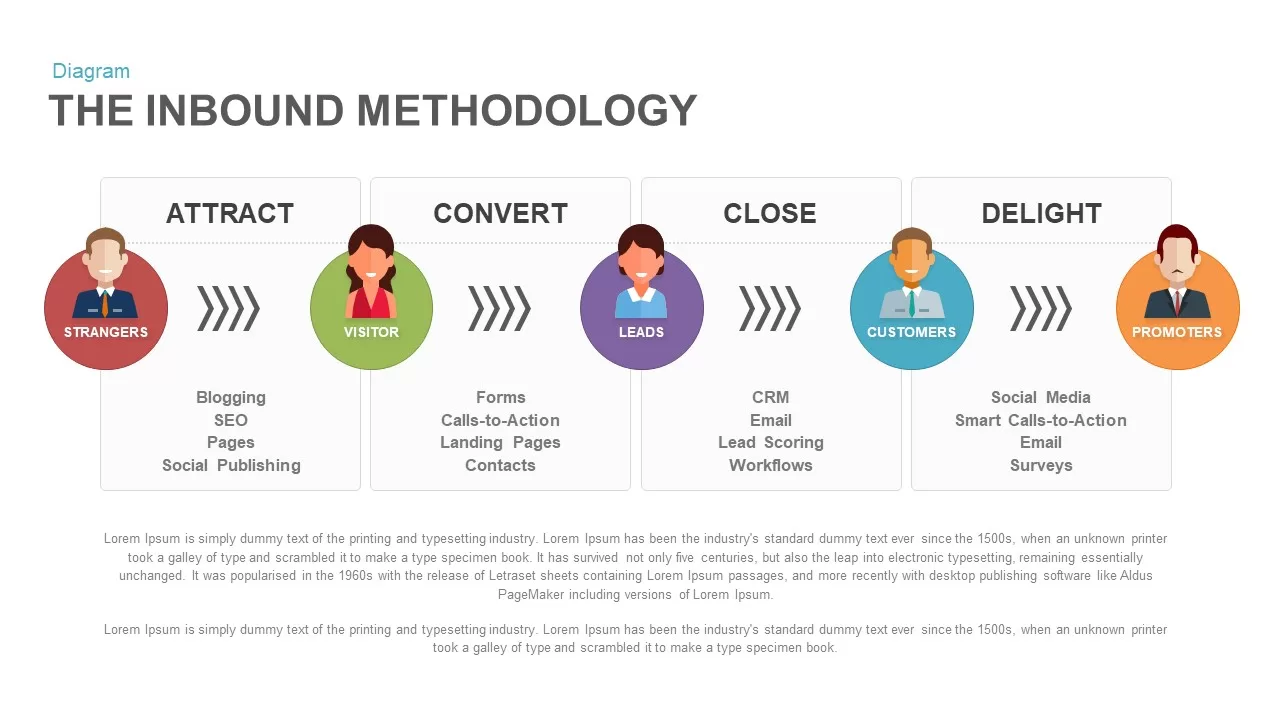
Inbound Methodology Process Diagram for PowerPoint & Google Slides
Process
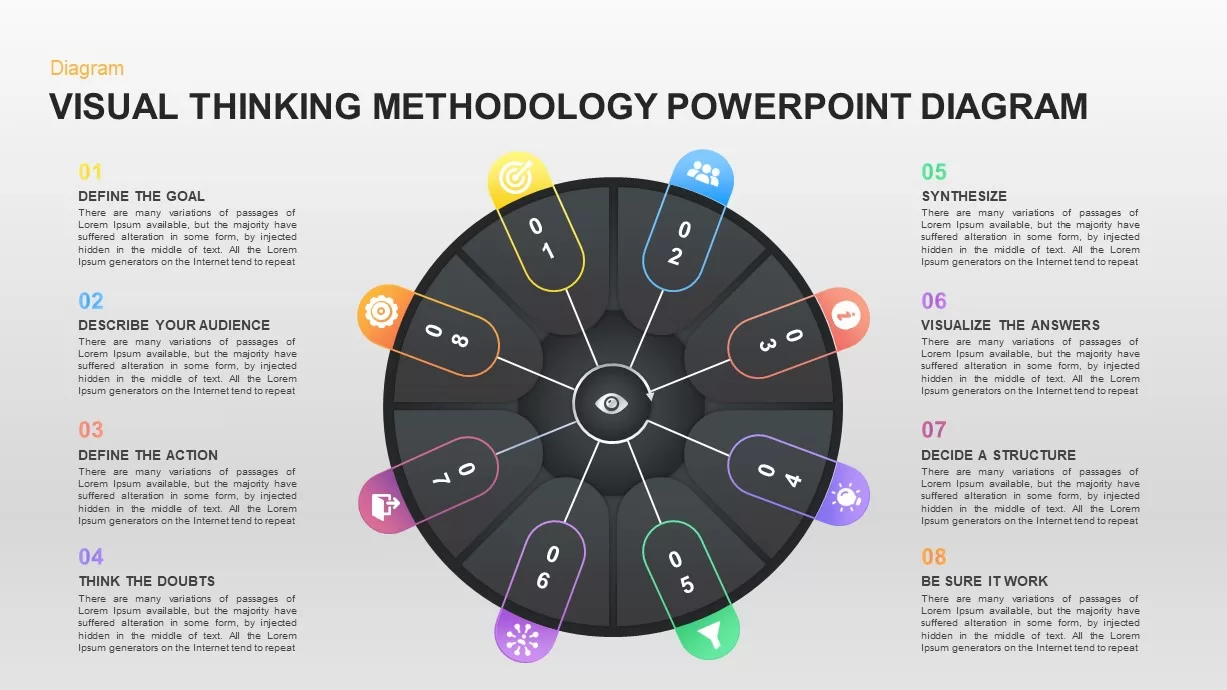
Visual Thinking Methodology diagram for PowerPoint & Google Slides
Process
Colorful Arrow Process Diagram Template for PowerPoint & Google Slides
Arrow
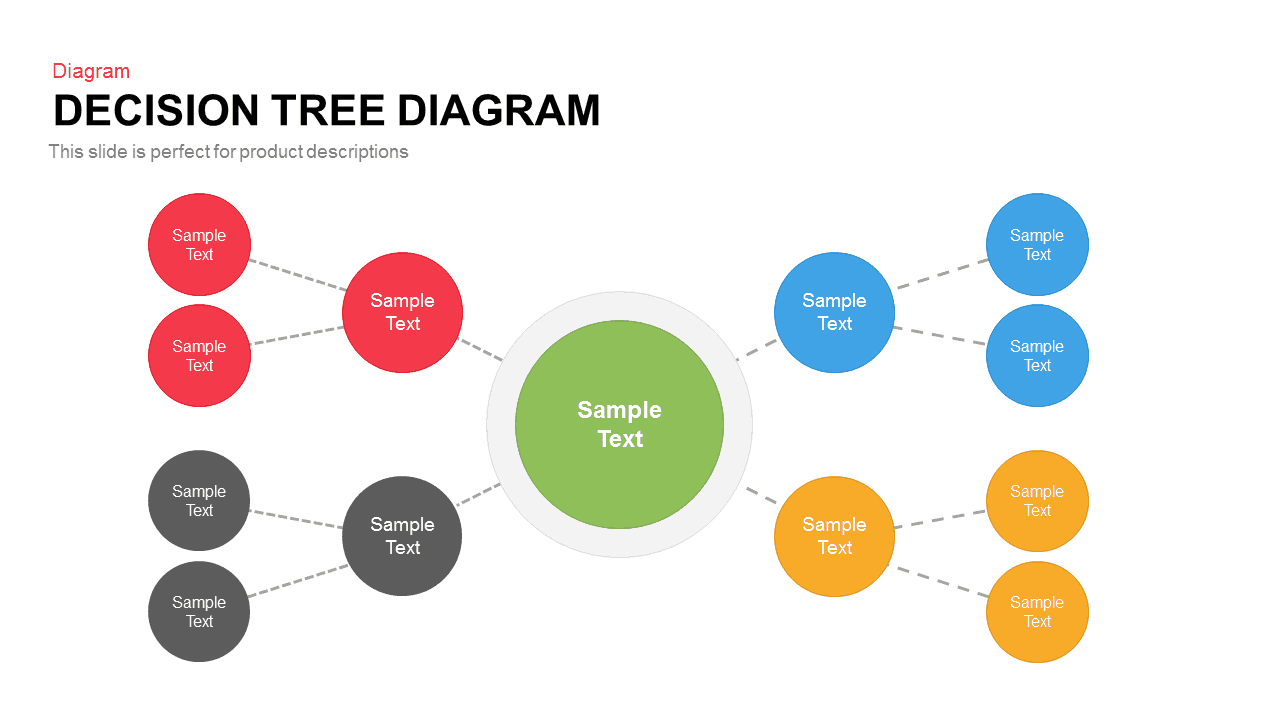
Colorful Decision Tree Diagram template for PowerPoint & Google Slides
Decision Tree
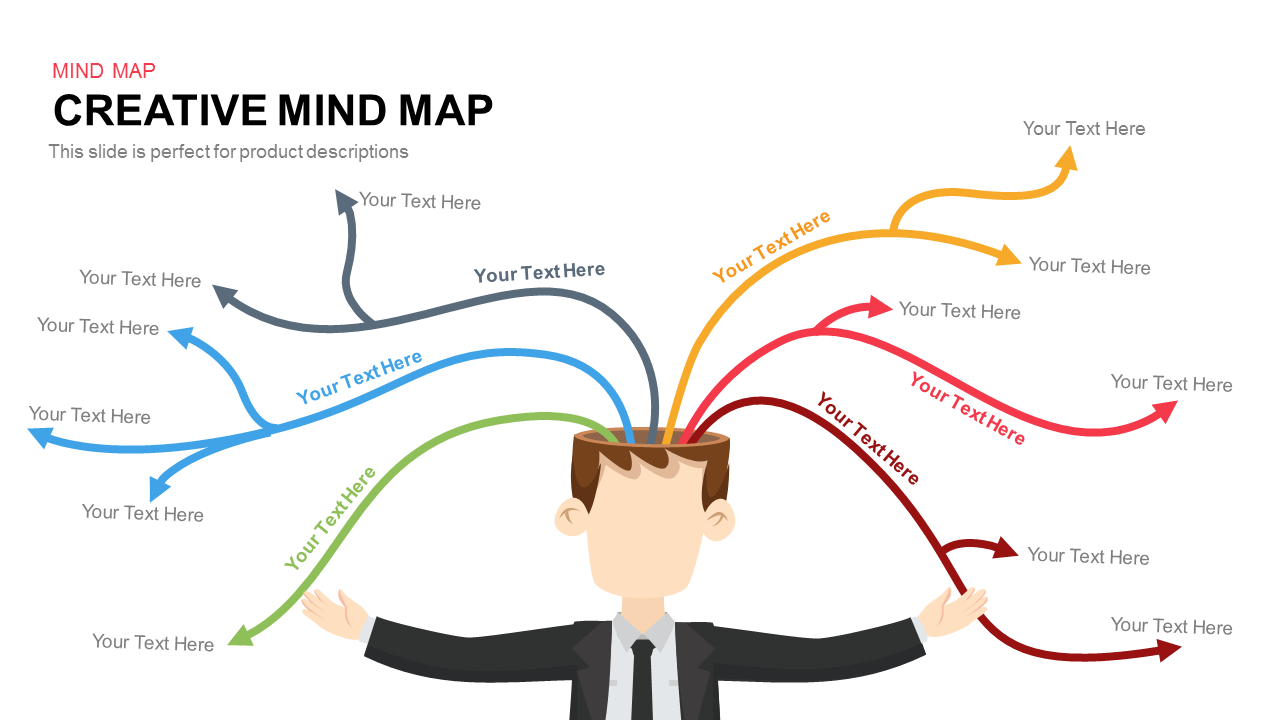
Colorful Creative Mind Map Diagram template for PowerPoint & Google Slides
Mind Maps
Colorful Modern CRM Gear Diagram Template for PowerPoint & Google Slides
Customer Experience
Colorful Venn Diagram Infographics Template for PowerPoint & Google Slides
Circular
Colorful Circular Puzzle Diagram Template for PowerPoint & Google Slides
Circular
5-Step Colorful Funnel Diagram Template for PowerPoint & Google Slides
Funnel
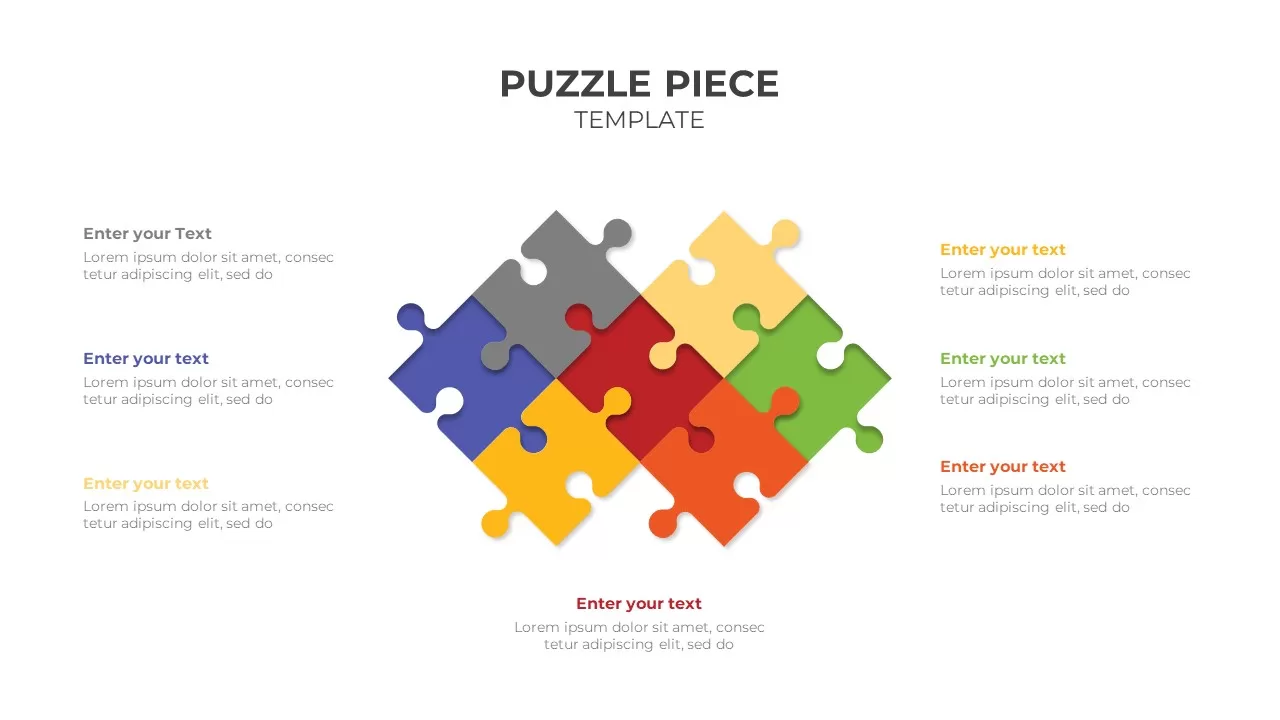
Colorful Six-Piece Puzzle Diagram Template for PowerPoint & Google Slides
Infographics
Colorful Eight-Piece Puzzle Diagram Template for PowerPoint & Google Slides
Process
Colorful Seven-Piece Puzzle Diagram Template for PowerPoint & Google Slides
Process
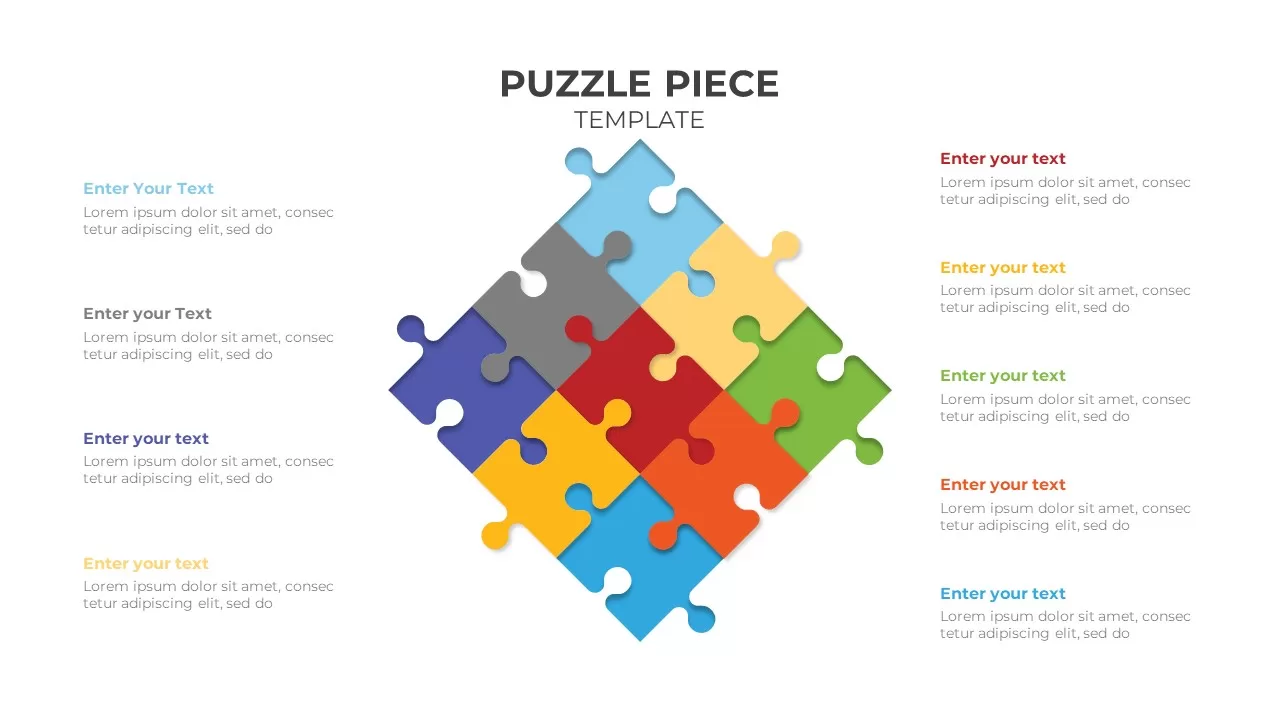
Colorful Nine-Piece Puzzle Diagram Template for PowerPoint & Google Slides
Process
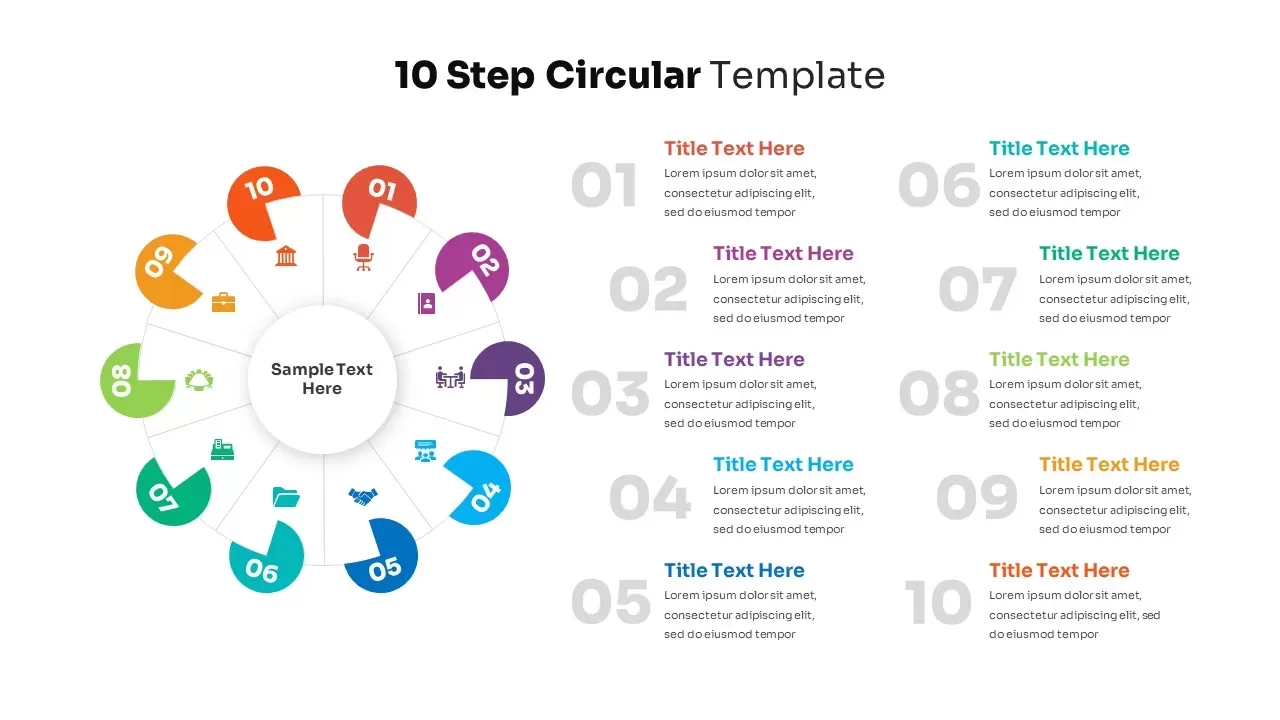
10-Step Colorful Circular Diagram Template for PowerPoint & Google Slides
Circular
Six-Step Colorful Flywheel Diagram Template for PowerPoint & Google Slides
Circular
Four-Level Colorful Pyramid Diagram Template for PowerPoint & Google Slides
Pyramid
Colorful Snake Process Diagram Template for PowerPoint & Google Slides
Process
Colorful SWOT Analysis Diagram Template for PowerPoint & Google Slides
SWOT
Colorful Startup Financing Cycle Diagram Template for PowerPoint & Google Slides
Finance
Four-Level Colorful Pyramid Diagram Template for PowerPoint & Google Slides
Pyramid
Colorful Layered Onion Diagram Slide for PowerPoint & Google Slides
Process
Free Colorful Tree Diagram for Growth & Strategy in PowerPoint & Google Slides
Infographics
Free
Colorful Venn Diagram with 4 Circle for PowerPoint & Google Slides
Circular
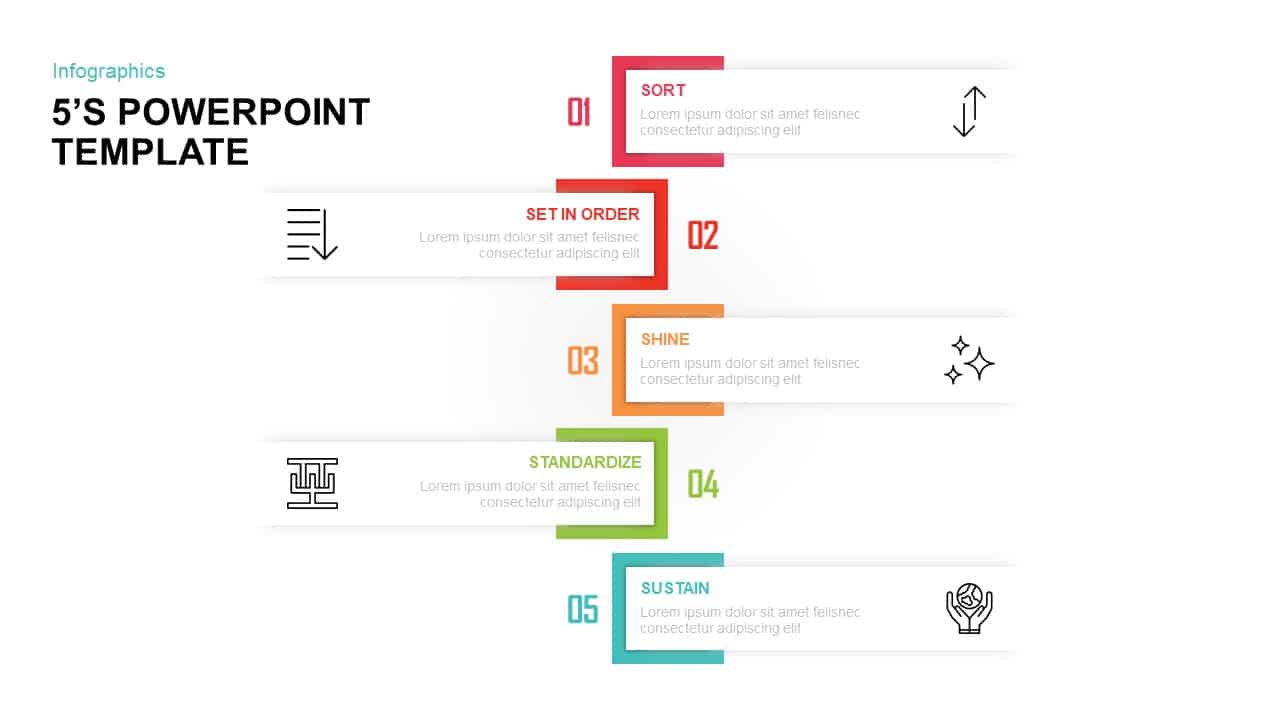
5S Lean Methodology Infographic Template for PowerPoint & Google Slides
Process
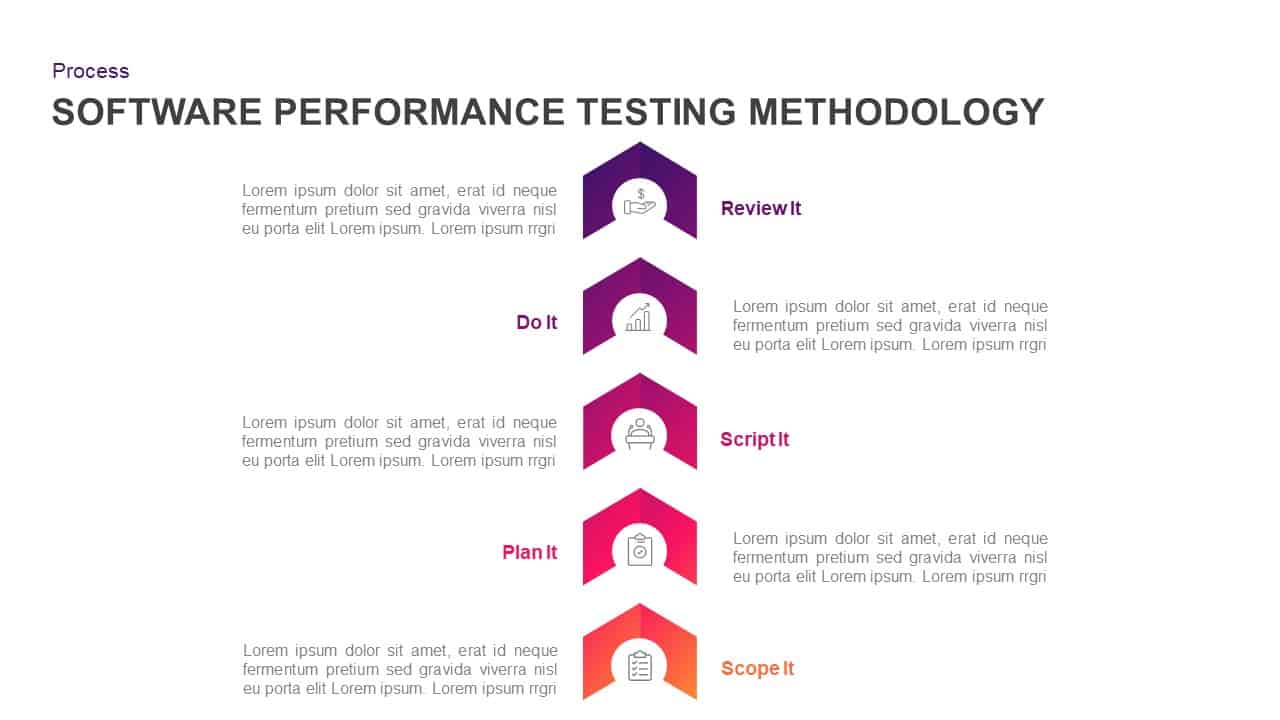
Software Performance Testing Methodology Template for PowerPoint & Google Slides
Process
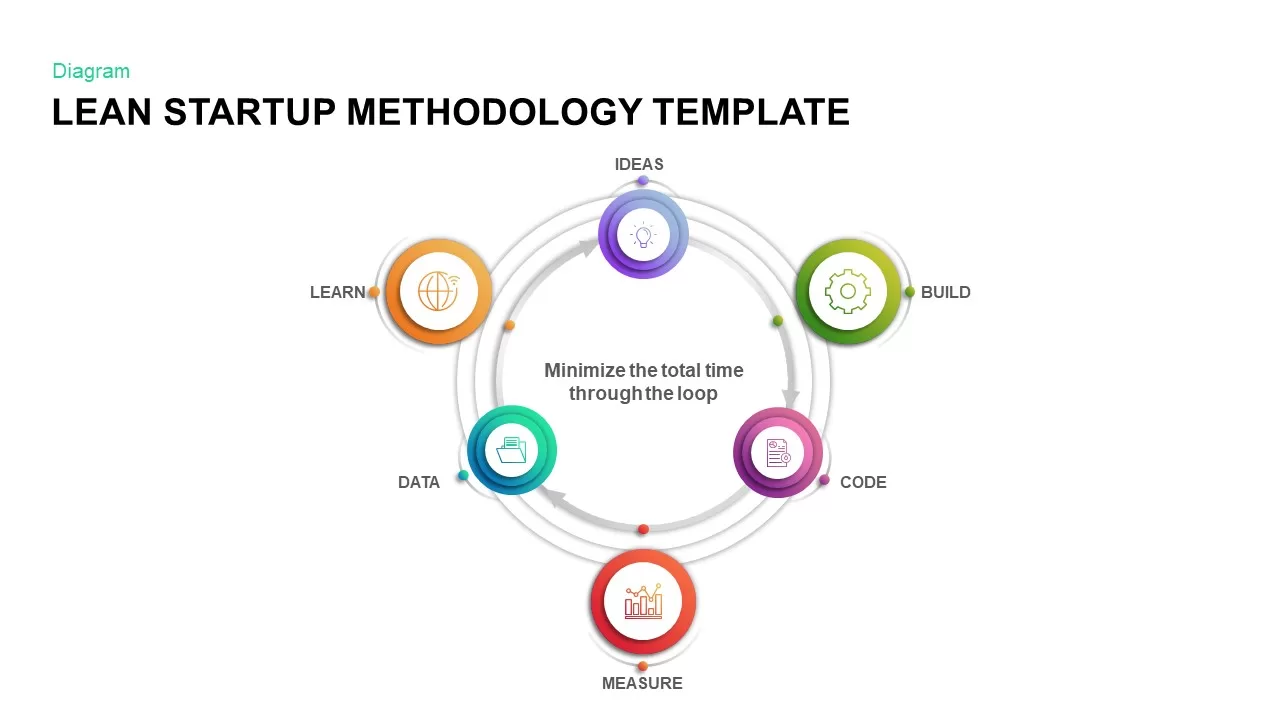
Lean Startup Methodology Infographic Template for PowerPoint & Google Slides
Circular
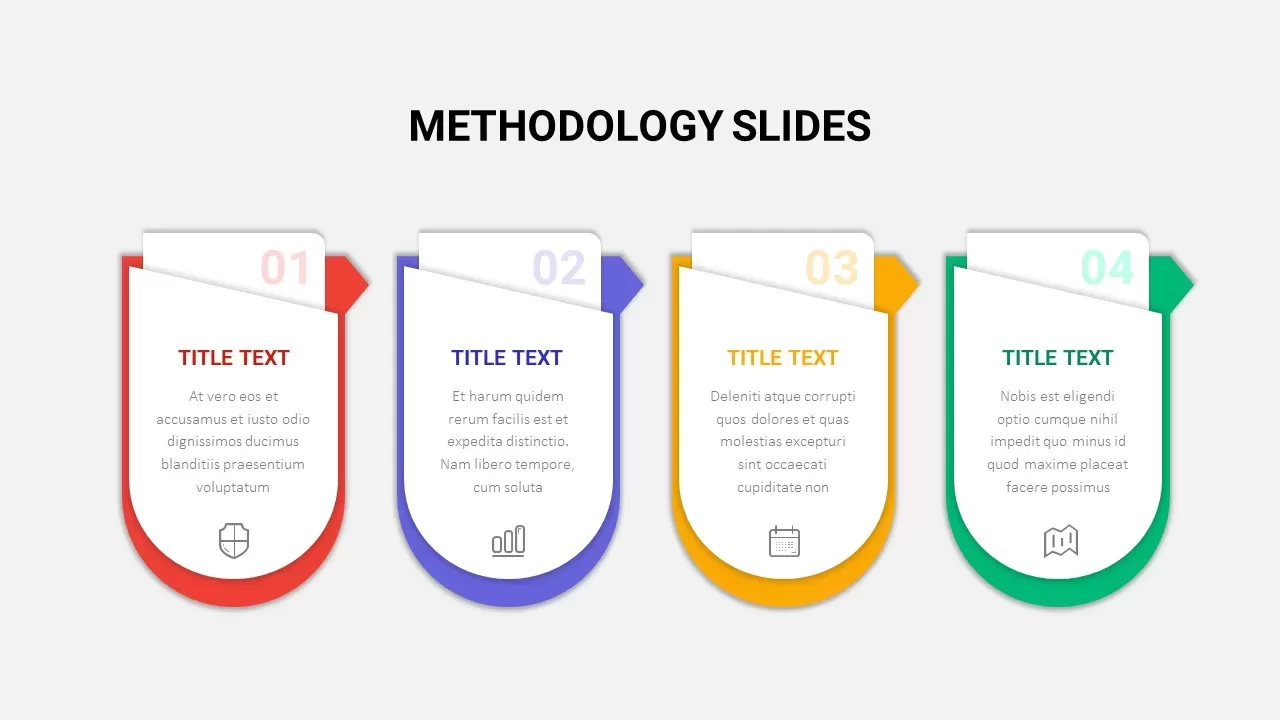
4 Step Methodology Infographic Template for PowerPoint & Google Slides
Process
Lean Methodology Circular Process Template for PowerPoint & Google Slides
Process