Five-Input Cause and Effect Diagram Template for PowerPoint & Google Slides


Description
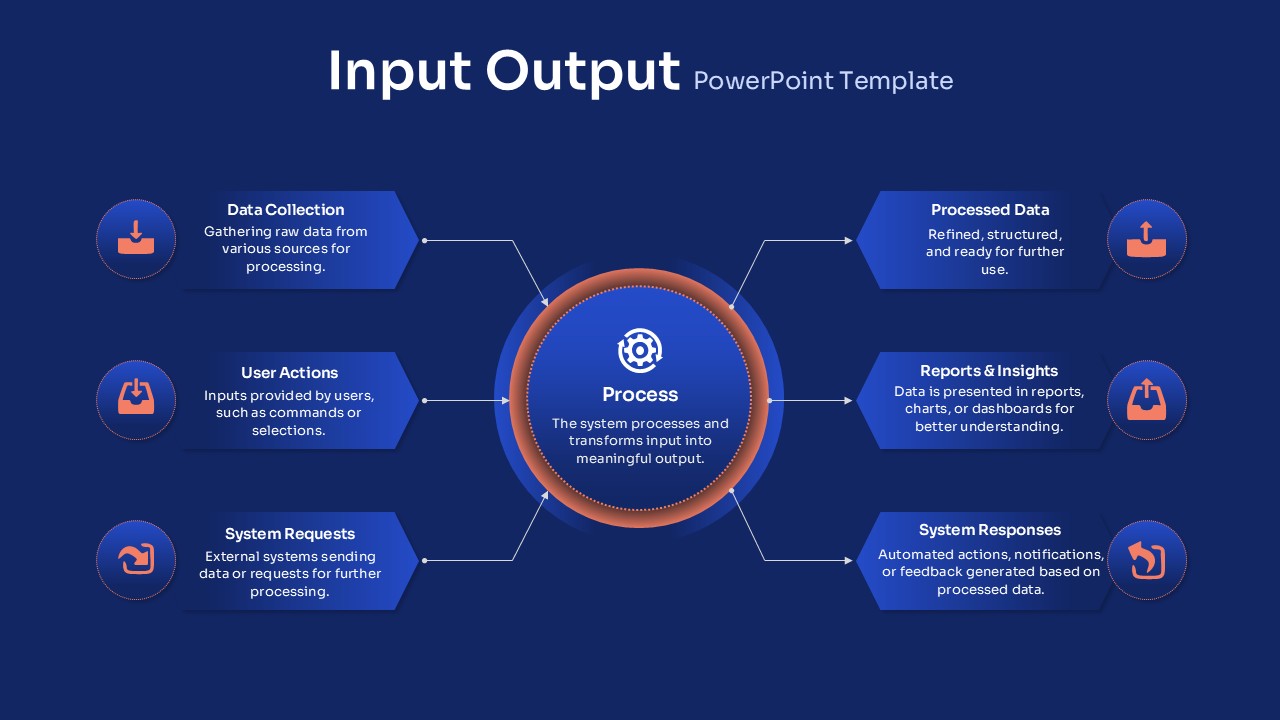
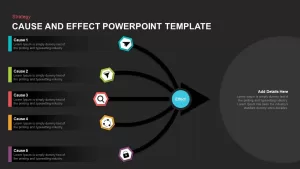
Leverage this dynamic cause-and-effect diagram slide to map up to five contributing factors converging into a single outcome. Each cause is highlighted by a distinct hexagon icon connected via bold, curved arrows to a central “Effect” node that sits within a prominent arrowhead shape. On the left, placeholders allow concise definitions of each cause, while the right side features a dedicated text area for elaborating the overall impact. The clean, flat design uses master slides, editable color accents, and vector icons to ensure seamless branding alignment. With intuitive placeholders, you can swap icons, adjust arrow paths, or update text in seconds. The high-contrast connectors guide the viewer’s eye toward the centerpiece, reinforcing logical flow. Whether you need to showcase root causes, inputs for a decision, or contributing metrics, this slide delivers clarity and visual appeal. Fully compatible with both PowerPoint and Google Slides, it maintains crisp resolution and layout integrity across platforms, eliminating formatting issues and streamlining collaboration.
Beyond cause mapping, the layout shines in collaborative workshops and strategy sessions, enabling stakeholders to quickly identify and prioritize driving factors. The hexagon icons are fully editable and can be swapped for custom graphics to represent departments, metrics, or product categories. Coupled with the expansive right-hand detail area, you can capture key findings, recommended actions, or supporting data in a cohesive, easy-to-follow format.
Who is it for
Project managers, quality assurance leaders, and operations teams will benefit from this slide to trace root causes and align on corrective actions. Marketing strategists and analysts can use it to map campaign drivers and performance indicators.
Other Uses
Use this slide for risk assessments, dependency analyses, kick-off workshops, and executive briefings. The converging arrows illustrate input-output relationships in product development or quality control, while the detail area captures recommendations and next steps.
Login to download this file

Item ID
SB01394
Related Templates

Cause and Effect Diagram Infographic Template for PowerPoint & Google Slides
Bar/Column

Fishbone Diagram Cause-and-Effect Template for PowerPoint & Google Slides
Process
Fishbone Cause and Effect Diagram Template for PowerPoint & Google Slides
Process
Underwater Fishbone Cause-Effect Diagram Template for PowerPoint & Google Slides
Process
Fishbone Cause and Effect Infographic Template for PowerPoint & Google Slides
Infographics
Input-Output Flow Template for PowerPoint & Google Slides
Process
Snowball Effect Process Diagram Template for PowerPoint & Google Slides
Process
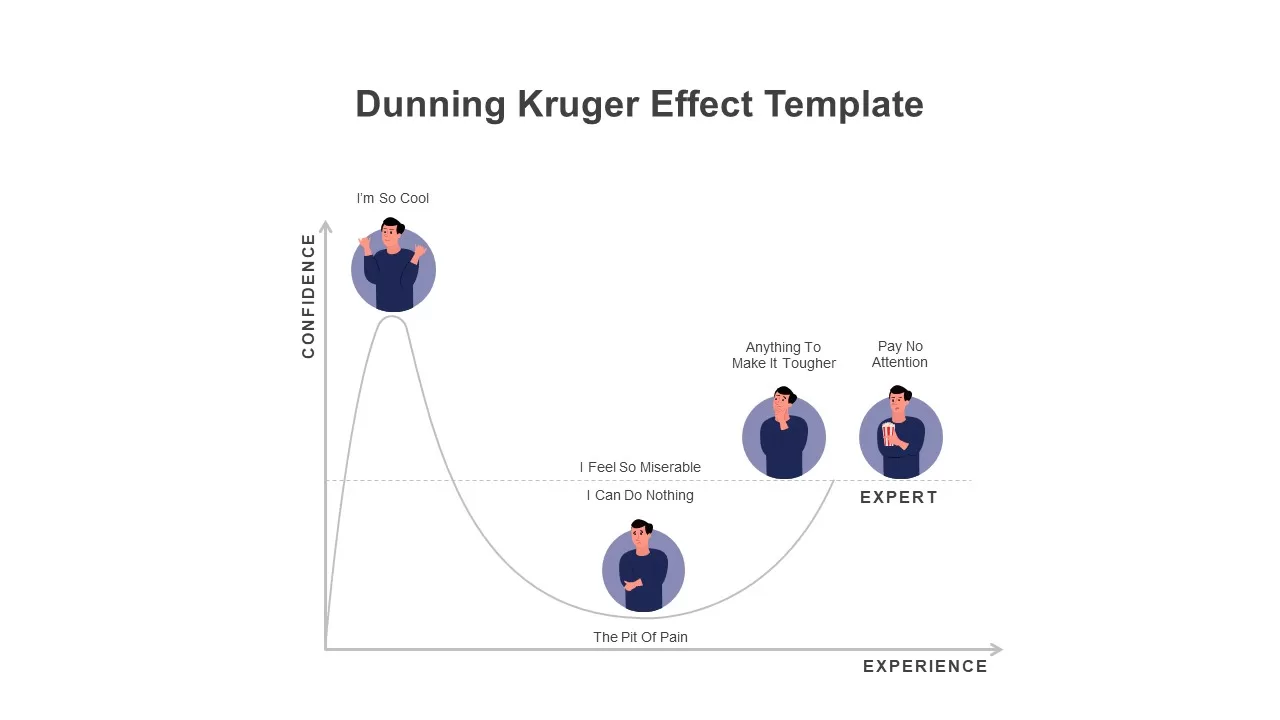
Modern Dunning Kruger Effect Diagram Template for PowerPoint & Google Slides
Business
5Cs of Network Effect Circular Diagram Template for PowerPoint & Google Slides
Circular
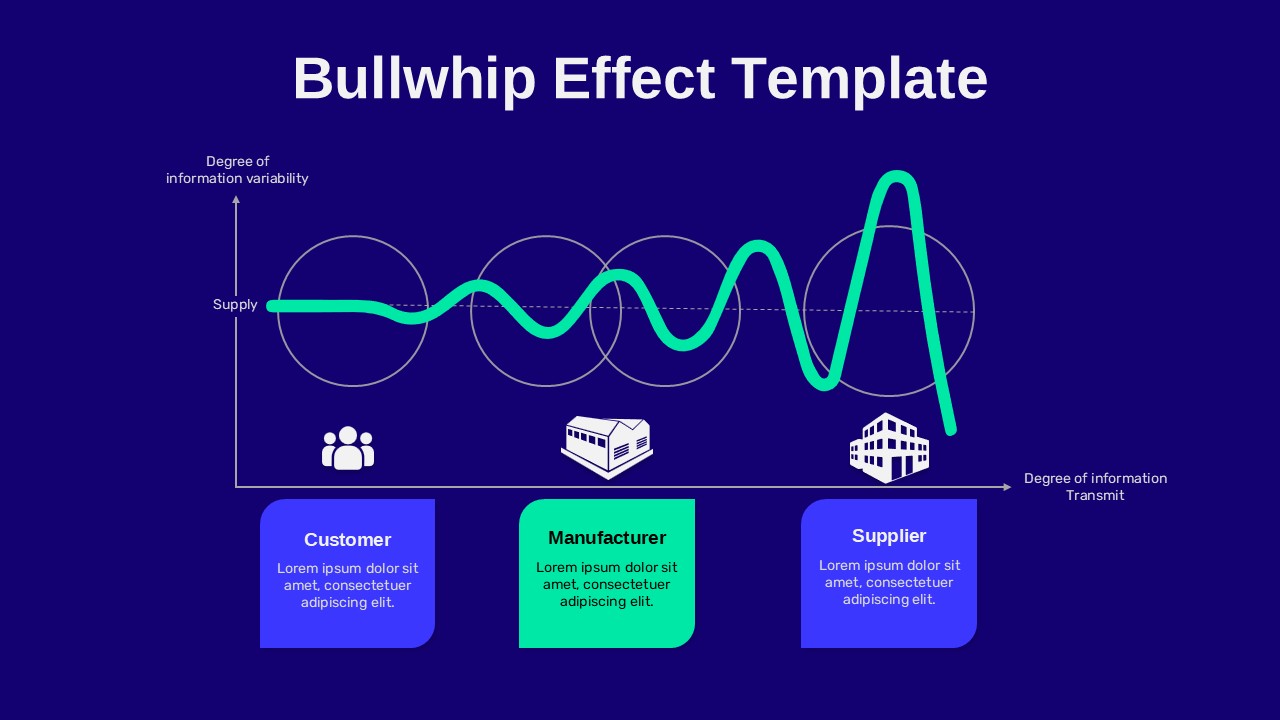
Bullwhip Effect Supply Chain Variability Diagram Template for PowerPoint & Google Slides
Business Models
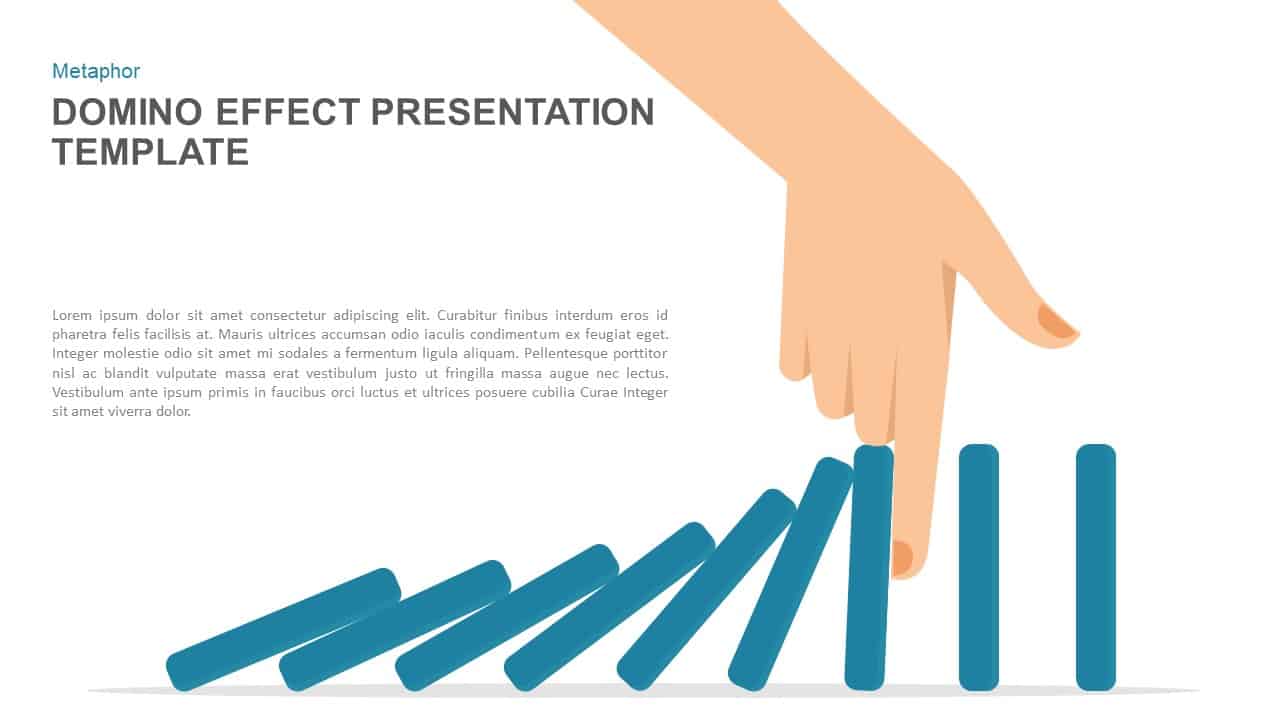
Domino Effect Prevention Presentation Template for PowerPoint & Google Slides
Process
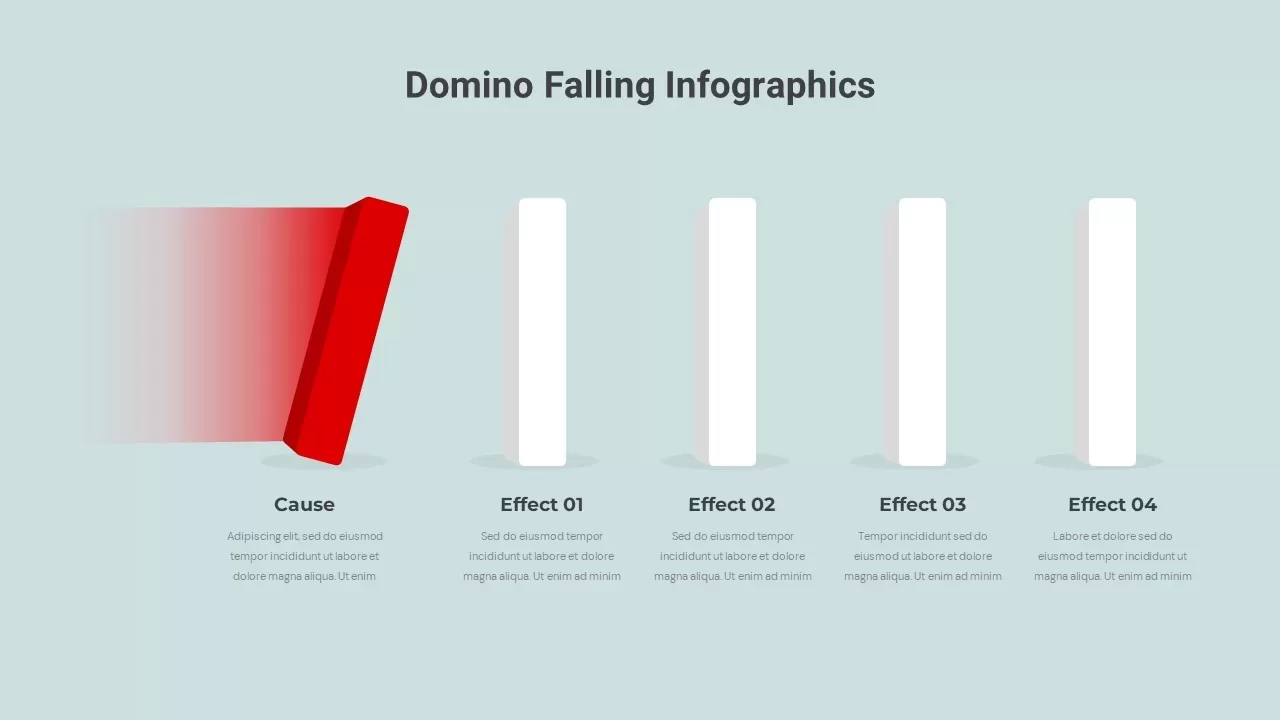
Domino Effect Sequential Infographics Template for PowerPoint & Google Slides
Process
Fishbone Cause Analysis Diagram Template for PowerPoint & Google Slides
Process
Free Root Cause Analysis Fishbone Diagram Template for PowerPoint & Google Slides
Process
Free
5 Why Fishbone Diagram for Root Cause Analysis in PowerPoint & Google Slides
Process
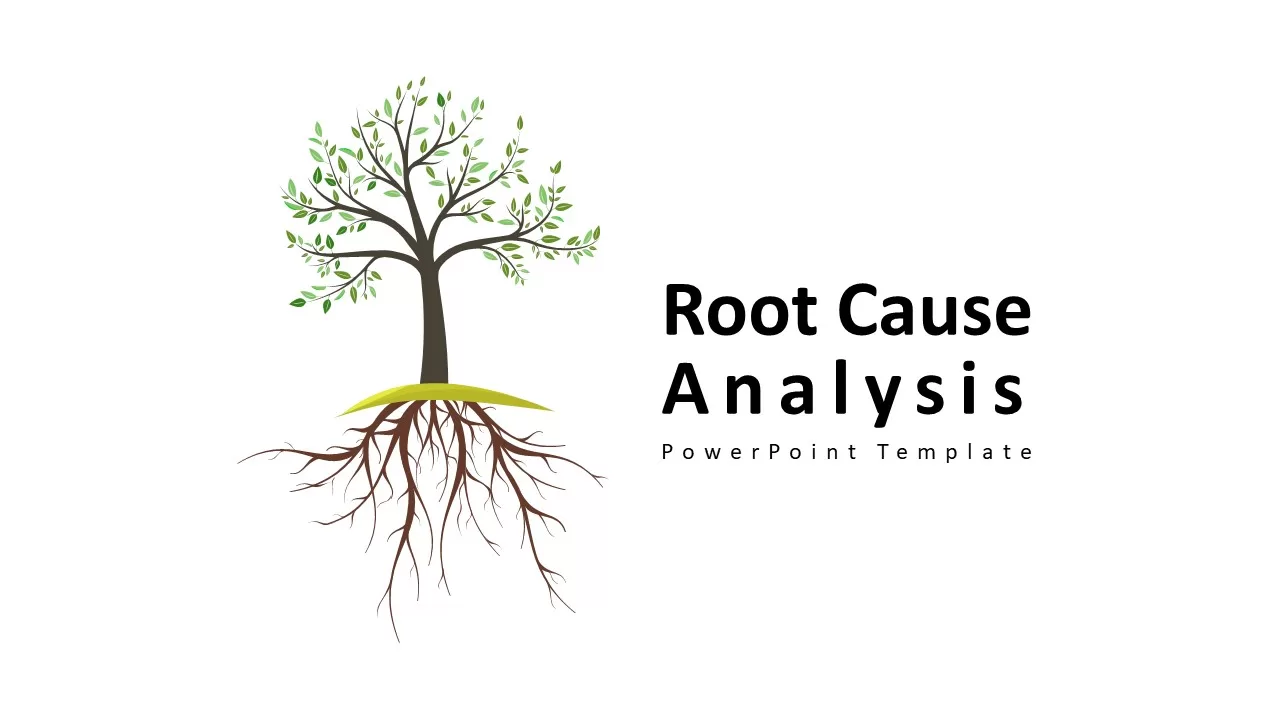
Root Cause Analysis PowerPoint & Google Slides Template for Presentations
Business Strategy
Sky and Tree Root Cause Analysis Deck Template for PowerPoint & Google Slides
Opportunities Challenges
Root Cause Analysis Infographic Pack Template for PowerPoint & Google Slides
Process
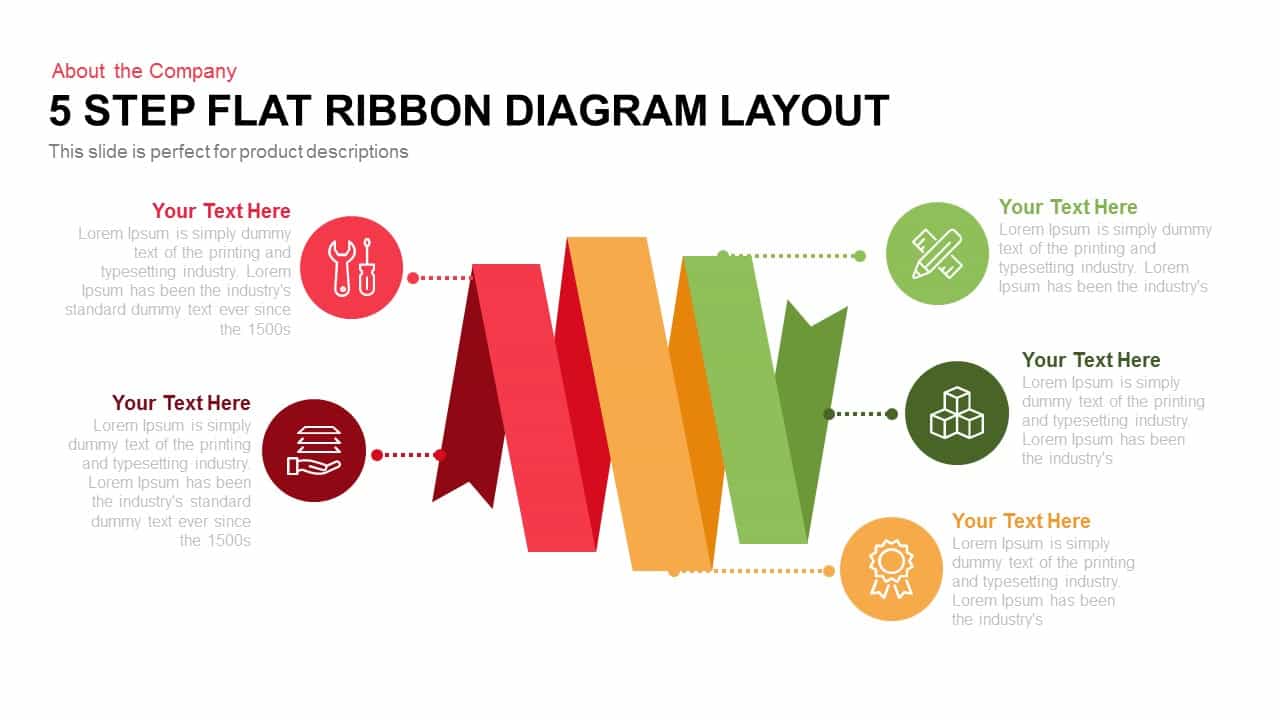
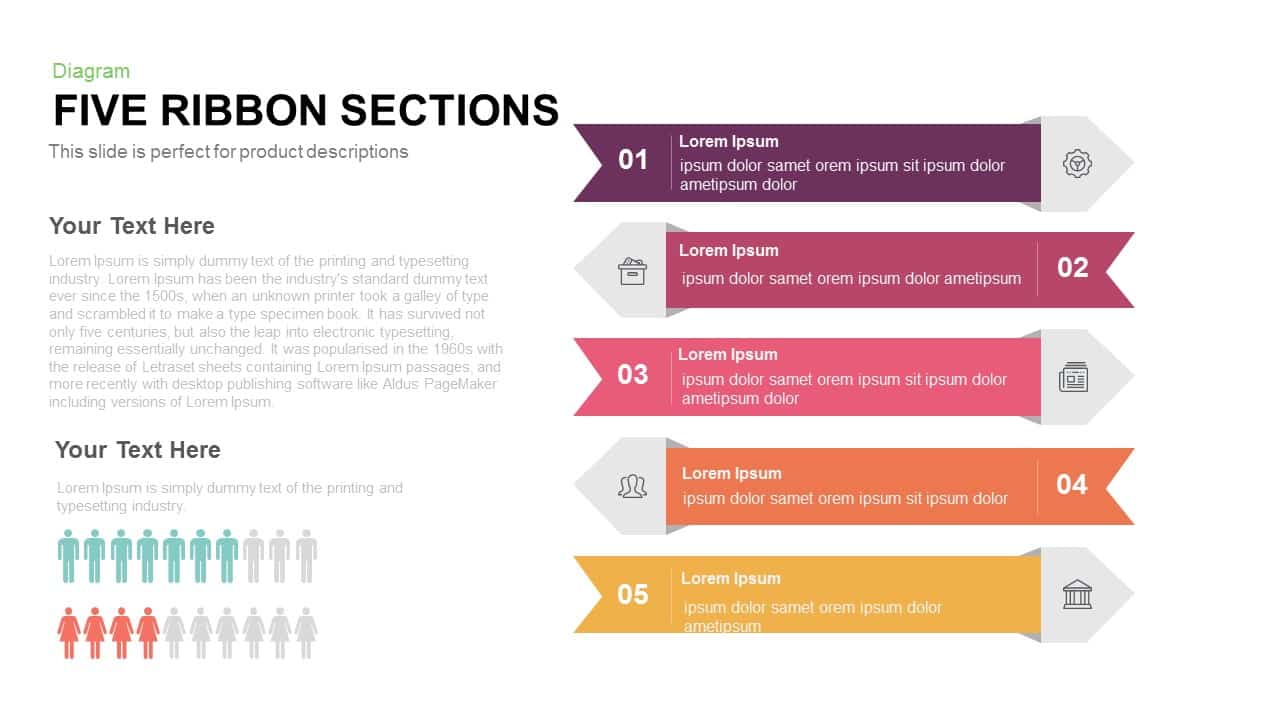
Five-Step Flat Ribbon Diagram Layout template for PowerPoint & Google Slides
Process
Five Up Arrow Infographic Diagram Template for PowerPoint & Google Slides
Arrow
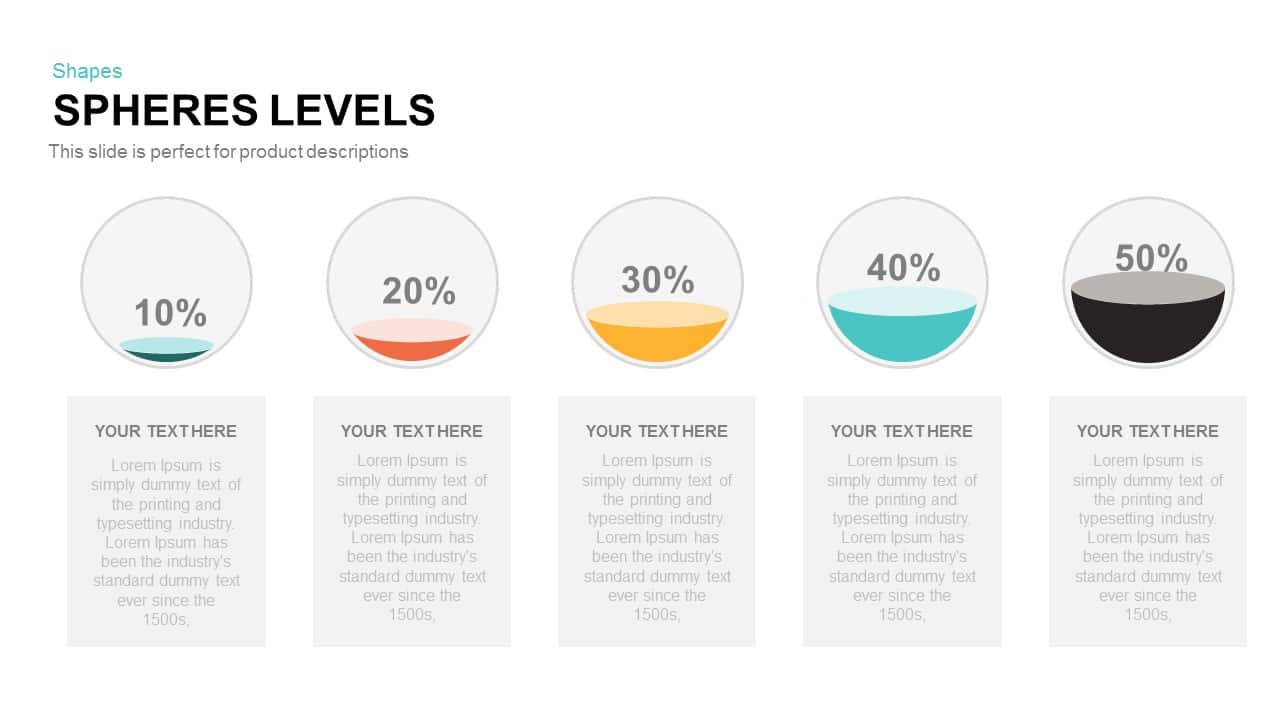
Five-Level Sphere Indicators Diagram template for PowerPoint & Google Slides
Infographics
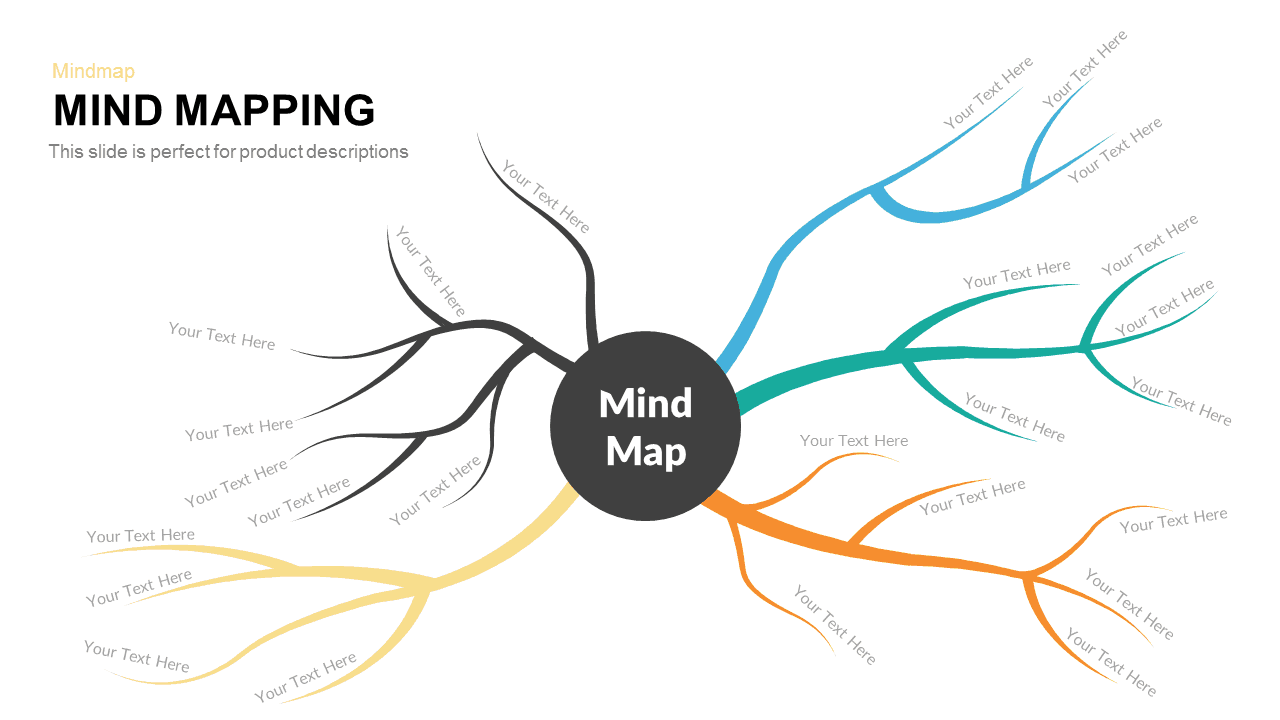
Five-Branch Mind Mapping Diagram template for PowerPoint & Google Slides
Mind Maps

Five-Step Gear Process Diagram Template for PowerPoint & Google Slides
Process
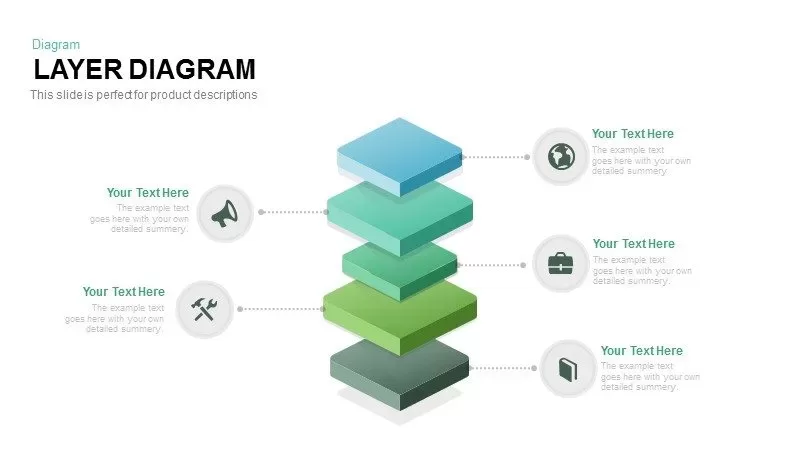
Five Layer Product Architecture Diagram Template for PowerPoint & Google Slides
Process
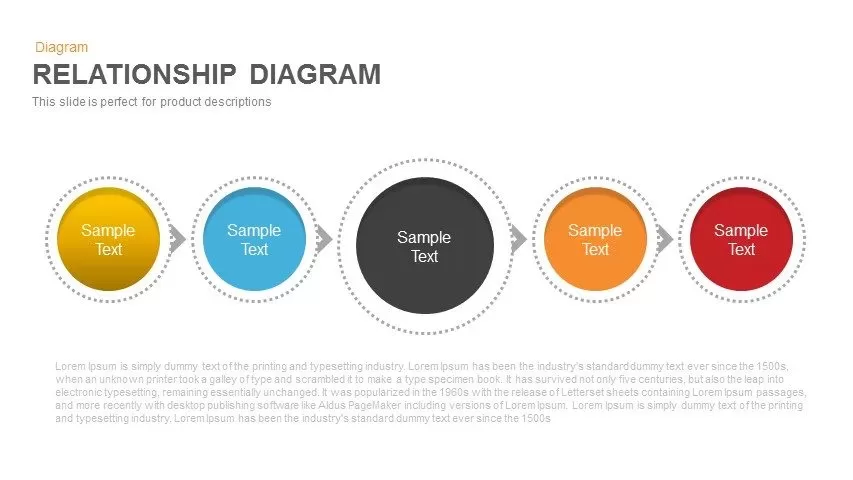
Colorful Five-Stage Relationship Diagram Template for PowerPoint & Google Slides
Process
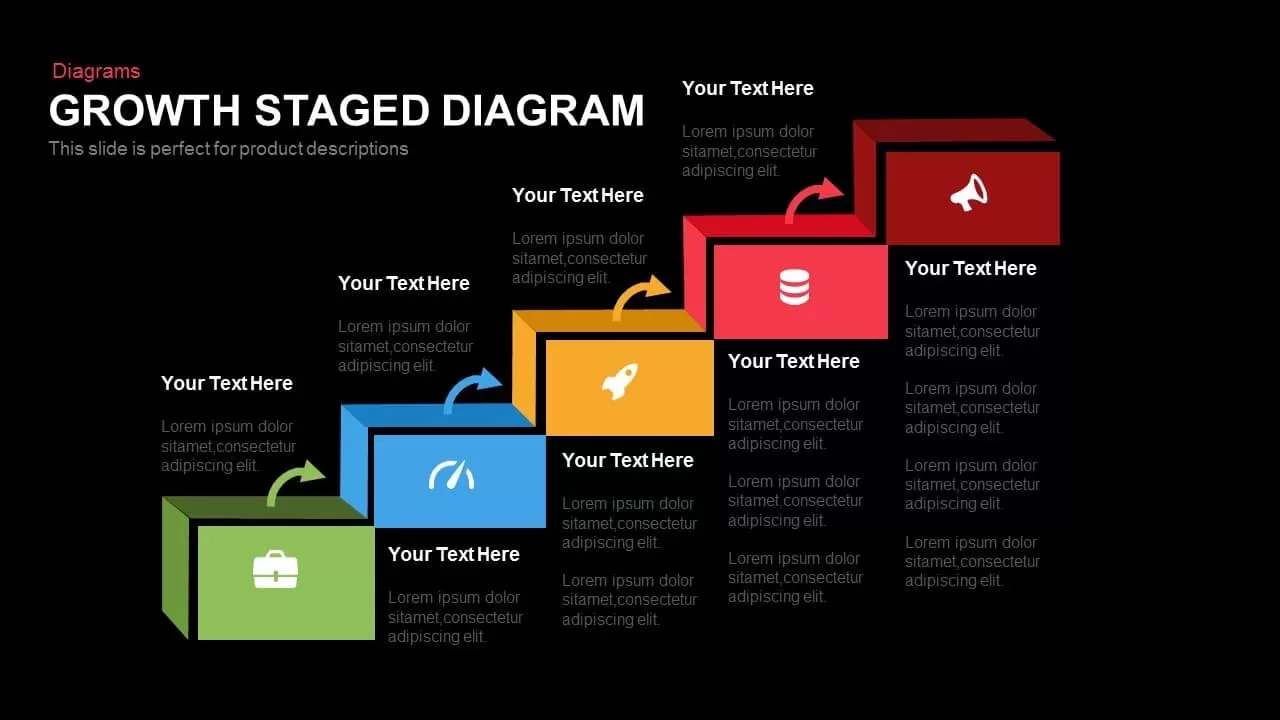
Five-Step Growth Stage Staircase Diagram Template for PowerPoint & Google Slides
Process

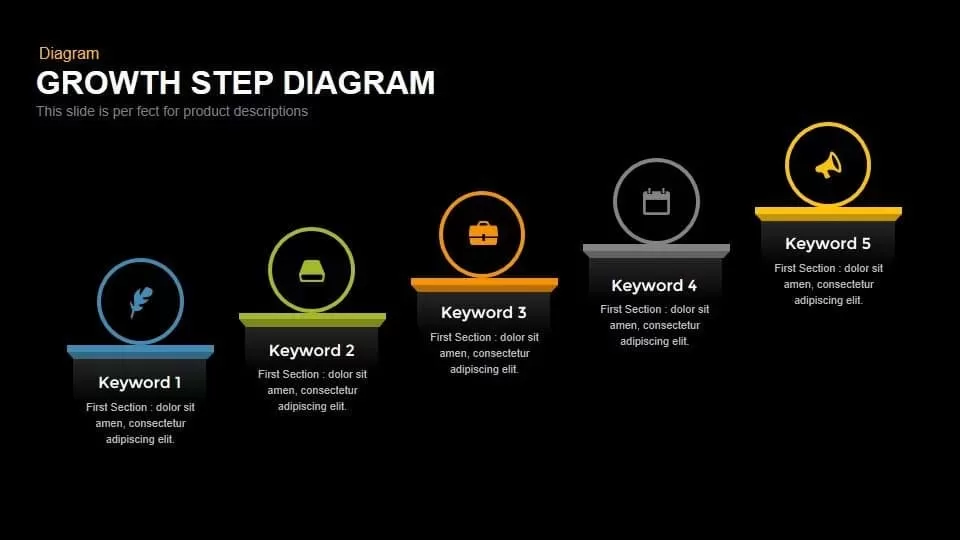
Modern Five-Step Growth Diagram Template for PowerPoint & Google Slides
Process
Five Arrow Infographics Diagram Template for PowerPoint & Google Slides
Arrow
Five-Section Circular Arrow Diagram Template for PowerPoint & Google Slides
Circular
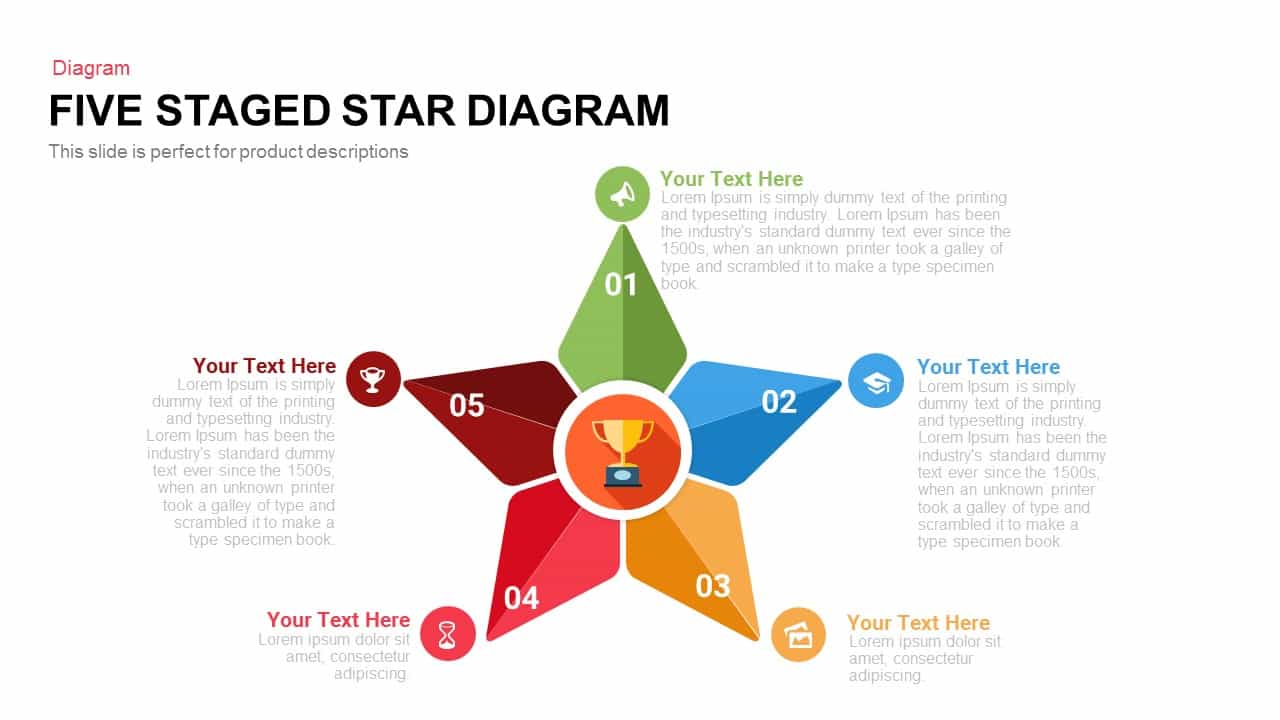
Five-Stage Star Diagram for Milestones Template for PowerPoint & Google Slides
Process
Five-Stage Pyramid Infographics Diagram Template for PowerPoint & Google Slides
Pyramid
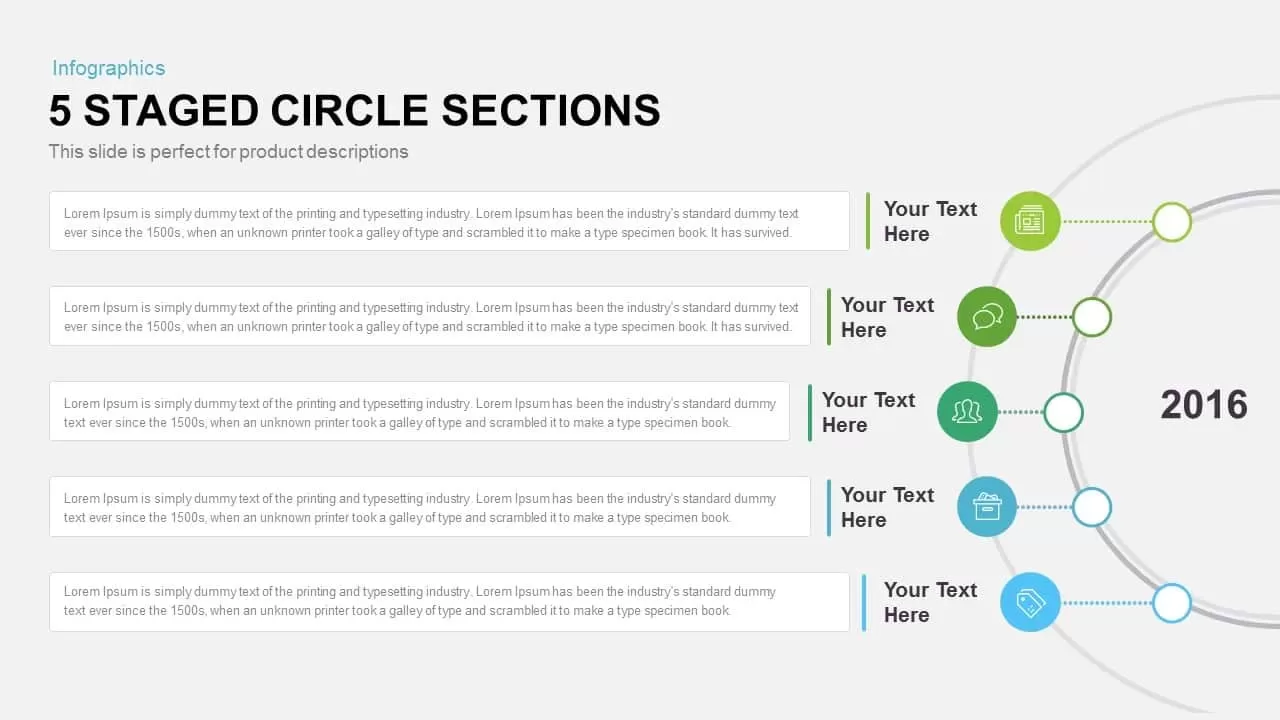
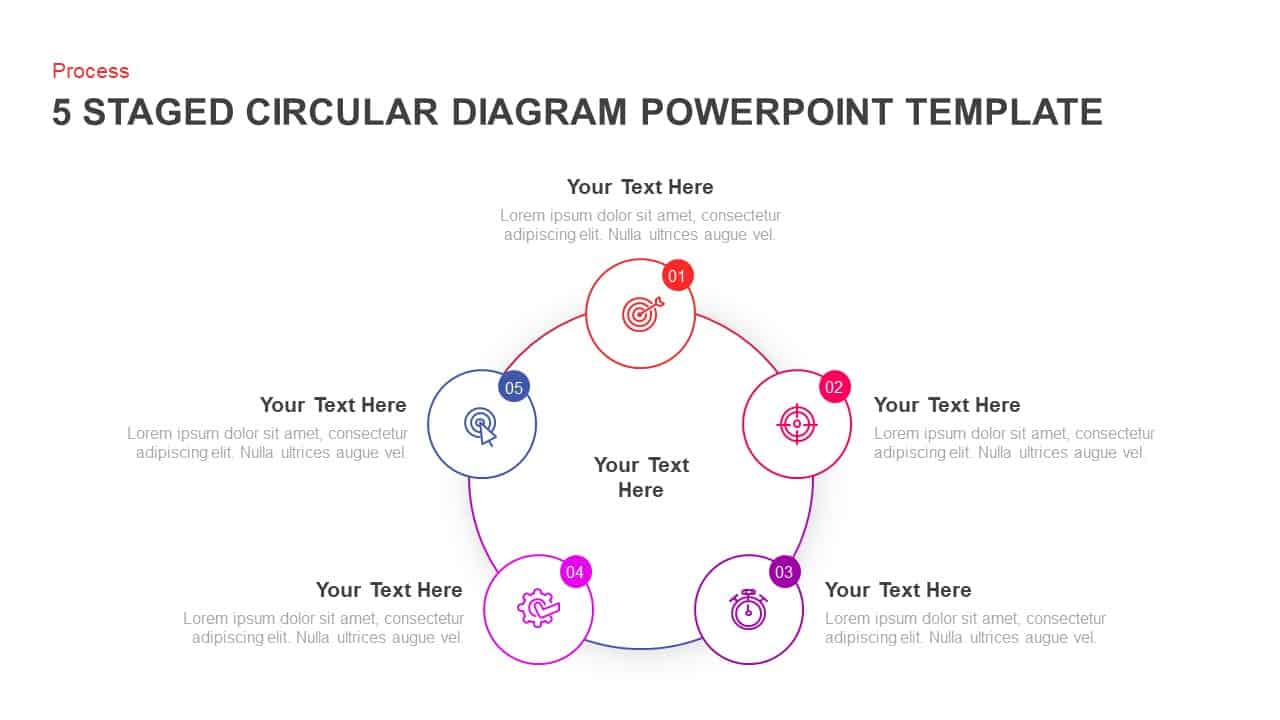
Five-Staged Circle Sections Diagram Template for PowerPoint & Google Slides
Circular
Five-Stage Zig-Zag Arrow Diagram Template for PowerPoint & Google Slides
Process
Modern Five-Stage Cycle Process Diagram Template for PowerPoint & Google Slides
Process
Five-Section Arrow Signpost Diagram Template for PowerPoint & Google Slides
Arrow
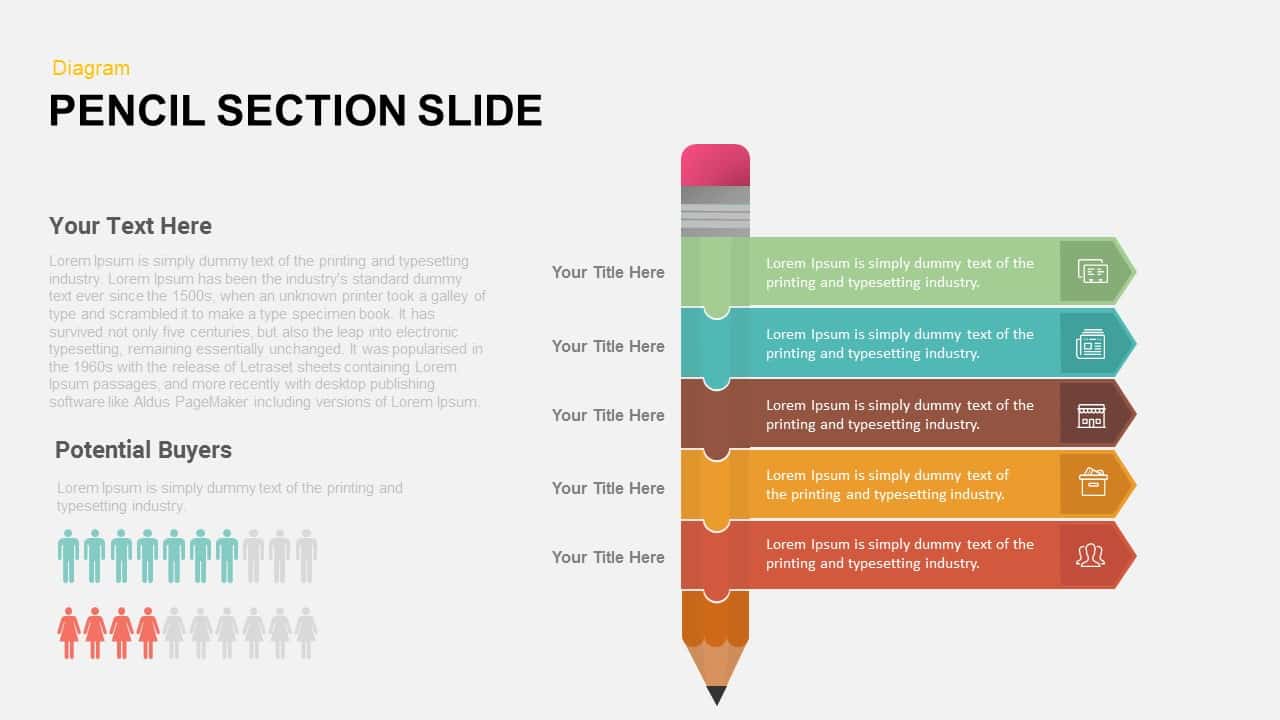
Pencil Section Five-Part Diagram Template for PowerPoint & Google Slides
Process
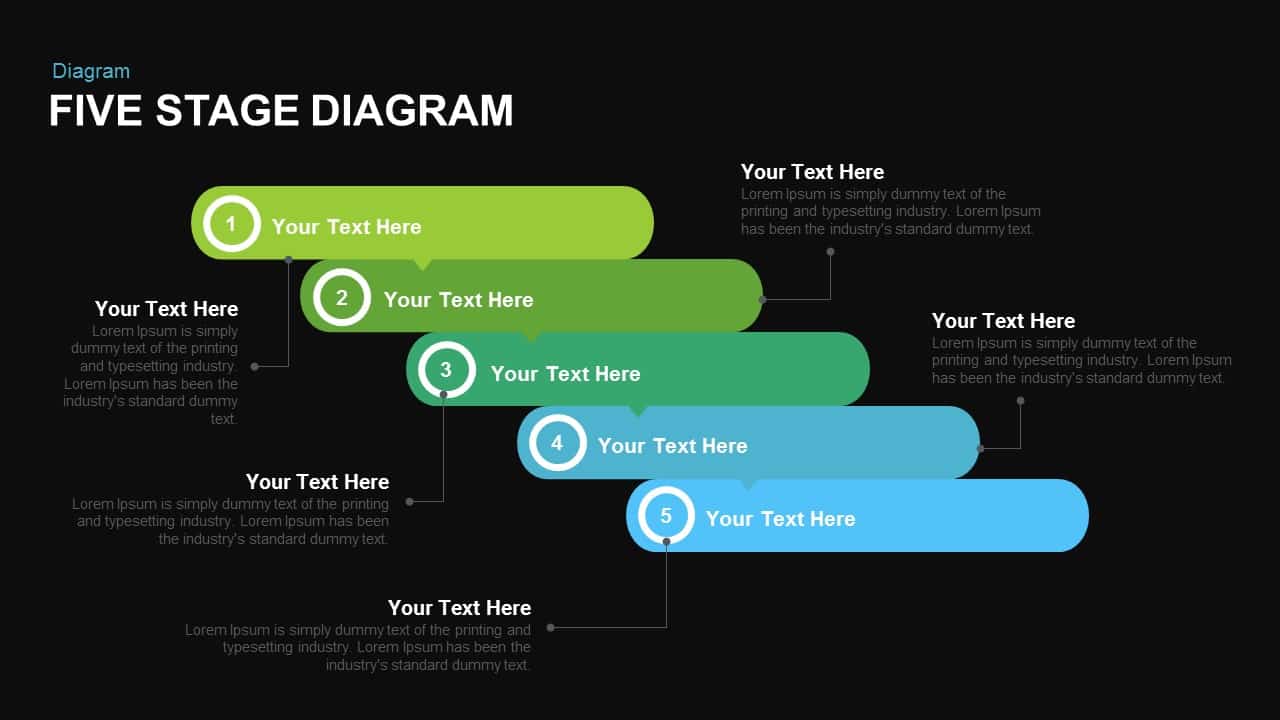
Engaging Five-Stage Process Diagram Template for PowerPoint & Google Slides
Process
Four and Five-Stage Funnel Diagram Template for PowerPoint & Google Slides
Funnel
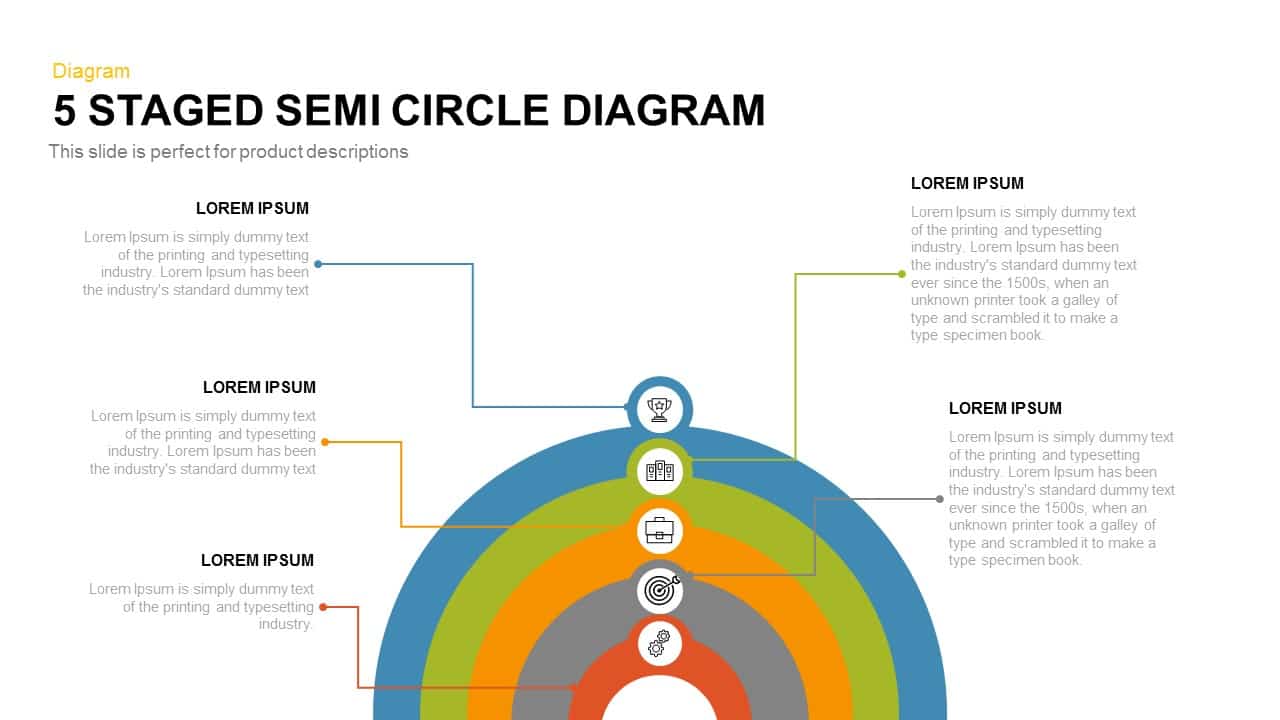
Five-Stage Semi-Circle Diagram Template for PowerPoint & Google Slides
Process
Five-Stage Circle Arrow Diagram Template for PowerPoint & Google Slides
Circular
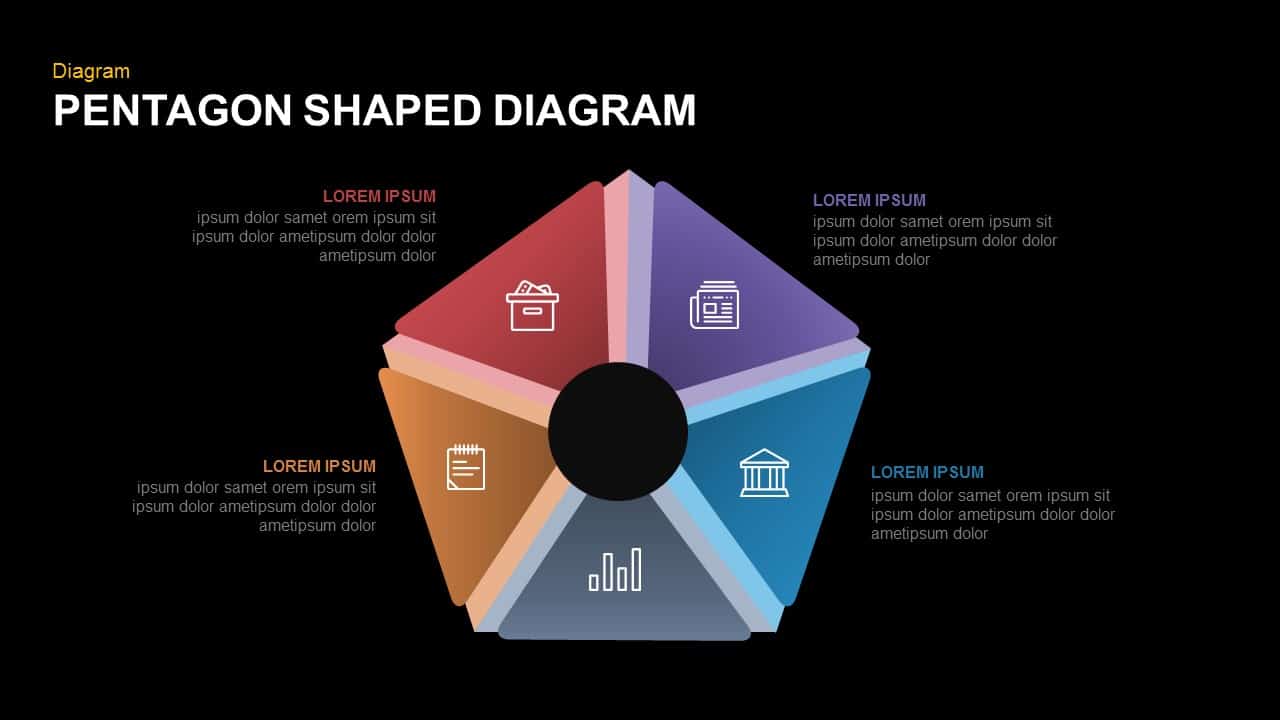
Five-Part Pentagon Shaped Diagram Template for PowerPoint & Google Slides
Process
Five Ribbon Sections Process Diagram Template for PowerPoint & Google Slides
Process
Five-Stage Pentagon Arrow Diagram Template for PowerPoint & Google Slides
Arrow
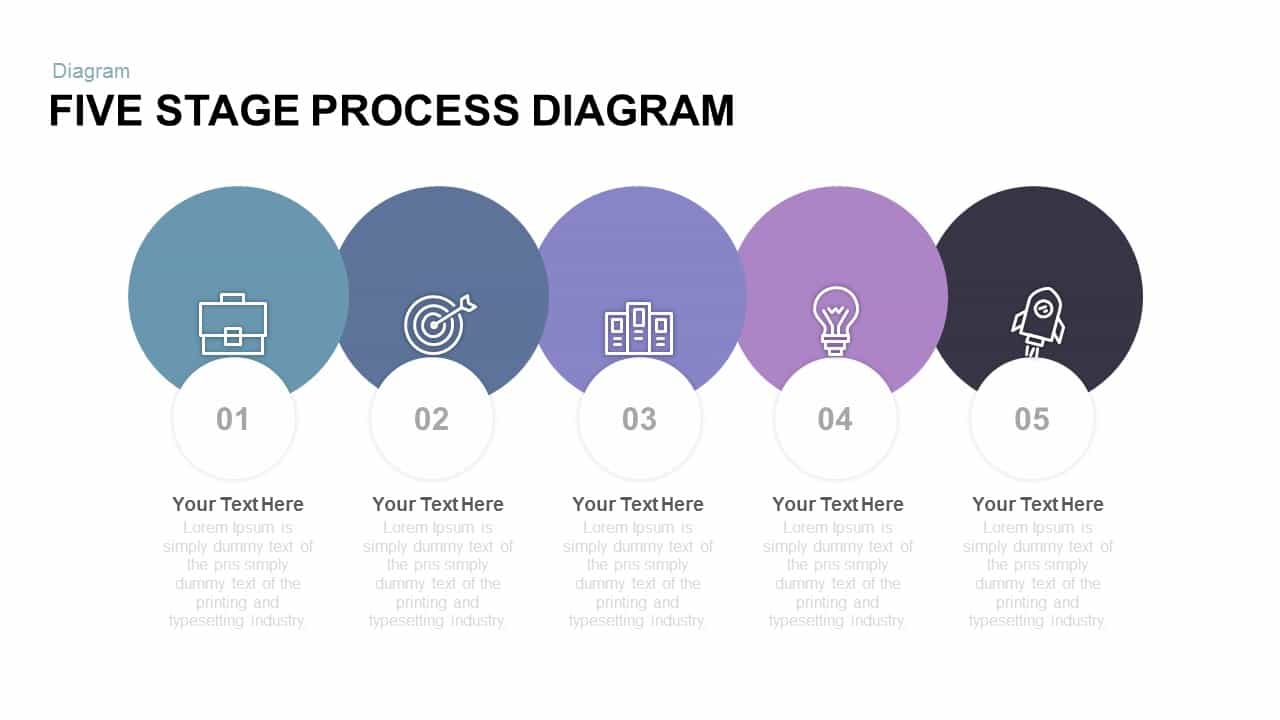
Five Stage Process Diagram Infographic Template for PowerPoint & Google Slides
Process
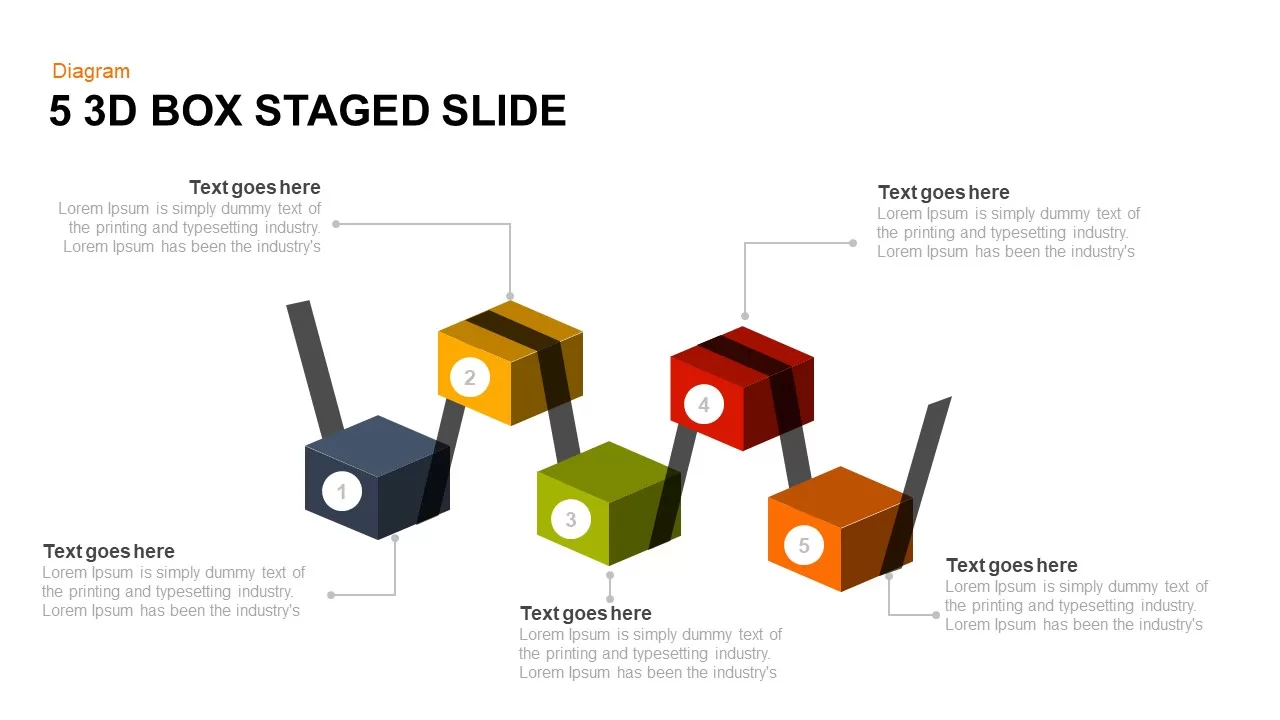
Five-Stage 3D Box Flow Diagram Template for PowerPoint & Google Slides
Process

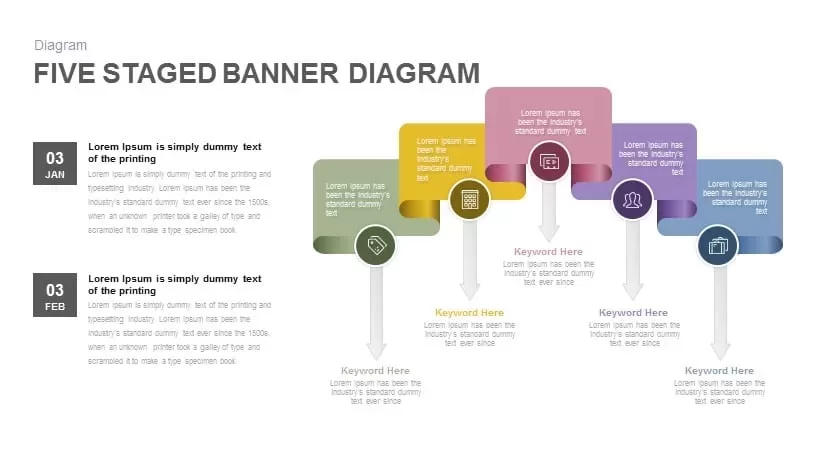
Elegant Five Staged Banner Diagram Template for PowerPoint & Google Slides
Process
Five Stage Process Diagram template for PowerPoint & Google Slides
Process
Free
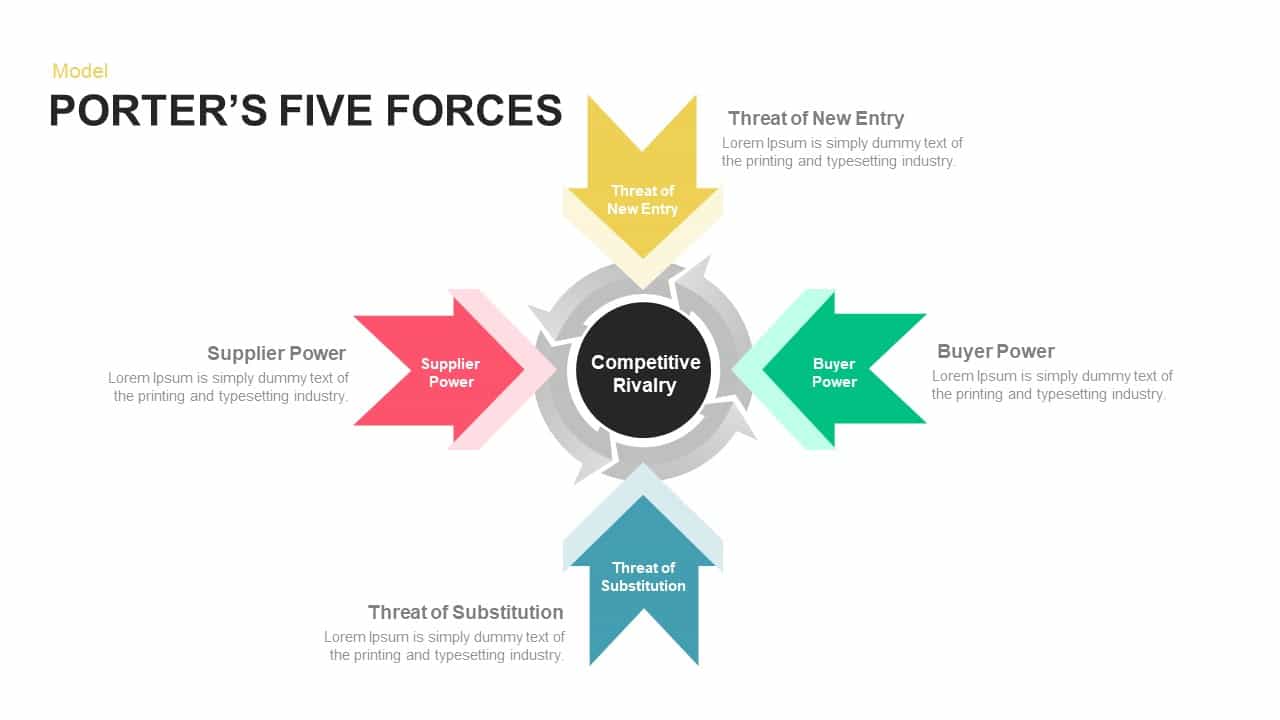
Porter’s Five Forces Model Diagram Template for PowerPoint & Google Slides
Competitor Analysis
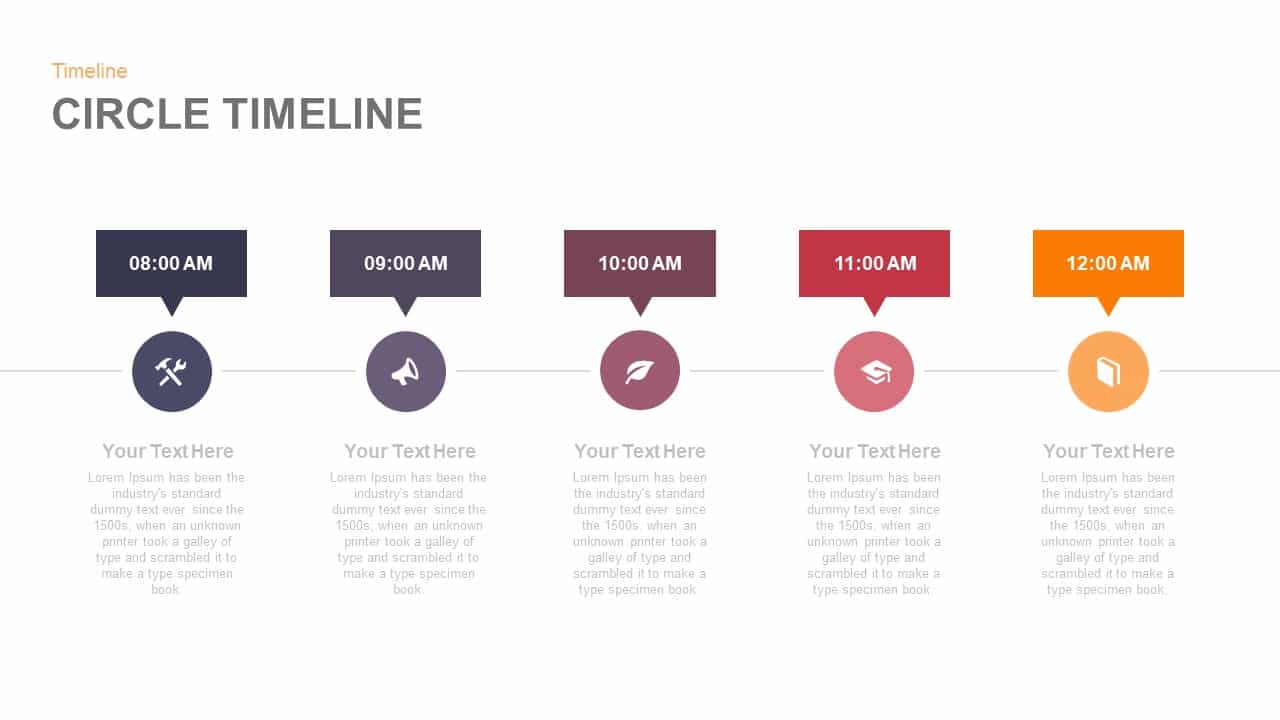
Five-Point Circle Timeline Diagram Template for PowerPoint & Google Slides
Timeline

Five-Stage Cyclic Process Arrow Diagram Template for PowerPoint & Google Slides
Process
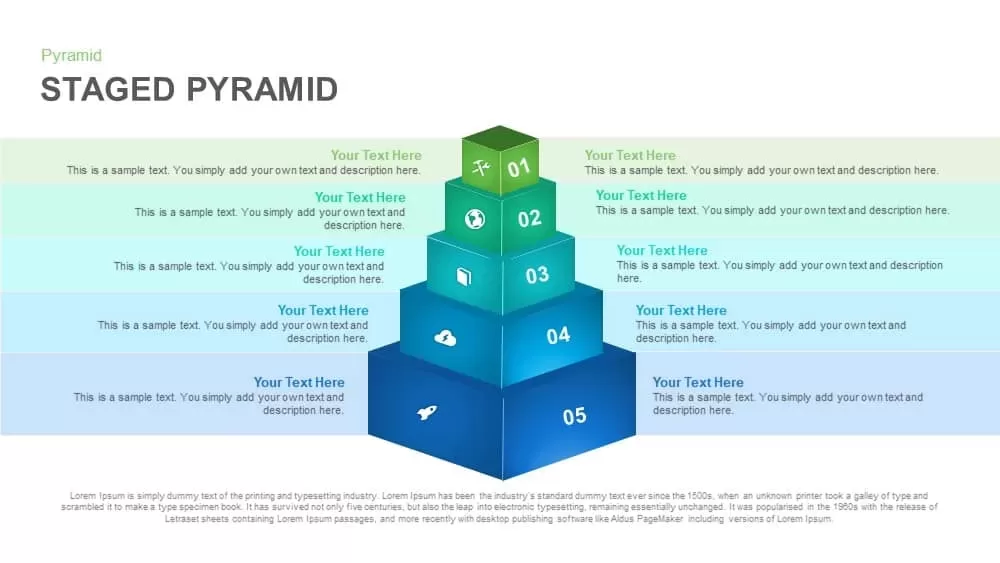
Five-Level Staged Pyramid Diagram Template for PowerPoint & Google Slides
Pyramid
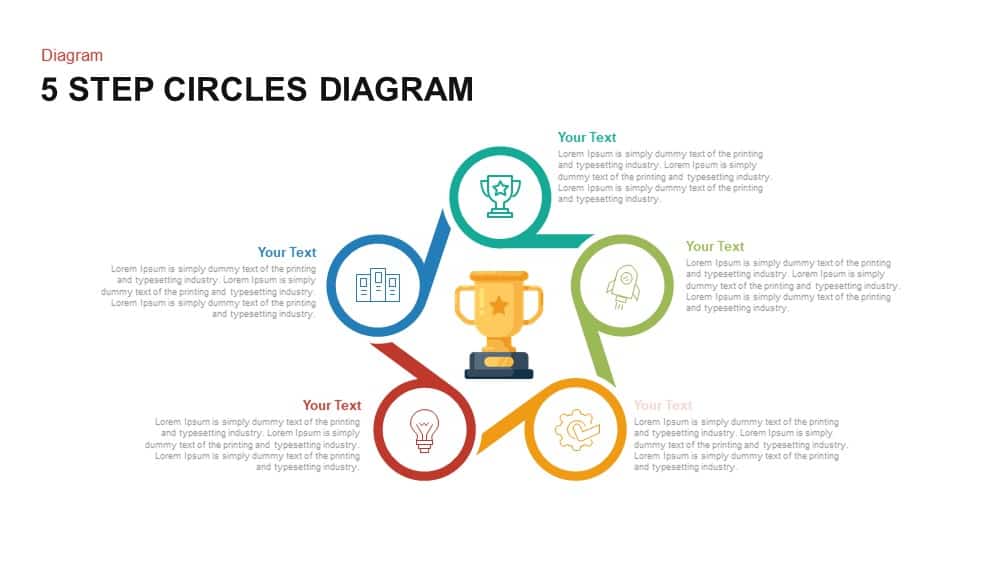
Modern Five-Step Circles Process Diagram Template for PowerPoint & Google Slides
Circular
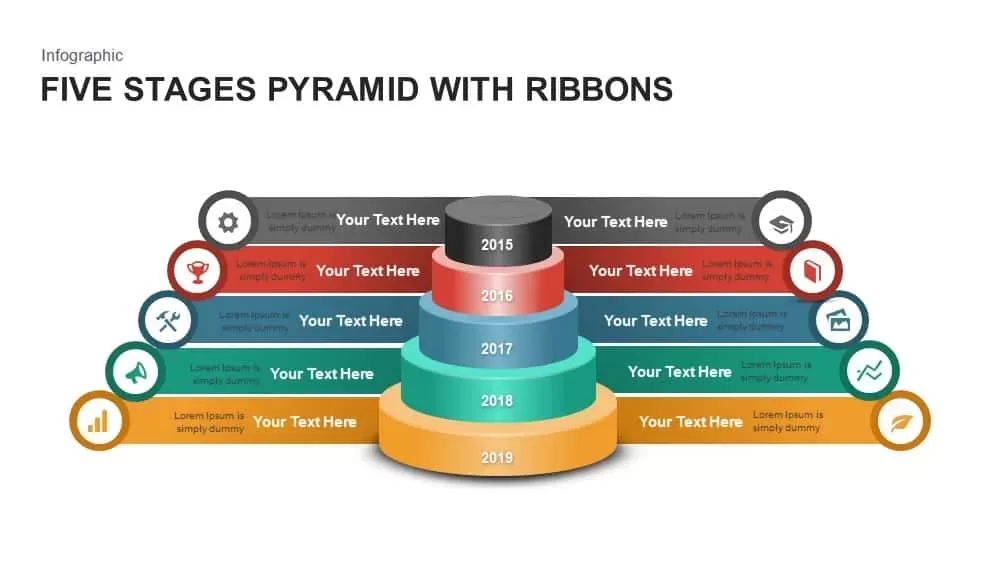
Five Stages Pyramid with Ribbons Diagram Template for PowerPoint & Google Slides
Pyramid
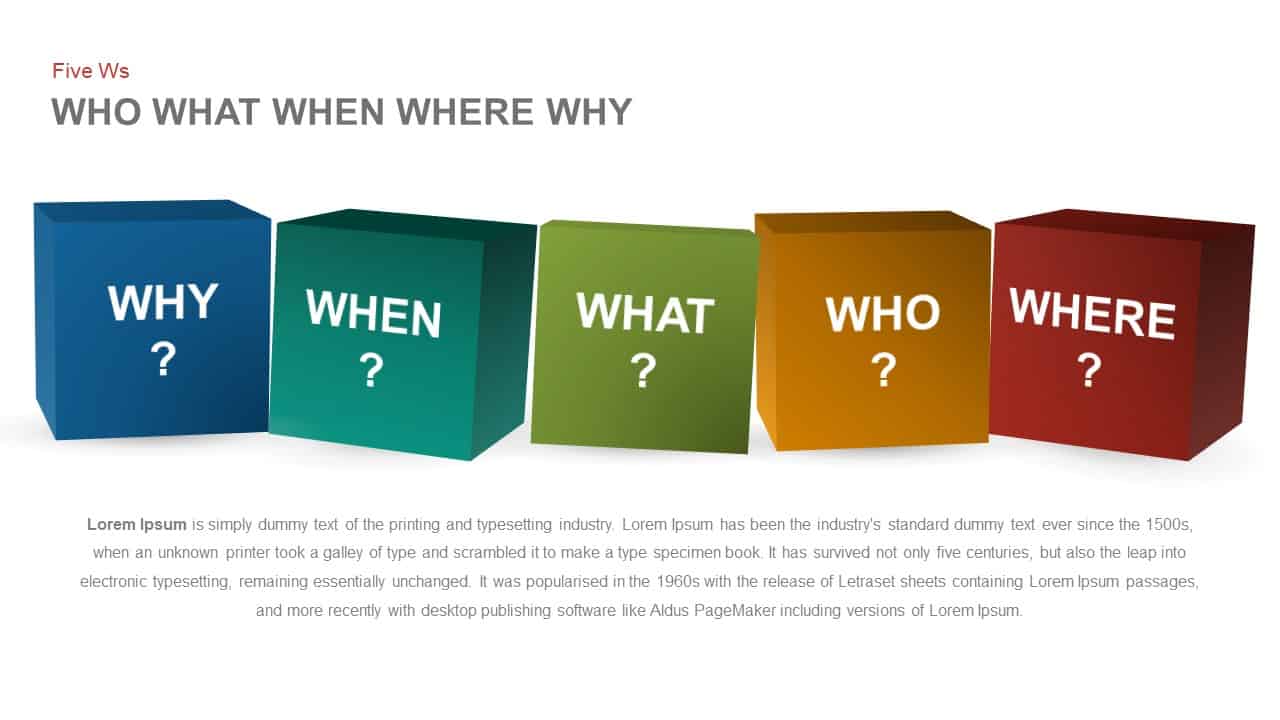
Five Ws Framework Cube Diagram Template for PowerPoint & Google Slides
Comparison
Five-Stage Process Diagram Template for PowerPoint & Google Slides
Process
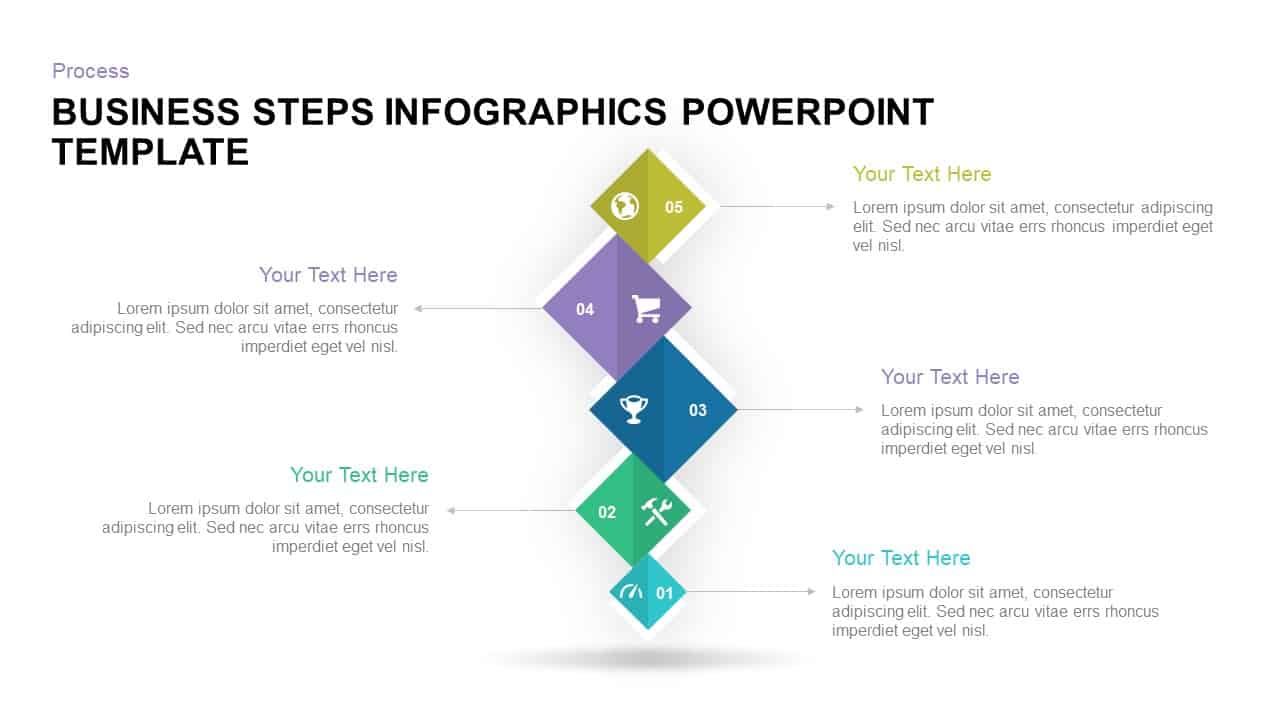
Five-Step Diamond Process Diagram Template for PowerPoint & Google Slides
Process
Five Stage Linear Process Flow Diagram Template for PowerPoint & Google Slides
Process
Five-Stage Linear Process Flow Diagram Template for PowerPoint & Google Slides
Process
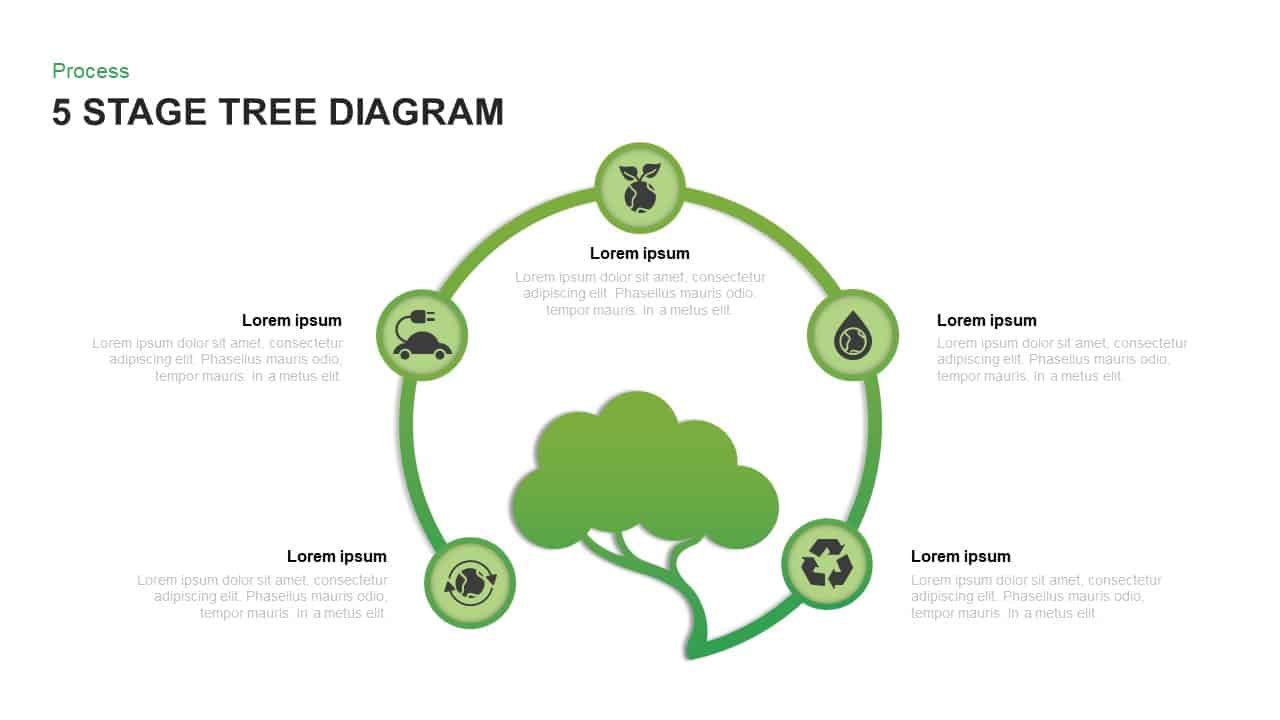
Five-Stage Eco Tree Process Diagram Template for PowerPoint & Google Slides
Process
Five-Stage Circular Infographic Diagram Template for PowerPoint & Google Slides
Process
Five-Stage Circular Process Diagram Template for PowerPoint & Google Slides
Circular
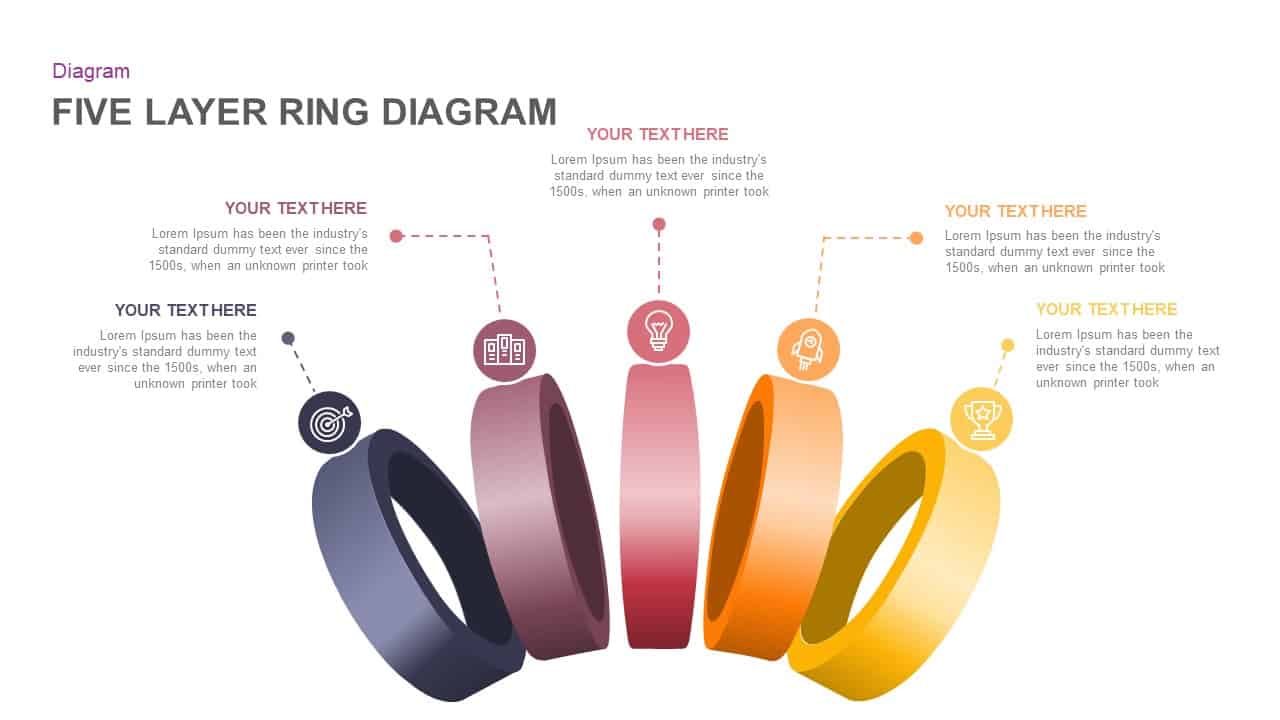
Five Layer Circular Ring Diagram Template for PowerPoint & Google Slides
Circular
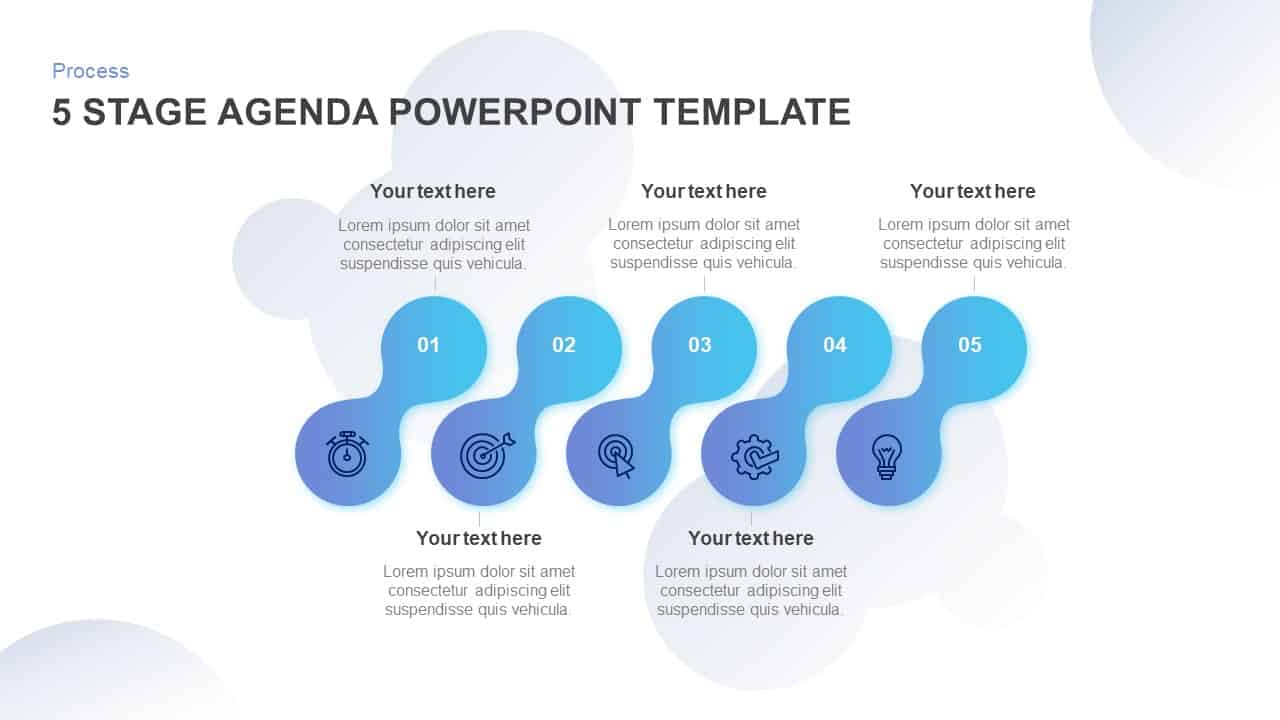
Five-Stage Agenda Flow Diagram Template for PowerPoint & Google Slides
Agenda
Five Stage Circular Arrow Diagram Template for PowerPoint & Google Slides
Process
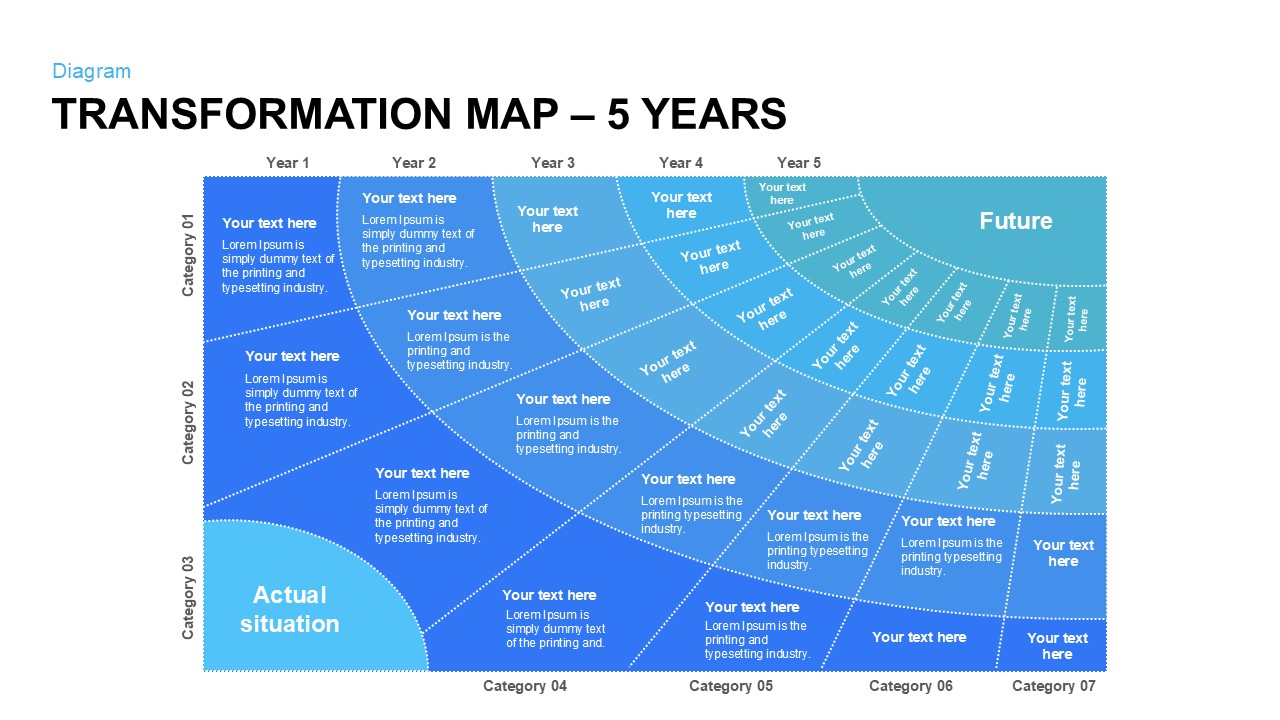
Five-Year Transformation Map Diagram Template for PowerPoint & Google Slides
Process
Five-Year Ribbon Timeline Diagram Template for PowerPoint & Google Slides
Timeline
Five-Stage Circular Process Flow Diagram Template for PowerPoint & Google Slides
Circular
Five-Stage Slanted Timeline Diagram Template for PowerPoint & Google Slides
Timeline
Five-Step Circular Process Diagram Template for PowerPoint & Google Slides
Circular
Five-Stage Circular Flow Diagram Template for PowerPoint & Google Slides
Circular
Five-Step Gradient Blue Funnel Diagram Template for PowerPoint & Google Slides
Funnel
Five-Stage Pipe Process Diagram Template for PowerPoint & Google Slides
Process
Five-Stage Process Flow Diagram Template for PowerPoint & Google Slides
Process
Five Stage Puzzle Flow Diagram Template for PowerPoint & Google Slides
Process
Porter’s Five Forces Visual Diagram Template for PowerPoint & Google Slides
Infographics
Colorful Five-Step Roadmap Diagram Template for PowerPoint & Google Slides
Roadmap
3D Five-Step Roadmap Diagram Slide Layout Template for PowerPoint & Google Slides
Roadmap
Gradient Five-Step Roadmap Diagram Template for PowerPoint & Google Slides
Roadmap
Five-Stage Digital Maturity Model Diagram Template for PowerPoint & Google Slides
Process
Five-Node Hub and Spoke Diagram Template for PowerPoint & Google Slides
Business Strategy
Five-Node Hub & Spoke Diagram Process Template for PowerPoint & Google Slides
Business Models
Colorful Five-Stage Methodology Diagram Template for PowerPoint & Google Slides
Process
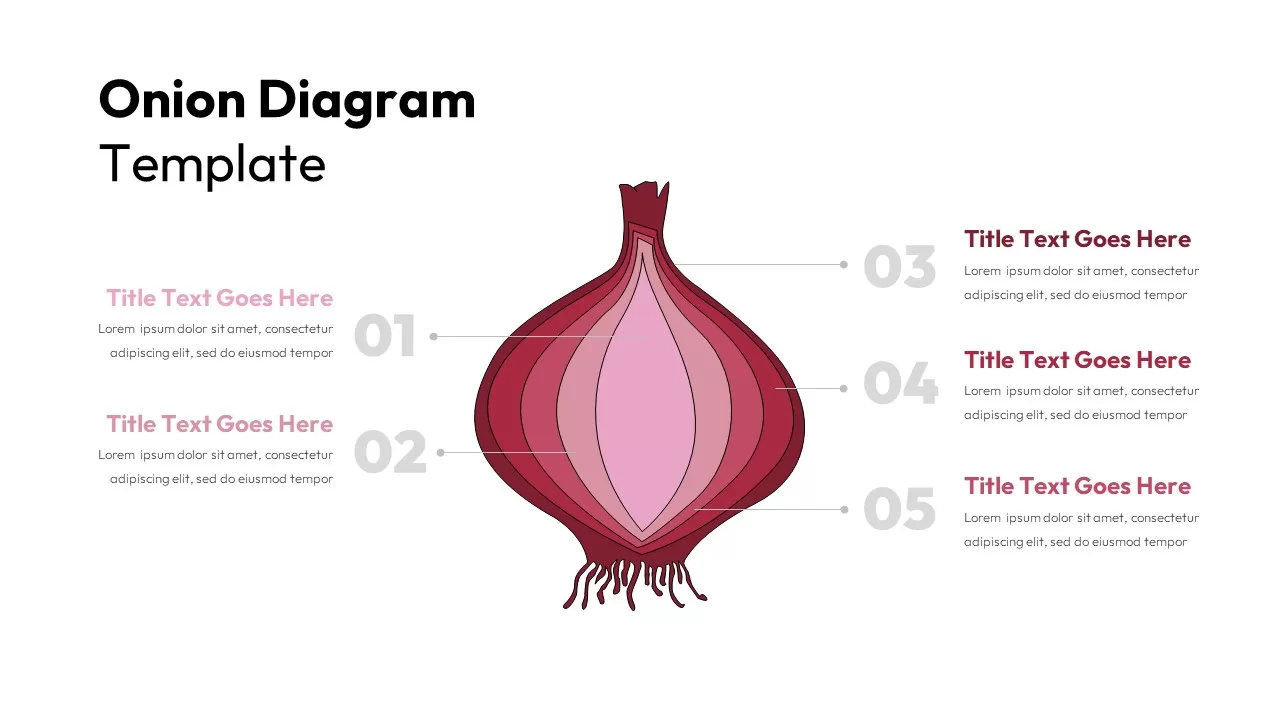
Five-Layer Onion Diagram Infographic Template for PowerPoint & Google Slides
Process
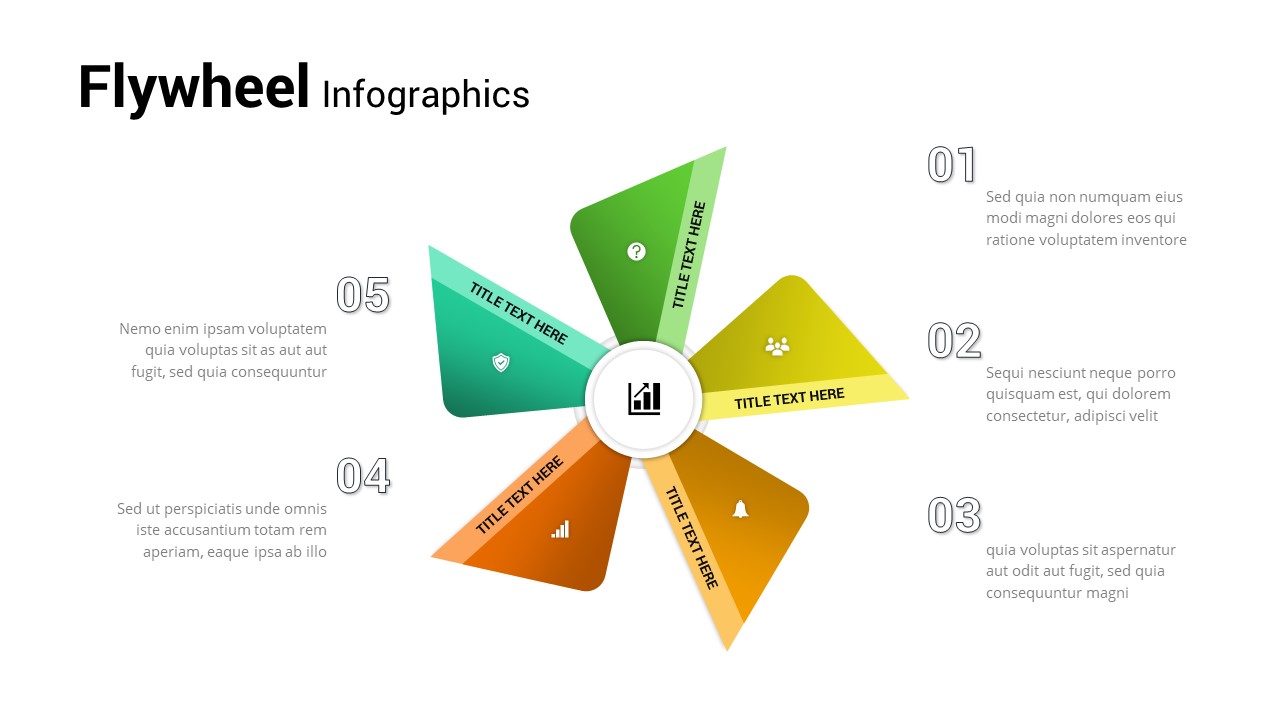
Five-Step Flywheel Infographic Diagram Template for PowerPoint & Google Slides
Process
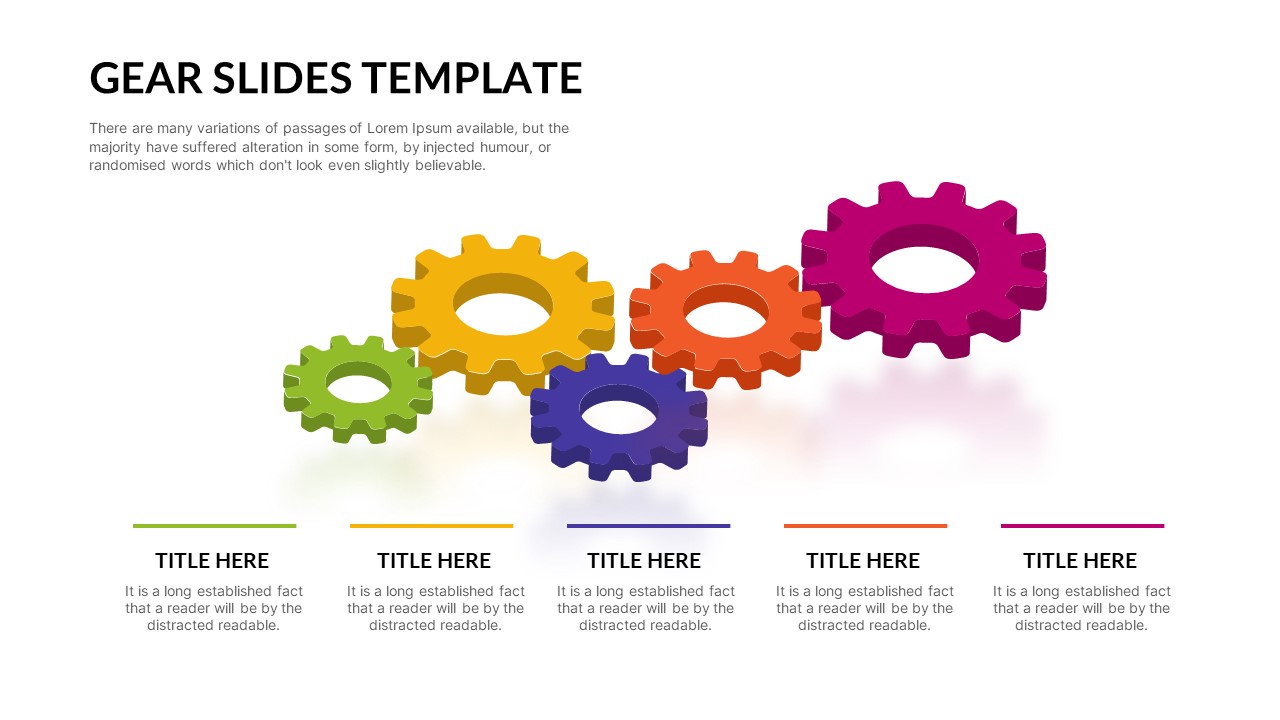
Five-Step Interlocking Gears Diagram Template for PowerPoint & Google Slides
Process
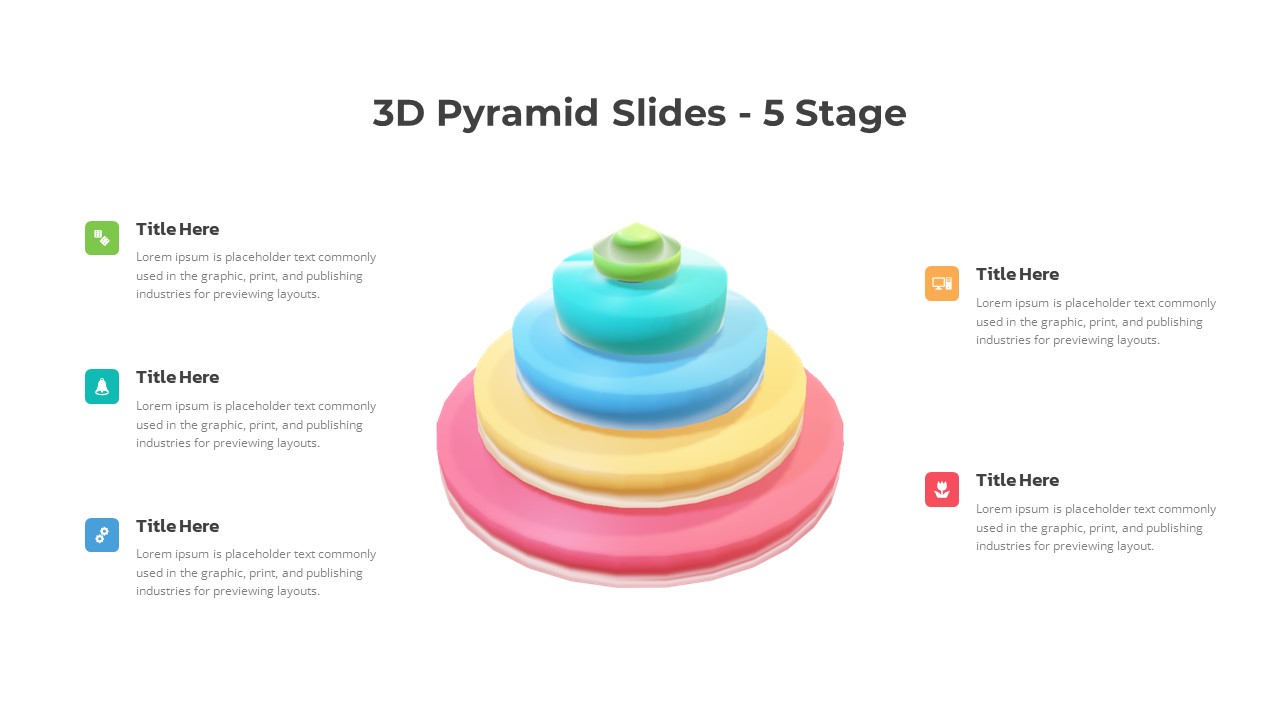
3D Five-Stage Pyramid Diagram Slide Template for PowerPoint & Google Slides
Pyramid
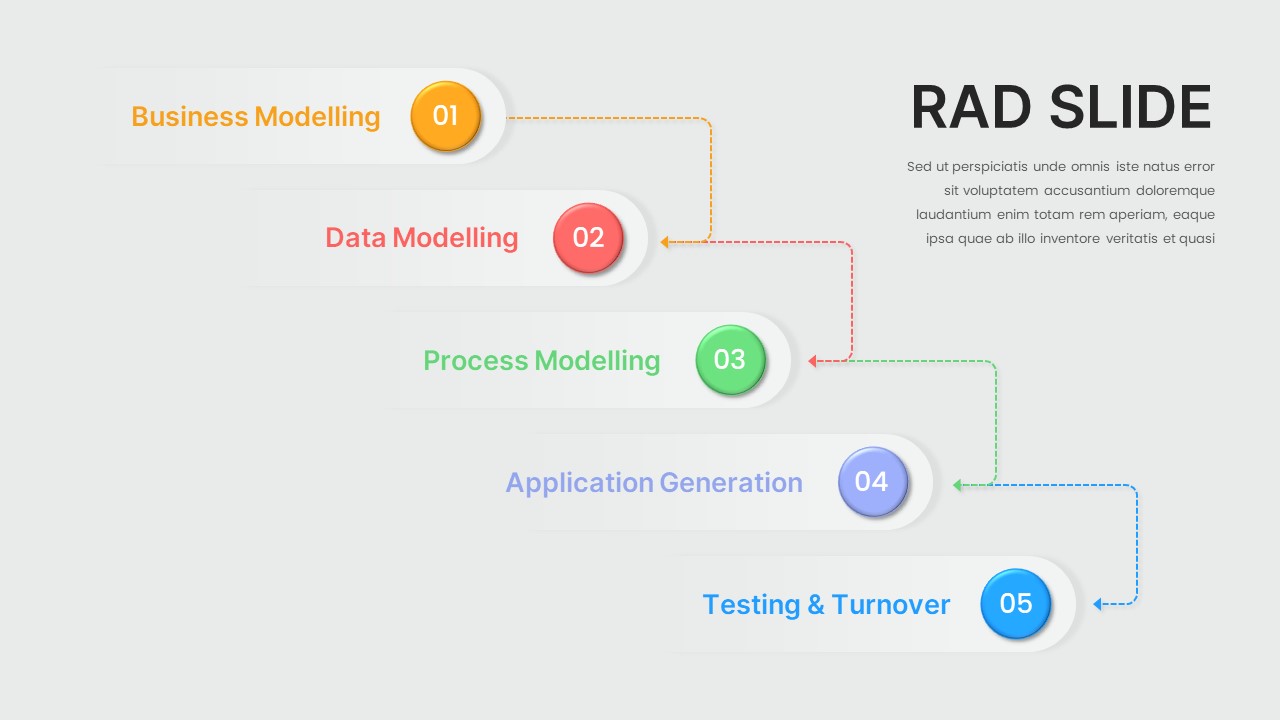
Five-Step Modelling Process Diagram Template for PowerPoint & Google Slides
Process
Five Circle Venn Diagram for Template for PowerPoint & Google Slides
Circular
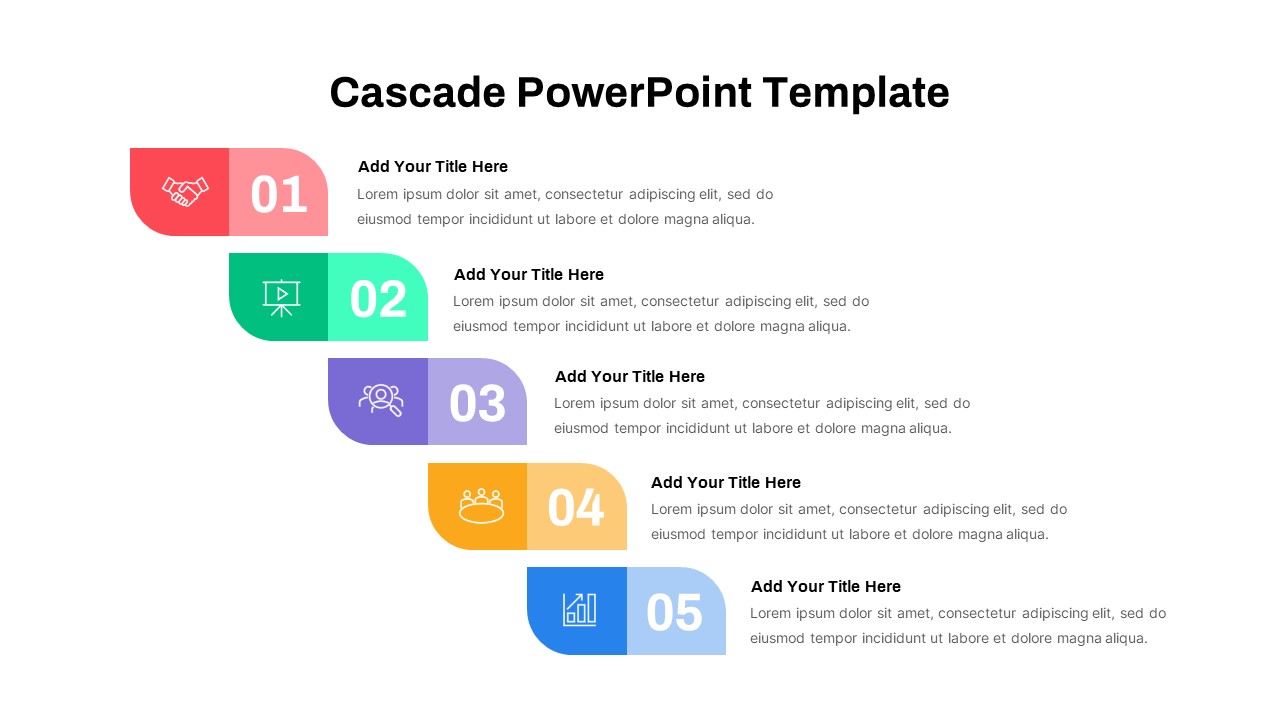
Five-Step Cascade Diagram & Timeline Template for PowerPoint & Google Slides
Process
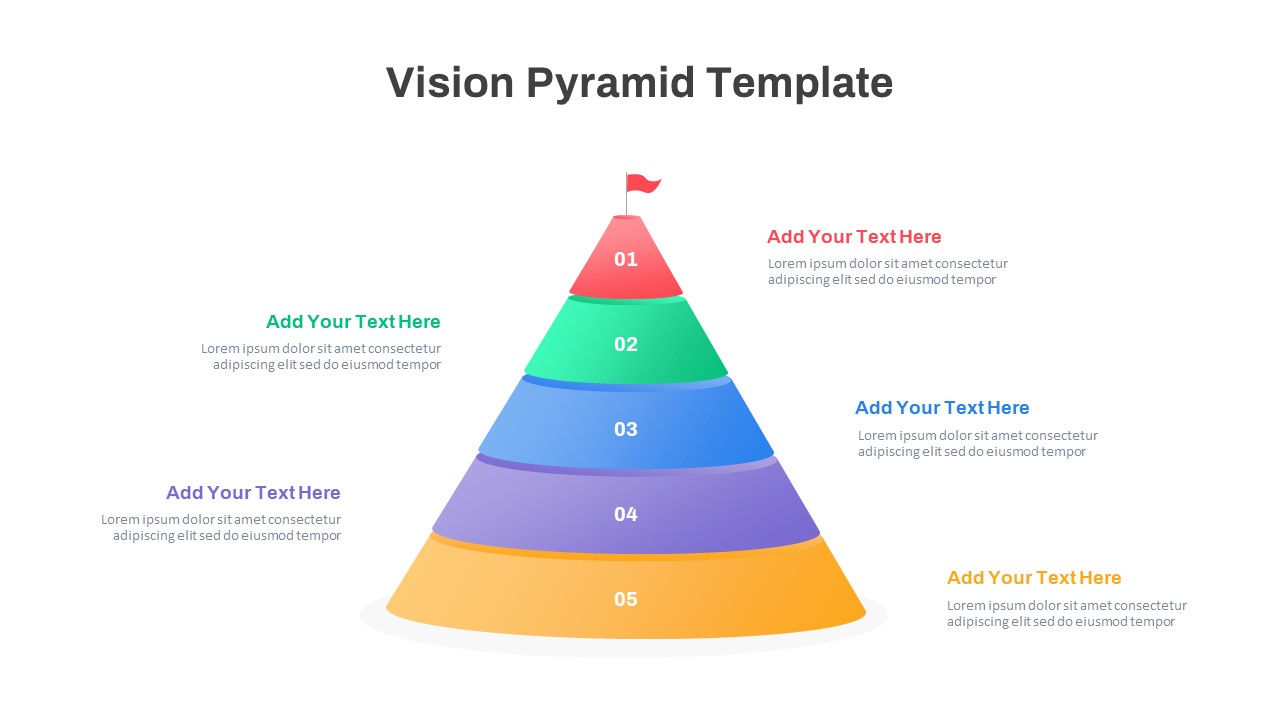
Five-Level Vision Pyramid Diagram Template for PowerPoint & Google Slides
Pyramid
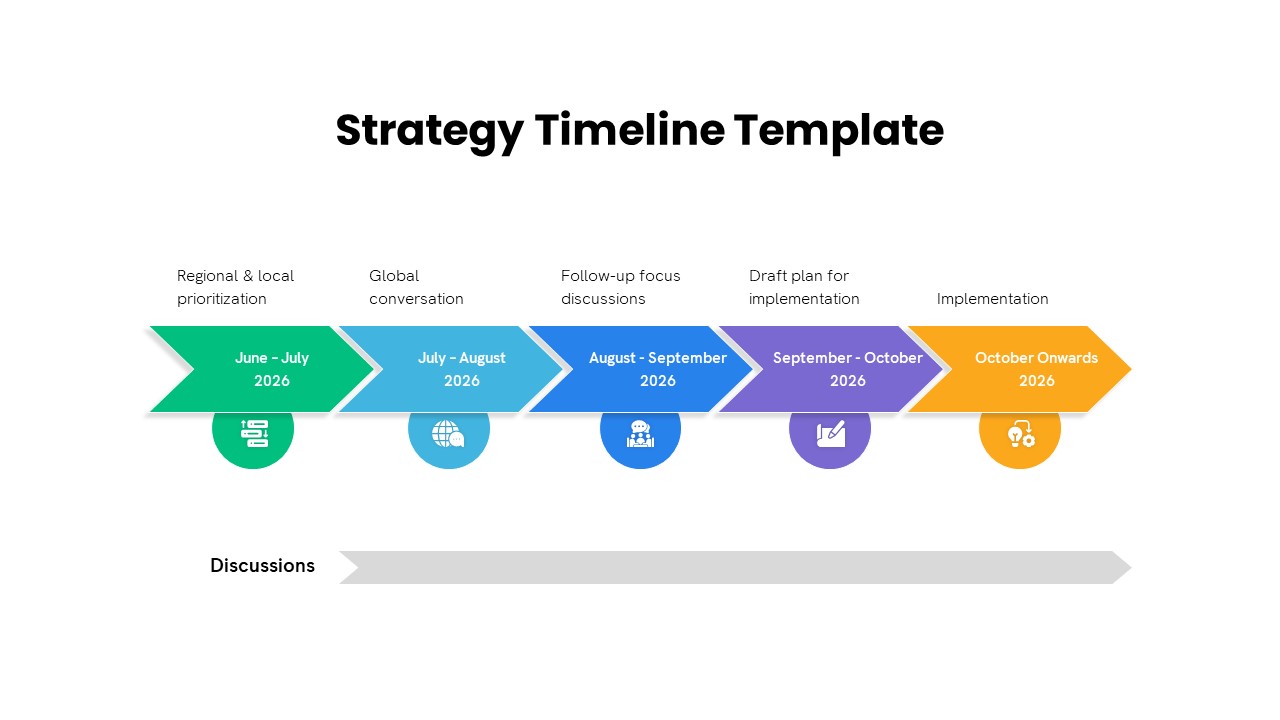
Five-Phase Strategy Timeline Diagram Template for PowerPoint & Google Slides
Timeline
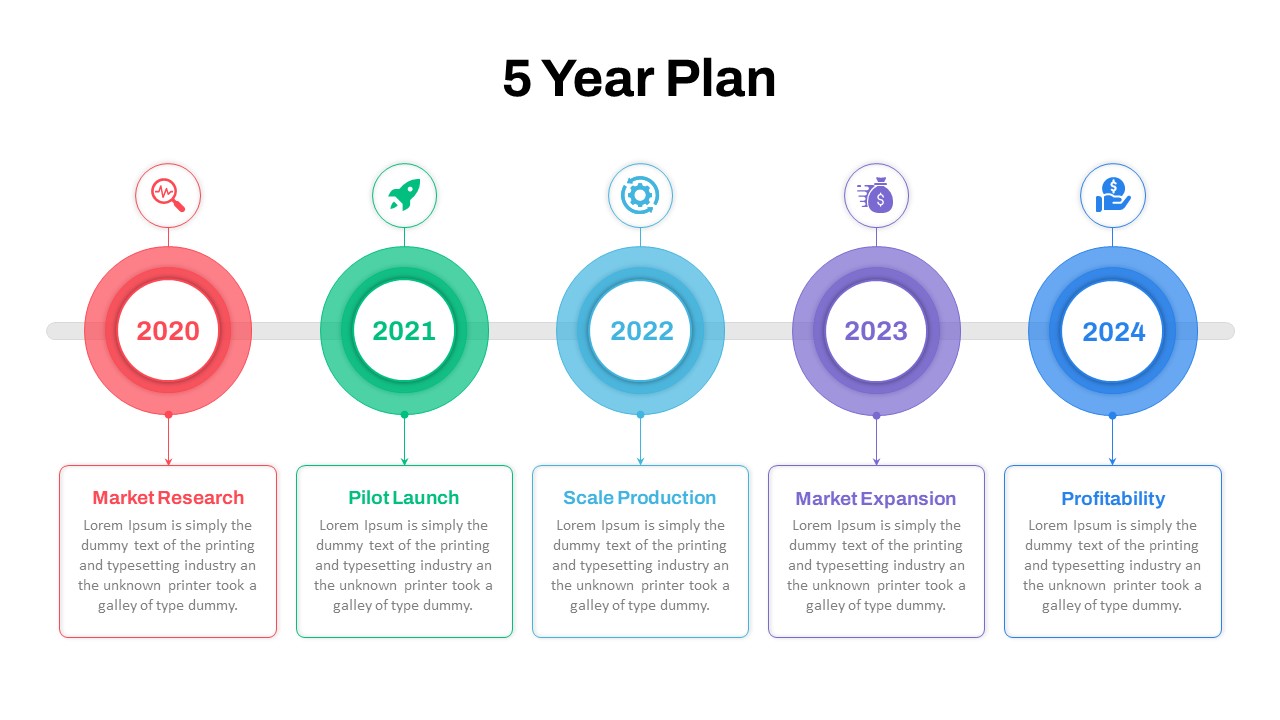
Five-Year Plan Timeline Diagram Template for PowerPoint & Google Slides
Timeline
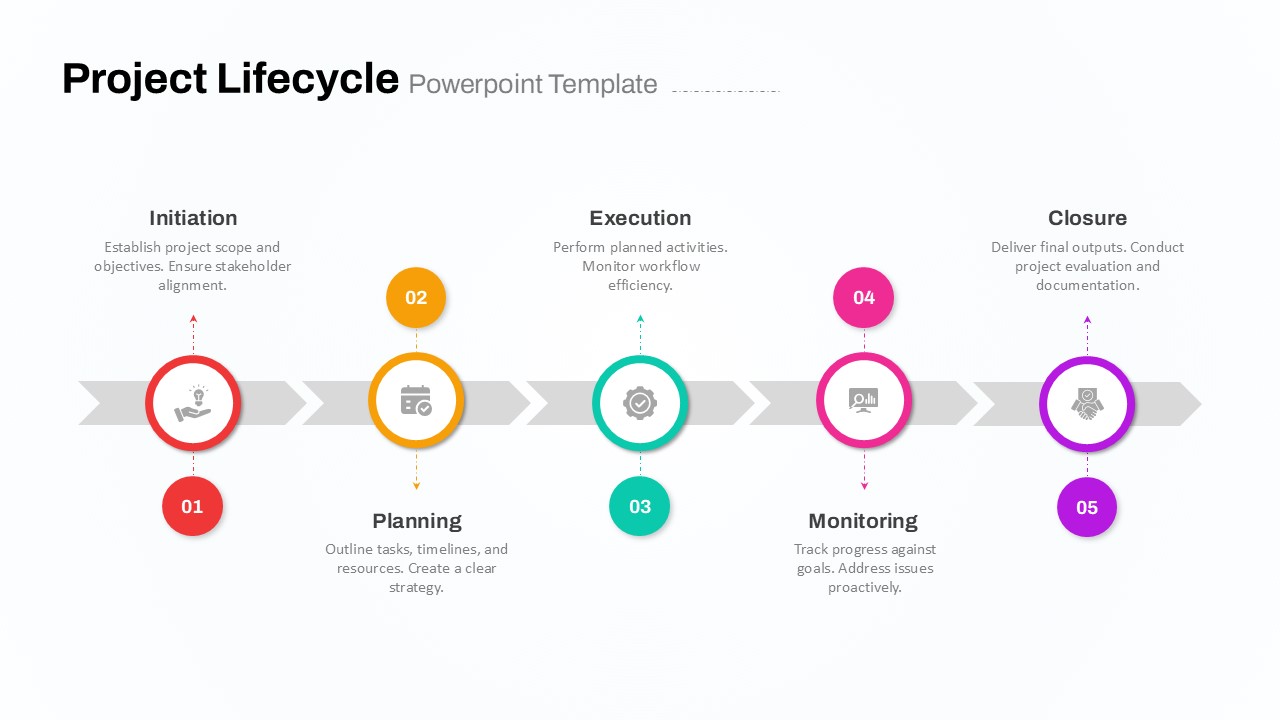
Five-Phase Project Lifecycle Diagram Template for PowerPoint & Google Slides
Infographics
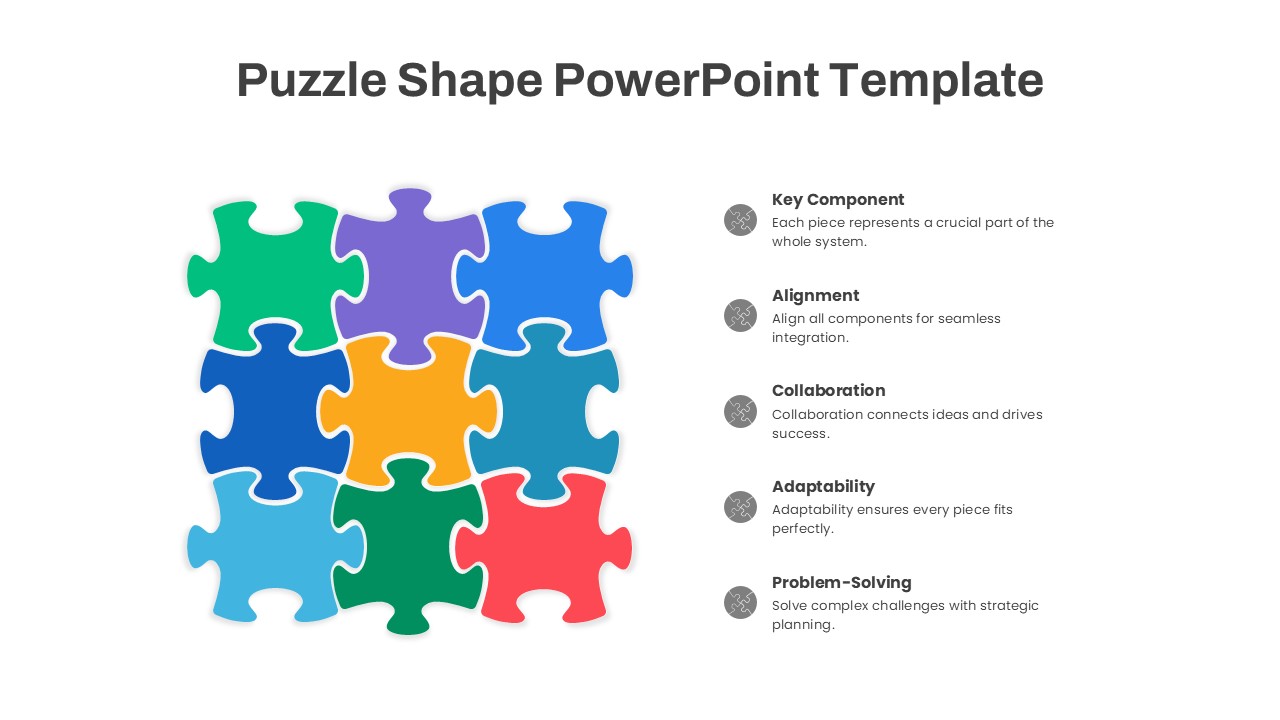
Puzzle Shape Diagram with Five Elements Template for PowerPoint & Google Slides
Circular
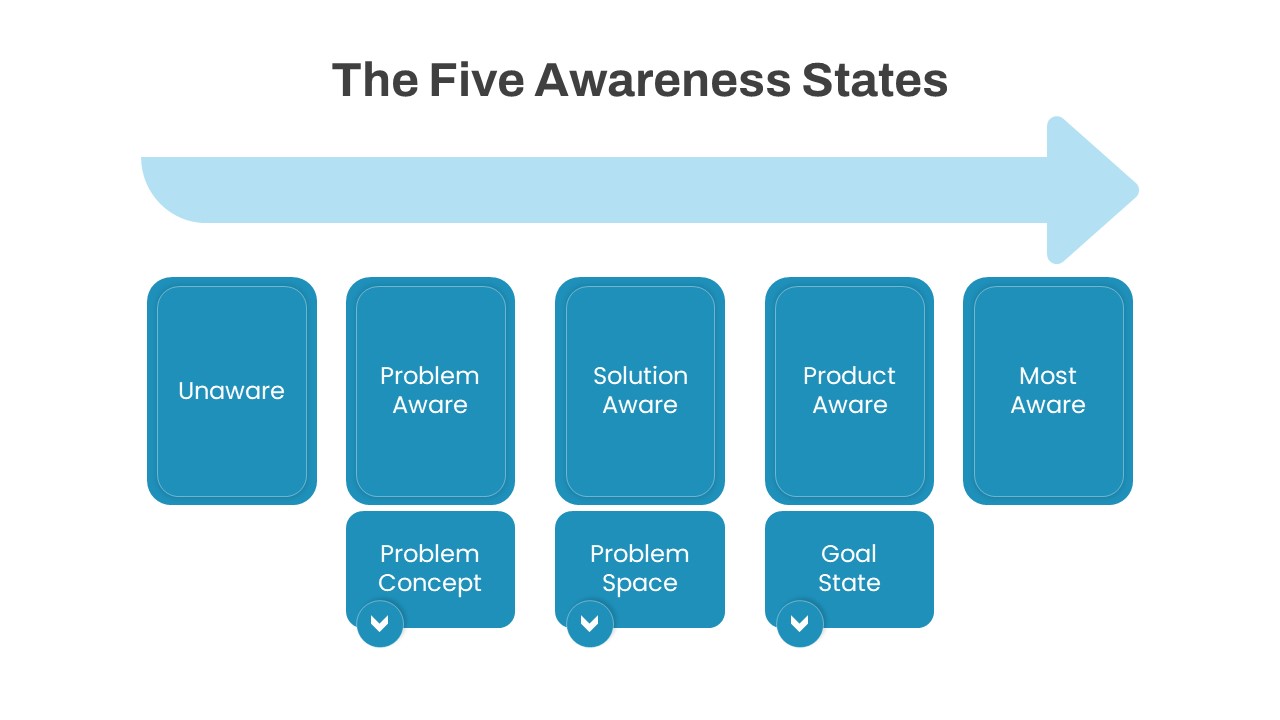
The Five Awareness States diagram template for PowerPoint & Google Slides
Infographics
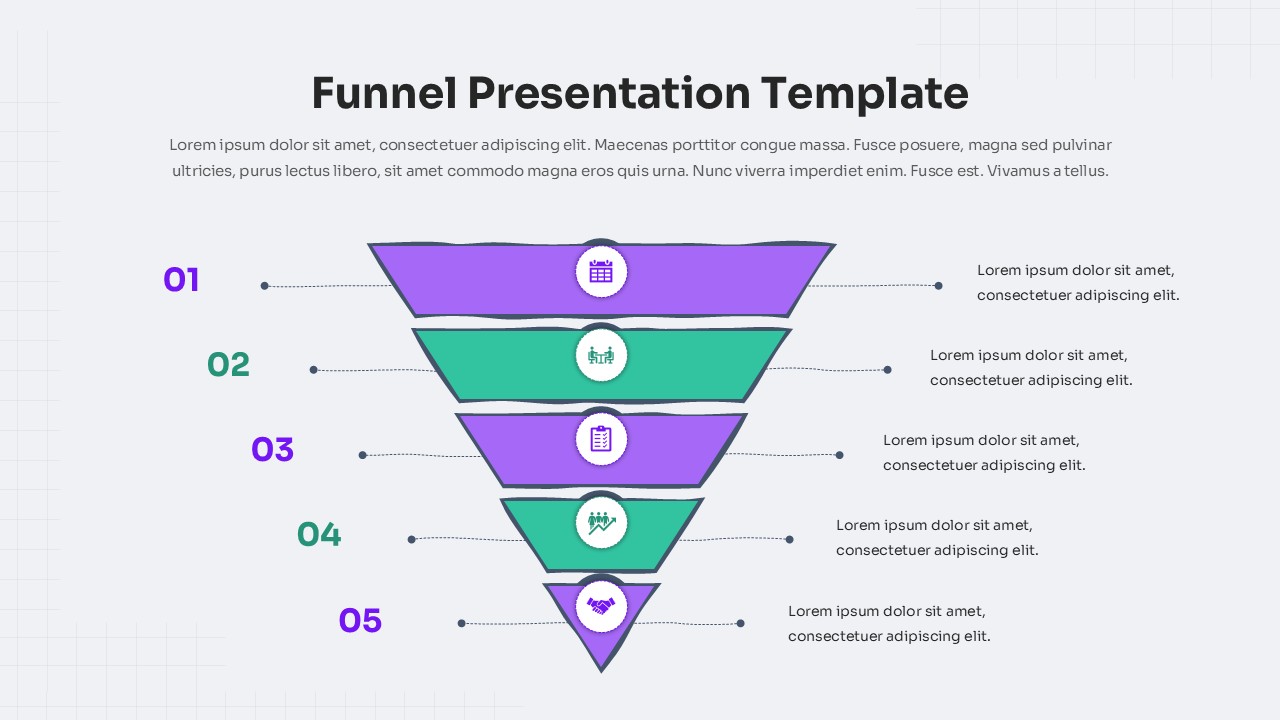
Five-Step Modern Funnel Diagram Template for PowerPoint & Google Slides
Funnel
Five and Six Step Line Linear Stage Diagram for PowerPoint & Google Slides
Infographics
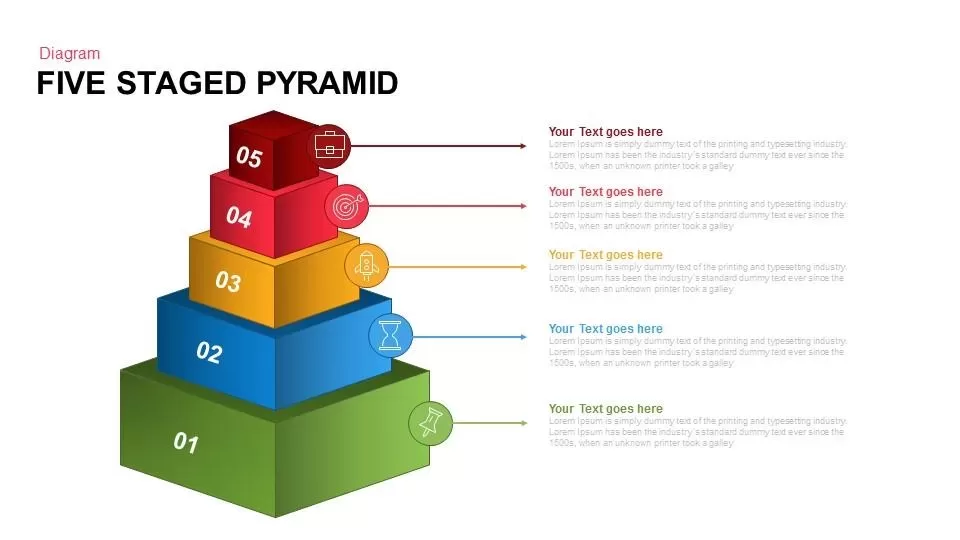
Five Staged Pyramid Diagram for PowerPoint & Google Slides
Pyramid
Five Circular Flow Arrow Diagram for PowerPoint & Google Slides
Arrow
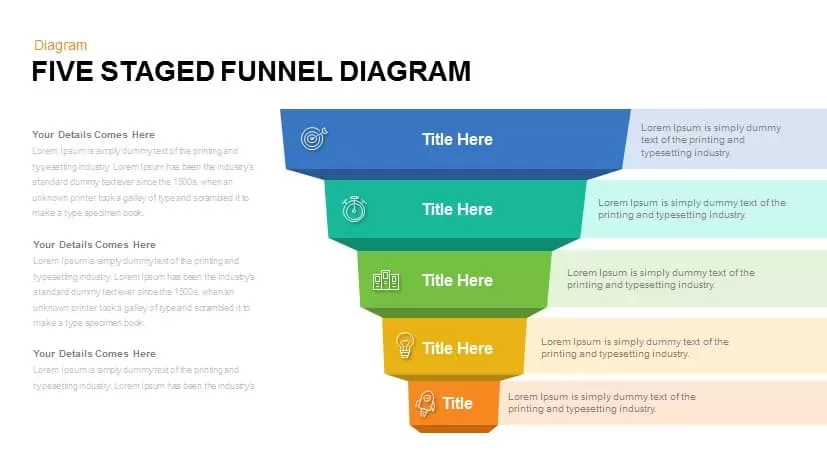
Five Staged Funnel Diagram for PowerPoint & Google Slides
Funnel