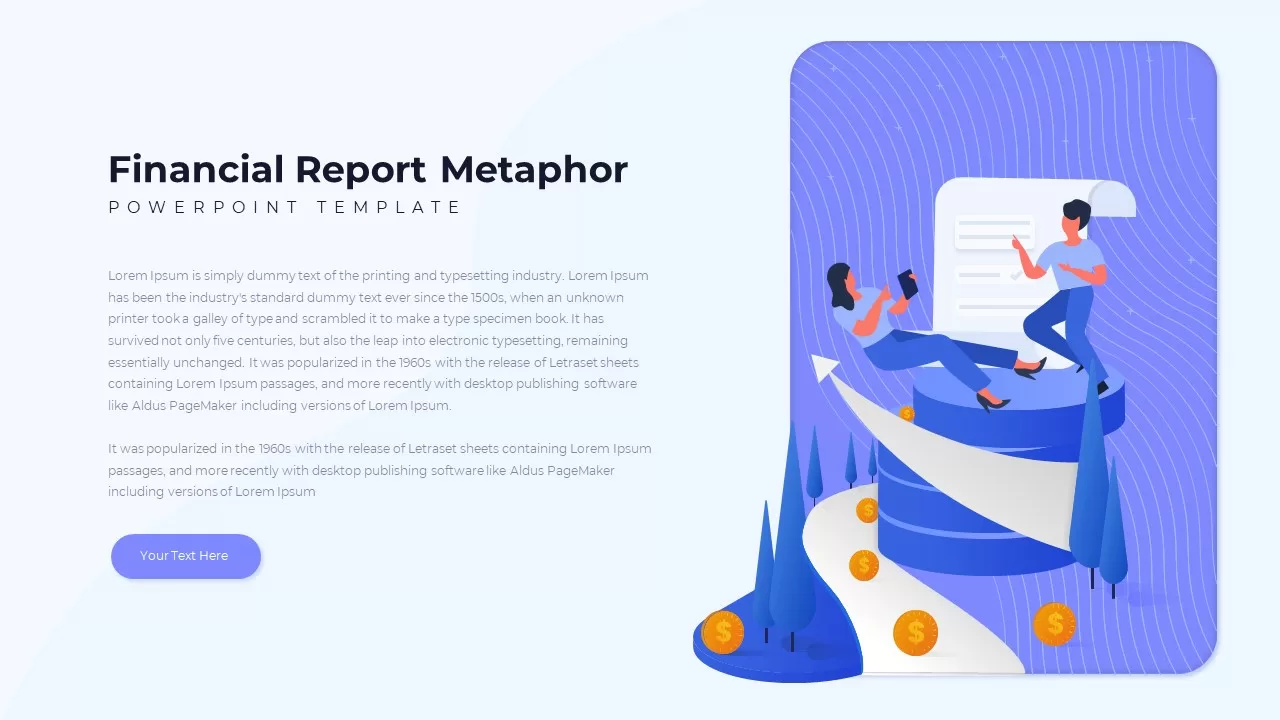
Financial Report Metaphor Illustration Template for PowerPoint & Google Slides


Description
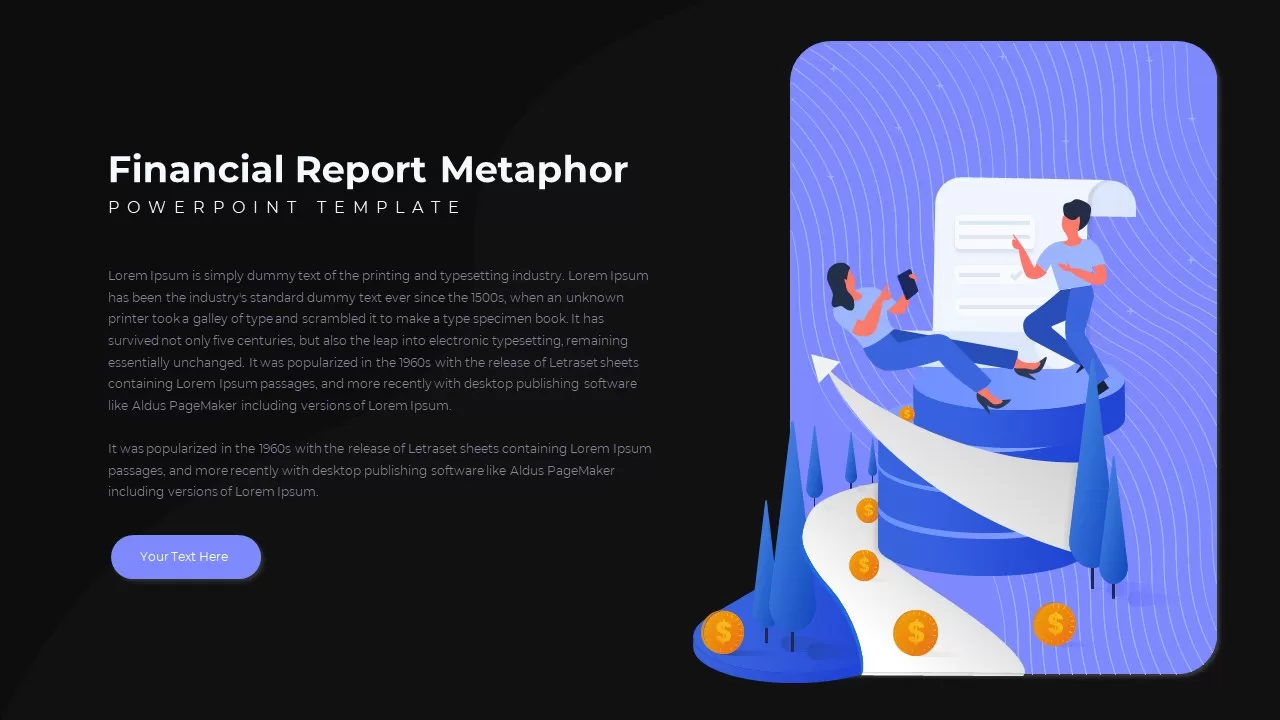
Elevate your financial presentations with this metaphor-driven slide that visualizes reporting concepts through an engaging layered cylinder graphic and clear narrative zones. On the right, an isometric stack of circular discs represents data tiers—revenue, expenses, and profit—wrapped by an ascending arrow guiding viewers through cash flow progression. Golden coin icons dot a curved path toward the top of the cylinder, symbolizing growth milestones. Stylized trees and an abstract waveform background add contextual depth without distracting from key messages. On the left, generous space for headings, paragraphs, and callouts ensures your analysis or executive summary remains organized and impactful.
Built for PowerPoint and Google Slides, this slide leverages master layouts and theme controls to switch between light and dark modes, adjust accent gradients, or apply your brand palette. Customize placeholder text, icons, and colors, and scale vector elements losslessly. Fully editable shapes and arrow paths let you reshuffle layers, change disc hues, or animate sections sequentially. Master slide support guarantees consistent formatting across your deck, reducing manual tweaks and version conflicts.
Beyond financial reporting, this metaphor slide doubles as a framework for budget forecasts, cost breakdowns, investment overviews, and ROI analyses. Duplicate the cylinder across slides to compare fiscal periods, project scenarios, or departmental contributions side by side. With placeholders for numeric data and charts, embed mini-graphs or KPIs directly within the layout. The modular design empowers CFOs, analysts, and consultants to adapt the slide for board meetings, investor updates, or performance reviews. Use entrance animations to guide stakeholders through quarterly results, budgeting frameworks, or cash flow analyses, turning abstract metrics into engaging, decision-driving visuals.
Who is it for
CFOs, financial analysts, accountants, and management consultants will leverage this slide to present clear, memorable financial narratives during board meetings, investor pitches, and executive briefings.
Other Uses
Repurpose this layout for budget planning sessions, cost-benefit analyses, portfolio breakdowns, marketing ROI reports, or departmental performance reviews by relabeling tiers and embedding custom data visuals.
Login to download this file

Item ID
SB01971
Related Templates

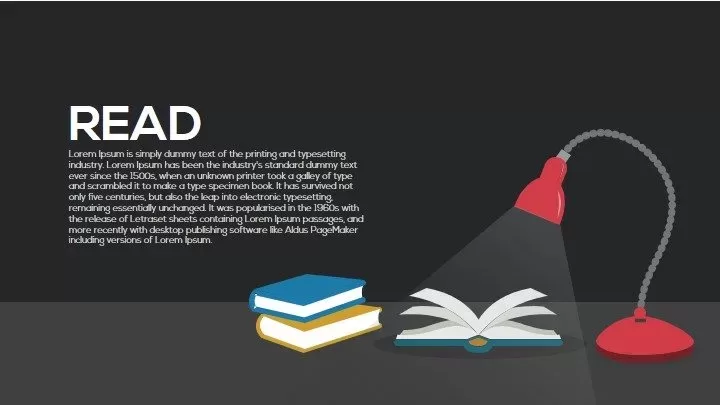
Read Metaphor Concept Illustration Slide Template for PowerPoint & Google Slides
Infographics
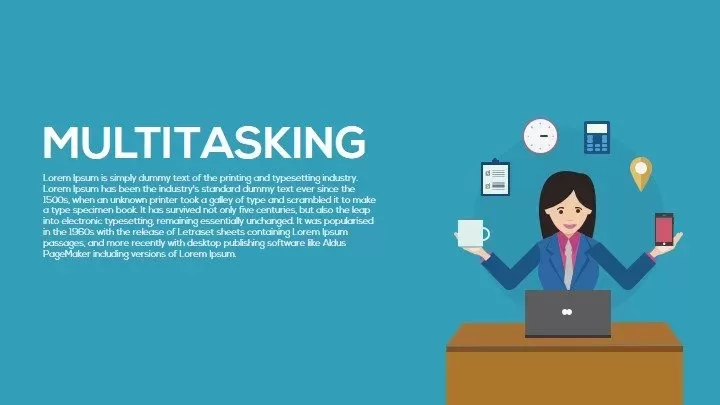
Metaphor Multitasking Illustration Template for PowerPoint & Google Slides
Business
Metaphor Knowledge Illustration Slide Template for PowerPoint & Google Slides
Infographics

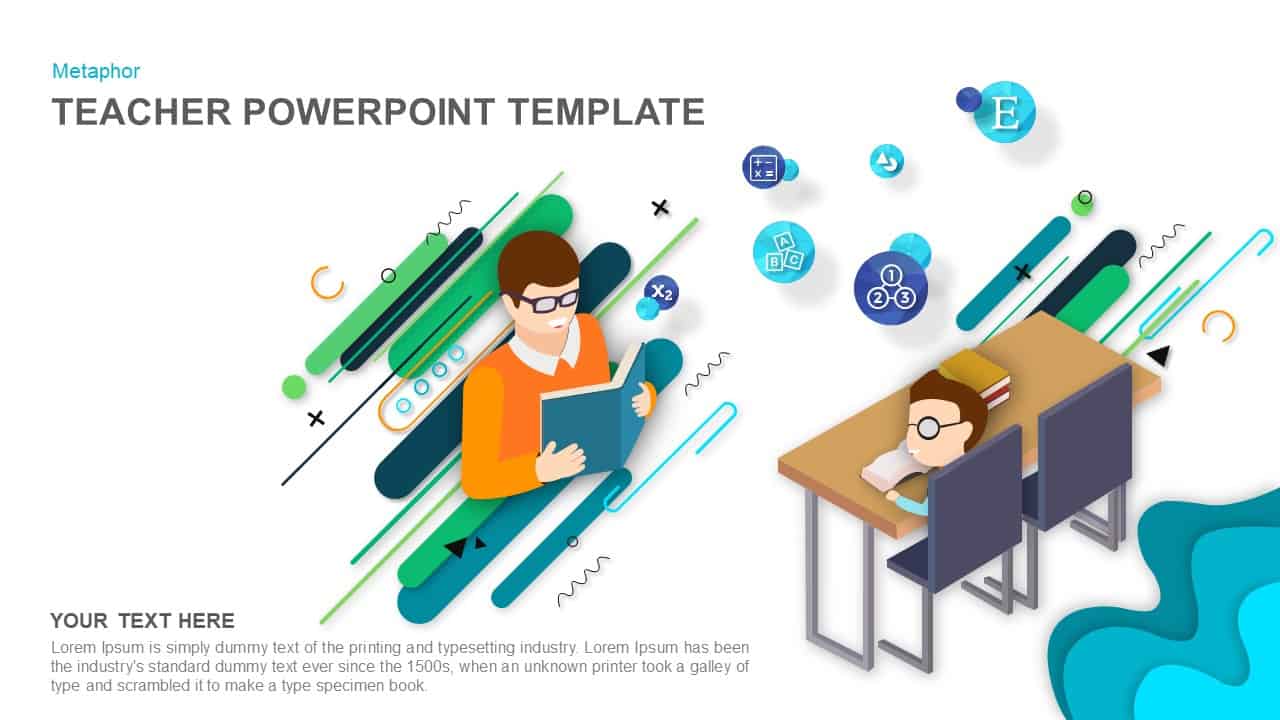
Teacher Illustration Metaphor Slide Template for PowerPoint & Google Slides
Process

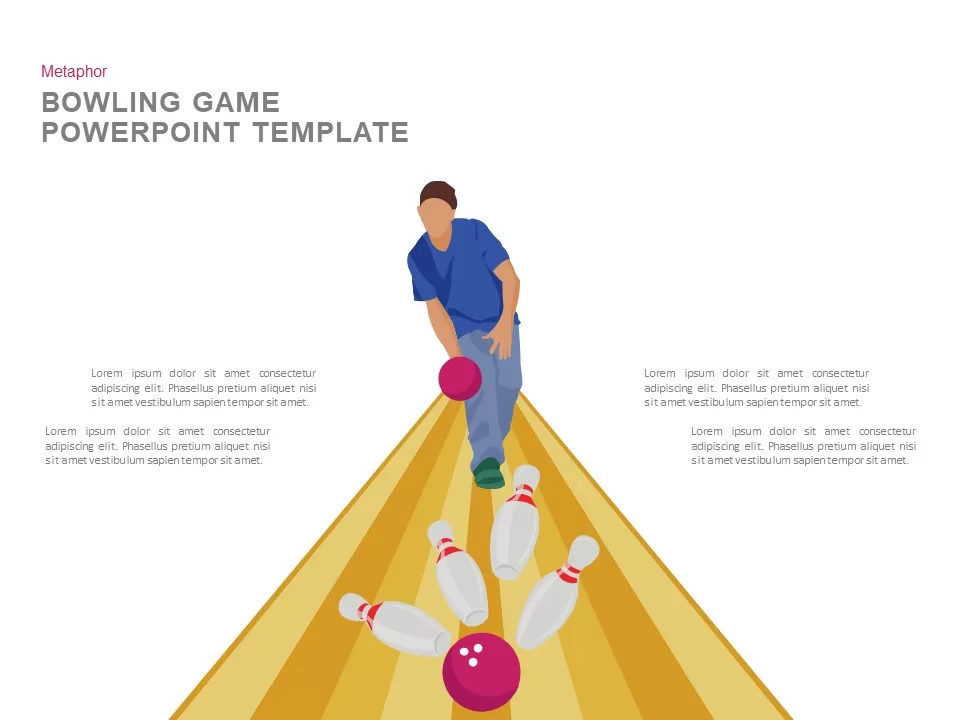
Bowling Game Illustration Metaphor Template for PowerPoint & Google Slides
Process
Collaborative Teamwork Metaphor Illustration Template for PowerPoint & Google Slides
Leadership
Social Media Metaphor Illustration Template for PowerPoint & Google Slides
Digital Marketing
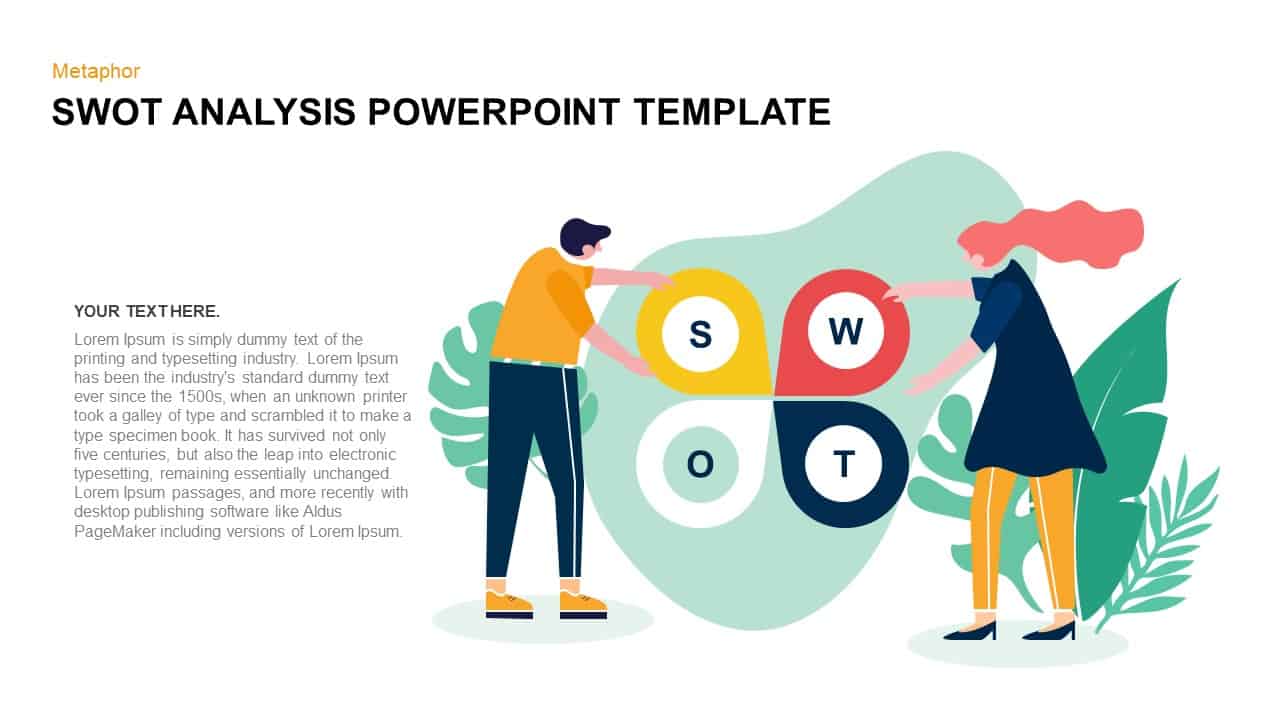
SWOT Analysis Metaphor Illustration Template for PowerPoint & Google Slides
SWOT
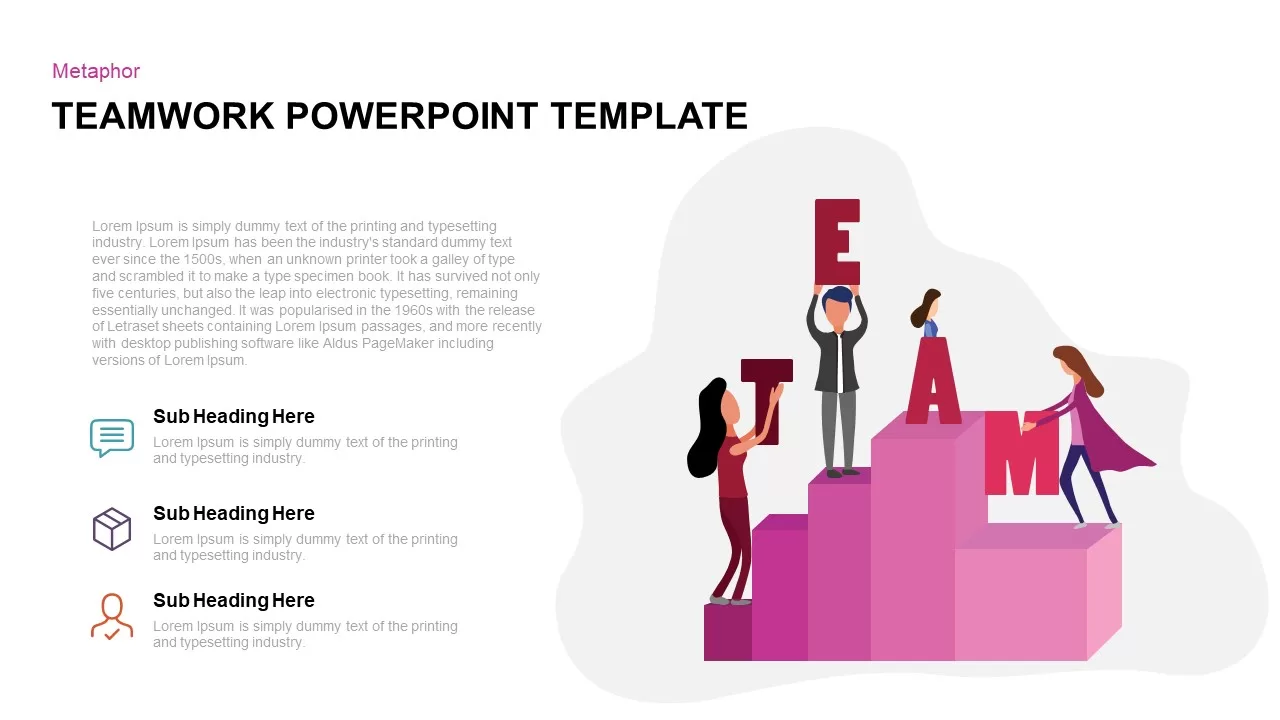
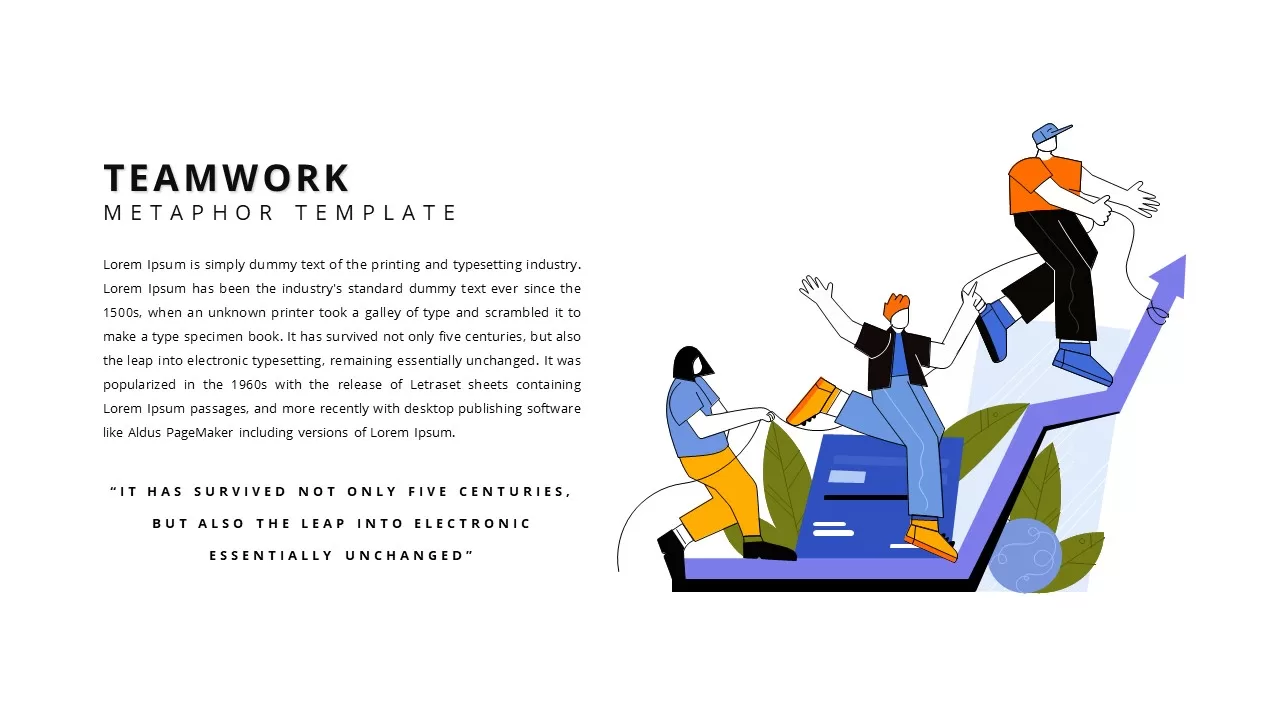
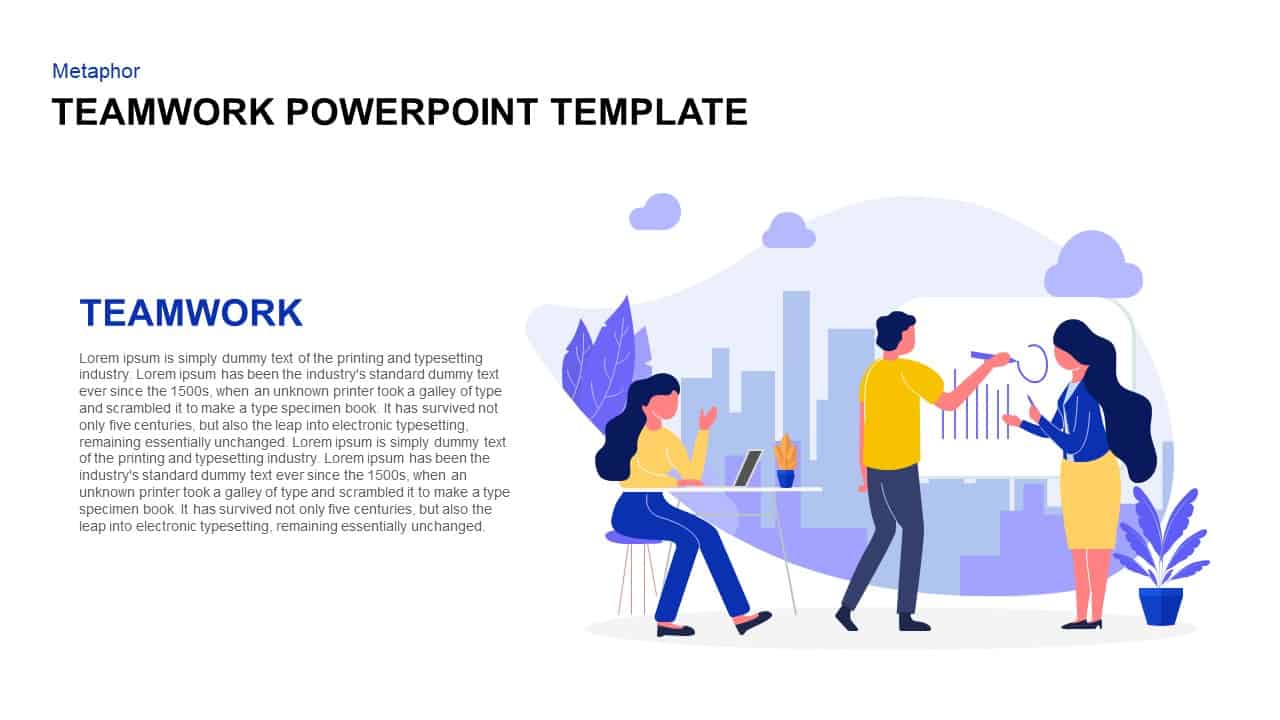
Teamwork Metaphor Illustration Template for PowerPoint & Google Slides
Leadership

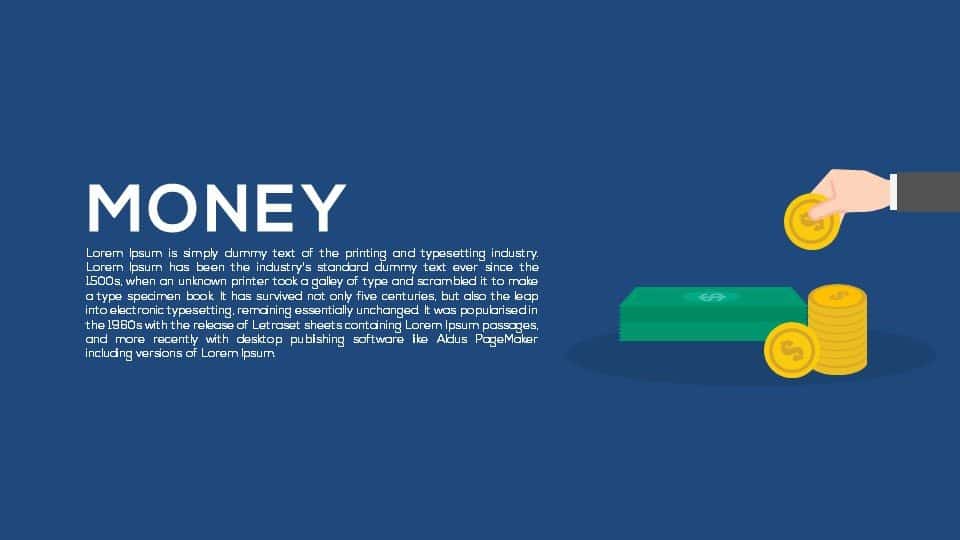
Money Metaphor Financial Overview Template for PowerPoint & Google Slides
Finance
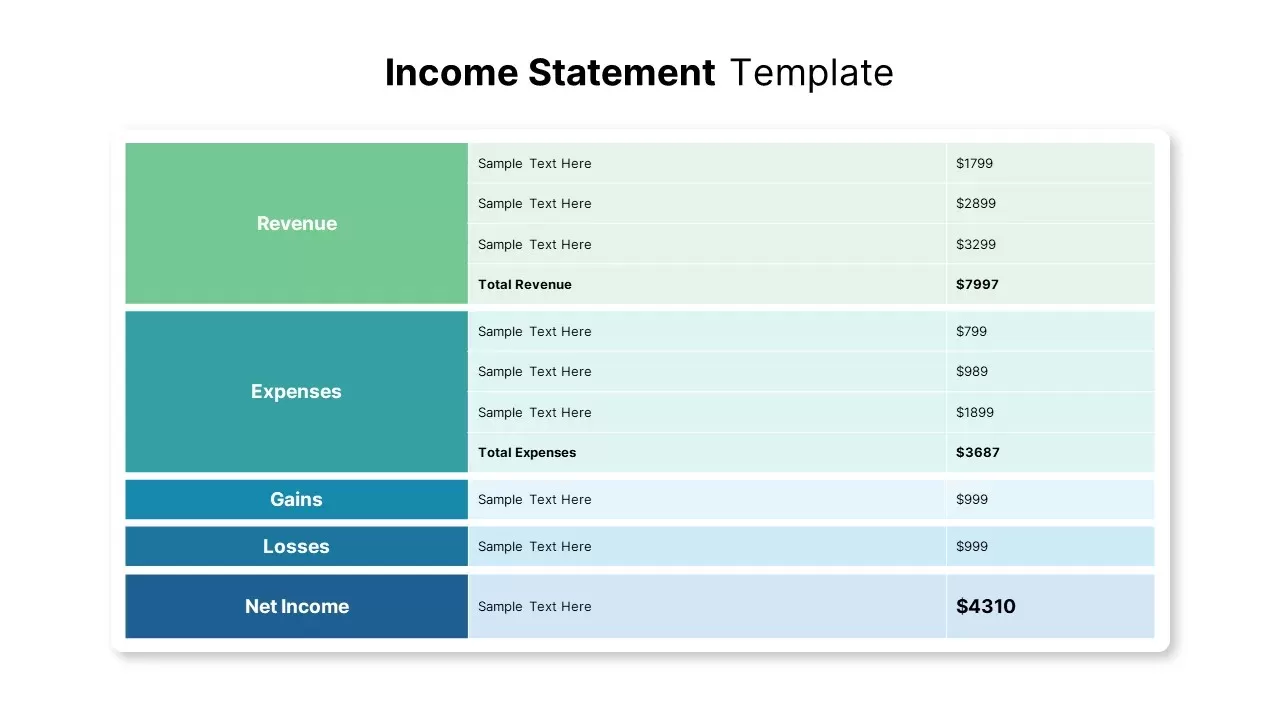
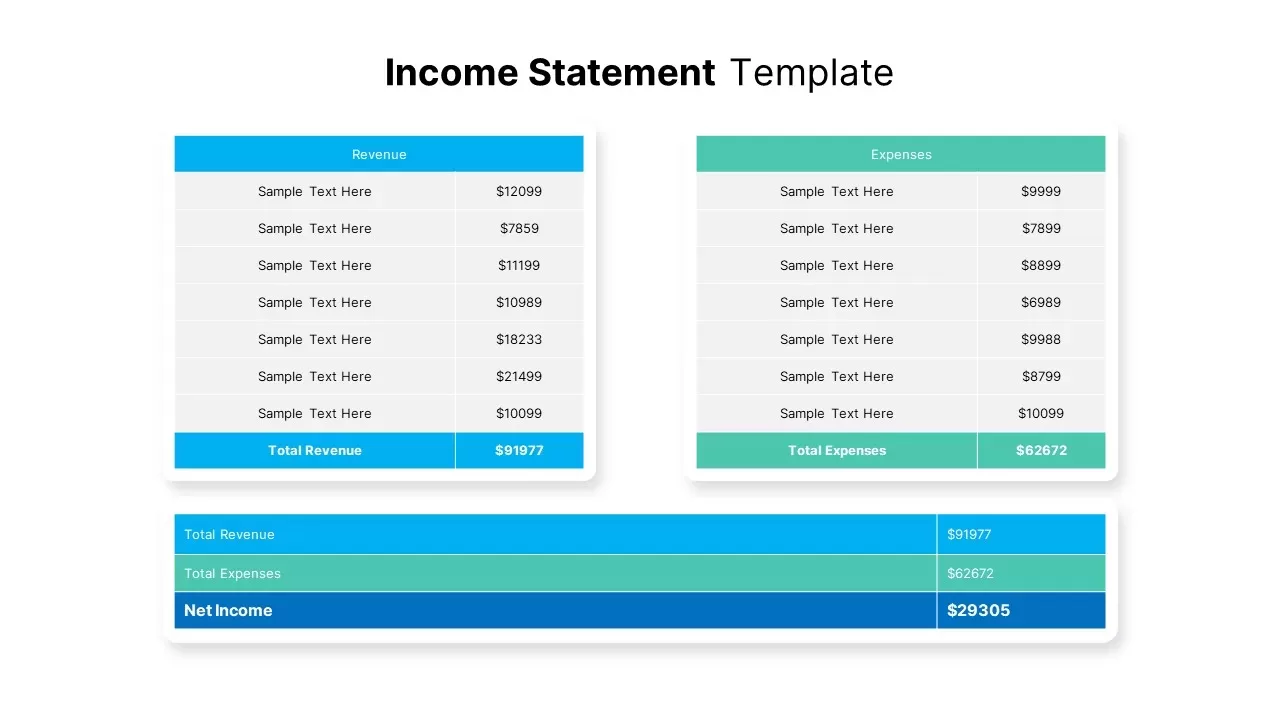
Income Statement Financial Report Template for PowerPoint & Google Slides
Business Report

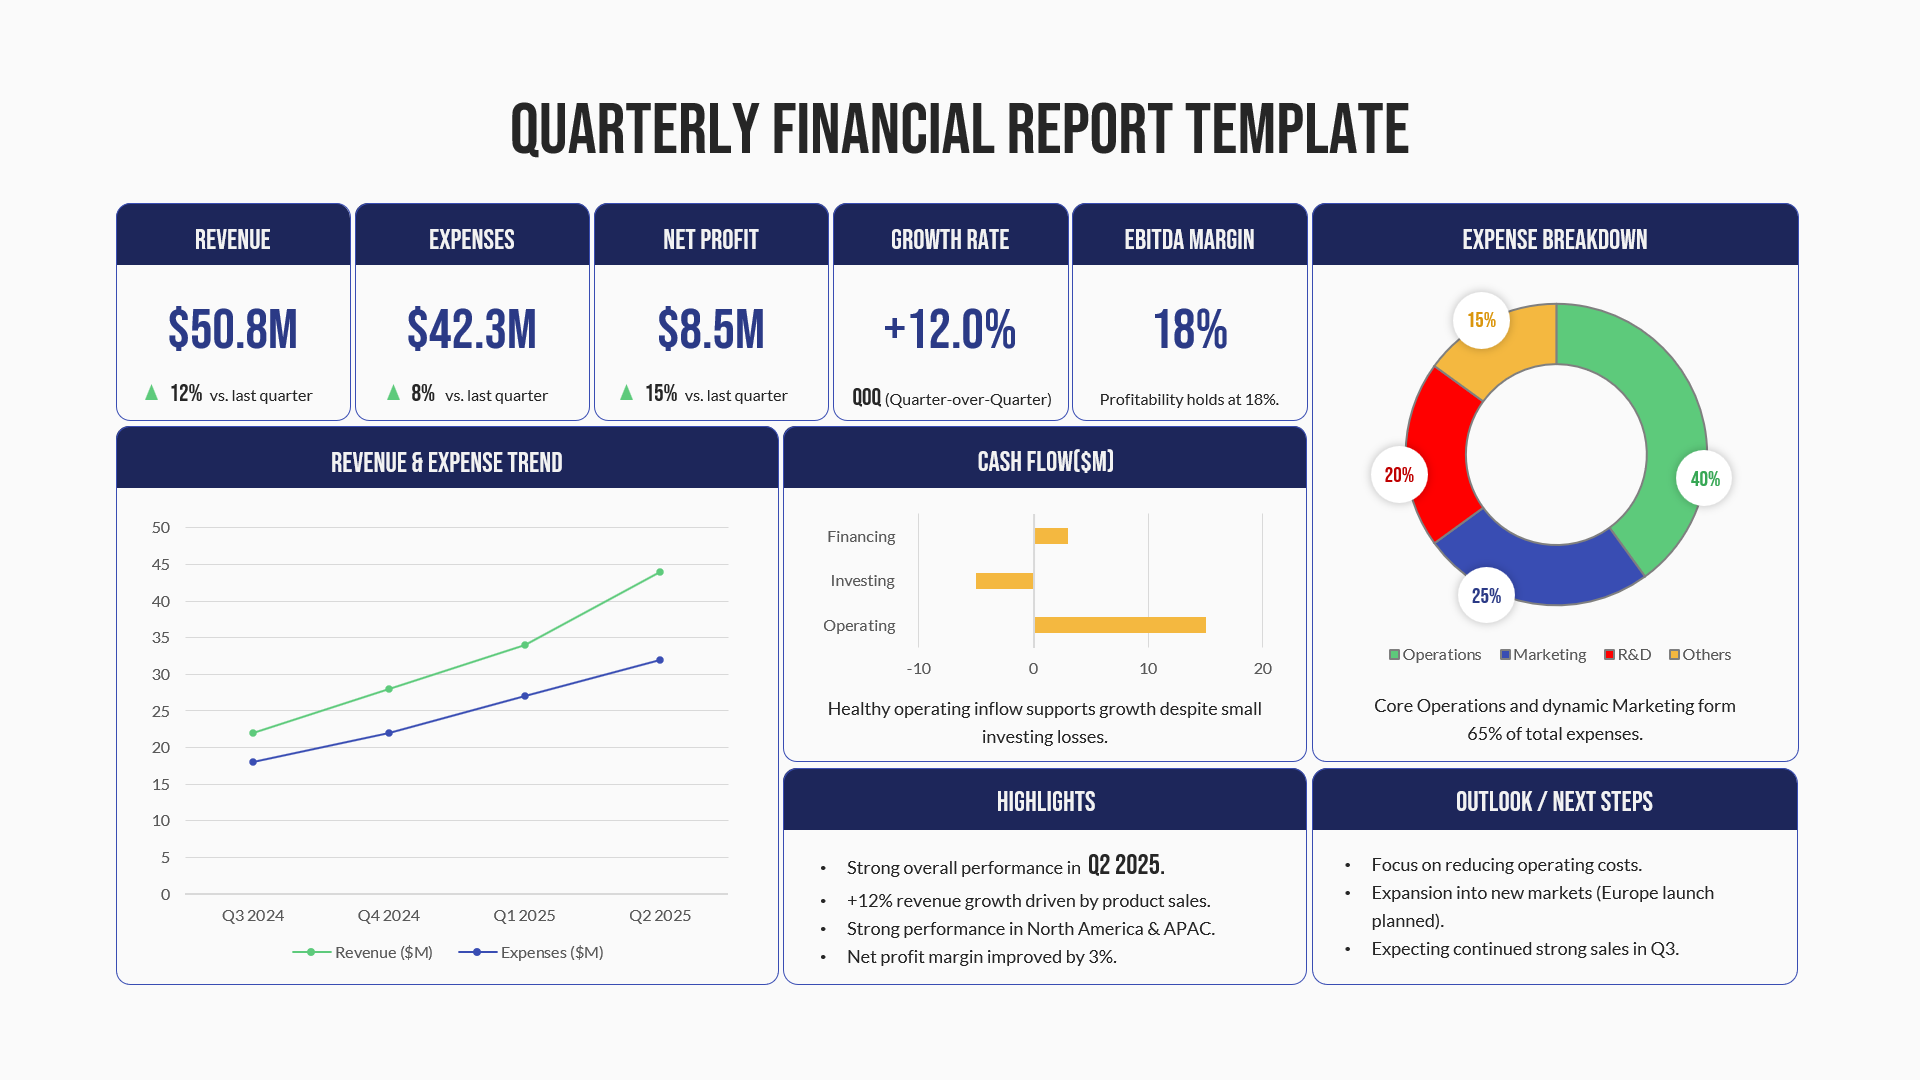
Quarterly Financial Report Dashboard Template for PowerPoint & Google Slides
Finance
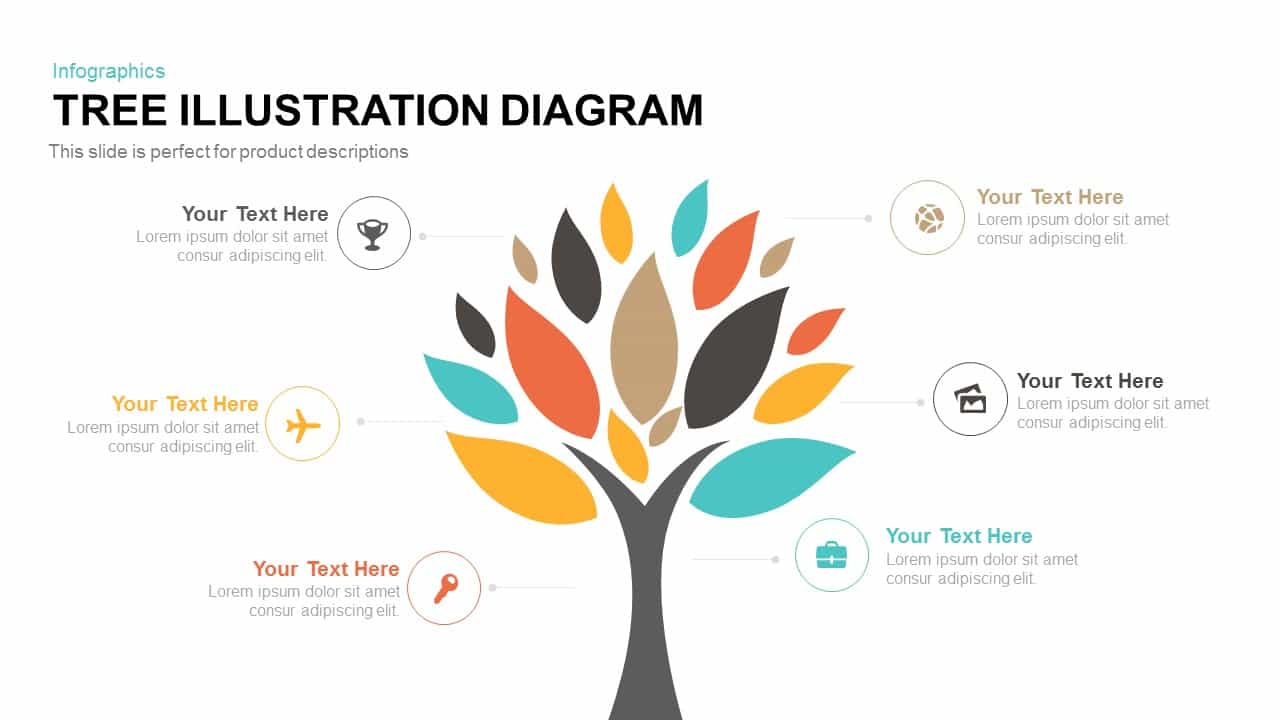
Tree Illustration template for PowerPoint & Google Slides
Process
Minimalist Cloud Illustration Slide Template for PowerPoint & Google Slides
Infographics
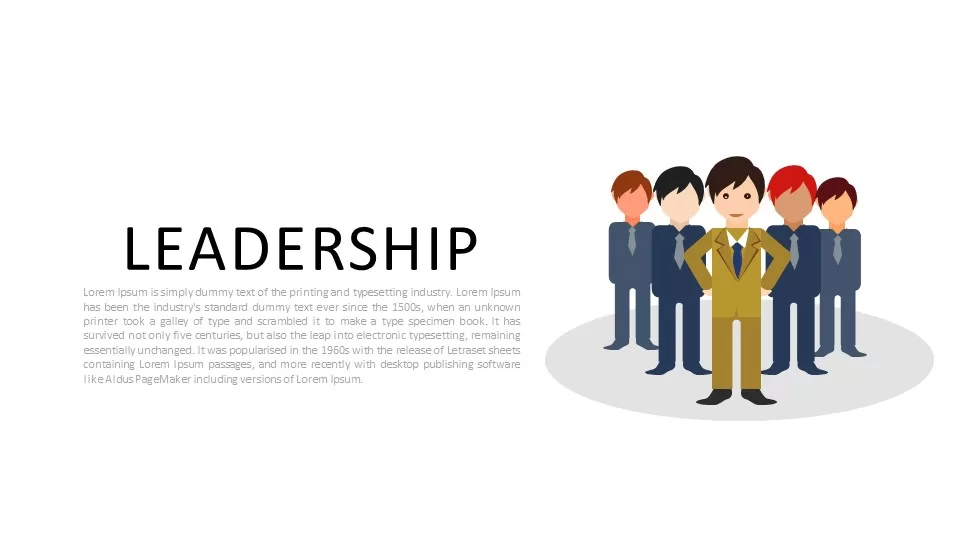
Corporate Leadership Team Illustration Template for PowerPoint & Google Slides
Leadership
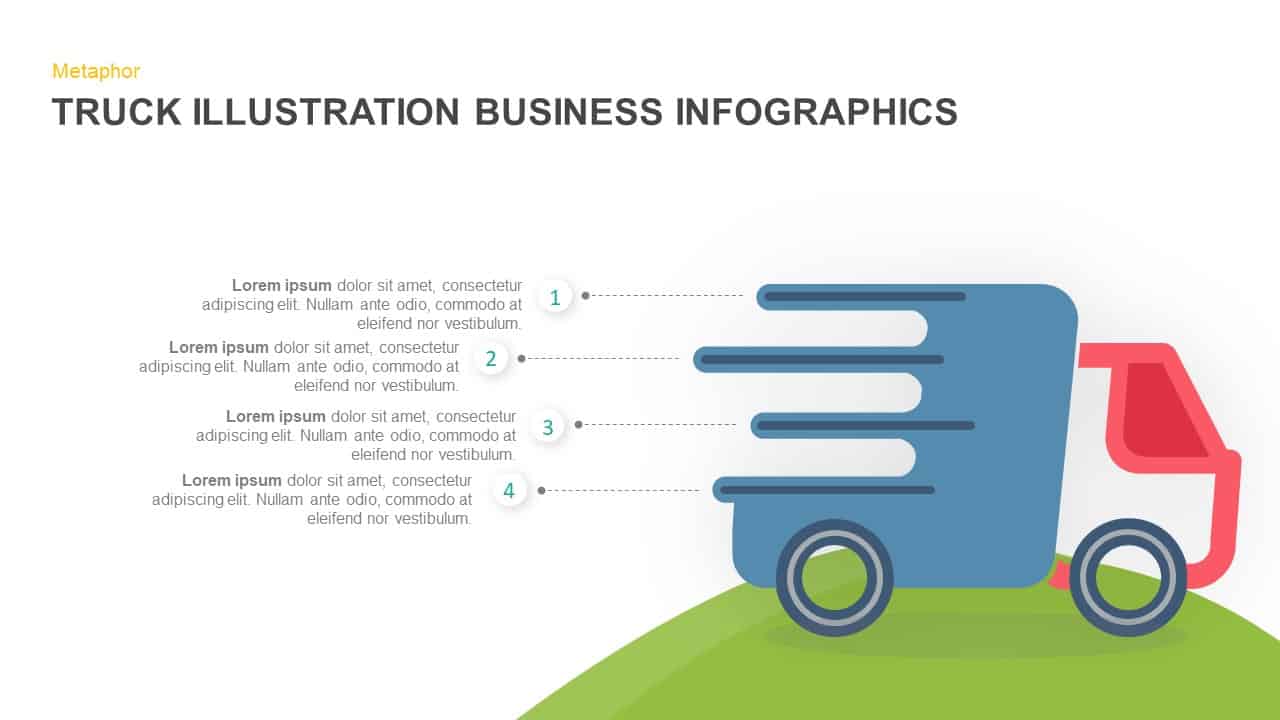
Truck Illustration Infographic Template for PowerPoint & Google Slides
Process
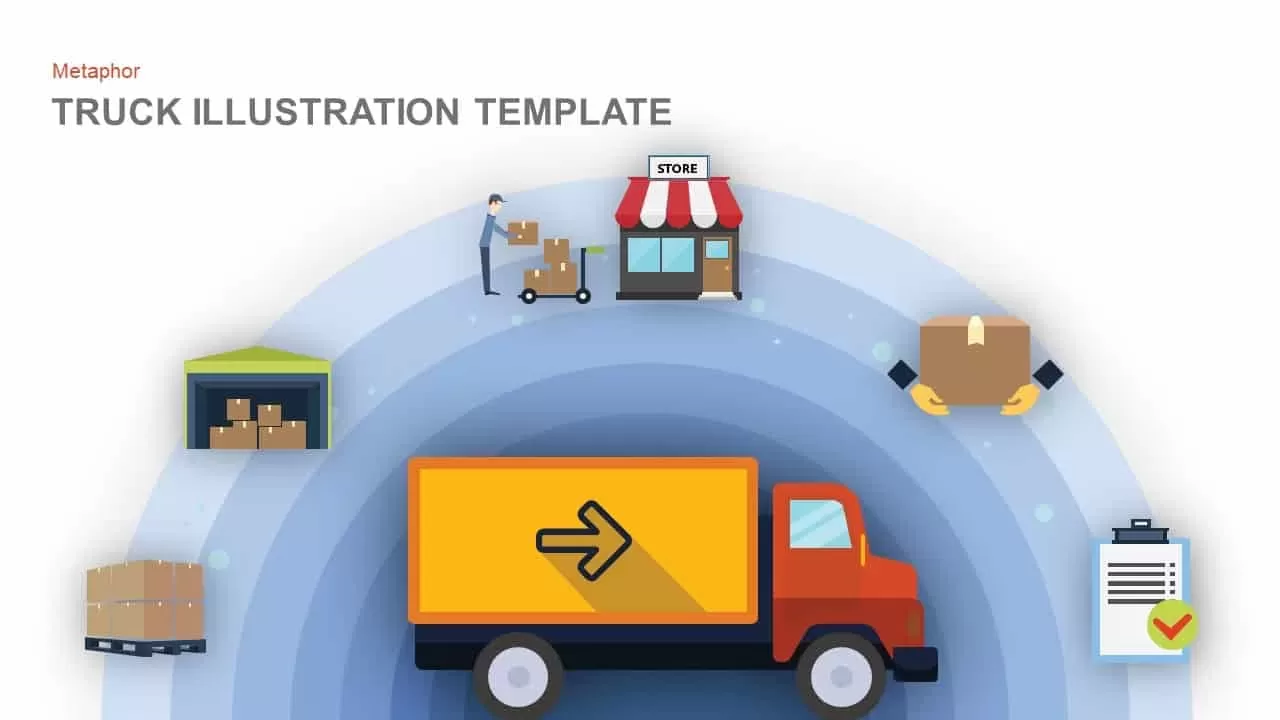
Logistics Truck Illustration Infographic Template for PowerPoint & Google Slides
Process
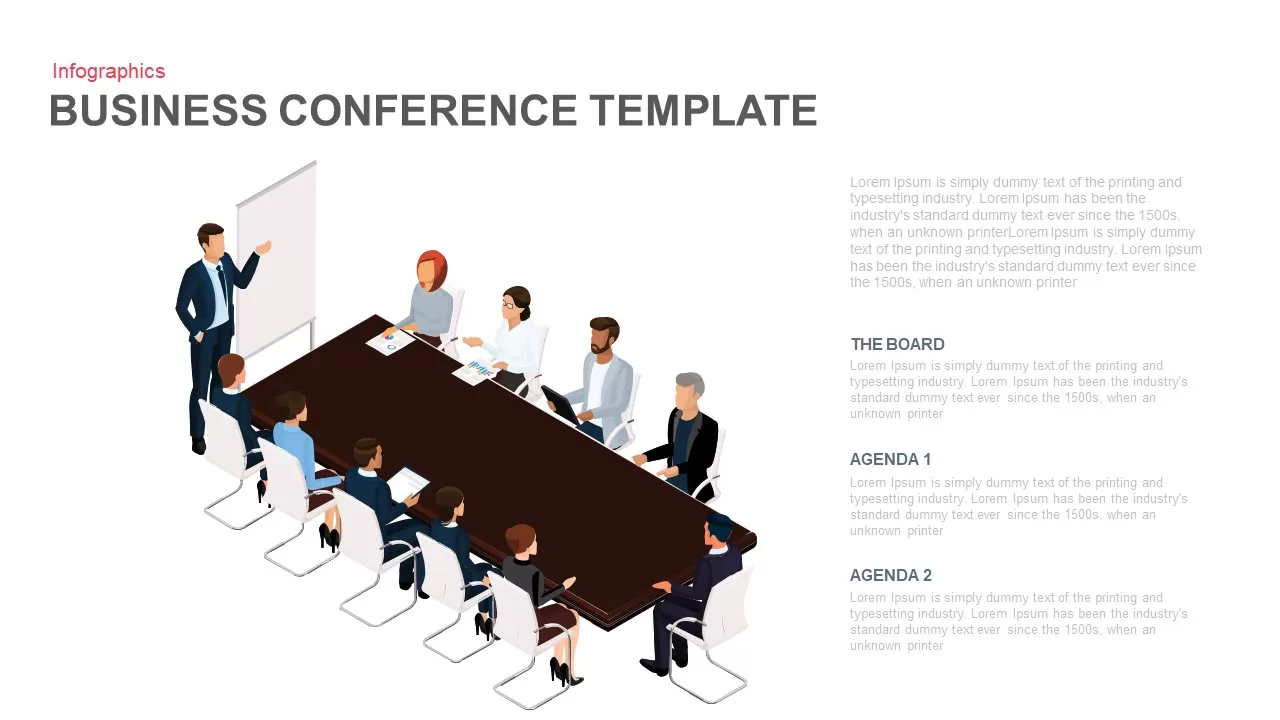
Business Conference Meeting Illustration Template for PowerPoint & Google Slides
Pitch Deck
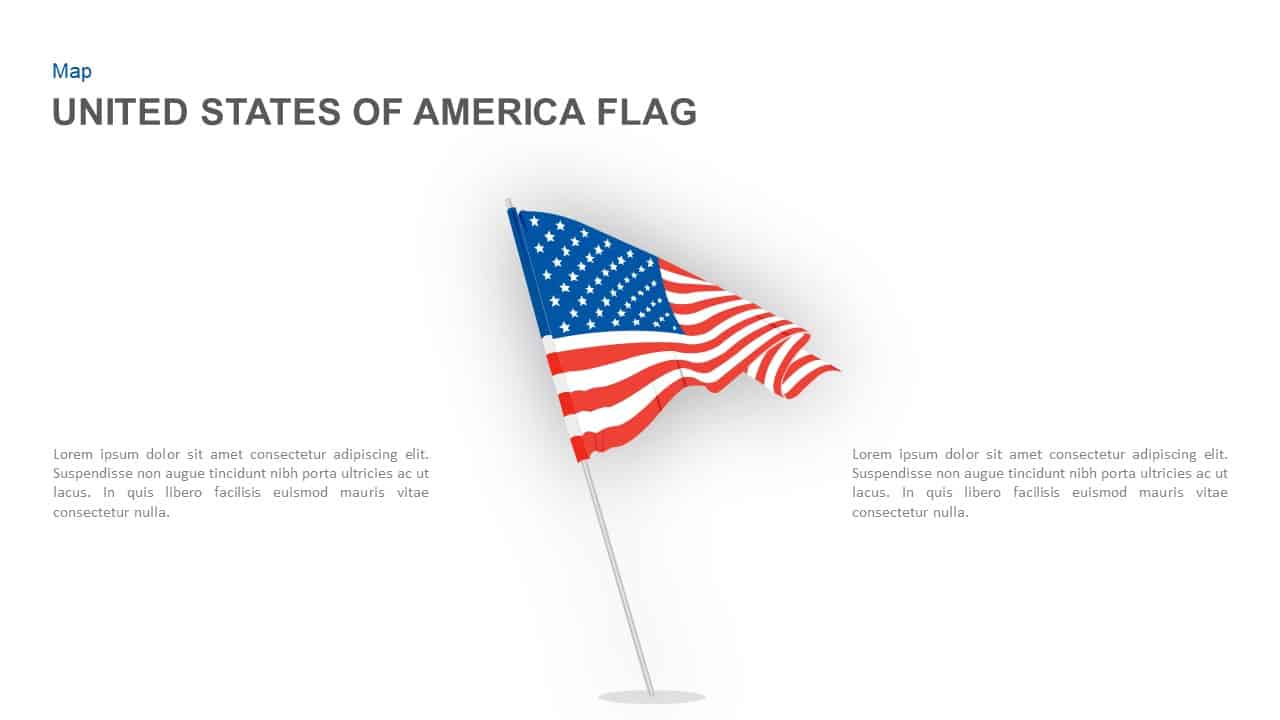
United States Flag Illustration Template for PowerPoint & Google Slides
World Maps
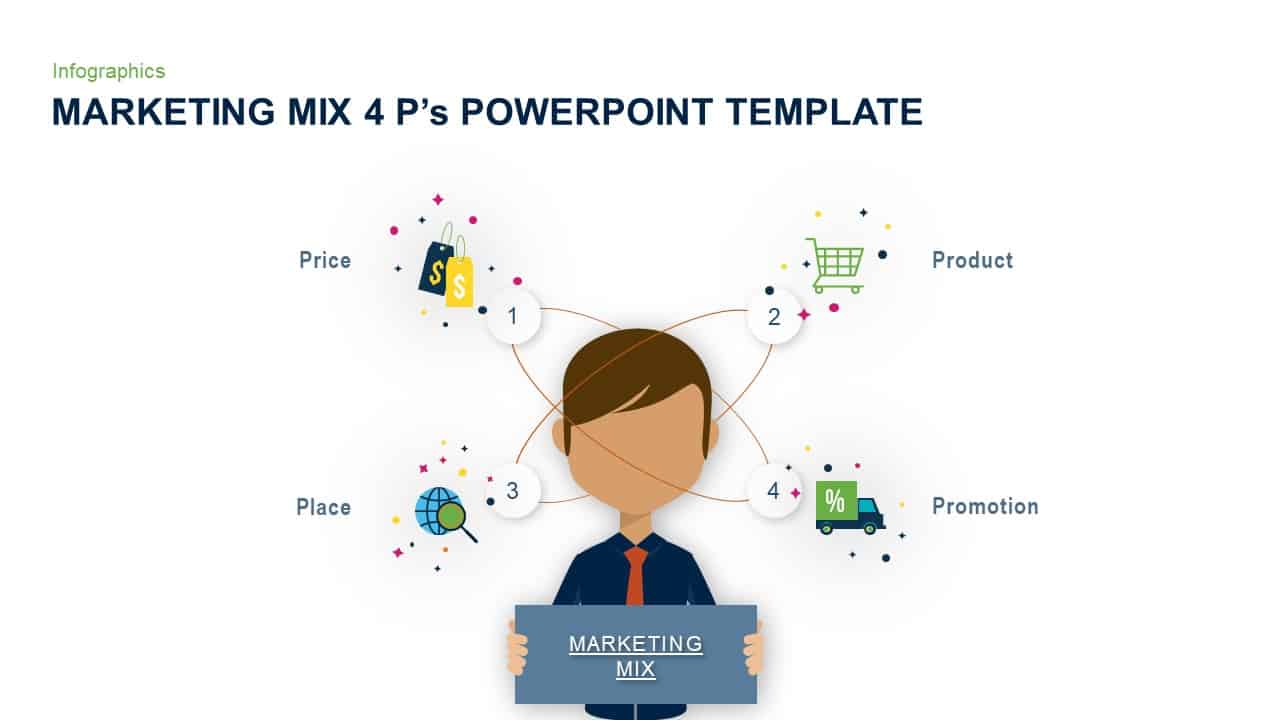
Marketing Mix 4Ps Concept Illustration Template for PowerPoint & Google Slides
Comparison
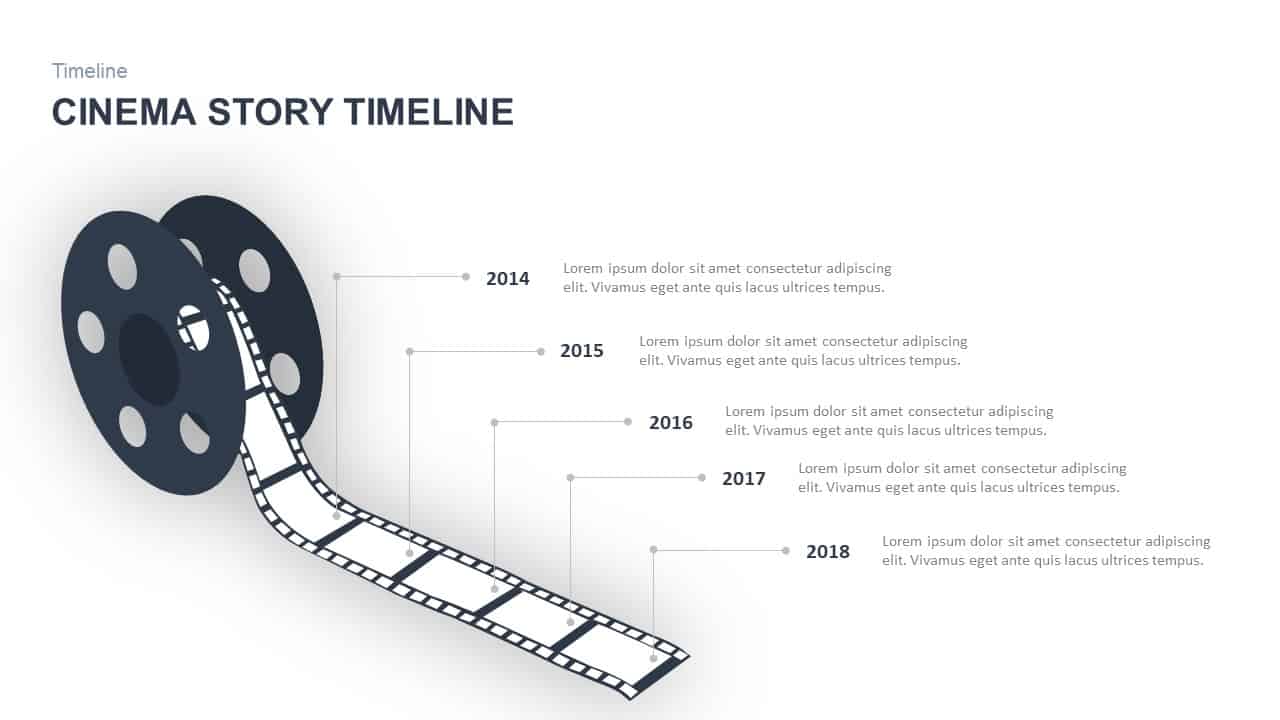
Cinema Story Timeline Reel Illustration Template for PowerPoint & Google Slides
Timeline
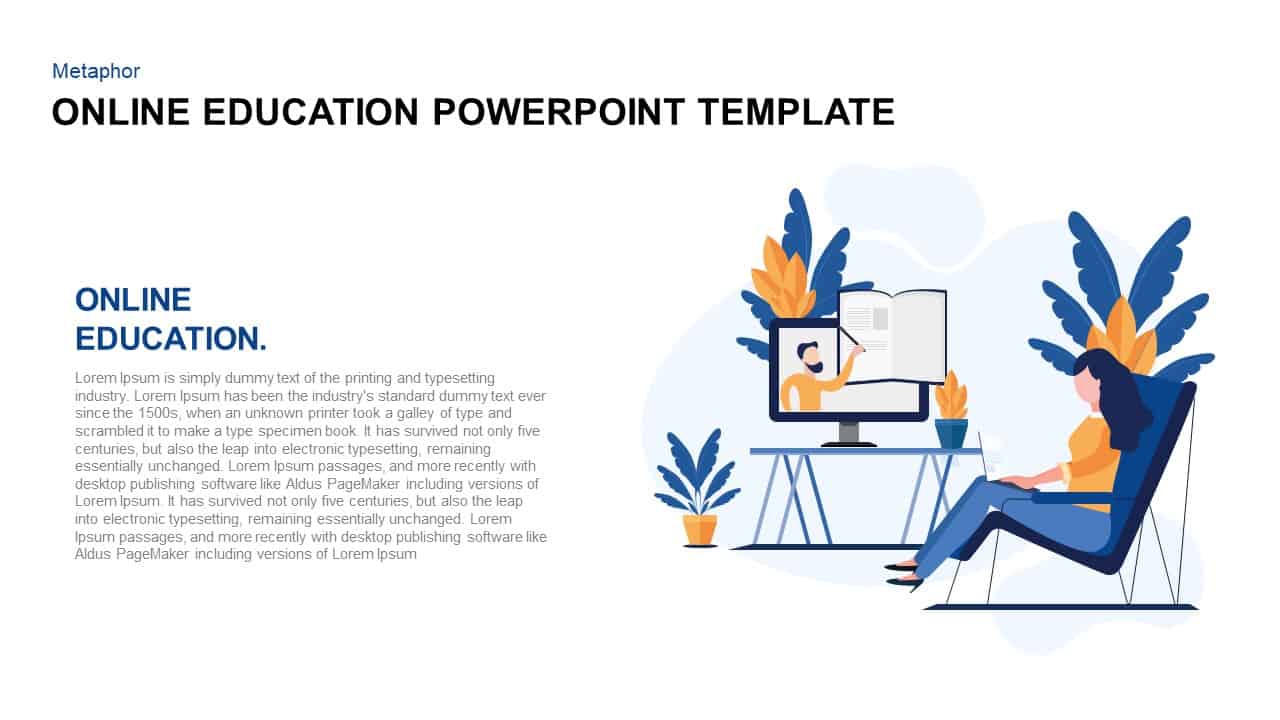
Dynamic Online Education Illustration Template for PowerPoint & Google Slides
Business Proposal
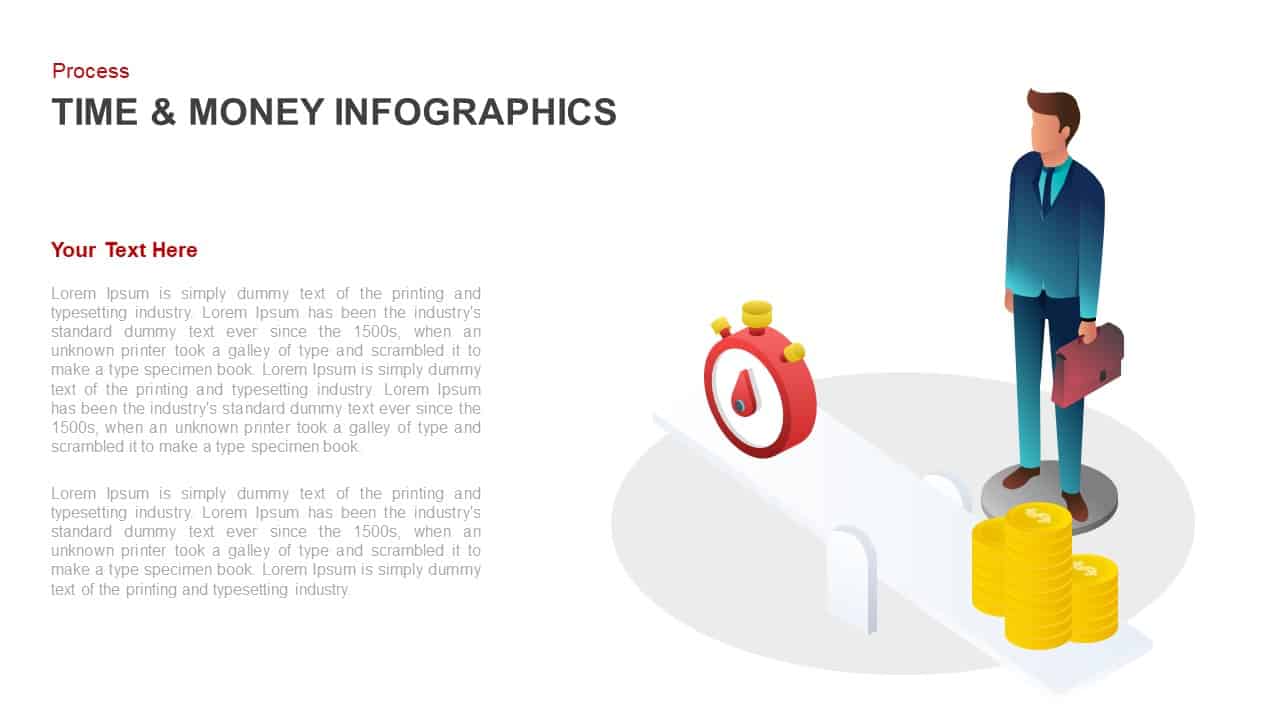
Time and Money Concept Process Illustration Template for PowerPoint & Google Slides
Process
Renewable Energy Landscape Illustration Template for PowerPoint & Google Slides
Graphics
Achievement Recognition Illustration template for PowerPoint & Google Slides
Accomplishment
Chess Strategy Illustration Slide Template for PowerPoint & Google Slides
Competitor Analysis
Growth Mindset Illustration Template for PowerPoint & Google Slides
Goals
Deep Learning Concept Illustration Template for PowerPoint & Google Slides
Machine Learning
Cardiology Icons & Illustration Slide Template for PowerPoint & Google Slides
Health
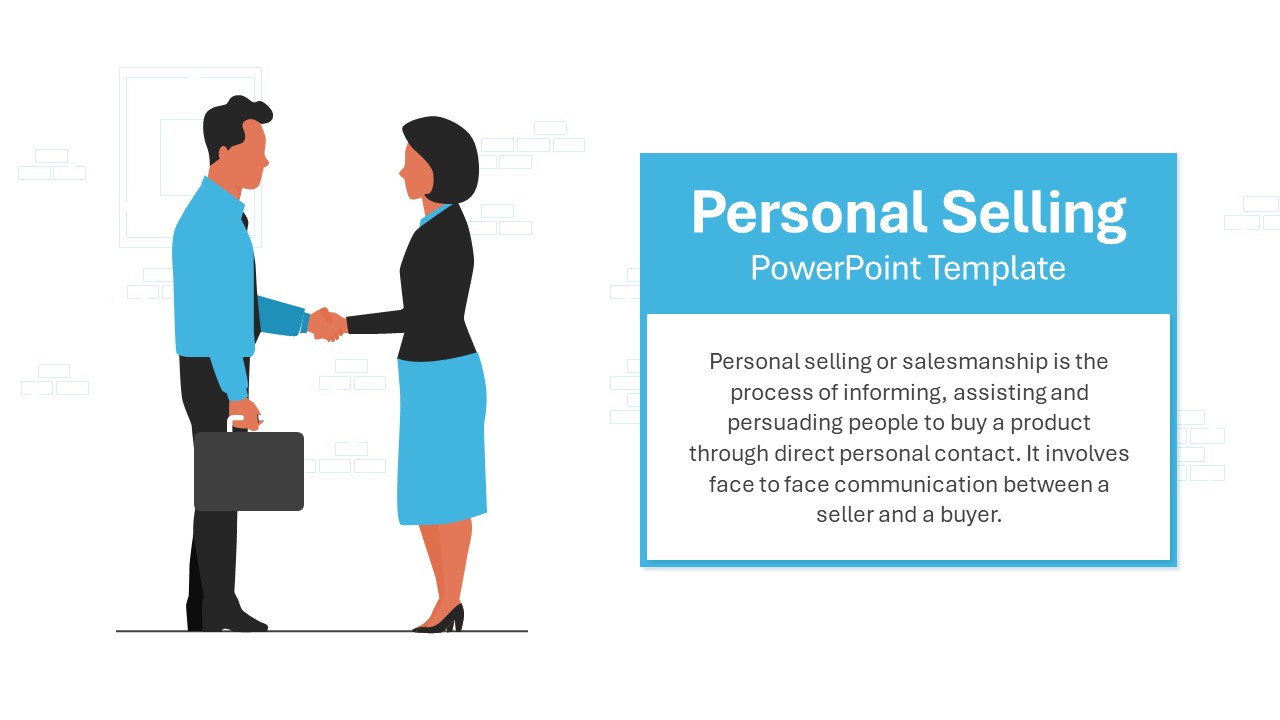
Personal Selling Strategy Illustration Template for PowerPoint & Google Slides
Marketing
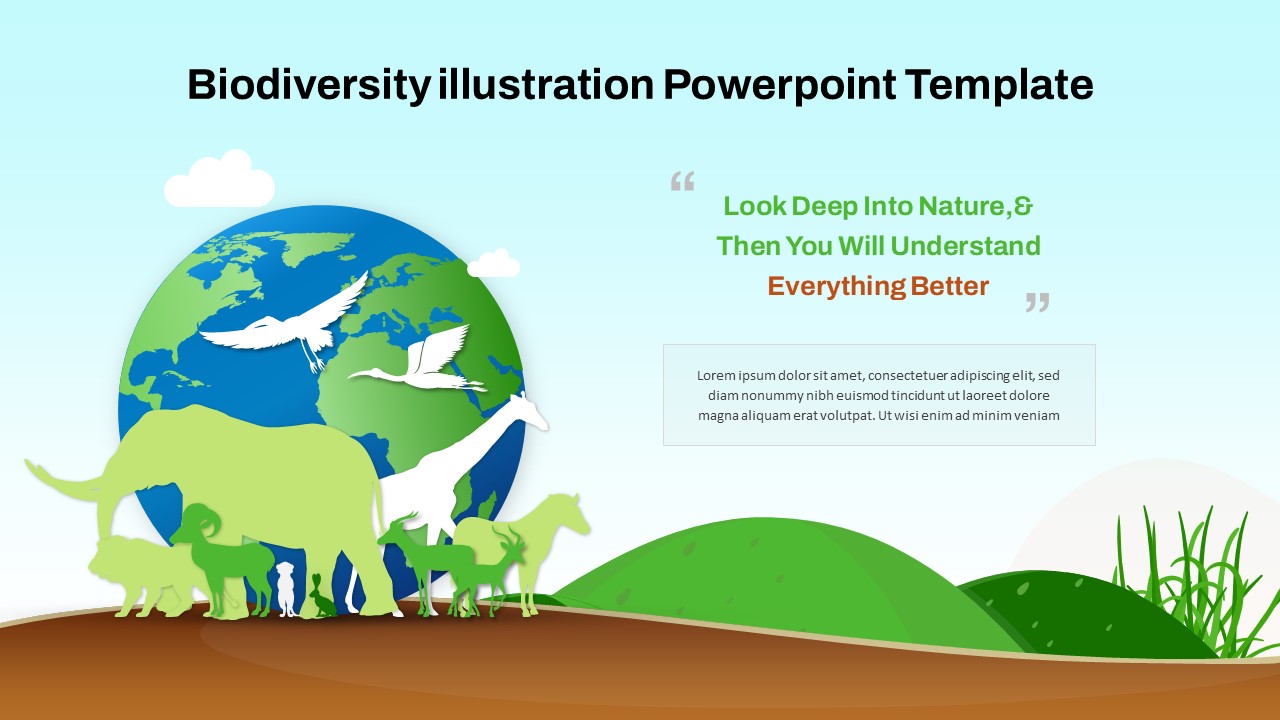
Biodiversity & Wildlife Illustration Template for PowerPoint & Google Slides
Graphics
Transparency Concept Illustration Template for PowerPoint & Google Slides
Graphics
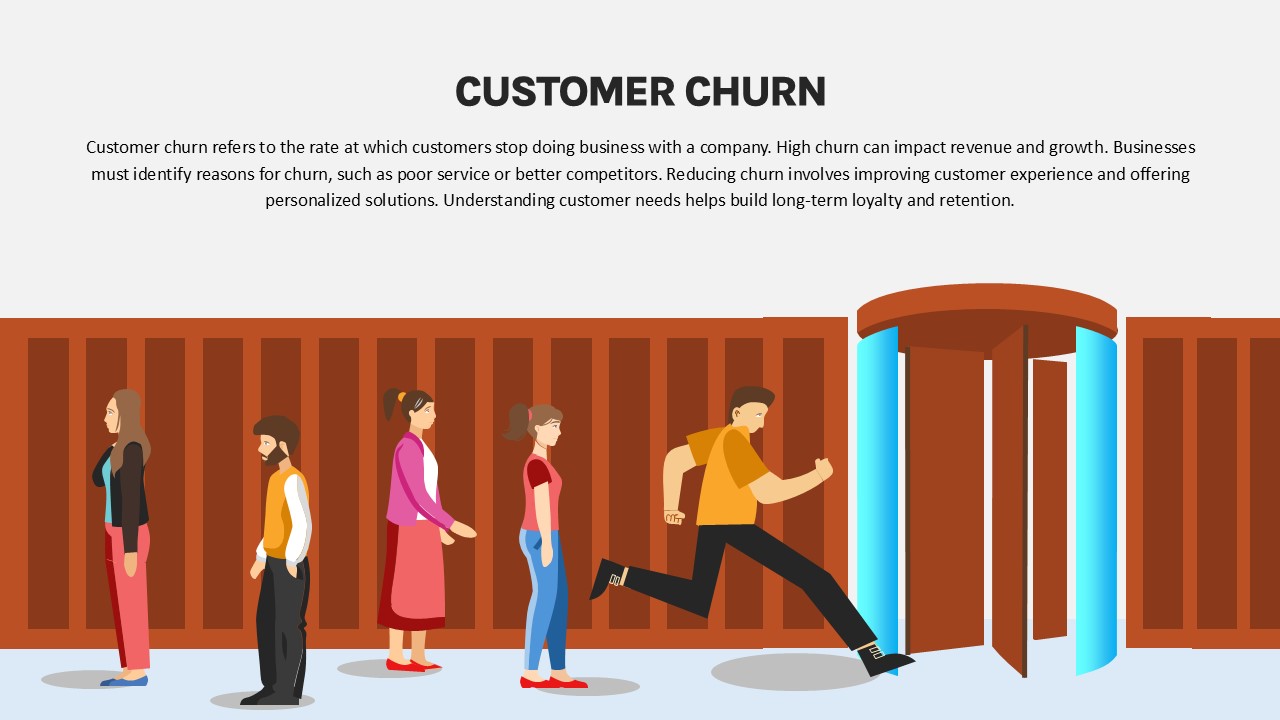
Customer Churn Illustration Diagram Template for PowerPoint & Google Slides
Customer Journey
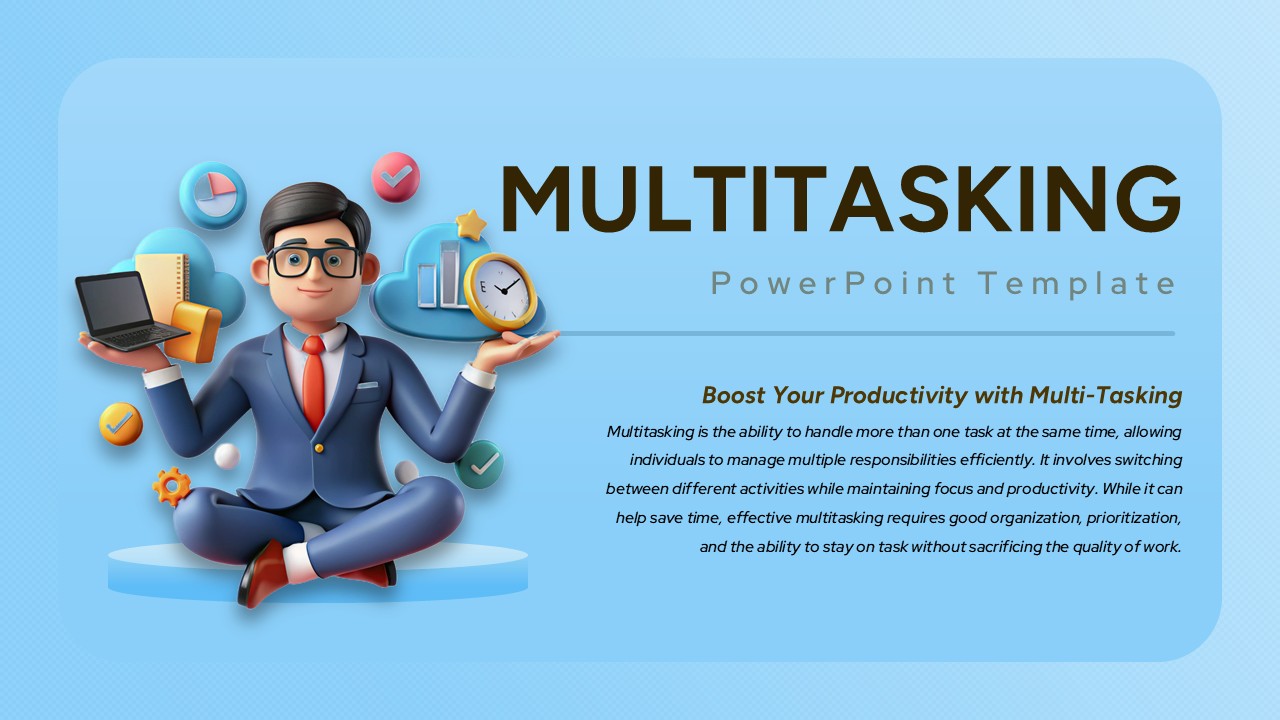
Multitasking Productivity Illustration Template for PowerPoint & Google Slides
Graphics
Palliative Care Support Illustration Template for PowerPoint & Google Slides
Health
Silhouetted Crowd Illustration Slide for PowerPoint & Google Slides
Company Profile
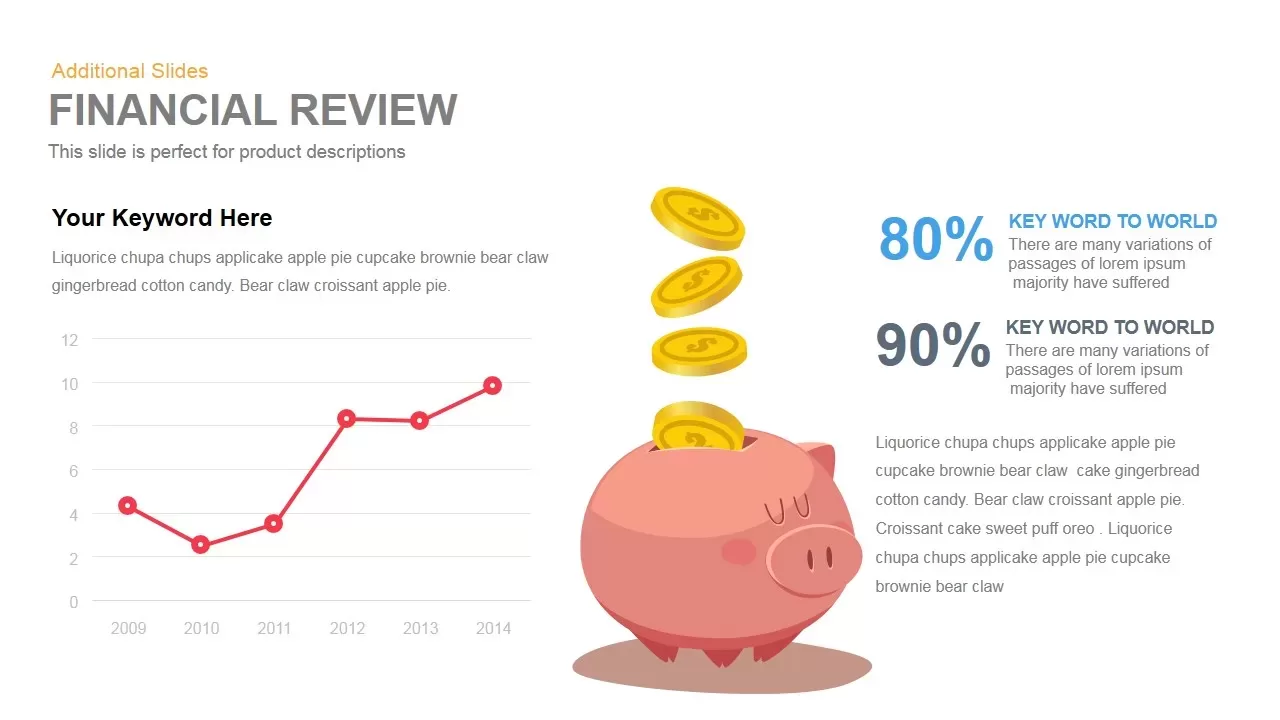
Financial Review template for PowerPoint & Google Slides
Finance
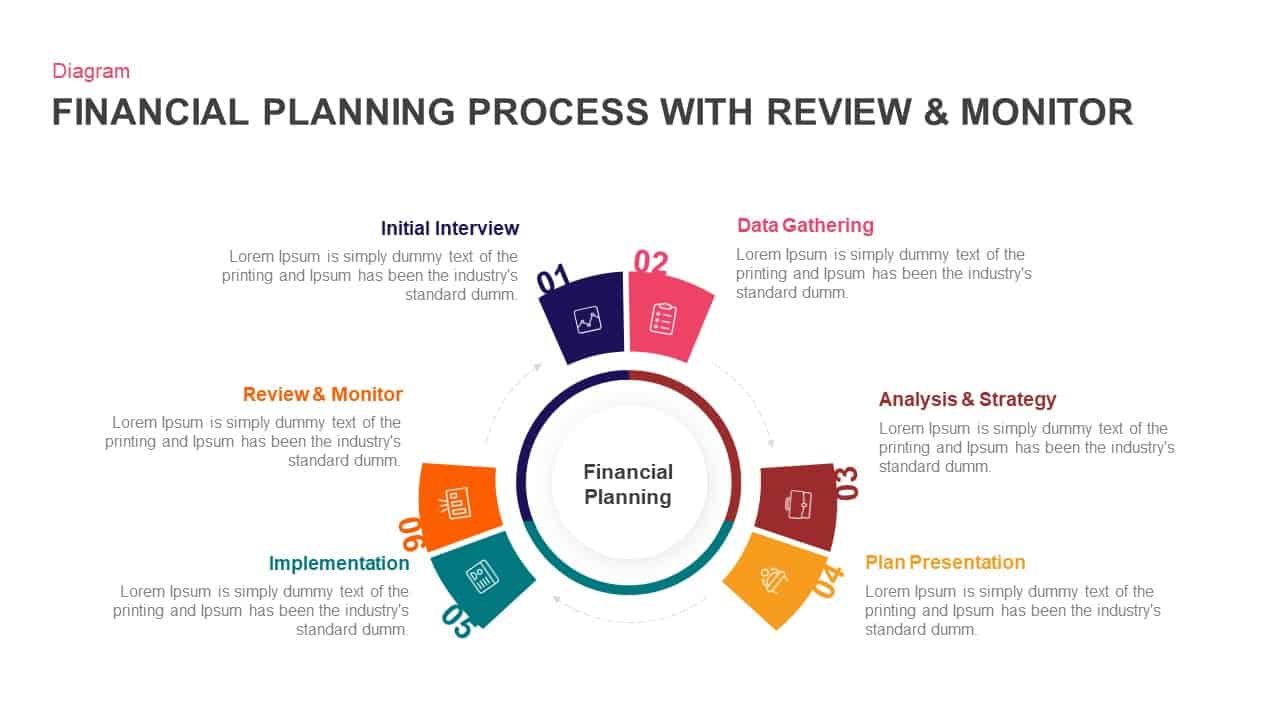
Financial Planning Circular Process Template for PowerPoint & Google Slides
Process
5-Stage Financial Growth Timeline Template for PowerPoint & Google Slides
Timeline
Financial Agreement Signing Flow Diagram Template for PowerPoint & Google Slides
Process
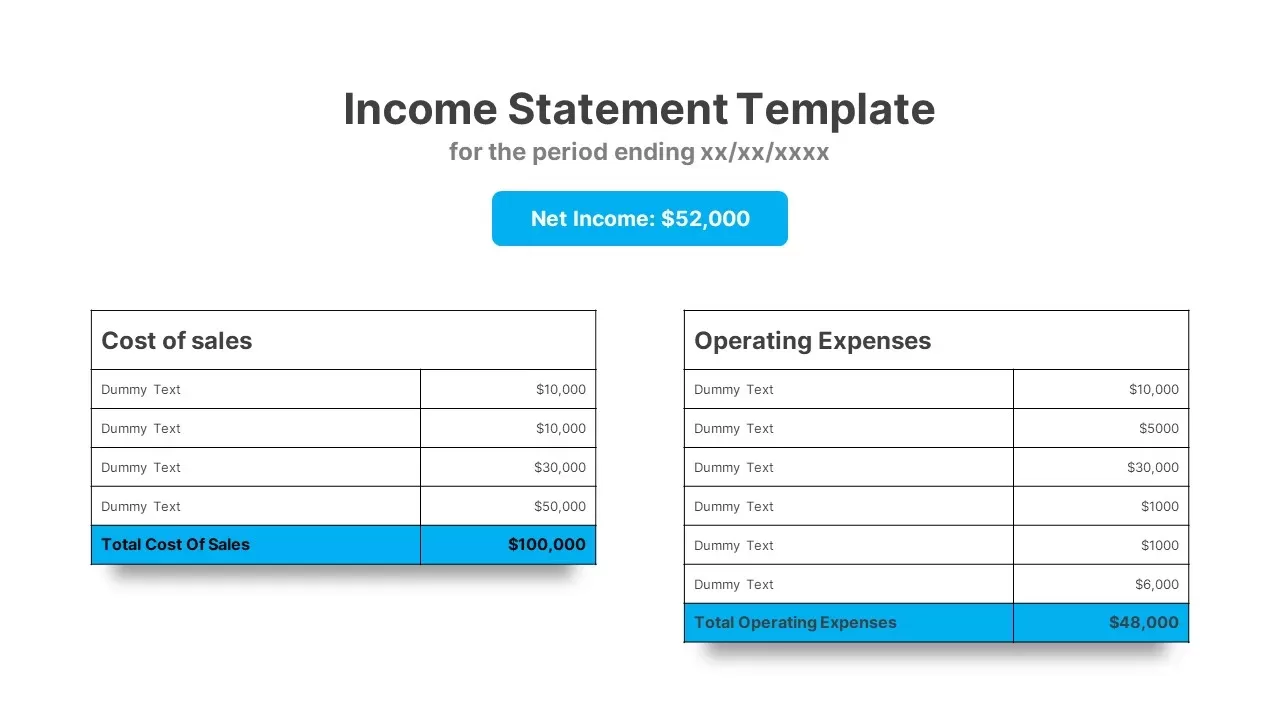
Income Statement Financial Reporting Template for PowerPoint & Google Slides
Finance
Income Statement Financial Summary Template for PowerPoint & Google Slides
Business Report
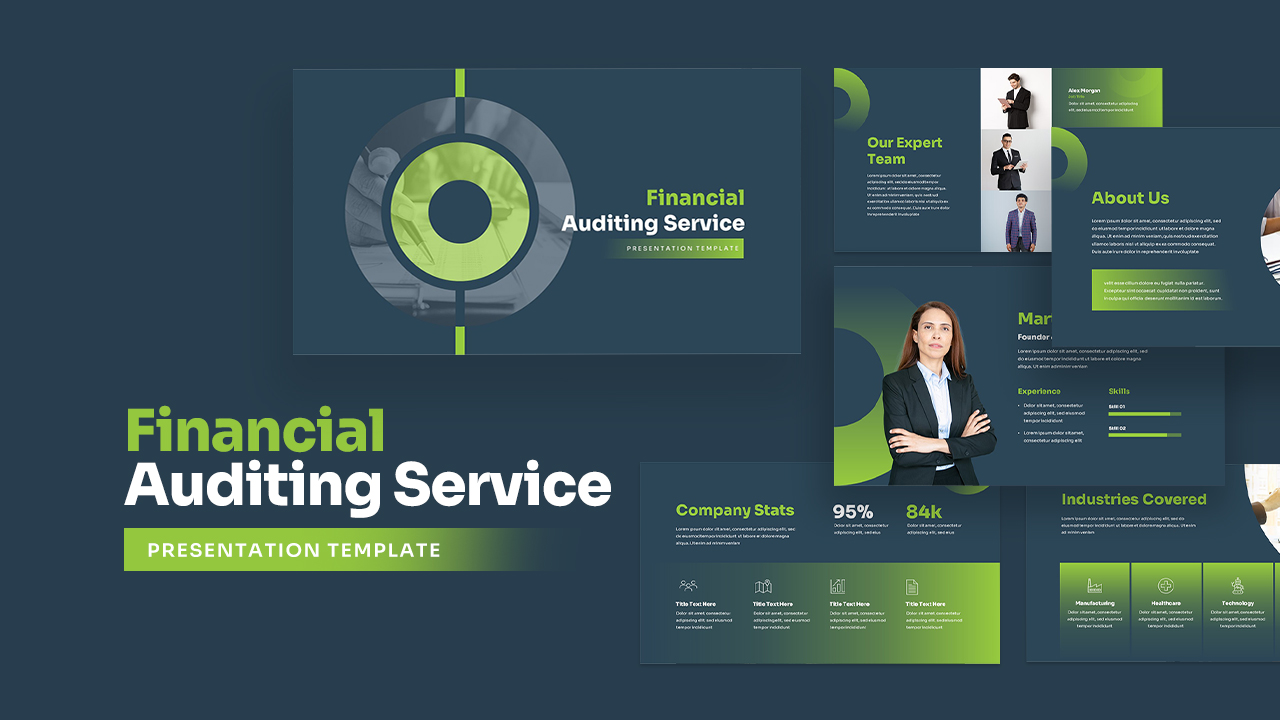
Corporate Financial Auditing Service Template for PowerPoint & Google Slides
Finance

Financial Advisory Service Pitch Deck Template for PowerPoint & Google Slides
Finance
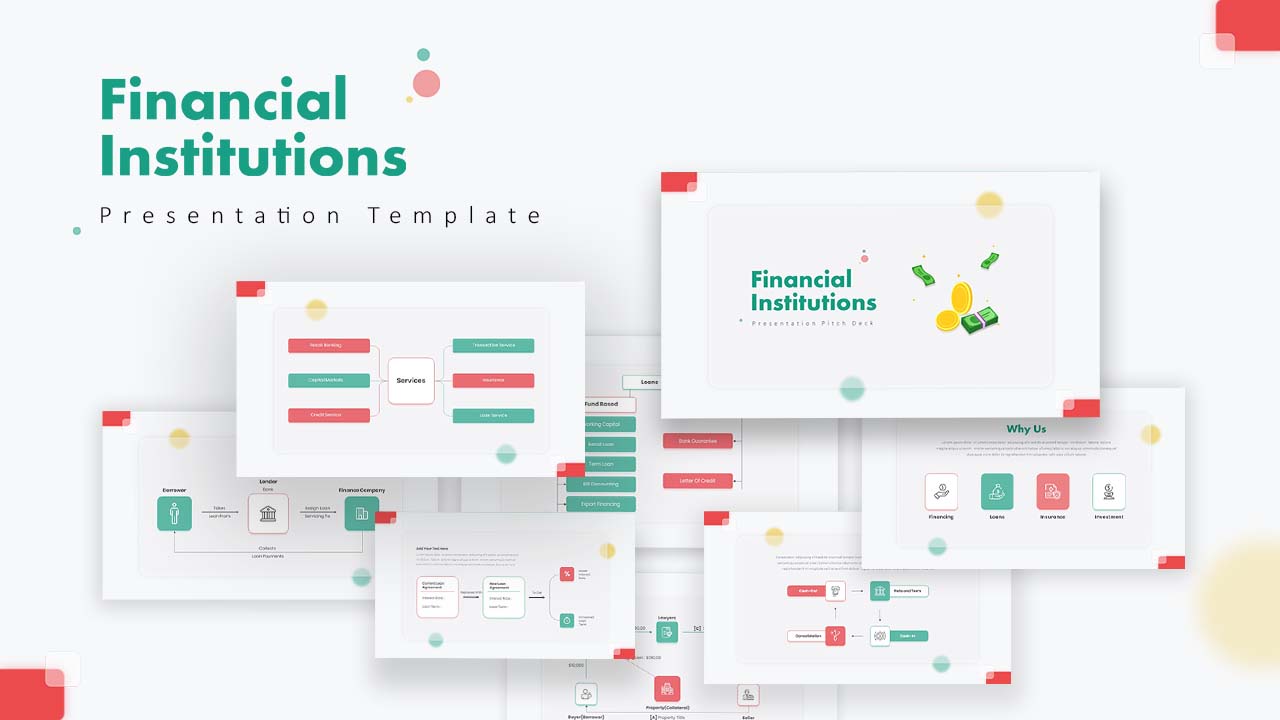
Financial Institutions Presentation Template for PowerPoint & Google Slides
Company Profile
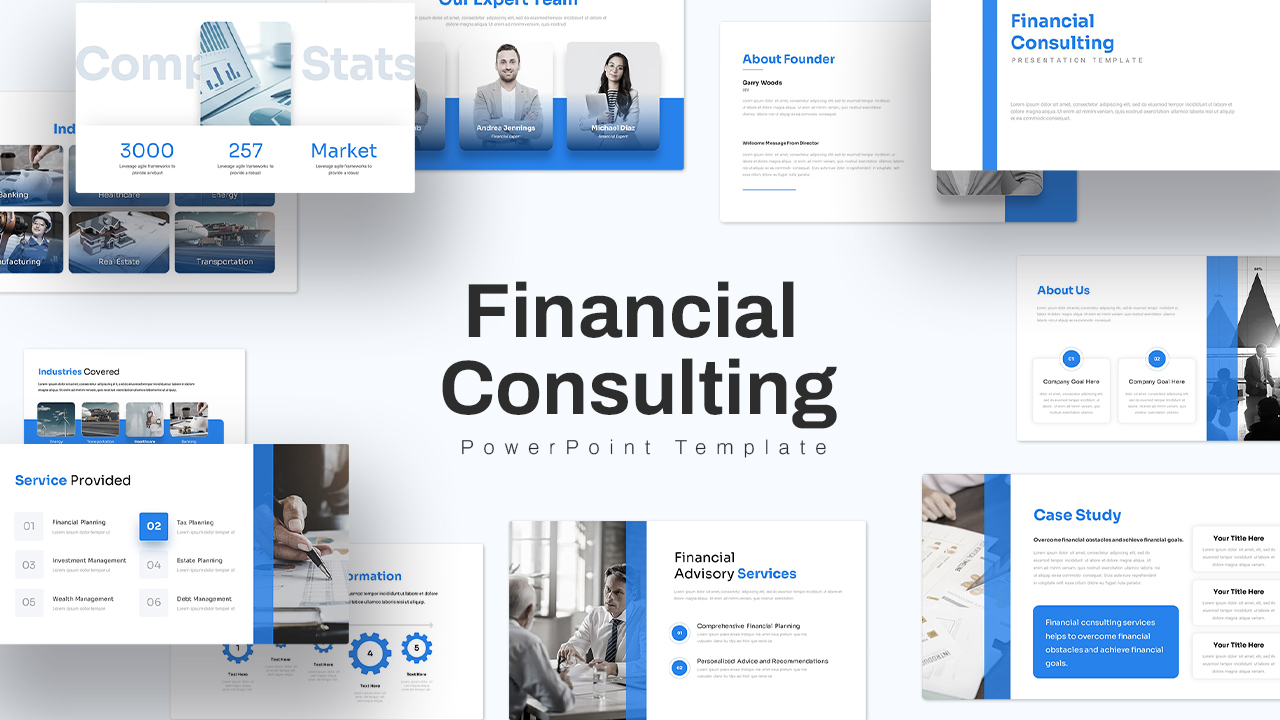
Financial Consulting Company Profile Template for PowerPoint & Google Slides
Finance
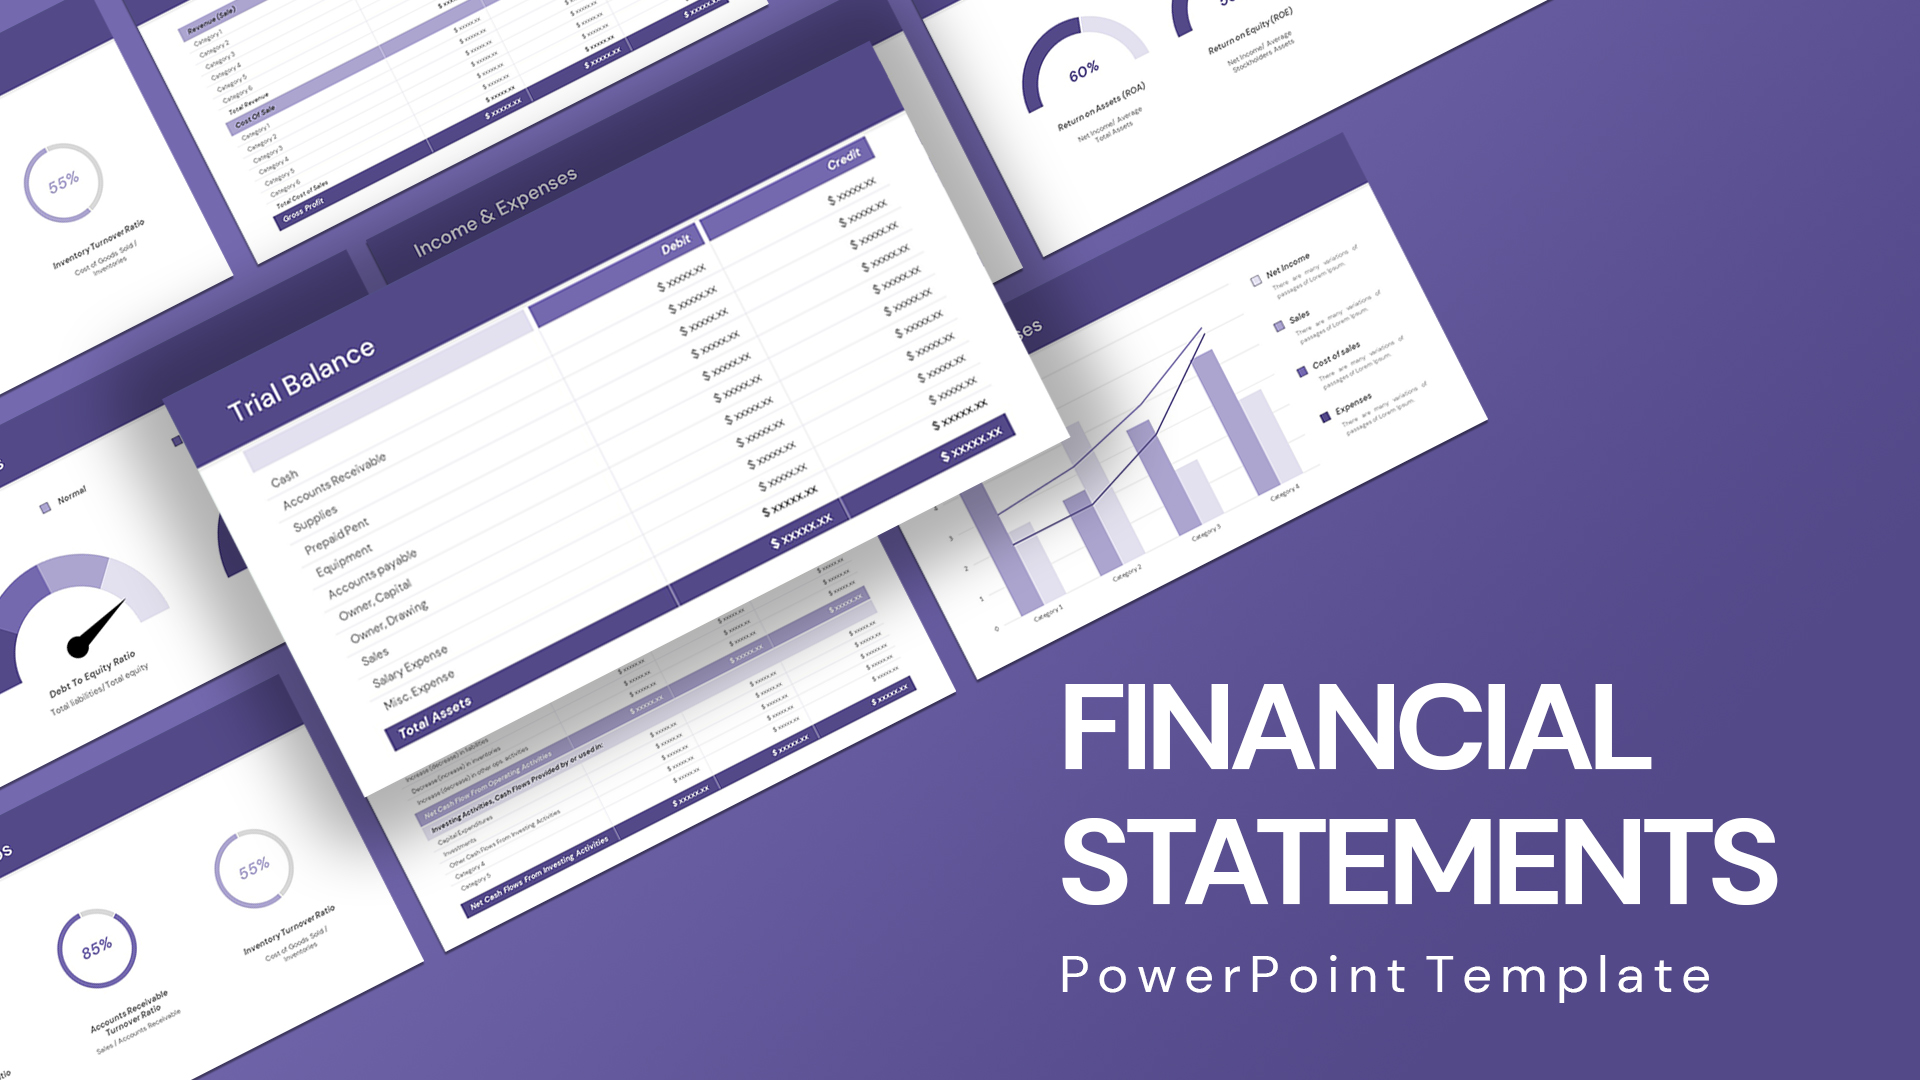
Comprehensive Financial Statements Template for PowerPoint & Google Slides
Finance
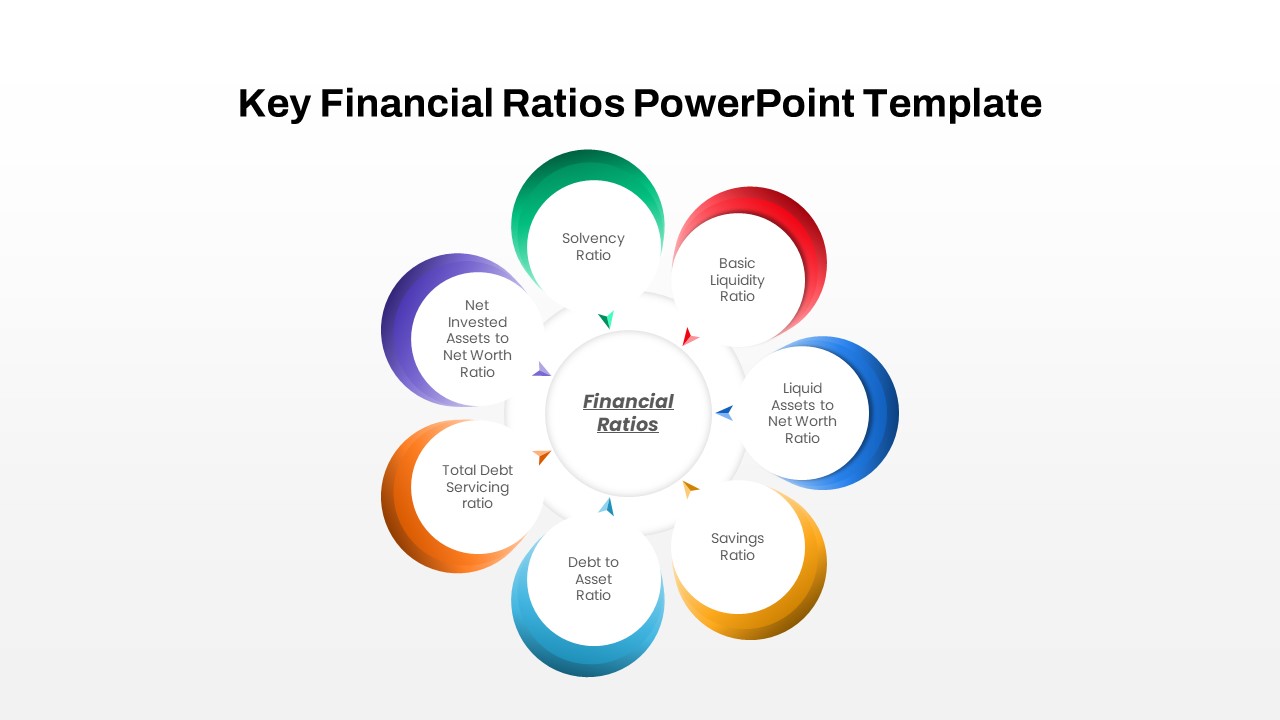
Circular Financial Ratios Infographic Template for PowerPoint & Google Slides
Finance
Free Monthly Report PowerPoint Template for PowerPoint & Google Slides
Business Report
Free
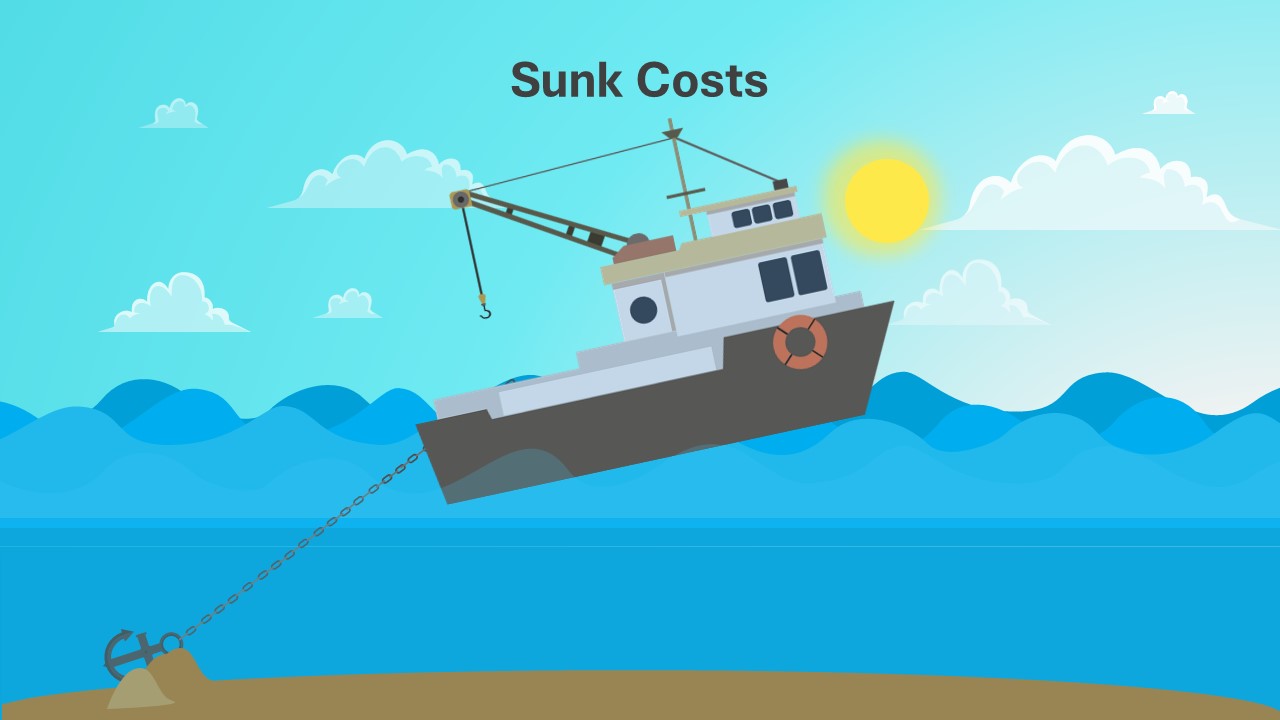
Sunk Costs Financial Concept Diagram Template for PowerPoint & Google Slides
Finance
Quarterly Financial Summary Dashboard Template for PowerPoint & Google Slides
Business Report
Banking Financial Overview Dashboard Template for PowerPoint & Google Slides
Finance
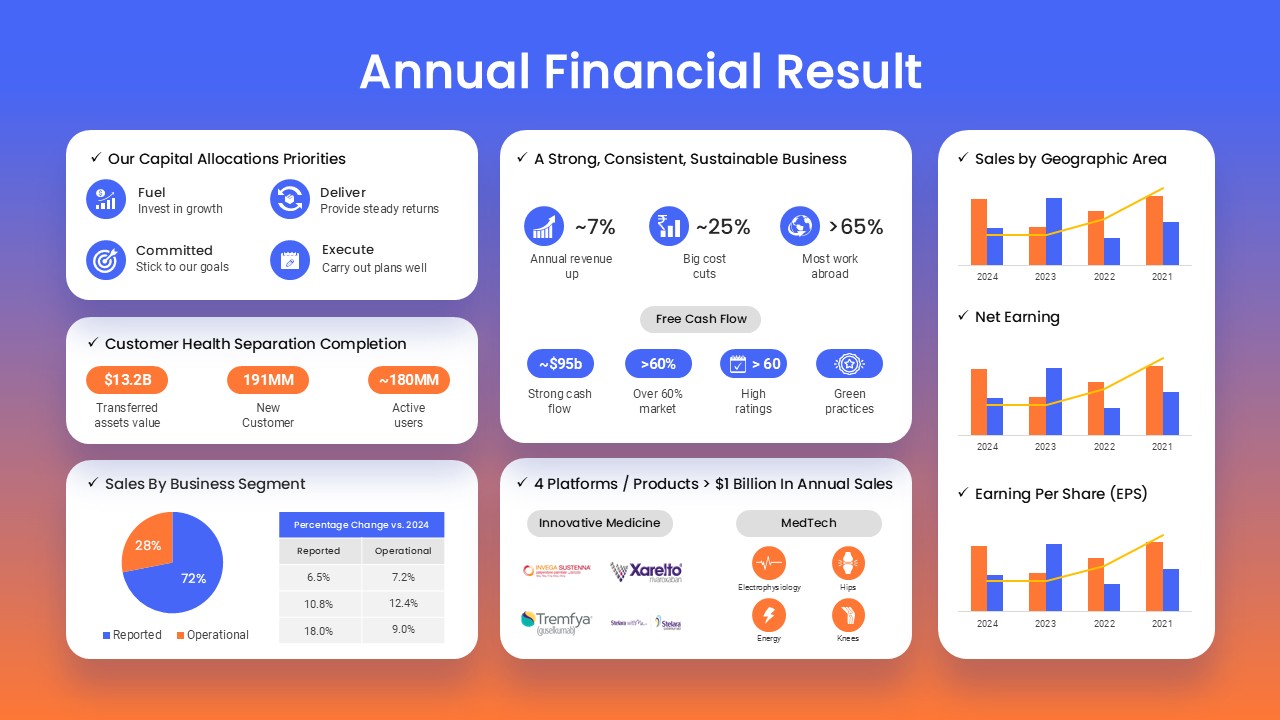
Annual Financial Results Slide Deck Template for PowerPoint & Google Slides
Finance
Dynamic Financial Analysis Line Chart Template for PowerPoint & Google Slides
Finance
Financial Snapshot & Metrics Overview Template for PowerPoint & Google Slides
Finance
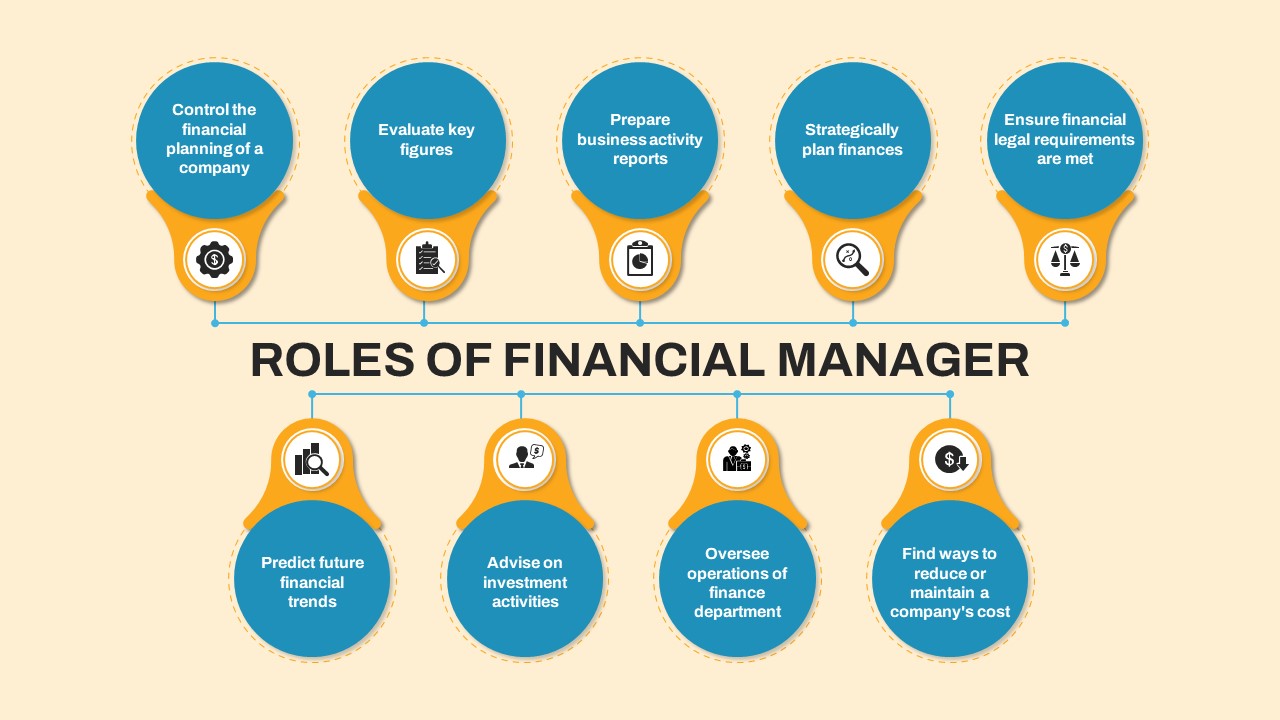
Financial Manager Roles Template for PowerPoint & Google Slides
Process
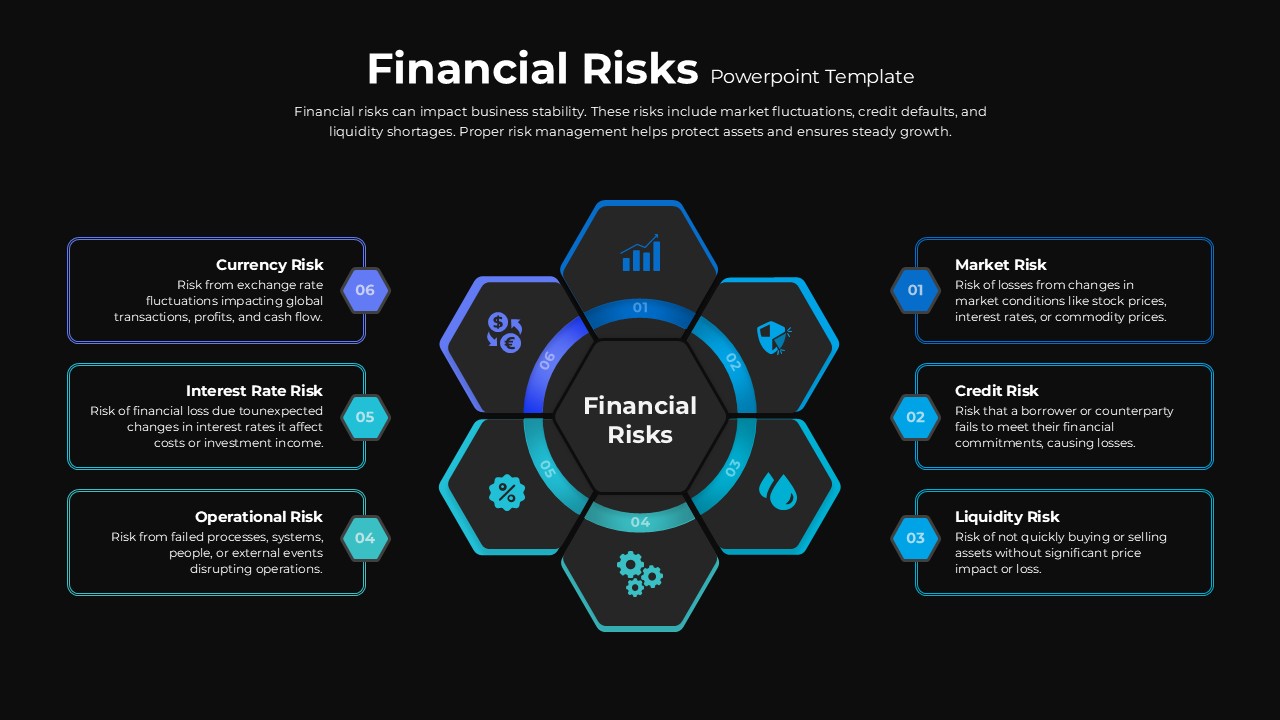
Financial Risks Hexagon Diagram Template for PowerPoint & Google Slides
Risk Management
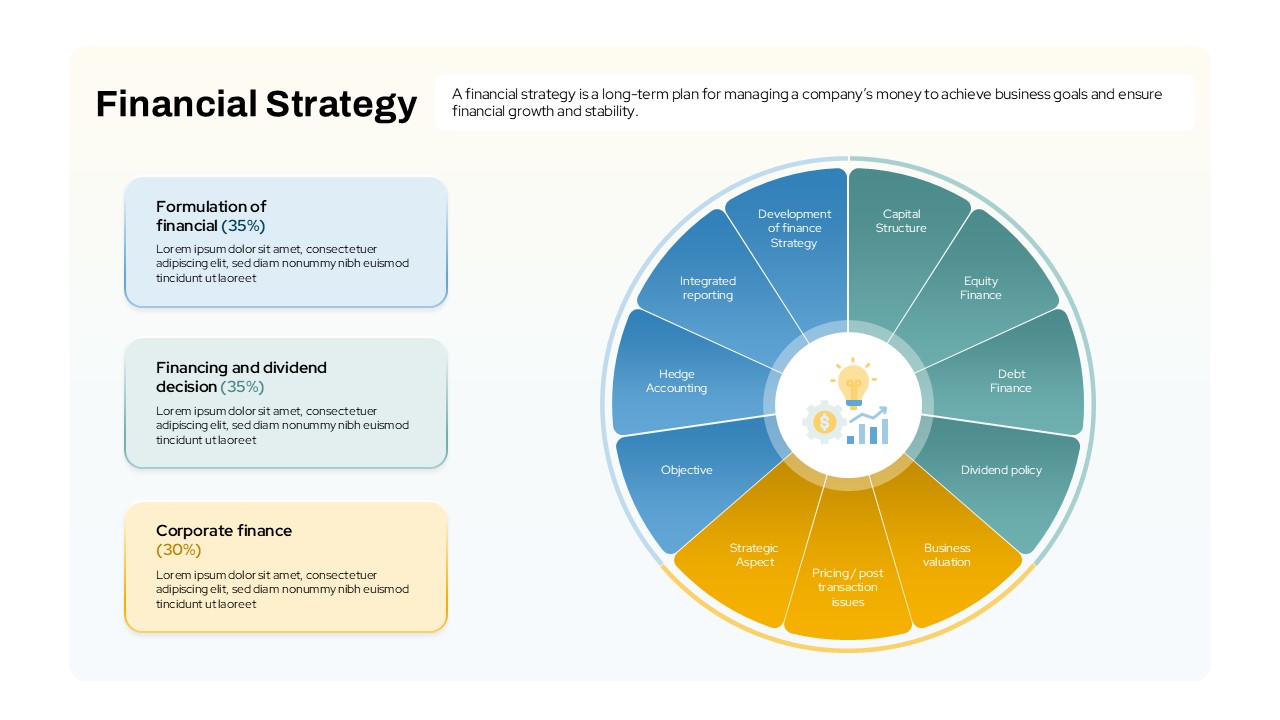
Financial Strategy template for PowerPoint & Google Slides
Business Strategy
Financial Gap Analysis Framework Template for PowerPoint & Google Slides
Finance
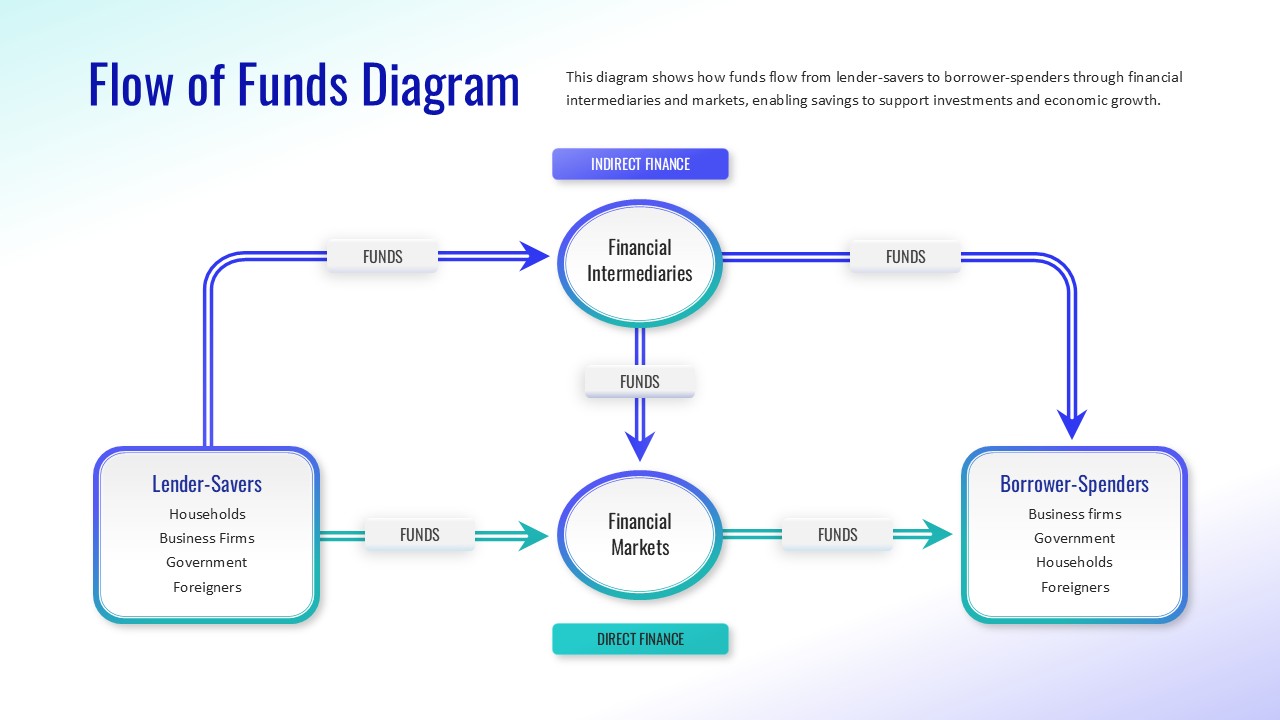
Flow of Funds Financial System Diagram Template for PowerPoint & Google Slides
Finance
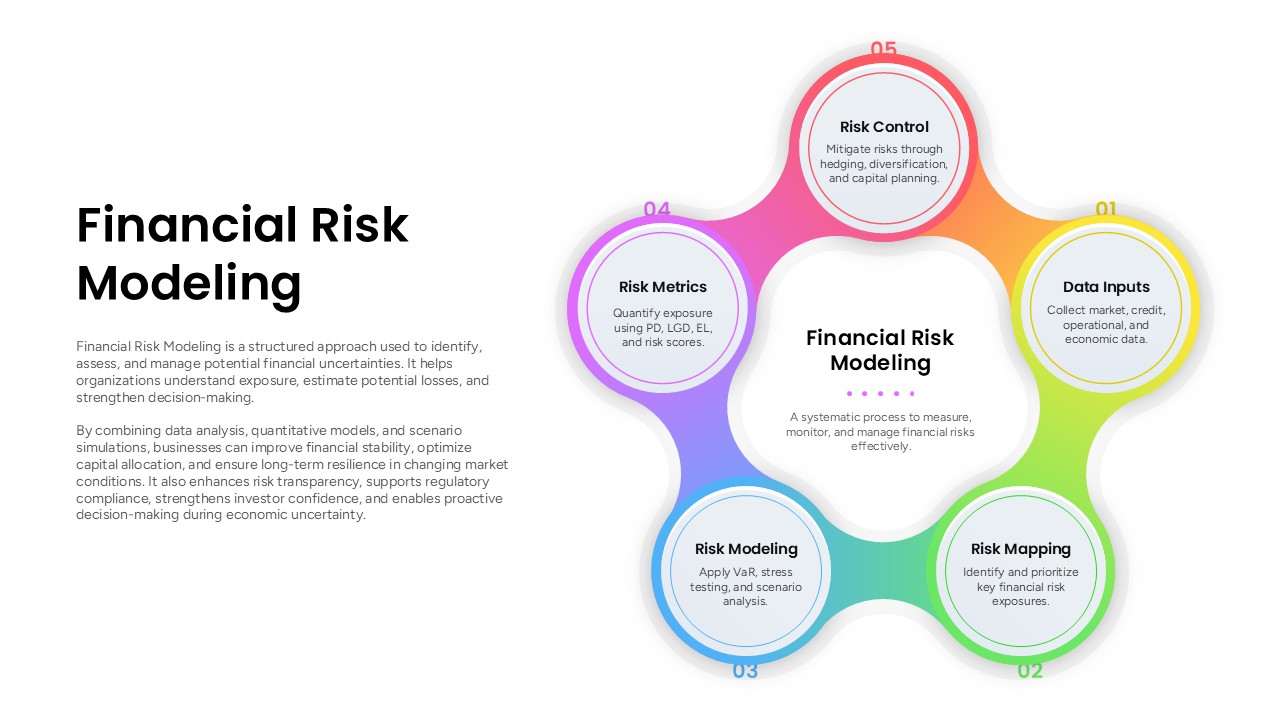
Financial Risk Modeling Template for PowerPoint & Google Slides
Risk Management
Stacked Area Chart with Financial Highlights for PowerPoint & Google Slides
Finance
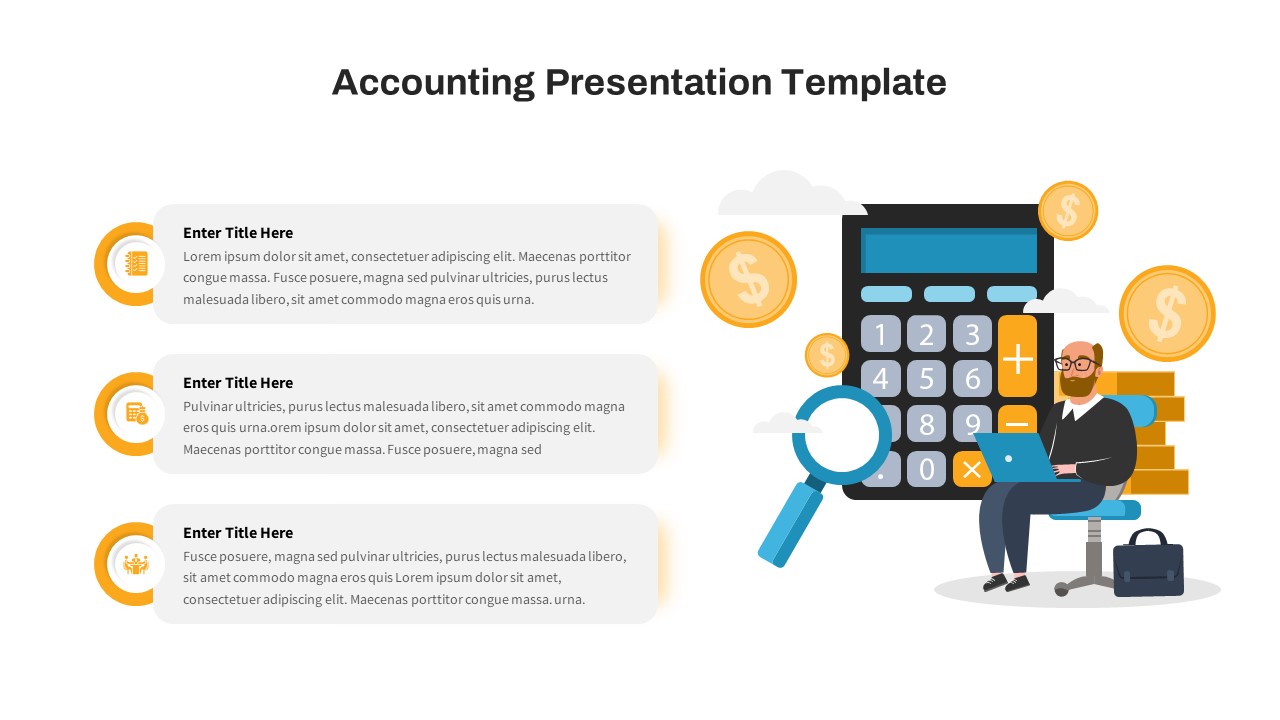
Free Financial Accounting Overview Slide for PowerPoint & Google Slides
Accounting
Free
Discover Metaphor Concept Slide Template for PowerPoint & Google Slides
Infographics
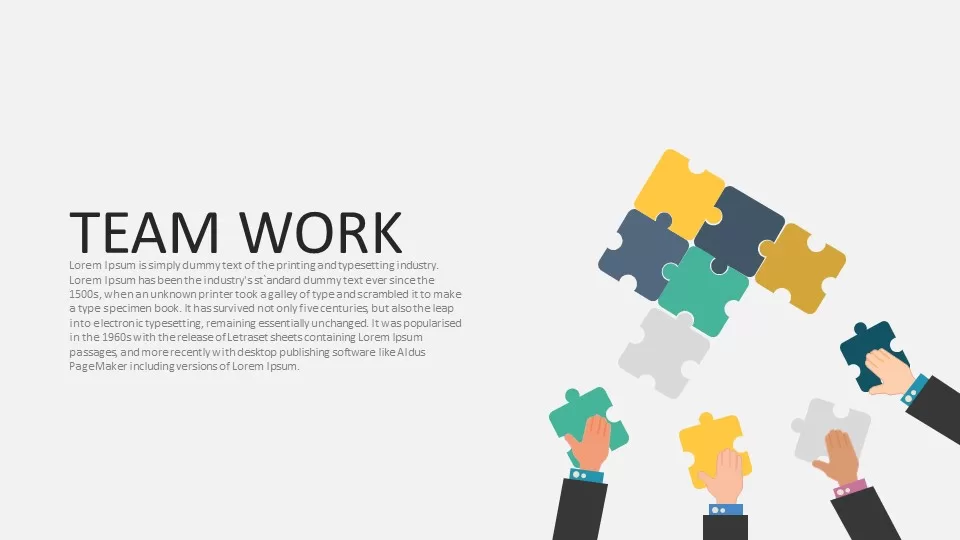
Teamwork Puzzle Metaphor Slide Template for PowerPoint & Google Slides
Our Team
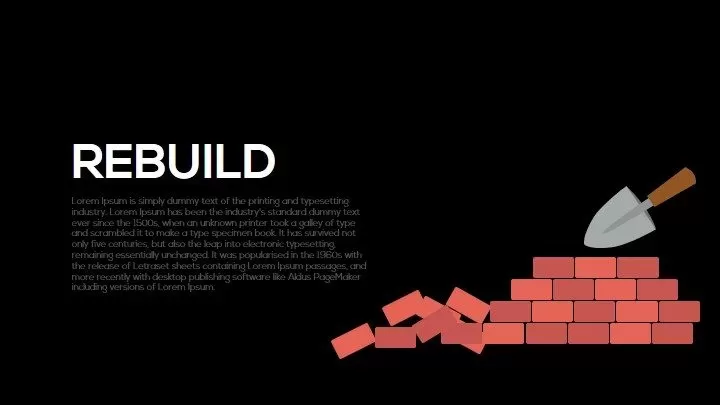
Rebuild Brick Wall Metaphor Slide Template for PowerPoint & Google Slides
Infographics
Efficiency KPI Dashboard Metaphor Template for PowerPoint & Google Slides
Infographics
Destination Roadmap Pin Metaphor Template for PowerPoint & Google Slides
Roadmap
Metaphor Speed Template for PowerPoint & Google Slides
Process
Scale Metaphor Metrics Comparison Template for PowerPoint & Google Slides
Charts
Key Metaphor Infographic Slide Template for PowerPoint & Google Slides
Process
Mustard and Navy Balance Scale Metaphor Template for PowerPoint & Google Slides
Comparison
Magnifying Glass Research Metaphor Template for PowerPoint & Google Slides
Process
Business Opportunity Metaphor Slide Template for PowerPoint & Google Slides
Opportunities Challenges
Guide Metaphor Navigation Infographic Template for PowerPoint & Google Slides
Process
Office Workspace Metaphor Slide Template for PowerPoint & Google Slides
Business Proposal
Operation Process Metaphor Diagram Template for PowerPoint & Google Slides
Process
Deadline Metaphor Timeline & Hourglass Template for PowerPoint & Google Slides
Project
Planning Metaphor Flowchart Slide Template for PowerPoint & Google Slides
Process
Product Shipping Metaphor Diagram Template for PowerPoint & Google Slides
Process
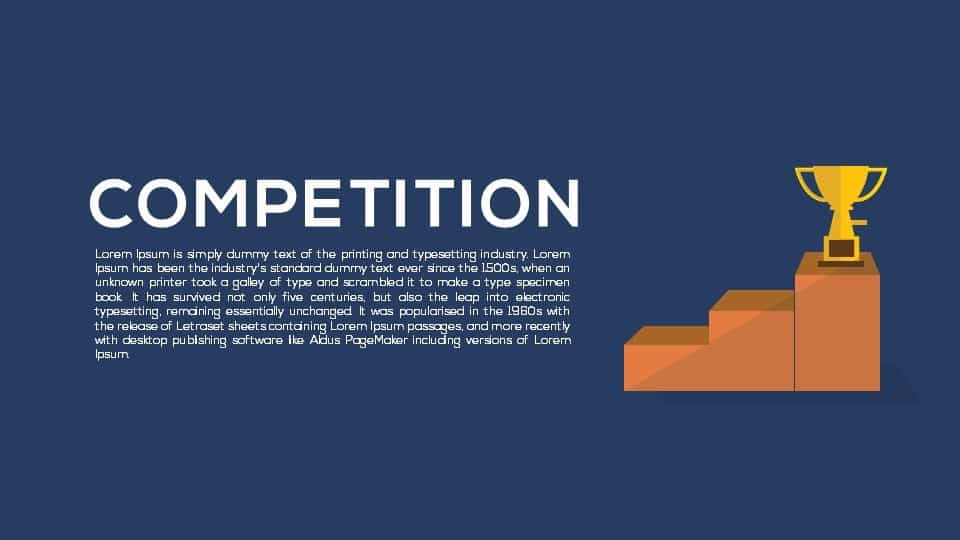
Competition Metaphor Podium Diagram Template for PowerPoint & Google Slides
Business
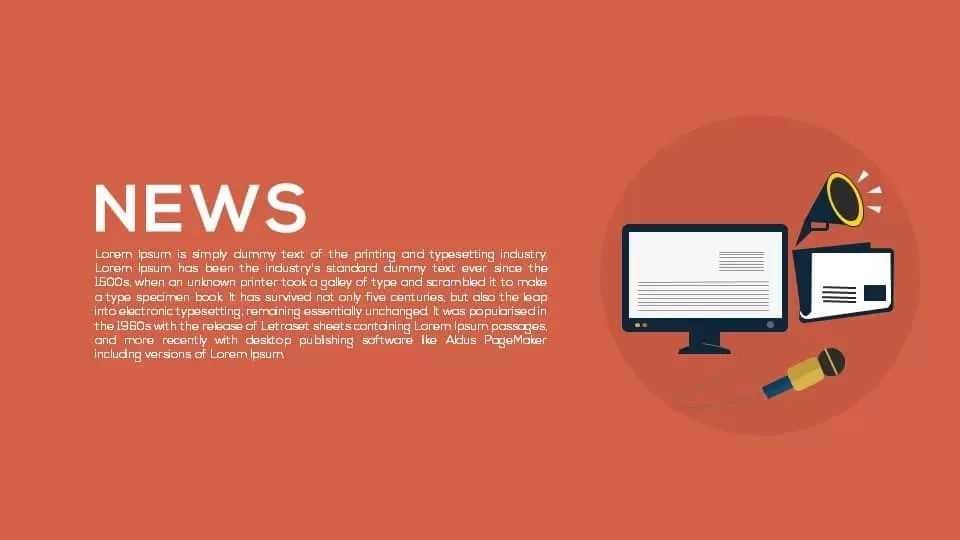
News Metaphor Media Communication Slide Template for PowerPoint & Google Slides
Business Report
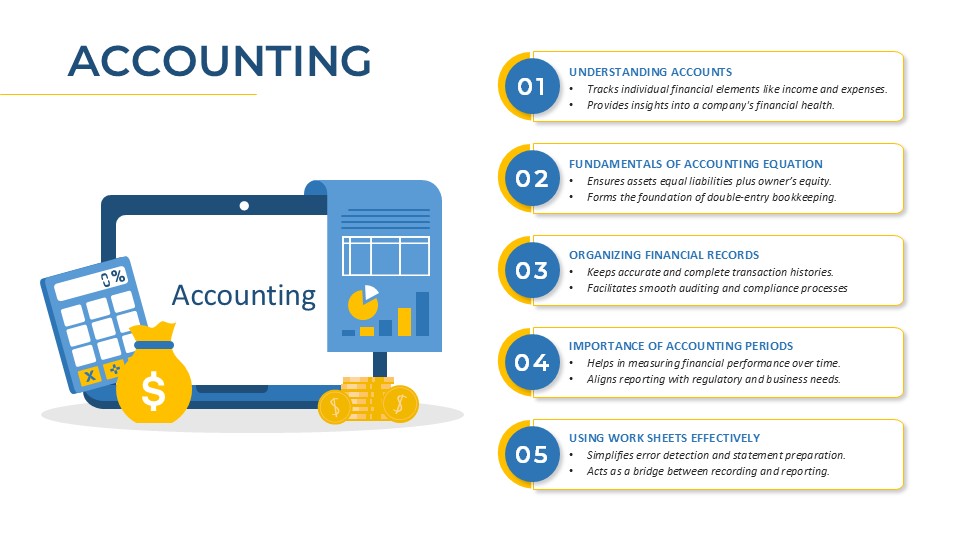
Accounting Process Metaphor Diagram Template for PowerPoint & Google Slides
Accounting
Dual Percentage Comparison Metaphor Template for PowerPoint & Google Slides
Comparison

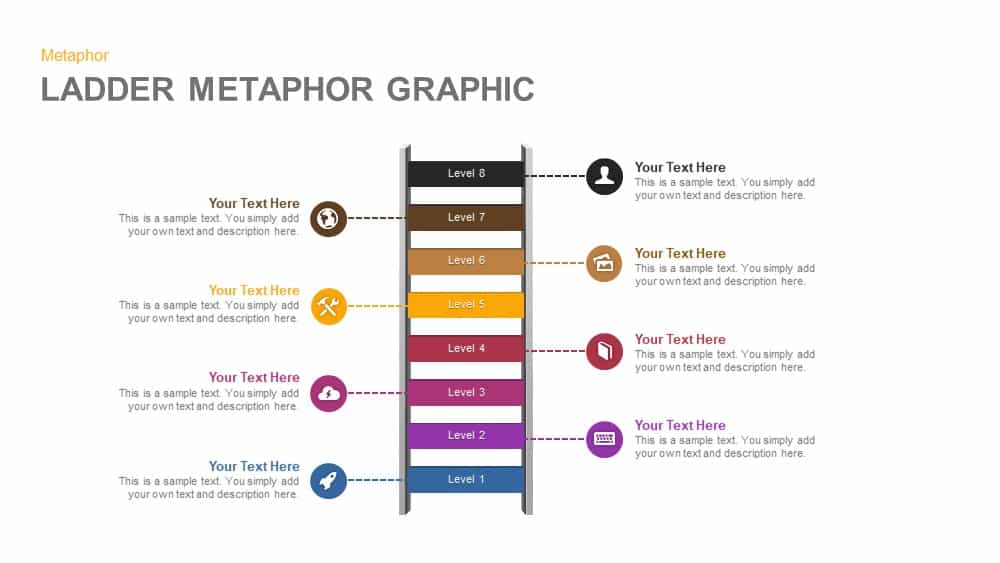
Eight-Level Ladder Metaphor Graphic Template for PowerPoint & Google Slides
Process
Warehouse Conveyor Process Metaphor Template for PowerPoint & Google Slides
Process
Cyber Security Metaphor Diagram Template for PowerPoint & Google Slides
Risk Management
Developer Icons Metaphor Slide Template for PowerPoint & Google Slides
Software Development

Checkmate Strategy Chess Metaphor Template for PowerPoint & Google Slides
Opportunities Challenges
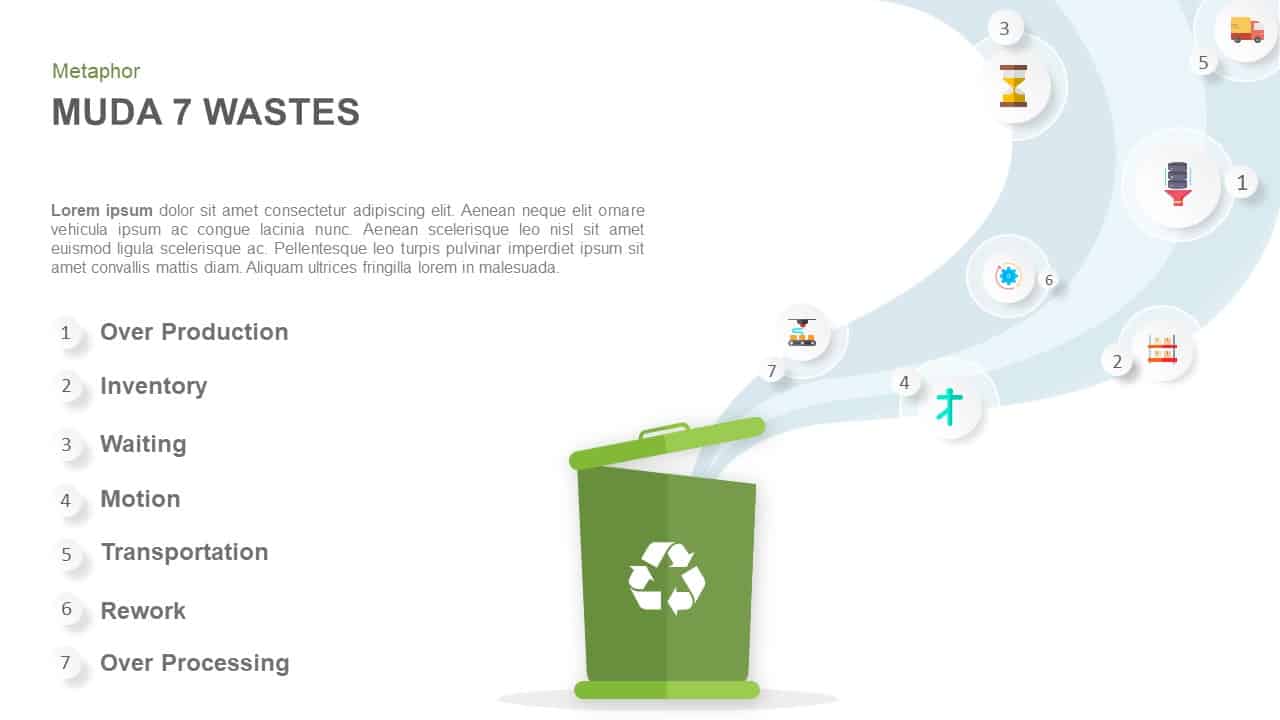
Muda 7 Wastes Recycling Bin Metaphor Template for PowerPoint & Google Slides
Process
Teamwork Concept Metaphor Template for PowerPoint & Google Slides
Leadership
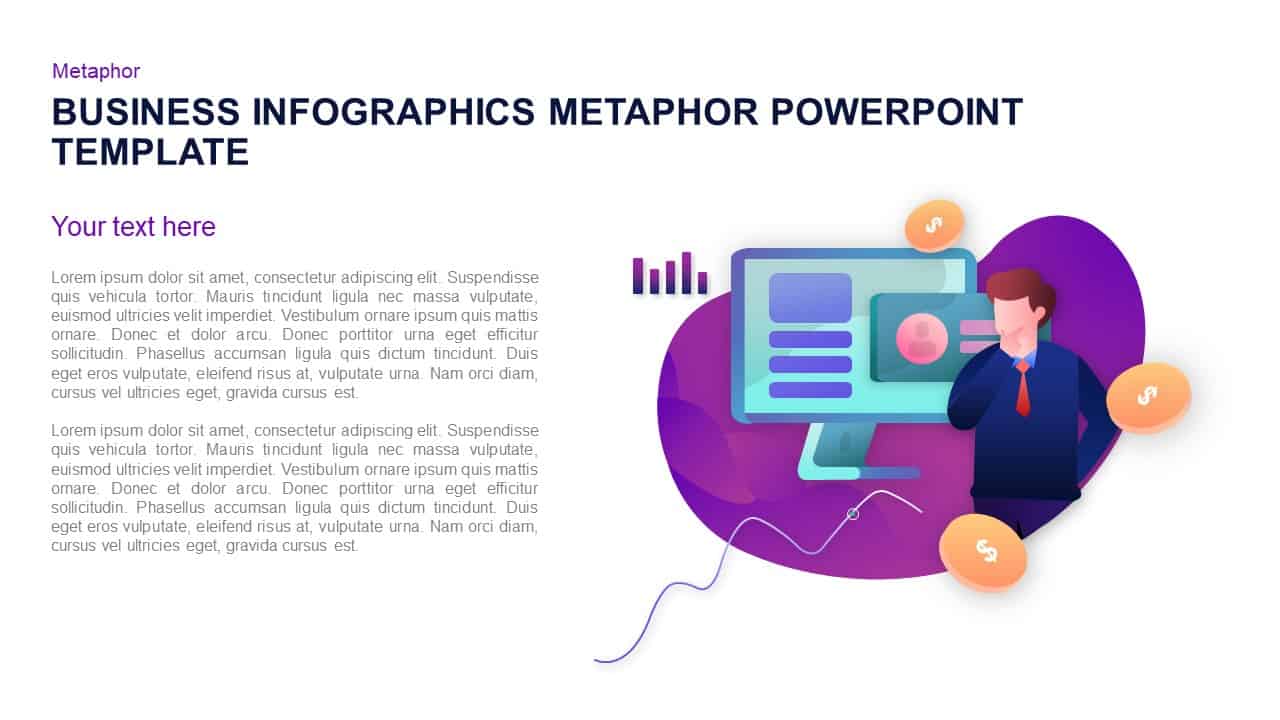
Business Growth Infographic Metaphor Template for PowerPoint & Google Slides
Revenue
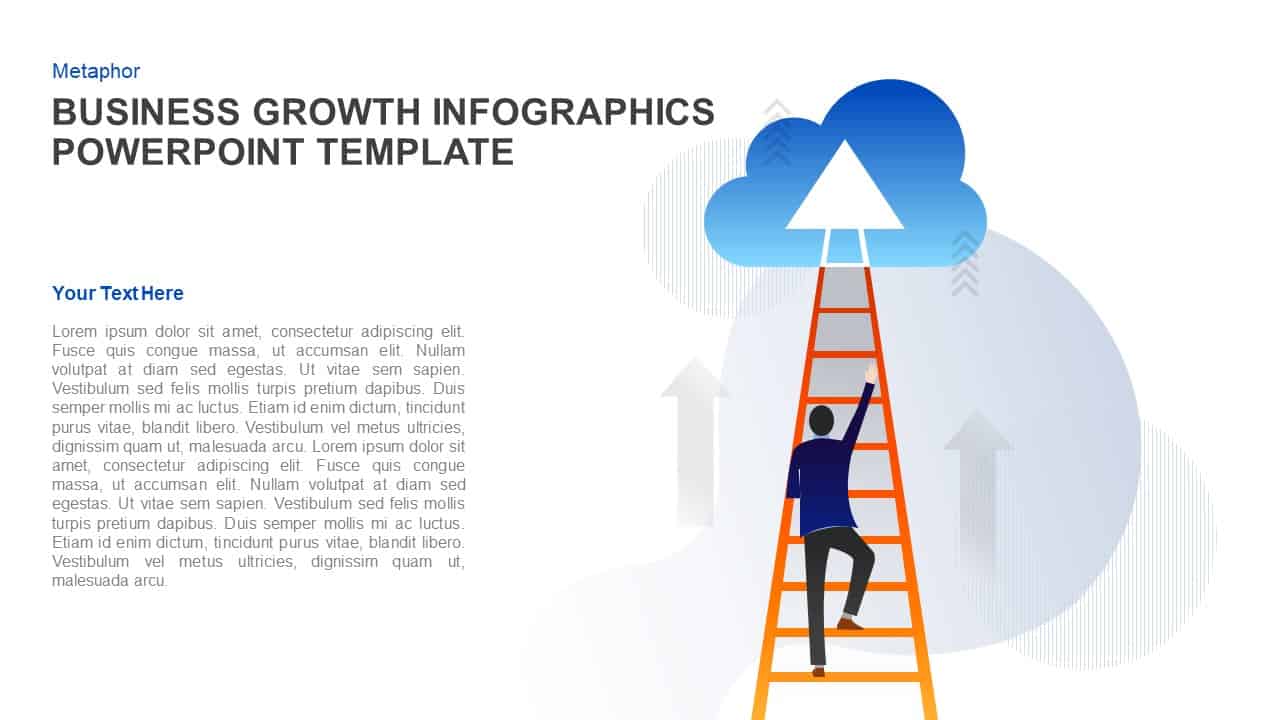
Business Growth Ladder to Cloud Metaphor Template for PowerPoint & Google Slides
Vision and Mission
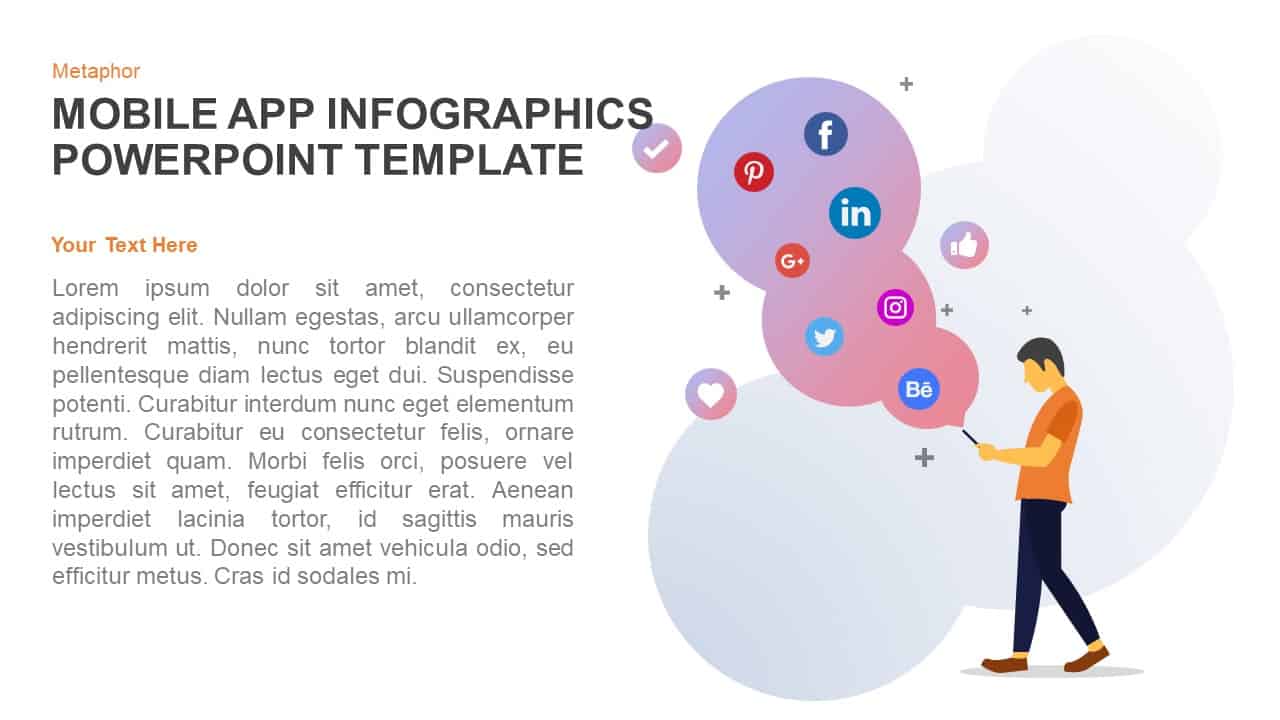
Mobile App Social Media Metaphor Template for PowerPoint & Google Slides
Infographics
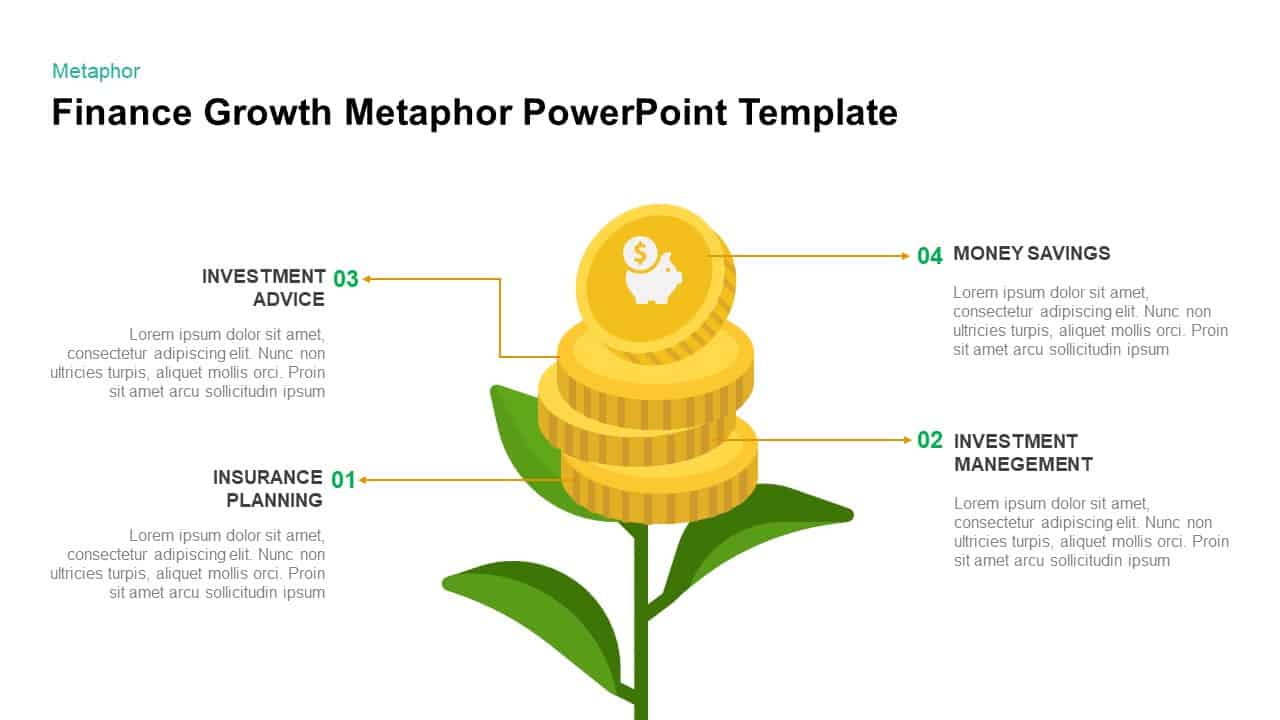
Finance Growth Plant Metaphor Slide Template for PowerPoint & Google Slides
Finance
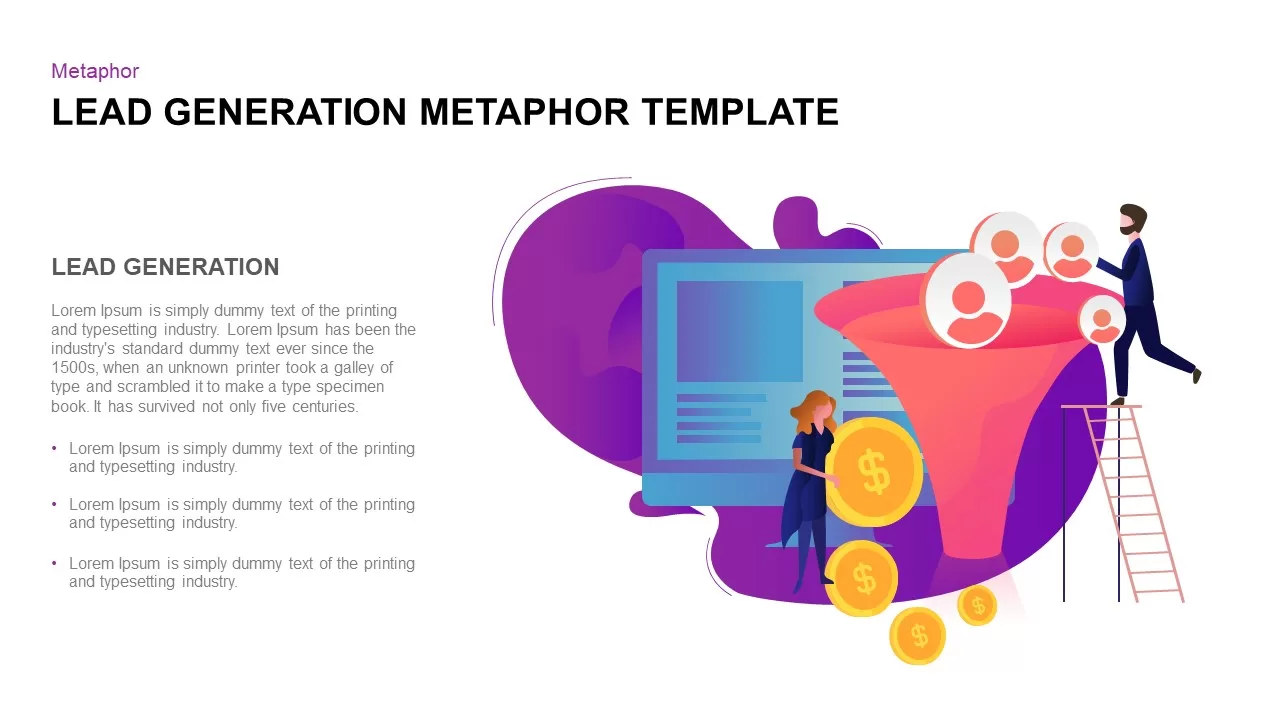
Lead Generation Funnel Metaphor Template for PowerPoint & Google Slides
Marketing Funnel
Collaborative Teamwork Metaphor Slide Template for PowerPoint & Google Slides
Our Team
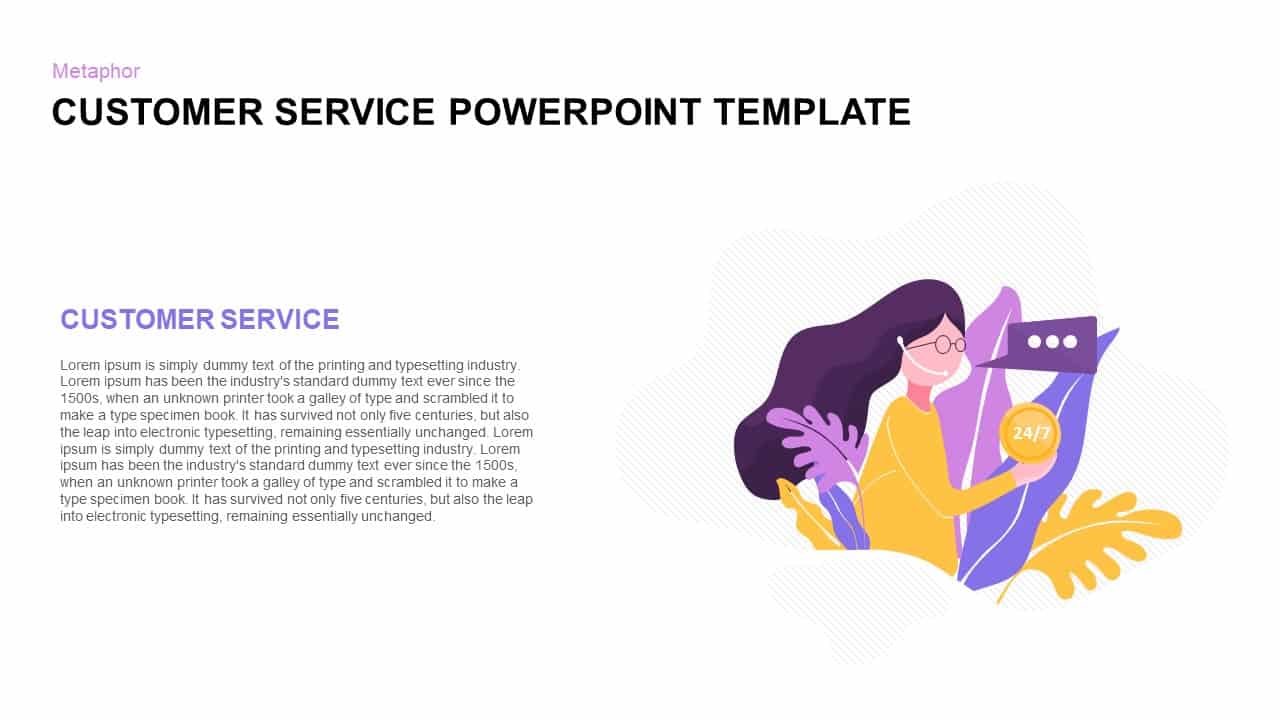
Customer Service Metaphor Infographic Template for PowerPoint & Google Slides
Customer Experience
Business Growth Metaphor Chart Template for PowerPoint & Google Slides
Business
Creative Power Analogy Metaphor Slide Template for PowerPoint & Google Slides
Leadership