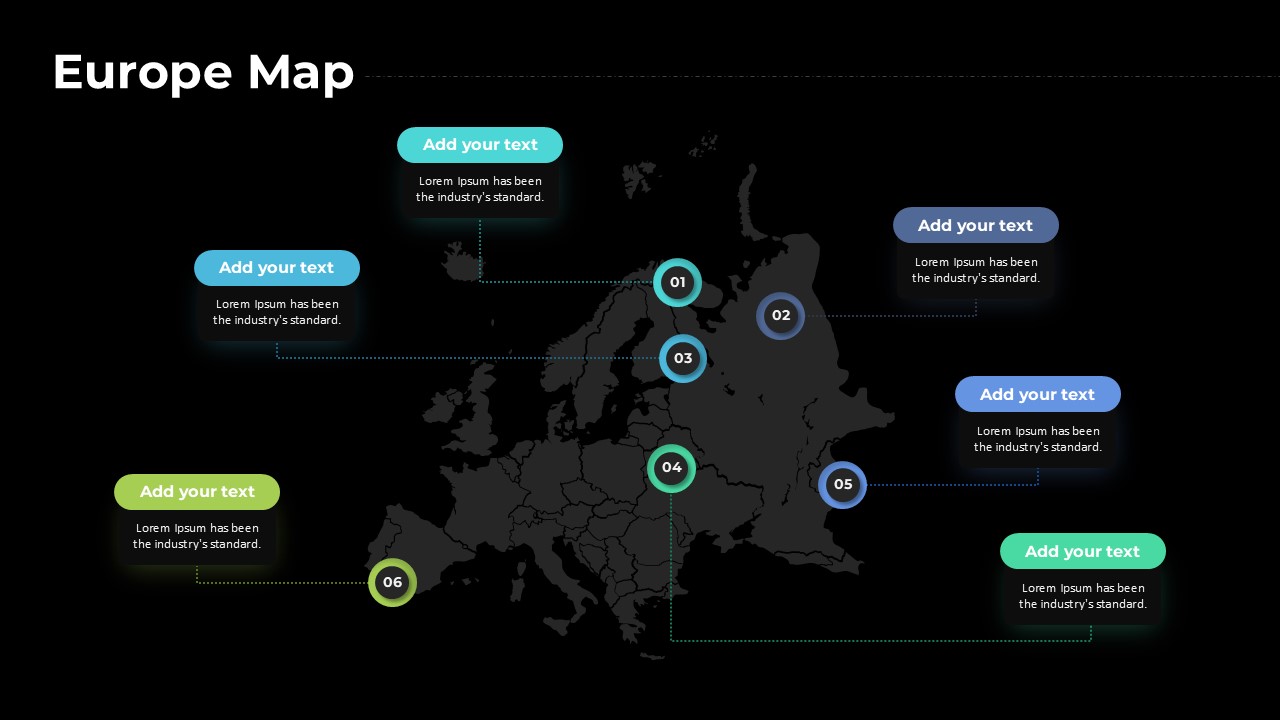
Europe Map with Six Editable Points Template for PowerPoint & Google Slides


Description
Leverage this Europe map slide to showcase location-based insights, regional performance data, or expansion strategies with six customizable markers. The slide features a clean, grayscale vector map of Europe as the backdrop, ensuring your colored data points stand out prominently. Each marker is represented by a numbered circular callout in distinct hues—teal, blue, green, and lime—connected to a corresponding text box via dotted lines. This design allows you to annotate key markets, highlight strategic regions, or track sales territories with clarity and precision.
Engineered for maximum flexibility, this slide uses master layouts and editable shapes so you can change map colors, adjust marker positions, or modify callout styles effortlessly in PowerPoint or Google Slides. All text placeholders support custom fonts and sizes, while the vector graphics maintain sharpness at any resolution. The dotted connectors adapt automatically when you move markers, providing intuitive alignment and saving you time on manual adjustments.
Whether you need to depict supply chain nodes, distribution centers, office locations, or market entry points, this Europe map slide offers a versatile framework for a wide range of presentation needs. Its minimal aesthetic, balanced layout, and ample whitespace ensure your audience focuses on the data that matters most, making complex geographical information easy to digest. Optimize your next strategy meeting, investor pitch, or quarterly review with this fully editable Europe map infographic slide.
Customizable color schemes and text formatting options enable you to align this slide with your corporate branding and presentation theme. The built-in guide lines ensure consistent spacing and alignment, helping you maintain a professional look across your slides. Compatible with cloud-based collaboration, this Europe map template allows teams to work seamlessly in Google Slides or sync updates across shared PowerPoint decks.
Who is it for
Marketing managers, sales directors, supply chain coordinators, and regional strategists will find this slide invaluable for presenting market insights, network coverage, or expansion plans. Consultants, project managers, and educators can leverage its clarity to communicate geographical data in board meetings, client presentations, or training sessions.
Other Uses
Adapt this slide to illustrate distribution networks, customer segmentation by region, office locations, travel itineraries, or event planning logistics. Use the customizable markers to highlight partner locations, service areas, risk zones, or competitive landscapes across European markets or global contexts.
Login to download this file

Item ID
SB04903
Related Templates

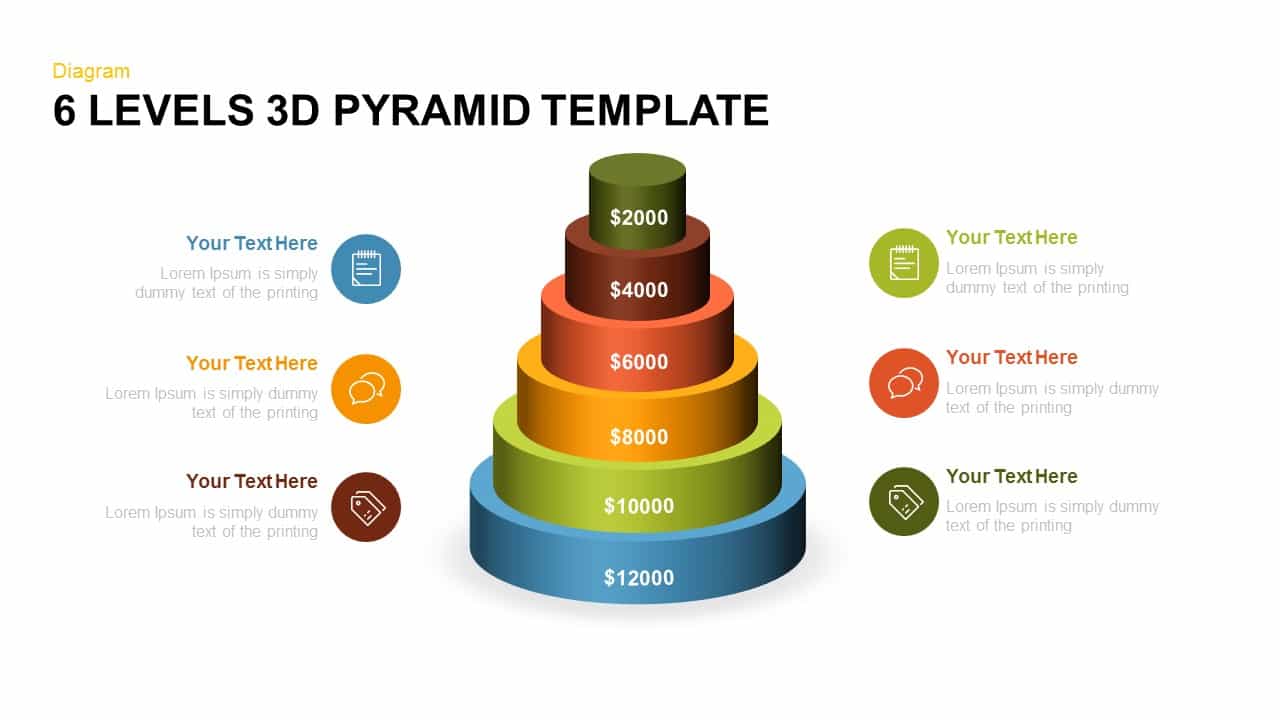
Editable Six-Level 3D Pyramid Diagram Template for PowerPoint & Google Slides
Pyramid

Editable Six-Step Bubble Process Diagram Template for PowerPoint & Google Slides
Process
Editable Colombia Map PowerPoint Template for PowerPoint & Google Slides
Business Models
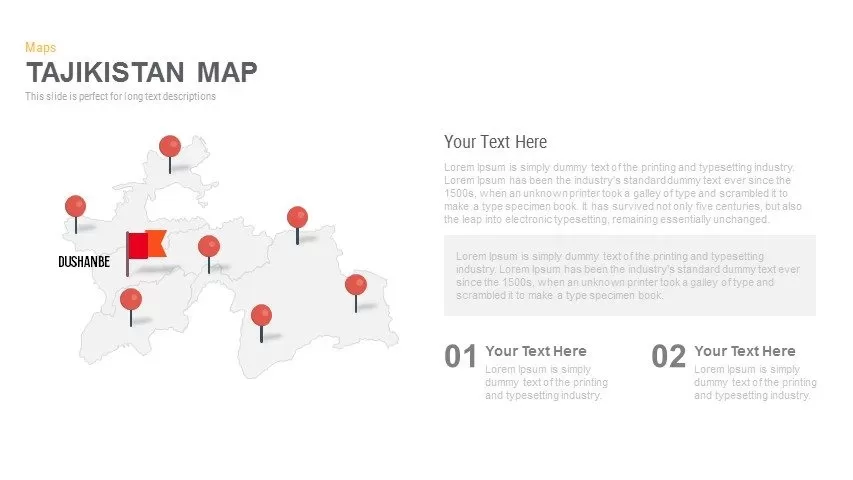
Editable Tajikistan Provinces Map Pack Template for PowerPoint & Google Slides
Maps
Fully Editable World Map Infographic Template for PowerPoint & Google Slides
World Maps
Editable World Map Callout Infographic Template for PowerPoint & Google Slides
World Maps
Editable World Map Callout Infographic Template for PowerPoint & Google Slides
World Maps
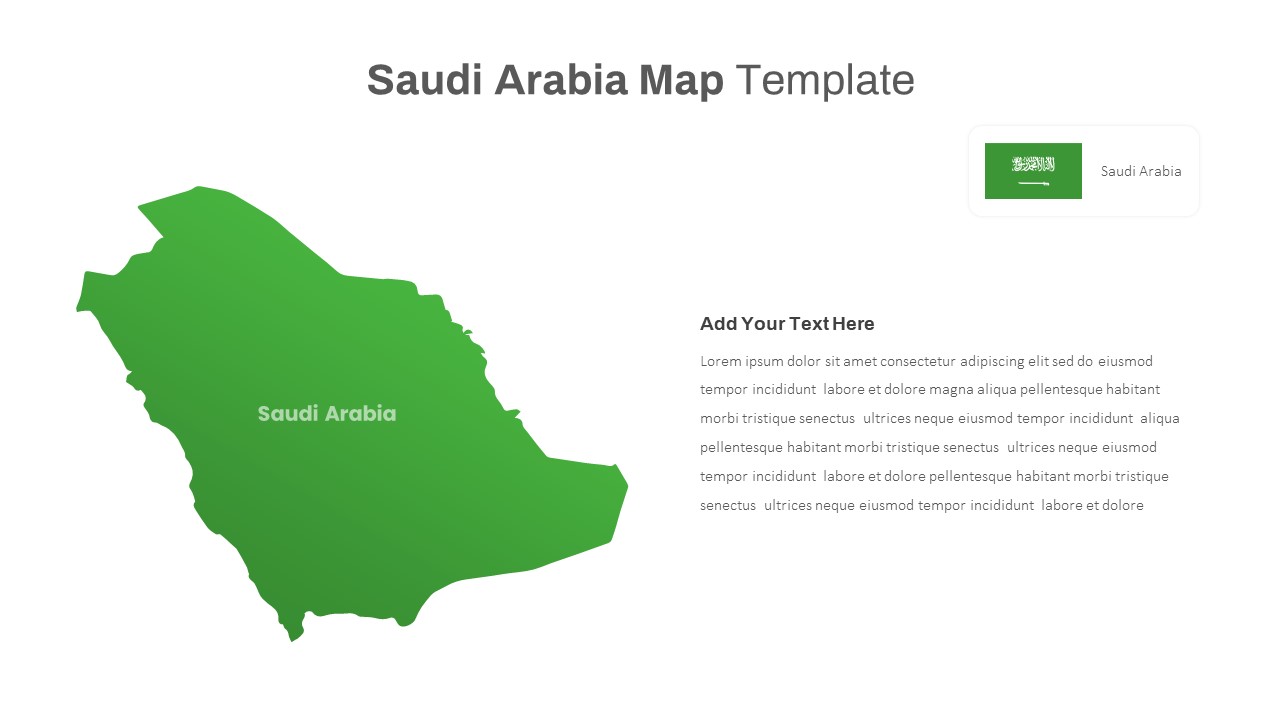
Free Editable Saudi Arabia Map Template for PowerPoint & Google Slides
World Maps
Free Editable U.S. Map with Regional Metrics Template for PowerPoint & Google Slides
World Maps
Free
Editable Africa Map Infographic Data Template for PowerPoint & Google Slides
World Maps
Editable Ireland Map Infographic Slide Template for PowerPoint & Google Slides
World Maps
Free
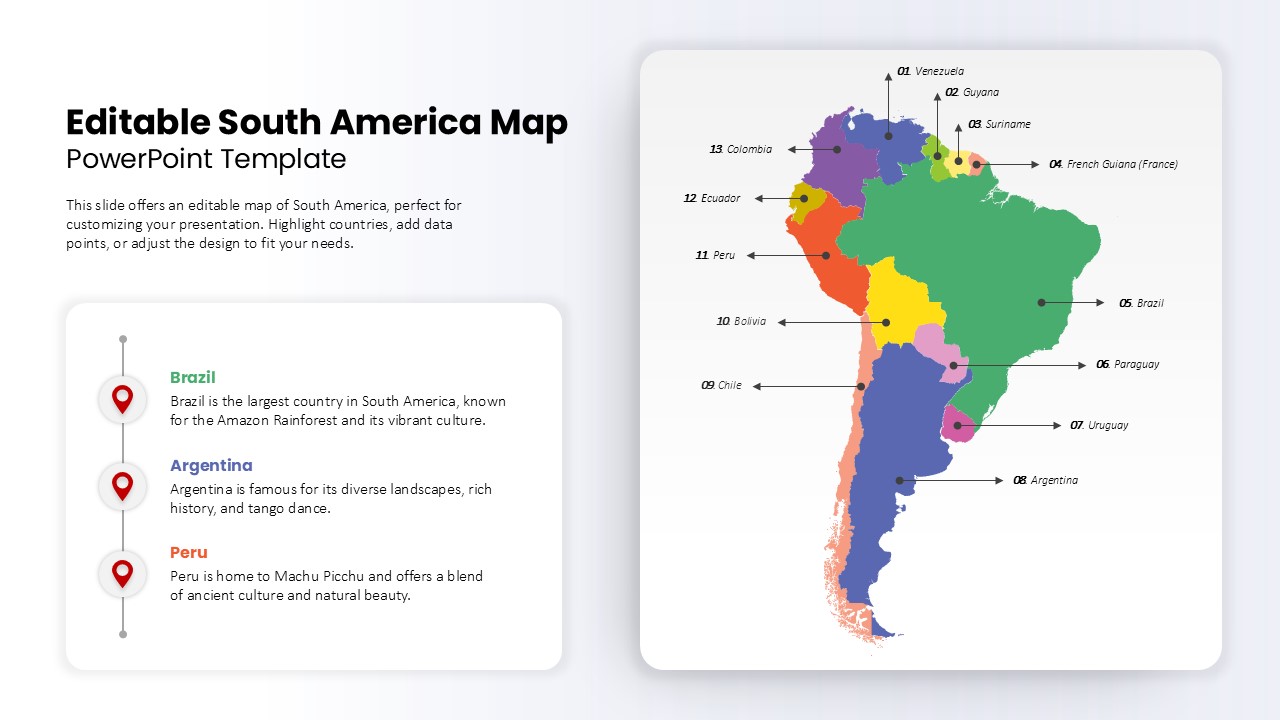
Editable South America Map Diagram Template for PowerPoint & Google Slides
Maps
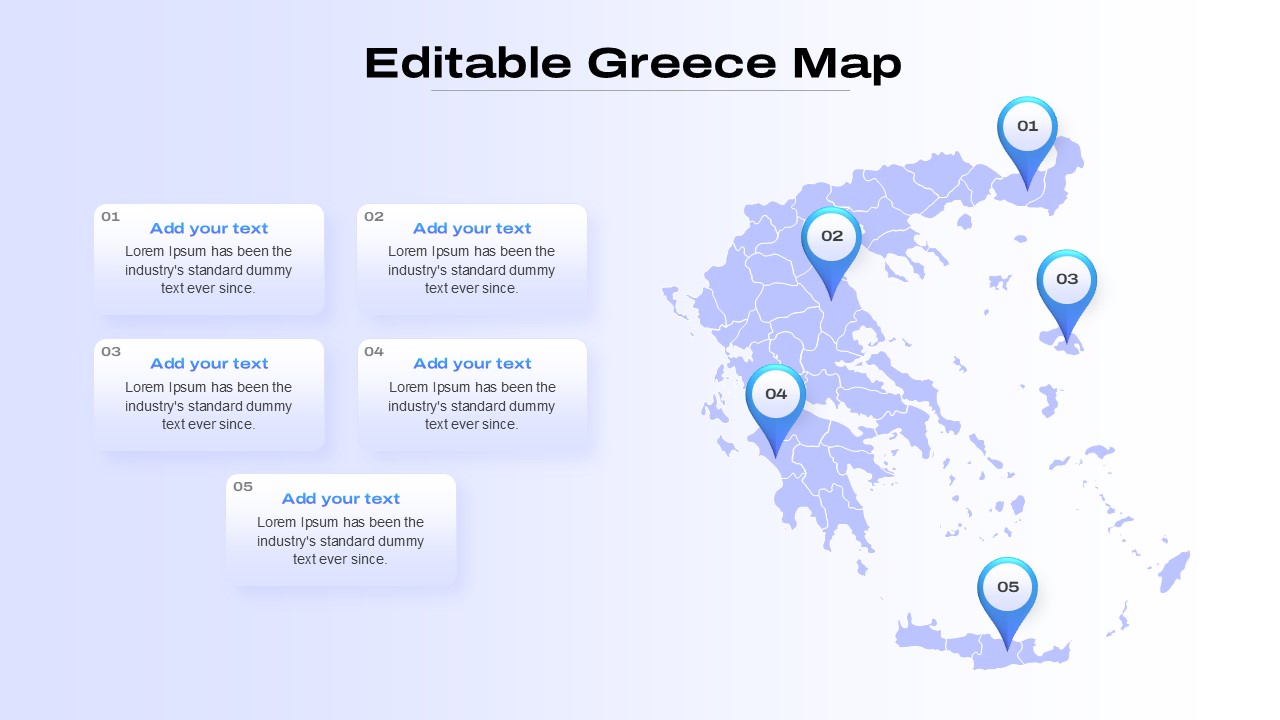
Editable Greece Map for PowerPoint & Google Slides
Maps
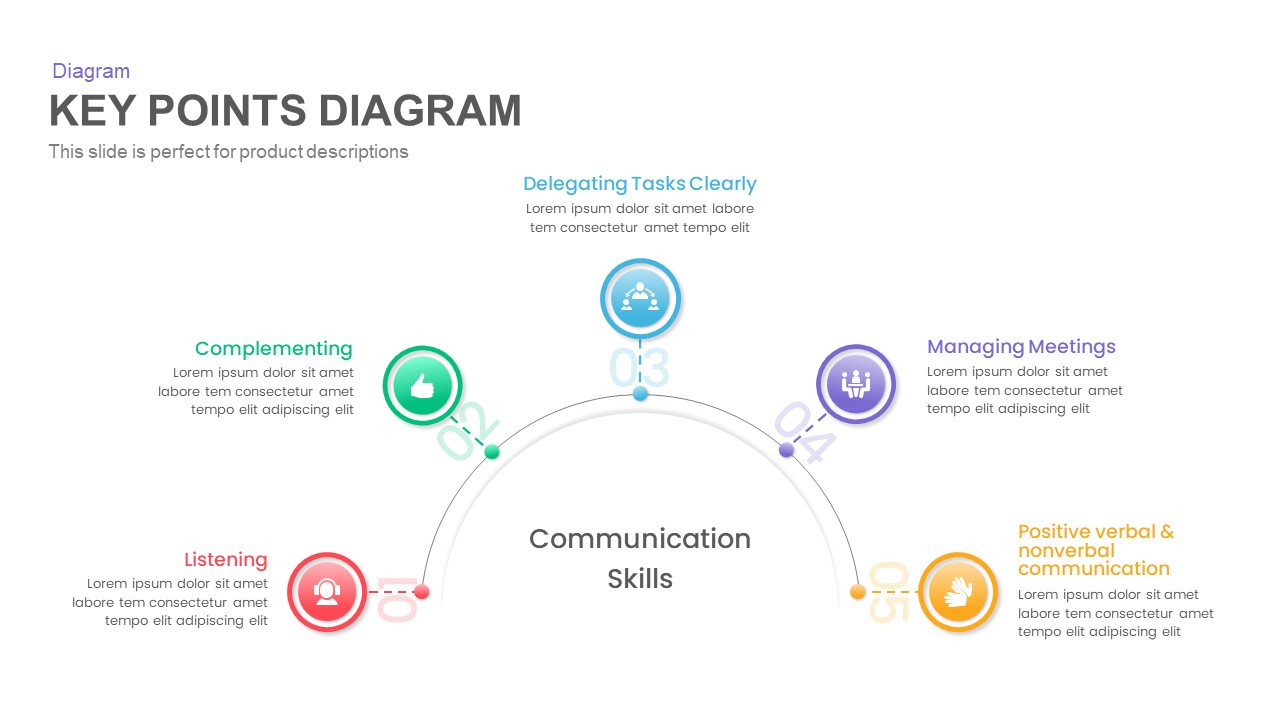
Dynamic Key Points Diagram Template for PowerPoint & Google Slides
Process
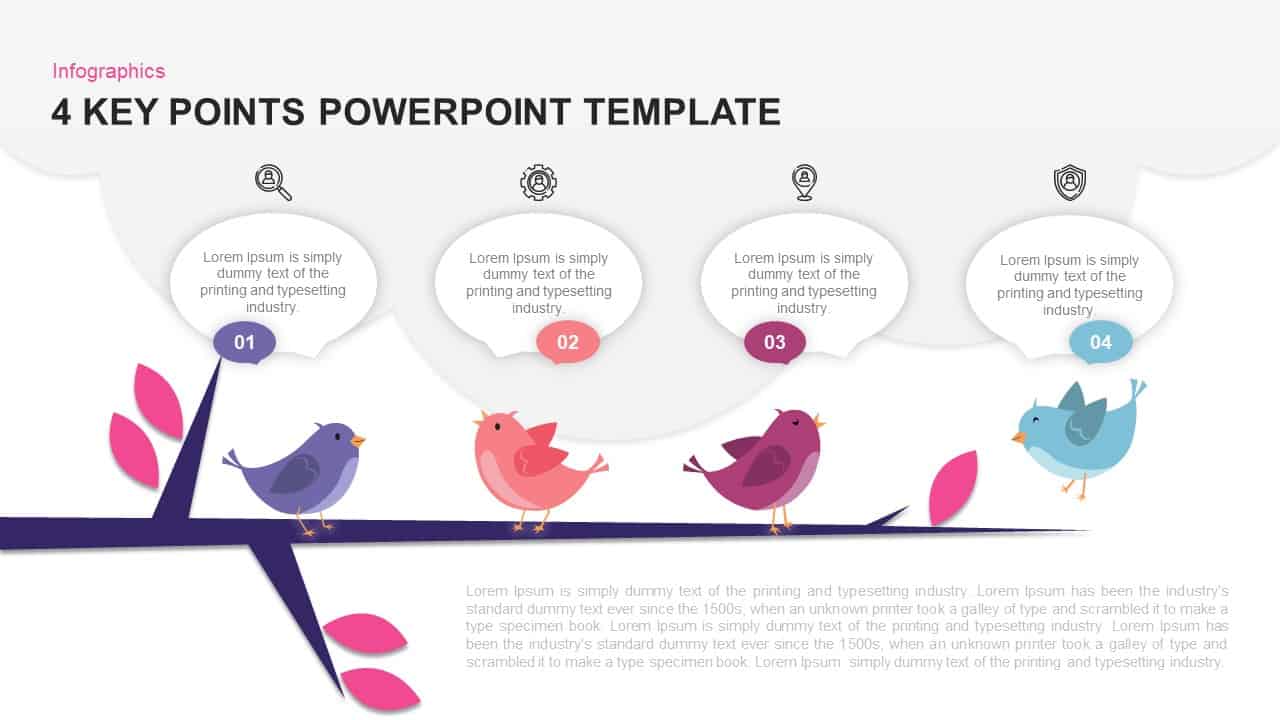
Bird Branch Four Key Points Infographic Template for PowerPoint & Google Slides
Agenda
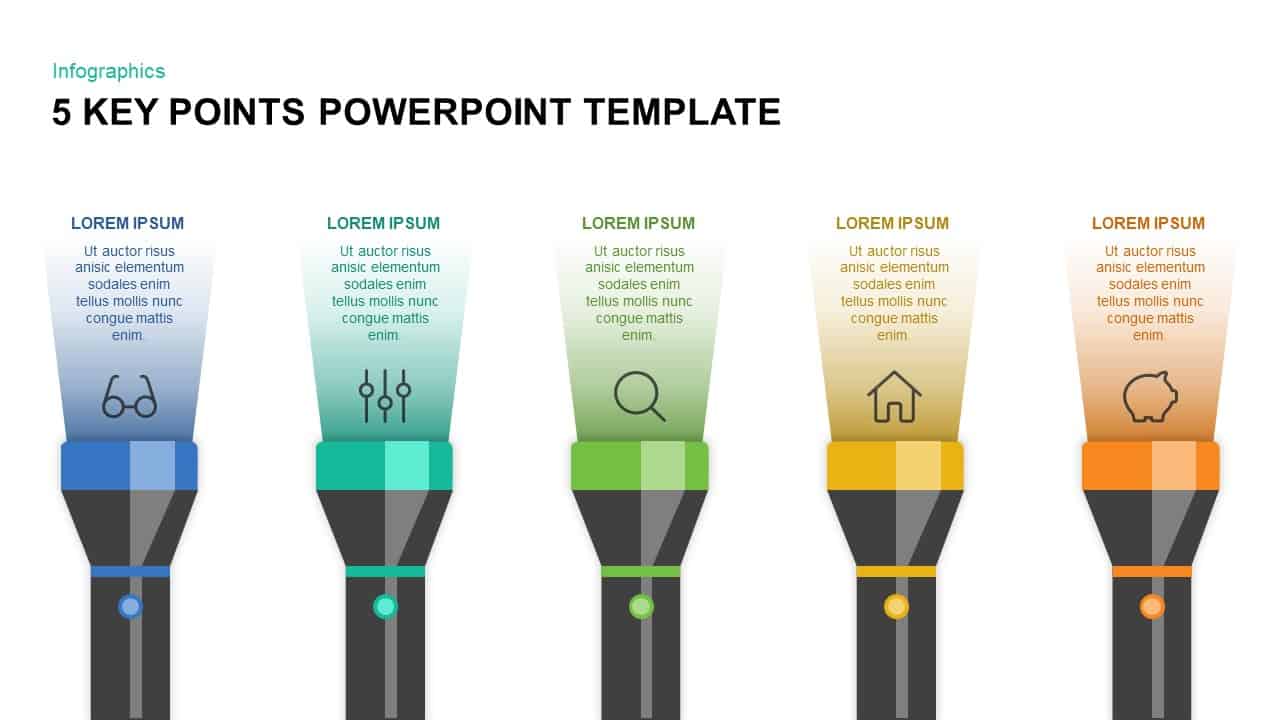
Five Key Flashlight Infographic Points Template for PowerPoint & Google Slides
Agenda
5 Key Points Infographic Diagram Template for PowerPoint & Google Slides
Process
Professional Circular Pain Points Template for PowerPoint & Google Slides
Circular
Discussion Points Layout Template for PowerPoint & Google Slides
Agenda
2 Points Agenda Slide template for PowerPoint & Google Slides
Agenda
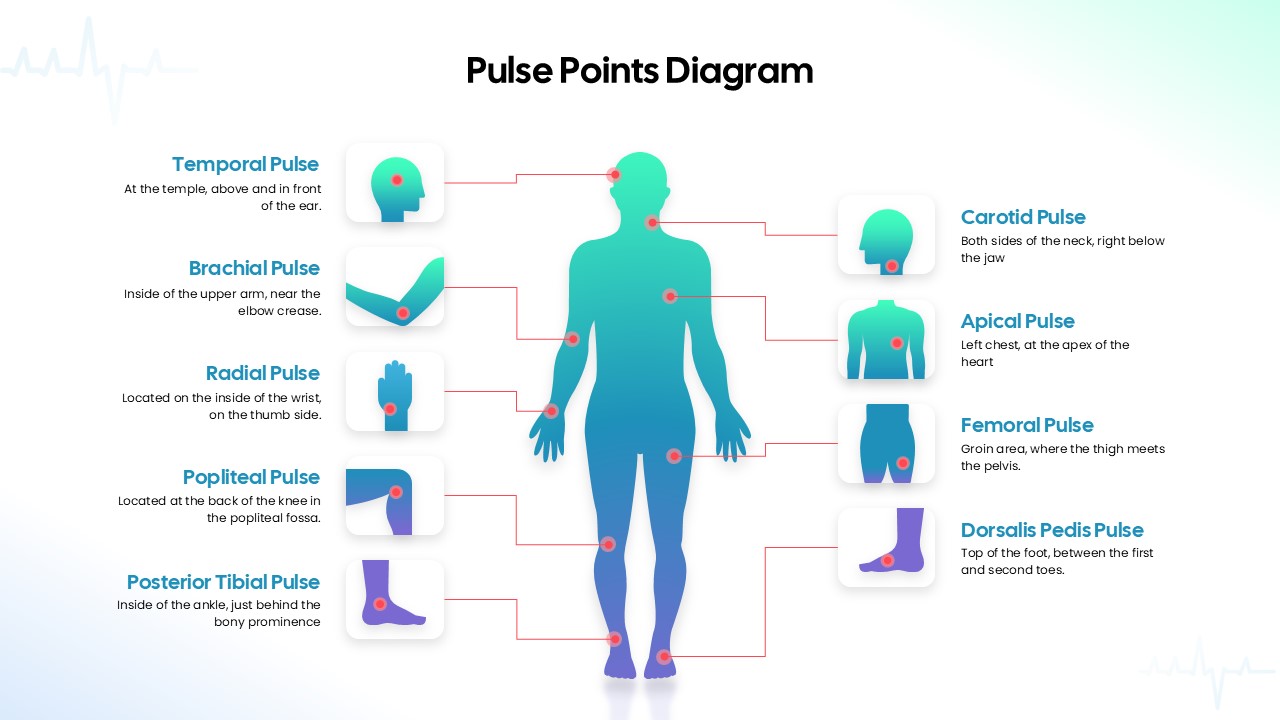
Human Body Pulse Points Diagram Template for PowerPoint & Google Slides
Medical
5 Bullet Points Presentation Template for PowerPoint & Google Slides
Process
Editable Colorful Daily Agenda Slides Template for PowerPoint & Google Slides
Agenda
Six-Stage Road Map Infographic Timeline Template for PowerPoint & Google Slides
Roadmap

Fully Editable Gantt Chart Timeline template for PowerPoint & Google Slides
Gantt Chart
Editable Hierarchical Tree Diagram Template for PowerPoint & Google Slides
Decision Tree
Editable Twin Circle Process Diagram Template for PowerPoint & Google Slides
Process
Editable Force Field Analysis Diagram Template for PowerPoint & Google Slides
Business Plan
Editable Four-Section 3D Shape Diagram Template for PowerPoint & Google Slides
Comparison
Editable Four-Point Timeline Agenda Template for PowerPoint & Google Slides
Agenda
Editable Plant Growth Stages Diagram Template for PowerPoint & Google Slides
Process
Editable Pillars Infographics Pack Template for PowerPoint & Google Slides
Infographics

Editable SIPOC Process Diagram Deck Template for PowerPoint & Google Slides
Pitch Deck
Editable Four-Quadrant TOWS Matrix Template for PowerPoint & Google Slides
Opportunities Challenges
Free Editable Check Box Icon Set Presentation Template for PowerPoint & Google Slides
Infographics
Free
Editable Buyer Persona Profile Slide Template for PowerPoint & Google Slides
Customer Journey

Editable 2024 Calendar Yearly Overview Template for PowerPoint & Google Slides
Decks
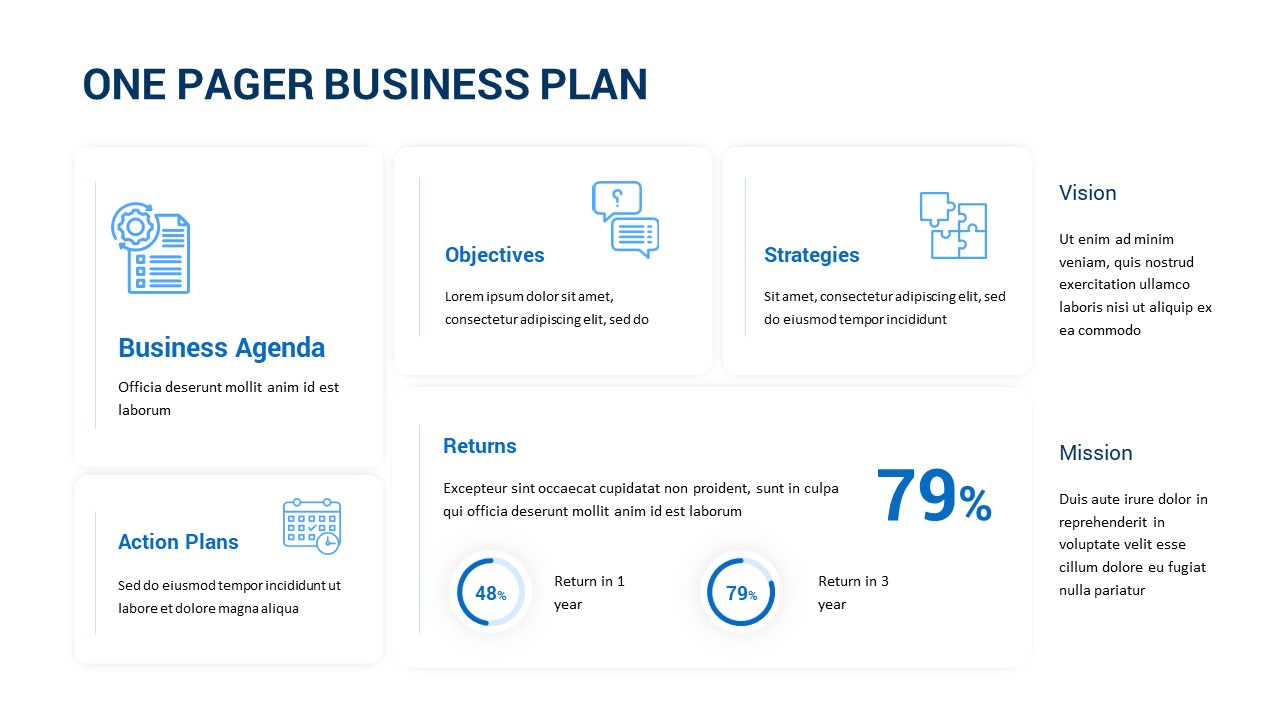
Editable One-Pager Business Plan Slide Template for PowerPoint & Google Slides
Business Plan
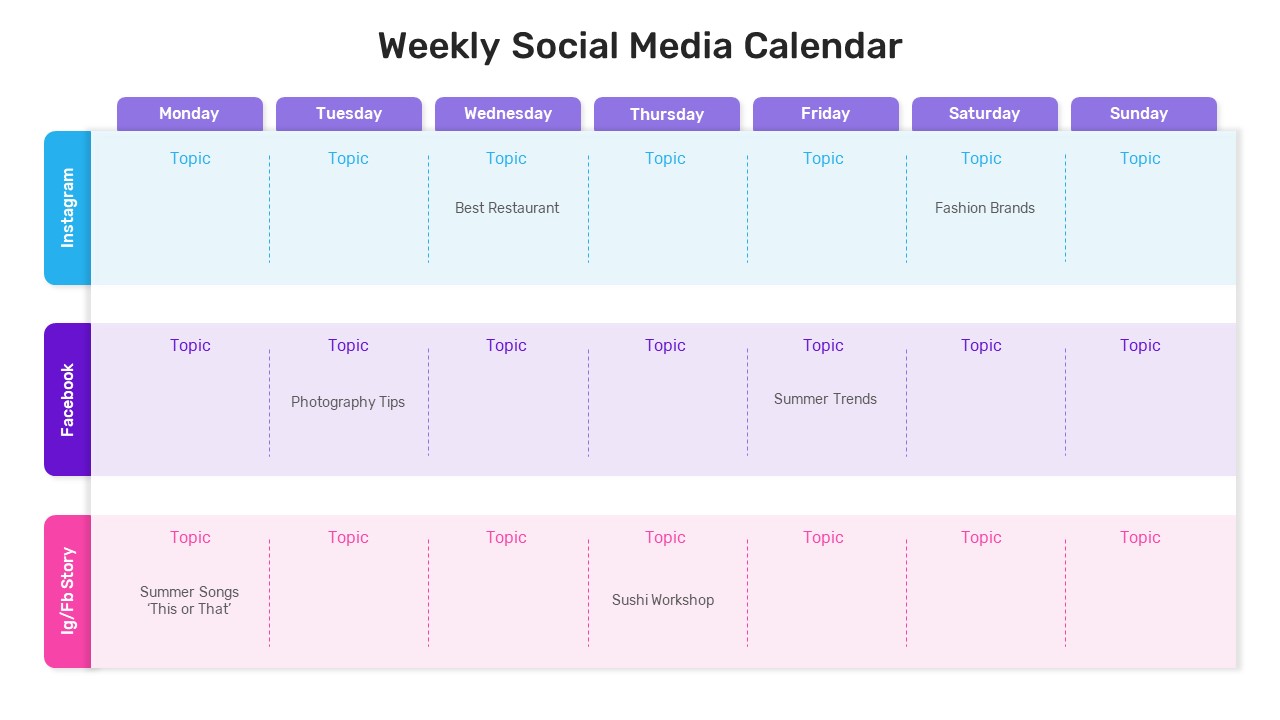
Weekly Social Media Calendar Editable Template for PowerPoint & Google Slides
Digital Marketing
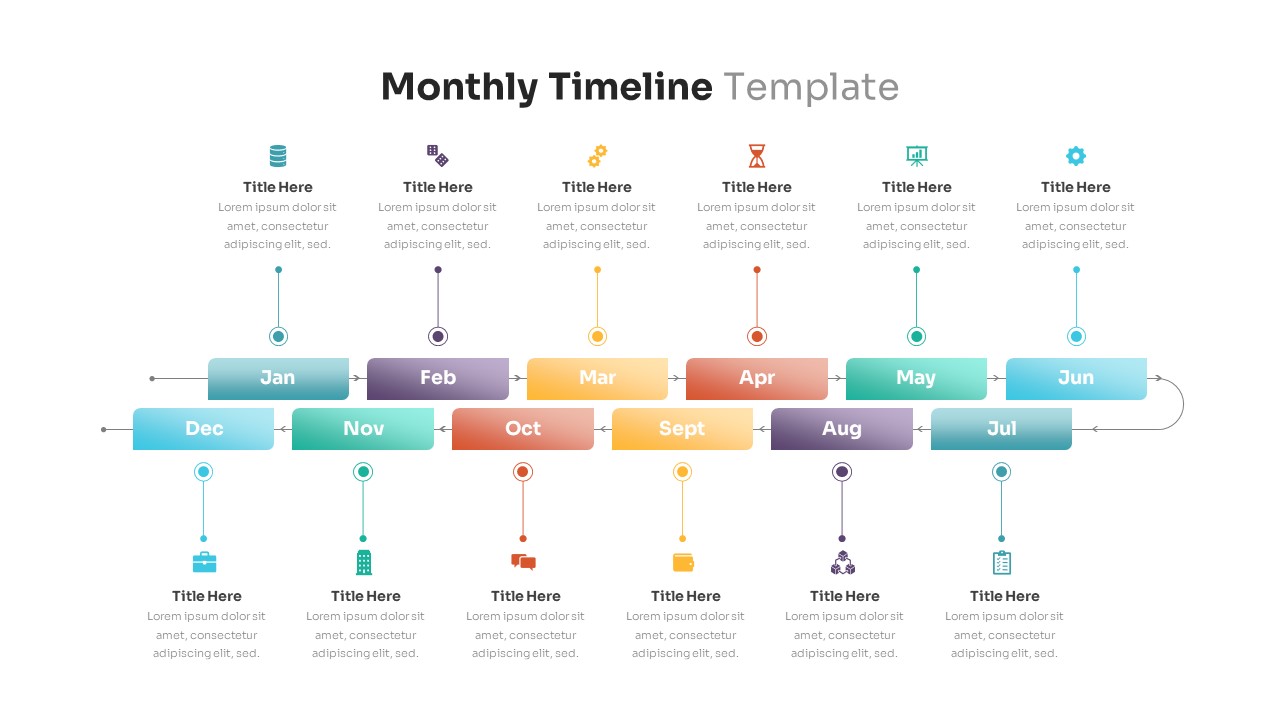
Editable Monthly Timeline Infographic Template for PowerPoint & Google Slides
Timeline
Professional Editable 6 Month Timeline Template for PowerPoint & Google Slides
Timeline
Editable C-Suite Organizational Chart Template for PowerPoint & Google Slides
Org Chart
Free Editable Simple Column Chart Slide Template for PowerPoint & Google Slides
Bar/Column
Free
Editable Sales Pitch Deck Presentation Template for PowerPoint & Google Slides
Pitch Deck
Editable Multi-Series Peak Line Chart Template for PowerPoint & Google Slides
Comparison Chart
Arrow Types Shape Library Editable Template for PowerPoint & Google Slides
Arrow
Free Editable Multi-Step Ribbon Agenda Slide Template for PowerPoint & Google Slides
Agenda
Free
Free Editable Family Tree Genealogy Diagram Template for PowerPoint & Google Slides
Org Chart
Free
Fully Editable Retro Vintage Theme Deck Template for PowerPoint & Google Slides
Company Profile
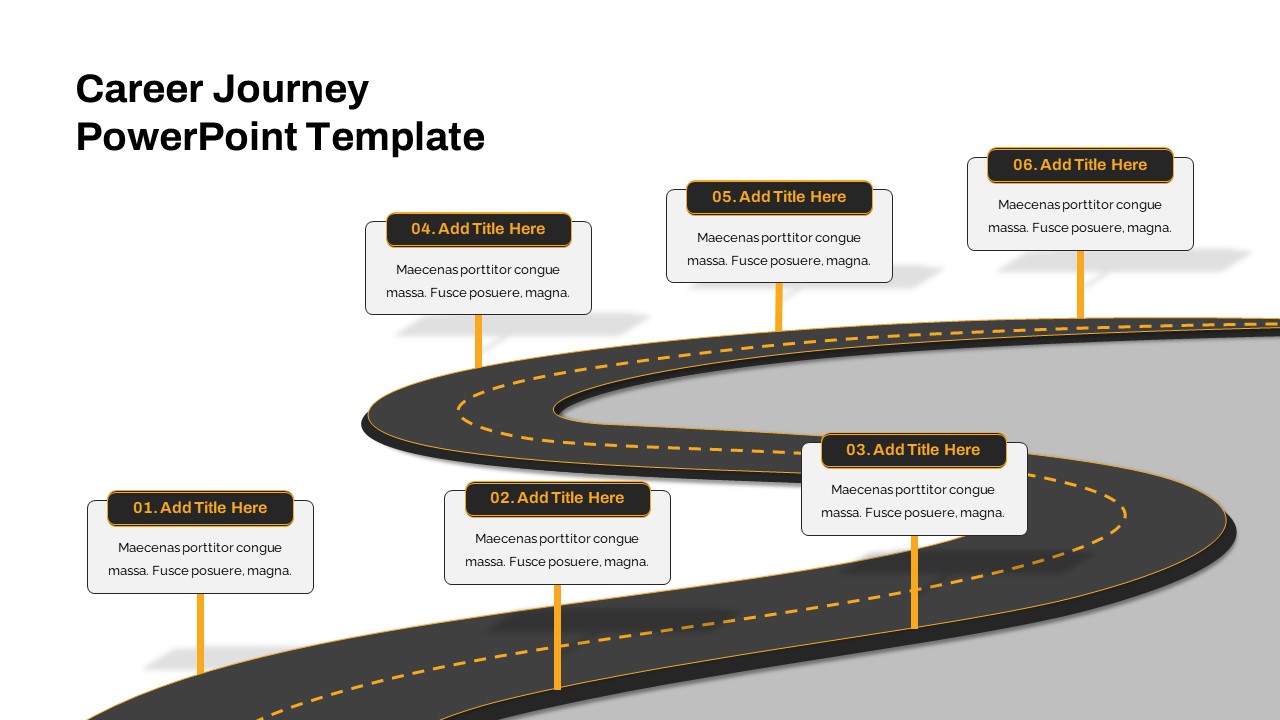
Fully Editable Career Journey Roadmap Template for PowerPoint & Google Slides
Customer Journey
Free
Fully Editable Watercolor Theme Deck Template for PowerPoint & Google Slides
Pitch Deck
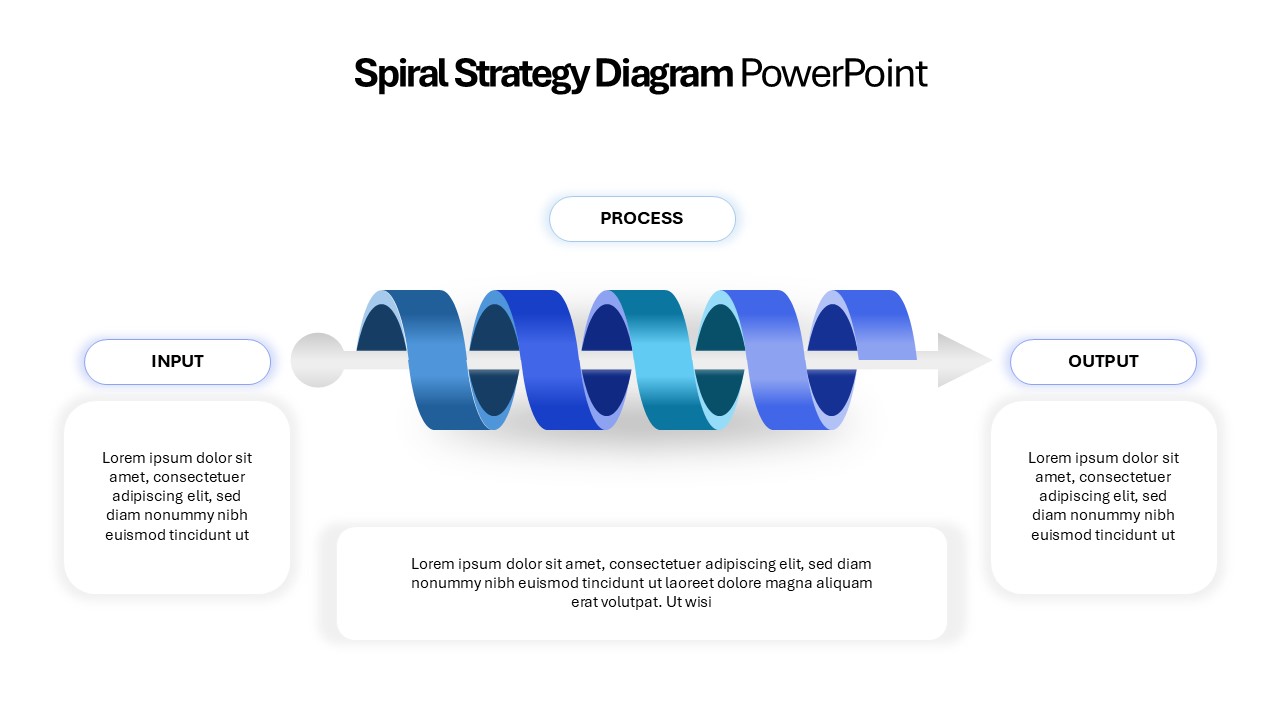
Editable 3D Spiral Strategy Diagram Template for PowerPoint & Google Slides
Process
Six Double Diamond Infographic Slides Template for PowerPoint & Google Slides
Process

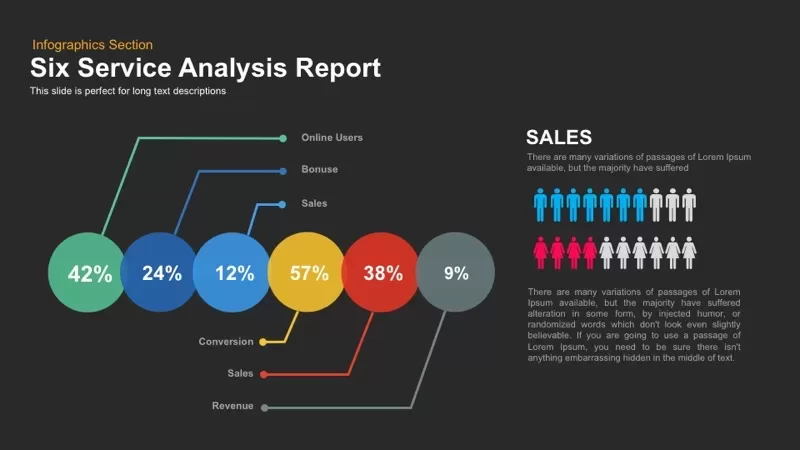
Six Service Analysis Report template for PowerPoint & Google Slides
Infographics
Six Step Creative Circular Diagram Template for PowerPoint & Google Slides
Circular
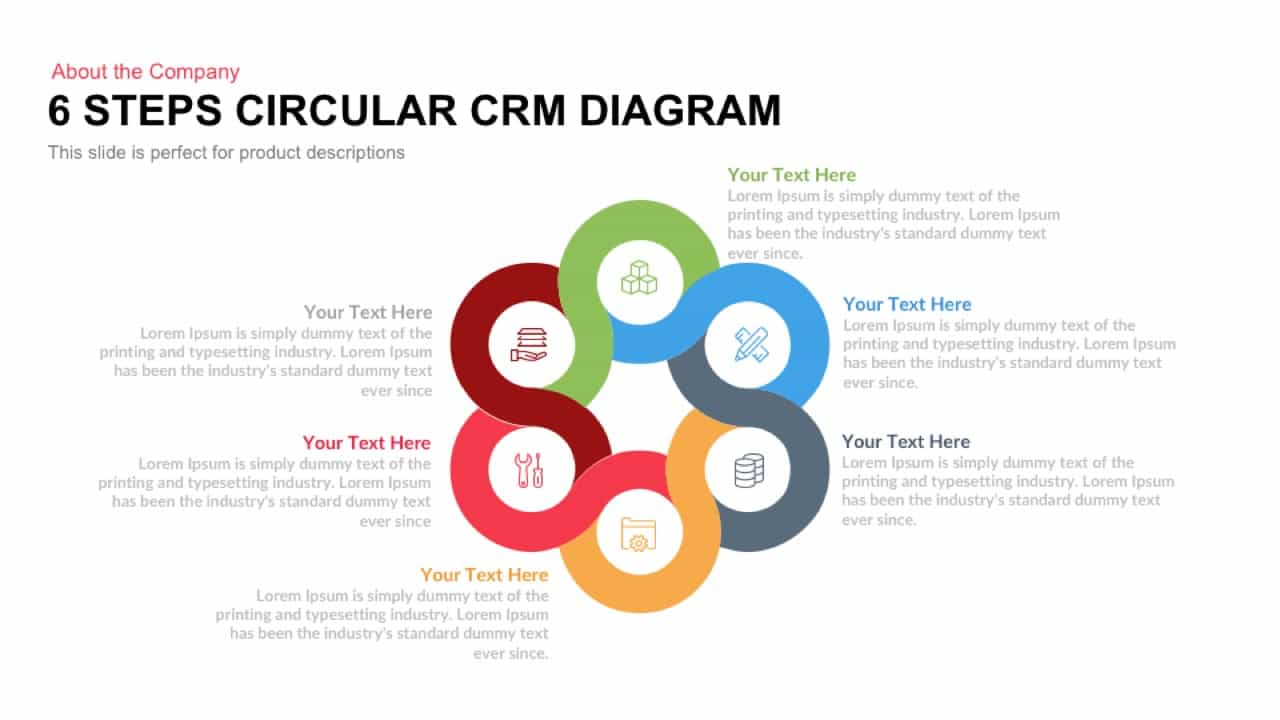
Six Steps Circular CRM Diagram Template for PowerPoint & Google Slides
Customer Journey
Six Section Circular Infographic Diagram Template for PowerPoint & Google Slides
Circular
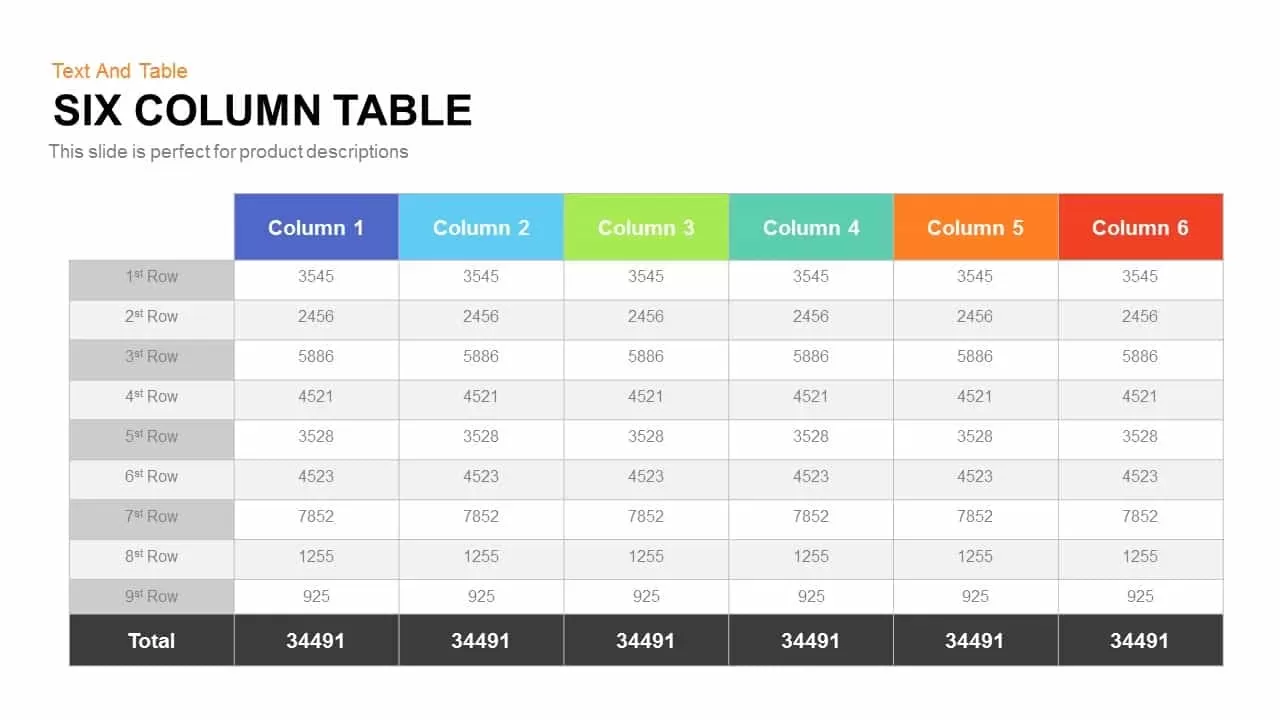
Six Column Table template for PowerPoint & Google Slides
Table
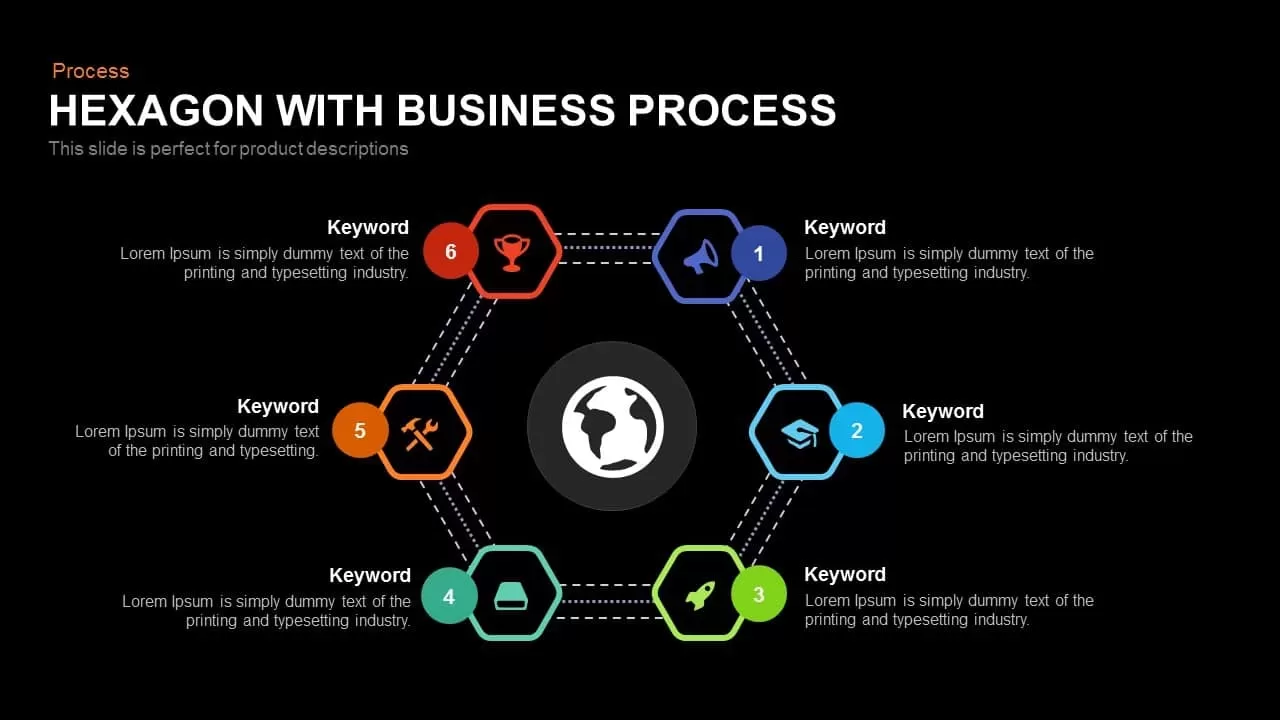
Global Hexagon Six-Step Business Process Template for PowerPoint & Google Slides
Process
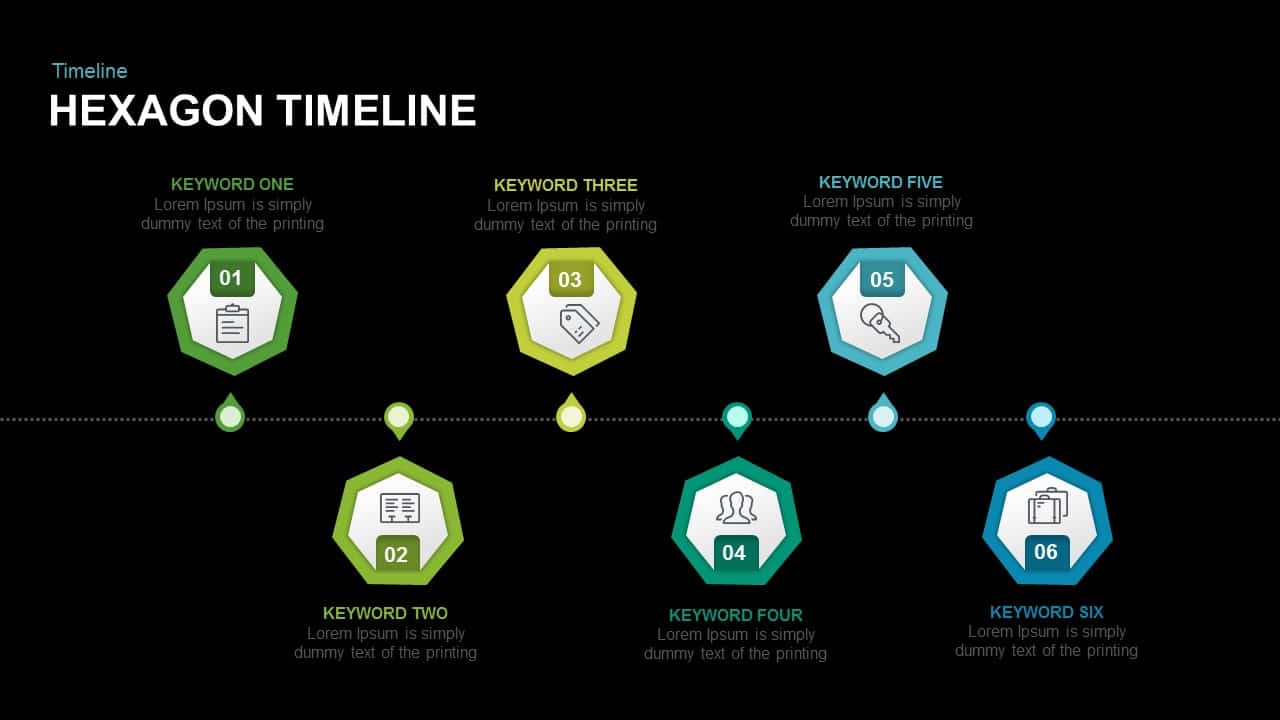
Six-Stage Hexagon Timeline Infographic Template for PowerPoint & Google Slides
Timeline
Two To Six Textbox Layout Template for PowerPoint & Google Slides
Agenda
Free Six Stage Bubble Process Diagram template for PowerPoint & Google Slides
Process
Free
Six-Section Star Infographic Diagram Template for PowerPoint & Google Slides
Circular
Six-Step Hexagonal Diagram Slide Template for PowerPoint & Google Slides
Circular
Six-Stage Circle Process Diagram Template for PowerPoint & Google Slides
Process
Six-Step Vertical Process Diagram Template for PowerPoint & Google Slides
Process
Six-Section Professional Agenda Template for PowerPoint & Google Slides
Agenda
Six-Step Linear Arrow Process Diagram Template for PowerPoint & Google Slides
Process
Six-Stage Service Process Workflow Template for PowerPoint & Google Slides
Process
Six-Stage Circular Diagram Process Template for PowerPoint & Google Slides
Circular
Six-Stage Clockwise Circular Diagram Template for PowerPoint & Google Slides
Circular
Six-Step Purple Gradient Infographics Template for PowerPoint & Google Slides
Process
Six-Step Audit Implementation Chart Template for PowerPoint & Google Slides
Circular
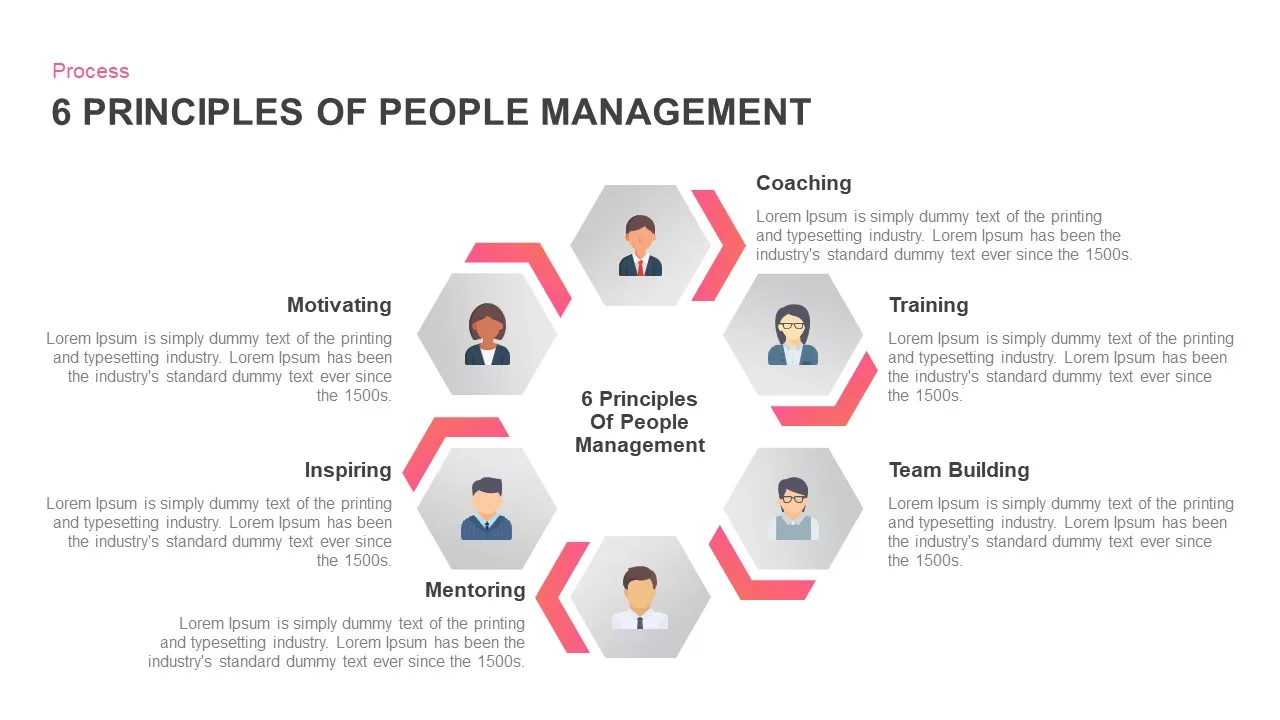
Six Principles of People Management Template for PowerPoint & Google Slides
HR
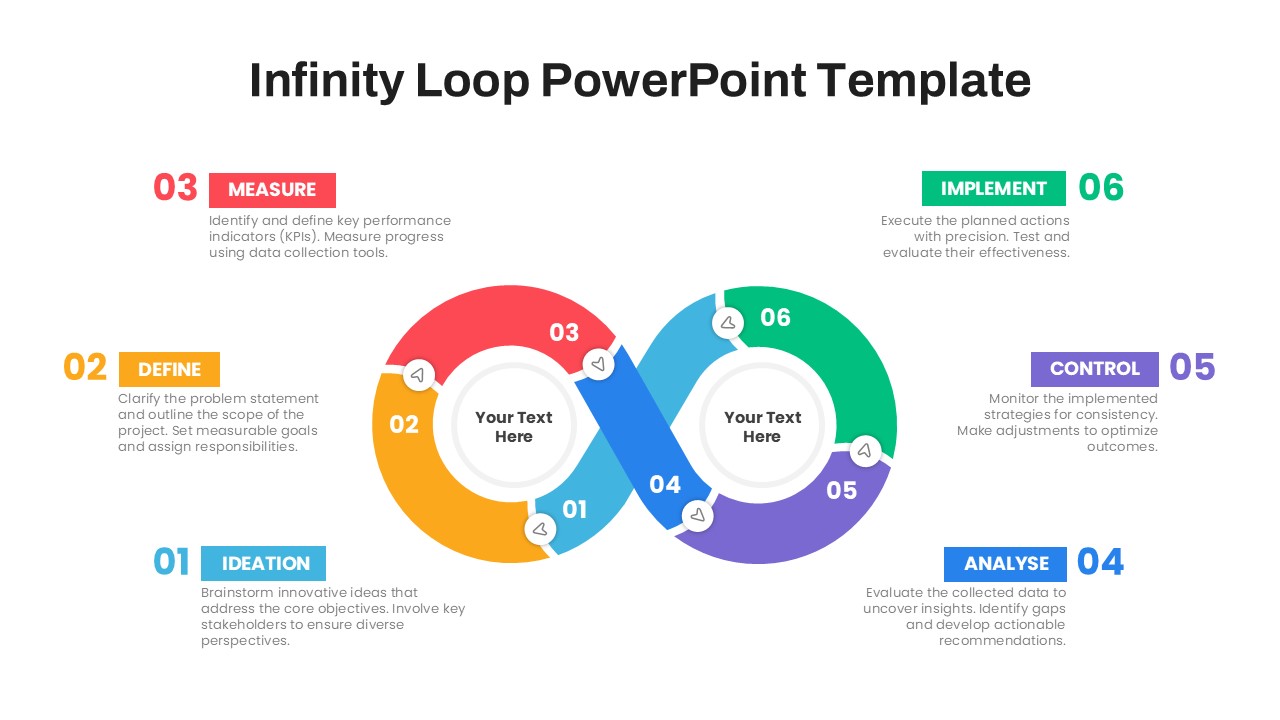
Six-Step Infinity Loop Process Diagram Template for PowerPoint & Google Slides
Process
Six Sigma 6S Process Infographic Diagram Template for PowerPoint & Google Slides
Process
Six-Circle Process Infographic Diagram Template for PowerPoint & Google Slides
Circular
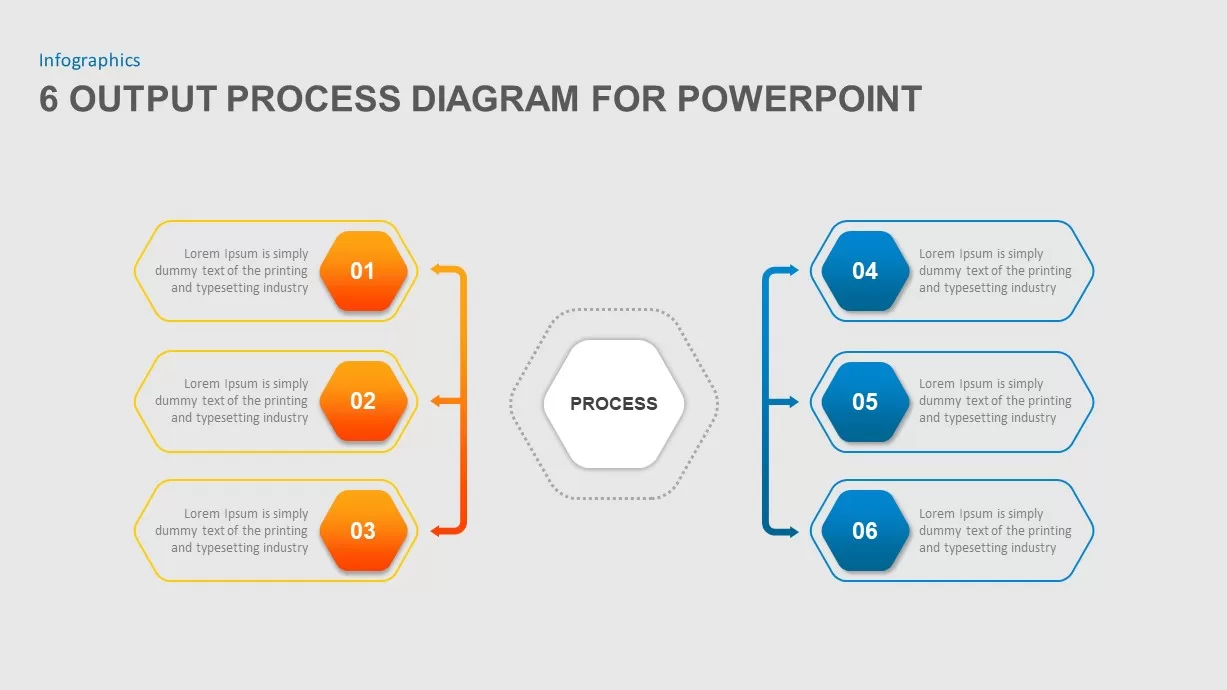
Six-Step Output Process Diagram Template for PowerPoint & Google Slides
Process
Circular 3D Cube Six-Segment Diagram Template for PowerPoint & Google Slides
Infographics
Stacked Cubes Pyramid Six-Option Diagram Template for PowerPoint & Google Slides
Pyramid
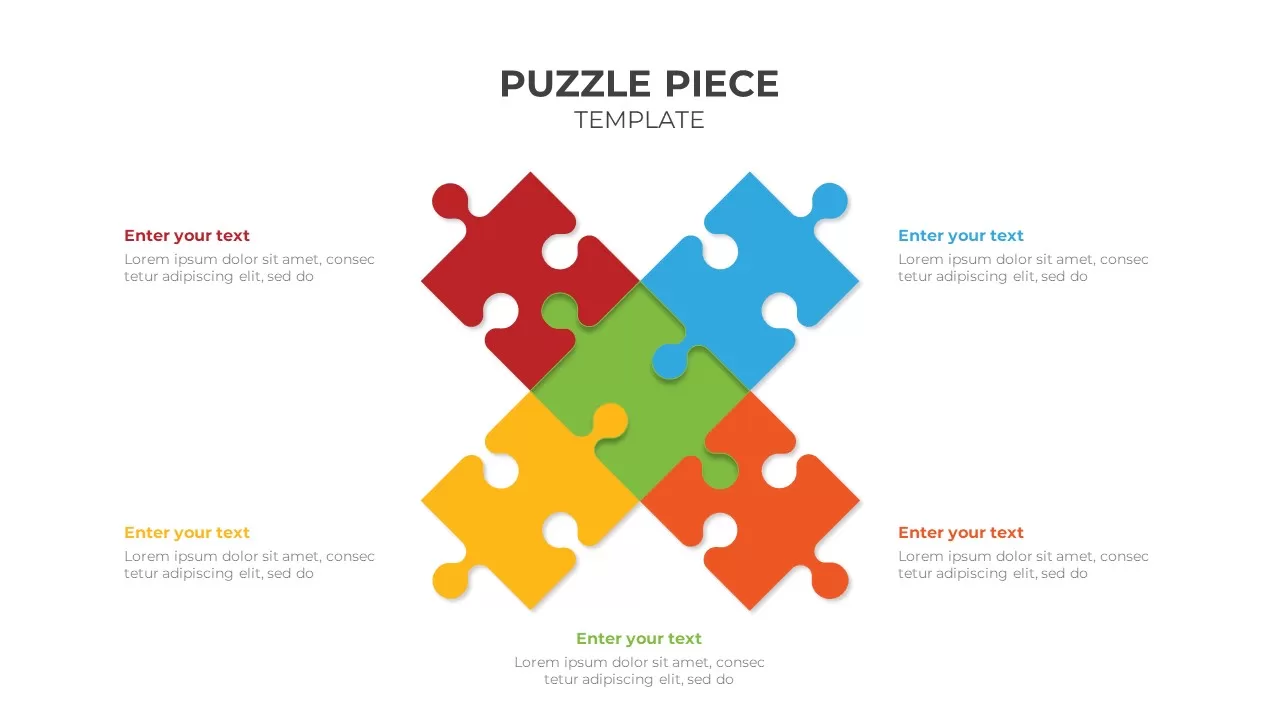
Six-Piece Puzzle Diagram Template for PowerPoint & Google Slides
Process
Six-Section Color-Coded Agenda Template for PowerPoint & Google Slides
Agenda
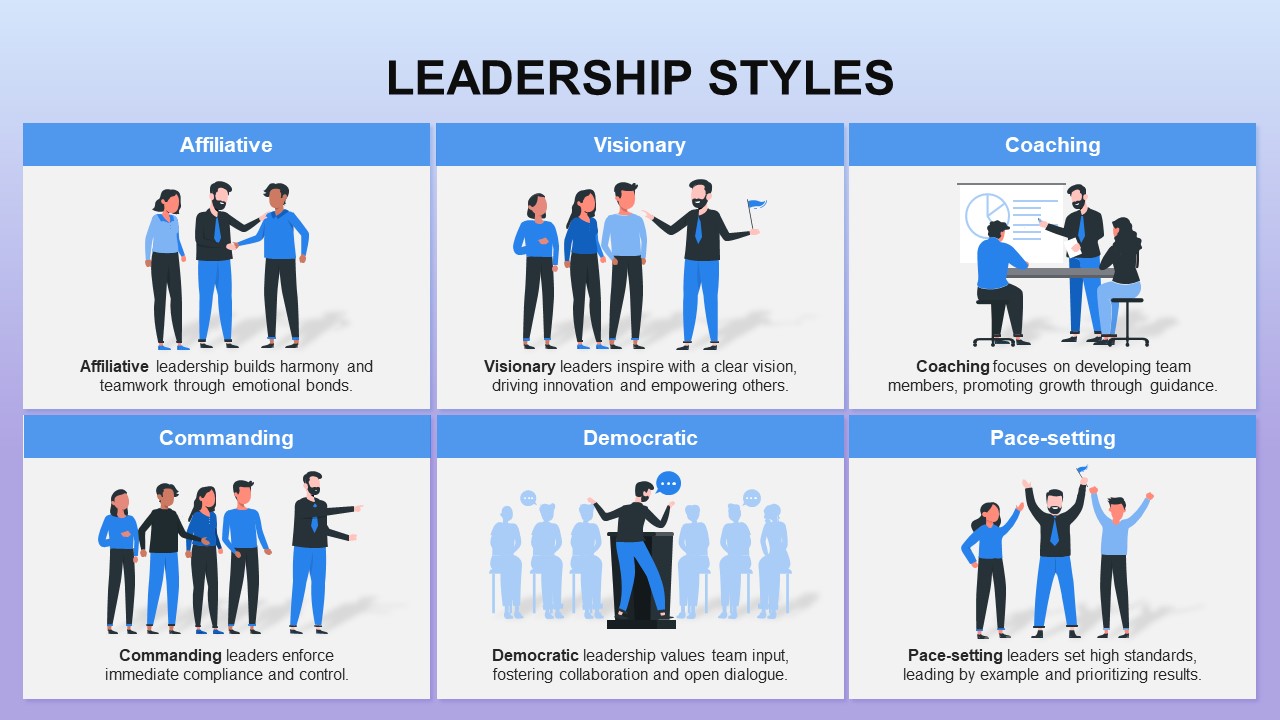
Six Leadership Styles Grid Infographic Template for PowerPoint & Google Slides
Leadership
Six-Step Table of Contents Infographic Template for PowerPoint & Google Slides
Agenda
Six-Step Accomplishment Radial Infographic Template for PowerPoint & Google Slides
Accomplishment
Six-Step Hexagon Infographic Layout Template for PowerPoint & Google Slides
Infographics
Six-Segment 360 Degree View Infographic Template for PowerPoint & Google Slides
Circular
Six-Step Social Media Management Process Template for PowerPoint & Google Slides
Process
Six-Month New Leader Onboarding Roadmap Template for PowerPoint & Google Slides
Roadmap
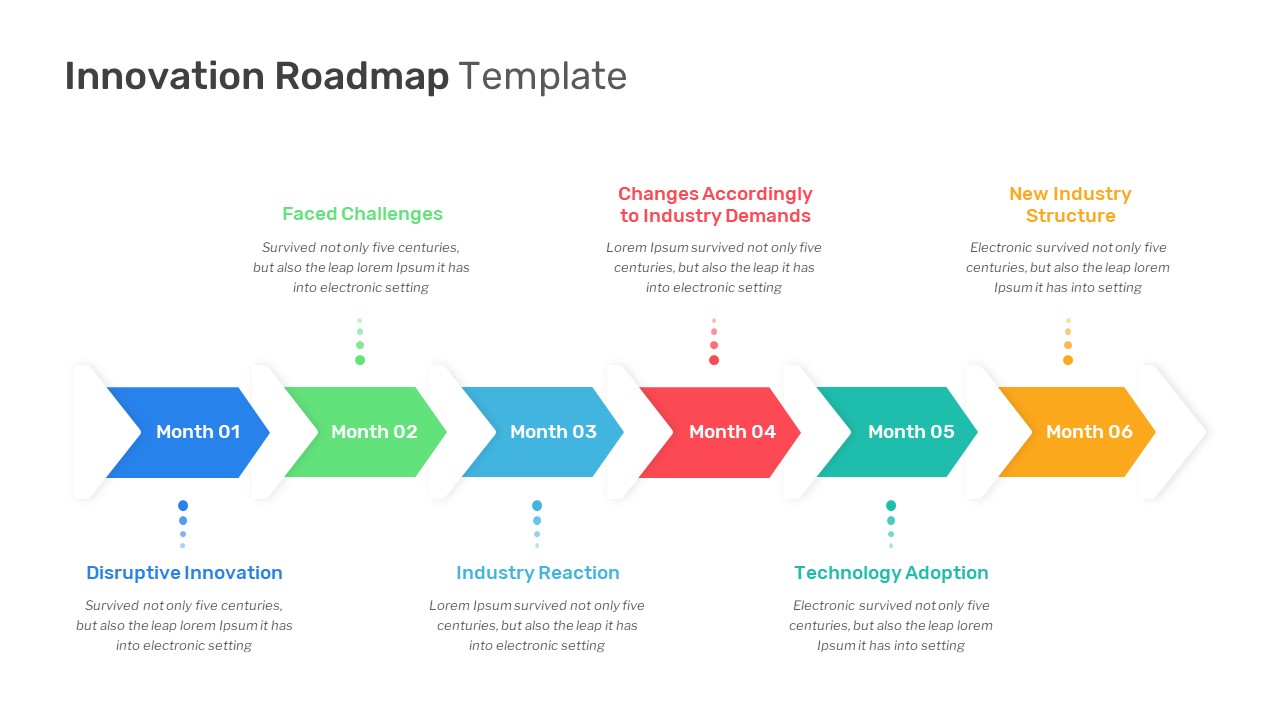
Six-Month Innovation Roadmap Timeline Template for PowerPoint & Google Slides
Roadmap
Six-Block Capability Statement Template for PowerPoint & Google Slides
Business Report
Six-Month Strategic SEO Roadmap Template for PowerPoint & Google Slides
Roadmap
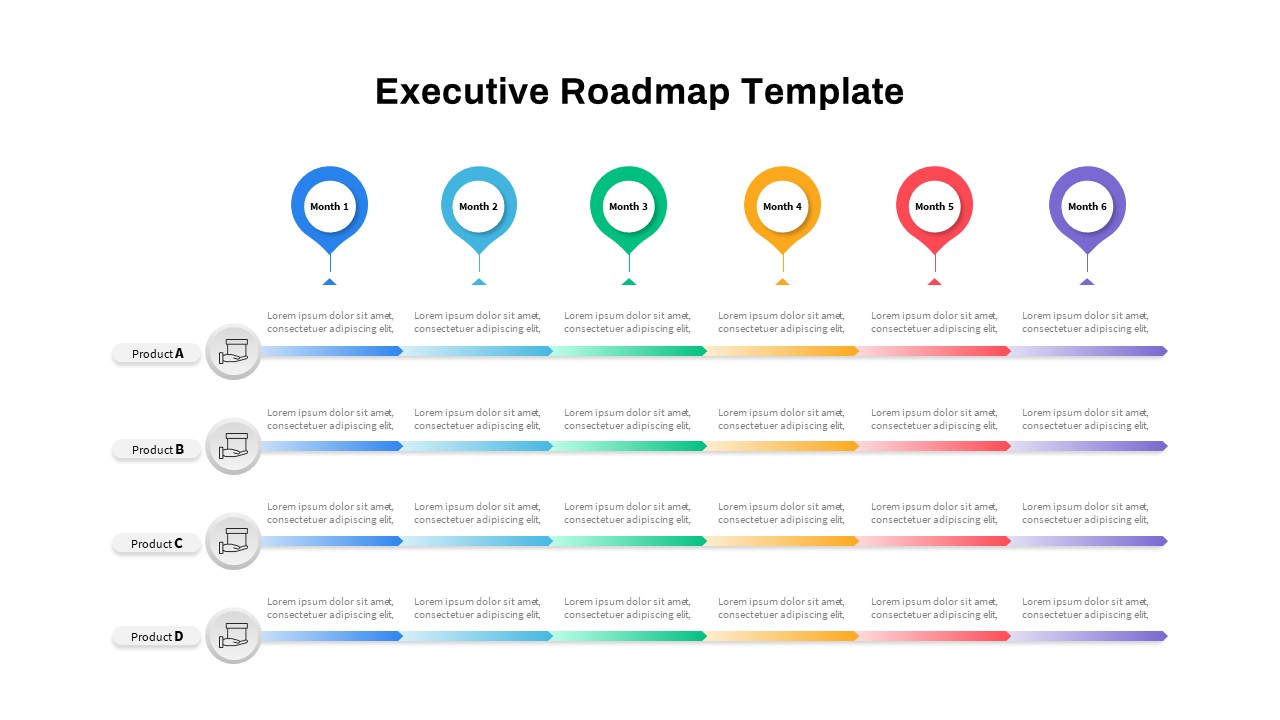
Executive Roadmap Six-Month Timeline Template for PowerPoint & Google Slides
Roadmap
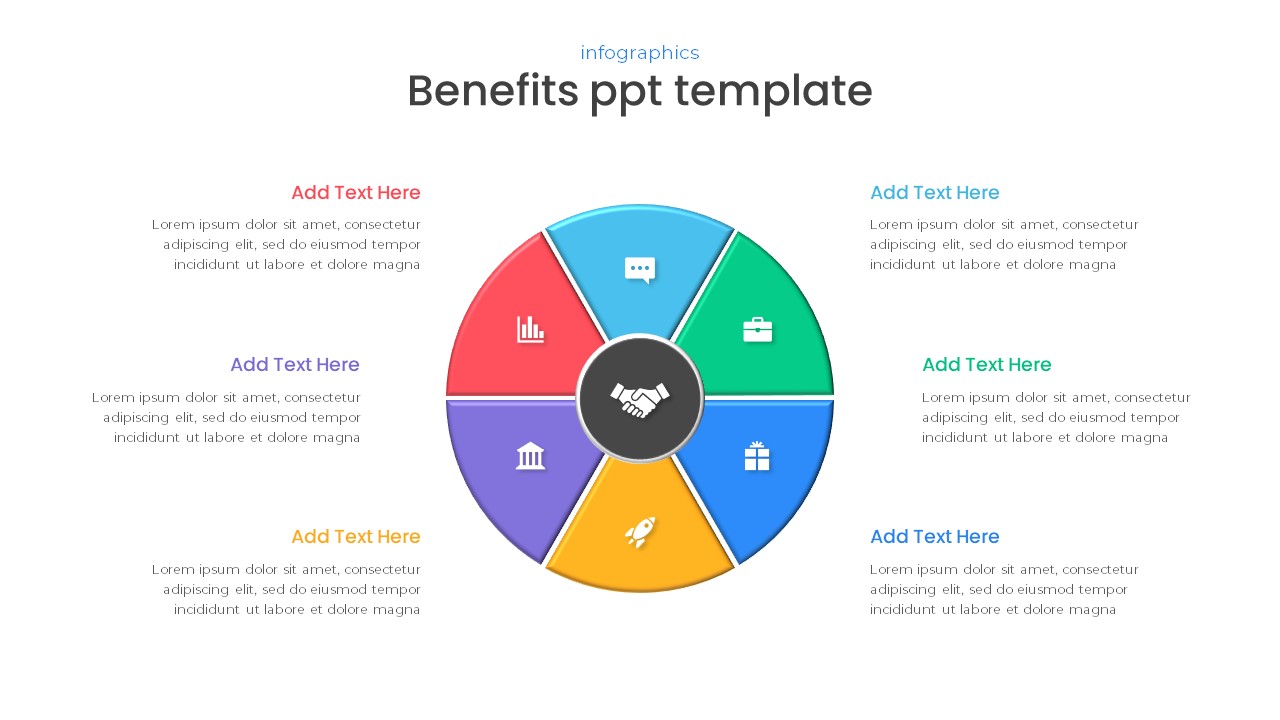
Free Six-Part Hub-and-Spoke Benefits Template for PowerPoint & Google Slides
Circular
Free
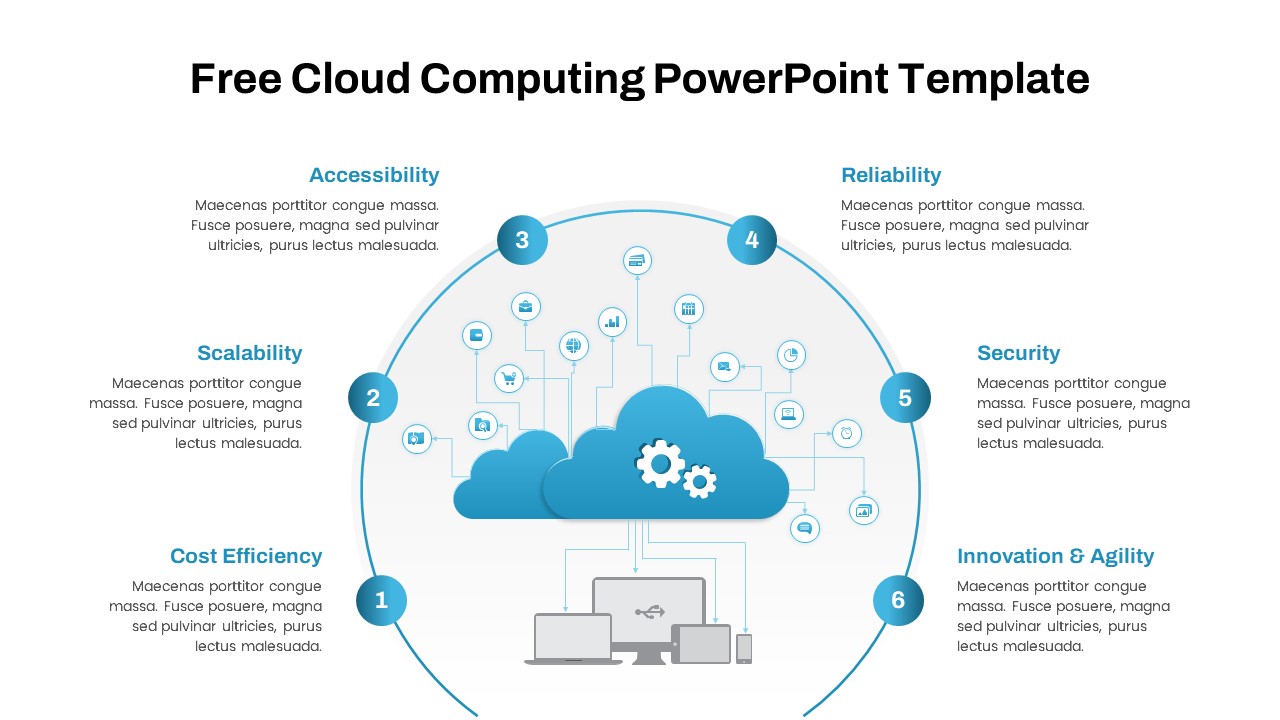
Free Cloud Computing Six-Step Circular Template for PowerPoint & Google Slides
Cloud Computing
Free
Free Choice Board Six-Option Layout Template for PowerPoint & Google Slides
Comparison
Free
Six-Item Horizontal List Infographic Template for PowerPoint & Google Slides
Process
Six-Row Multi-Column Table Presentation Template for PowerPoint & Google Slides
Table
Six Column Data Table Template for PowerPoint & Google Slides
Table
Six Step Project Workflow Template for PowerPoint & Google Slides
Project