Energy Pyramid Template to Visualize Ecosystem Energy Flow

Here is something every biology teacher knows. The moment you draw the pyramid on the board, the whole class gets it. This Energy Pyramid Template saves you the drawing and gives your students something far more polished to look at, learn from, and remember long after the lesson ends.
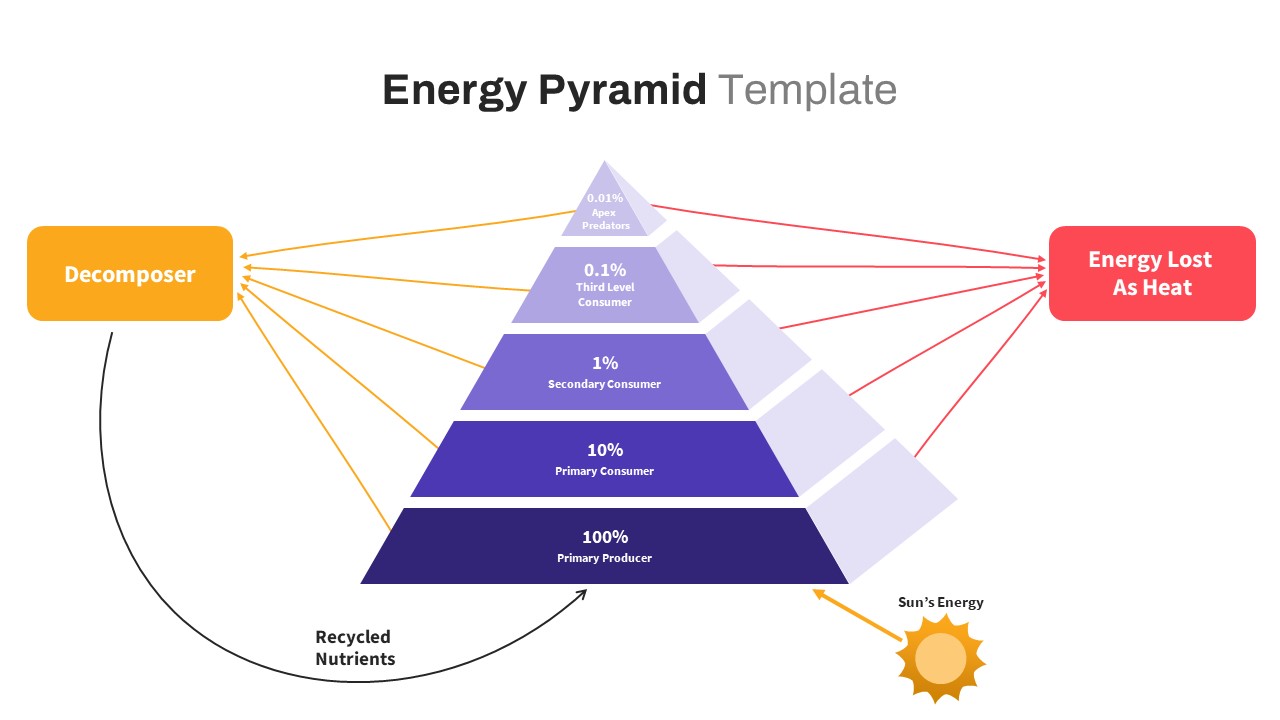
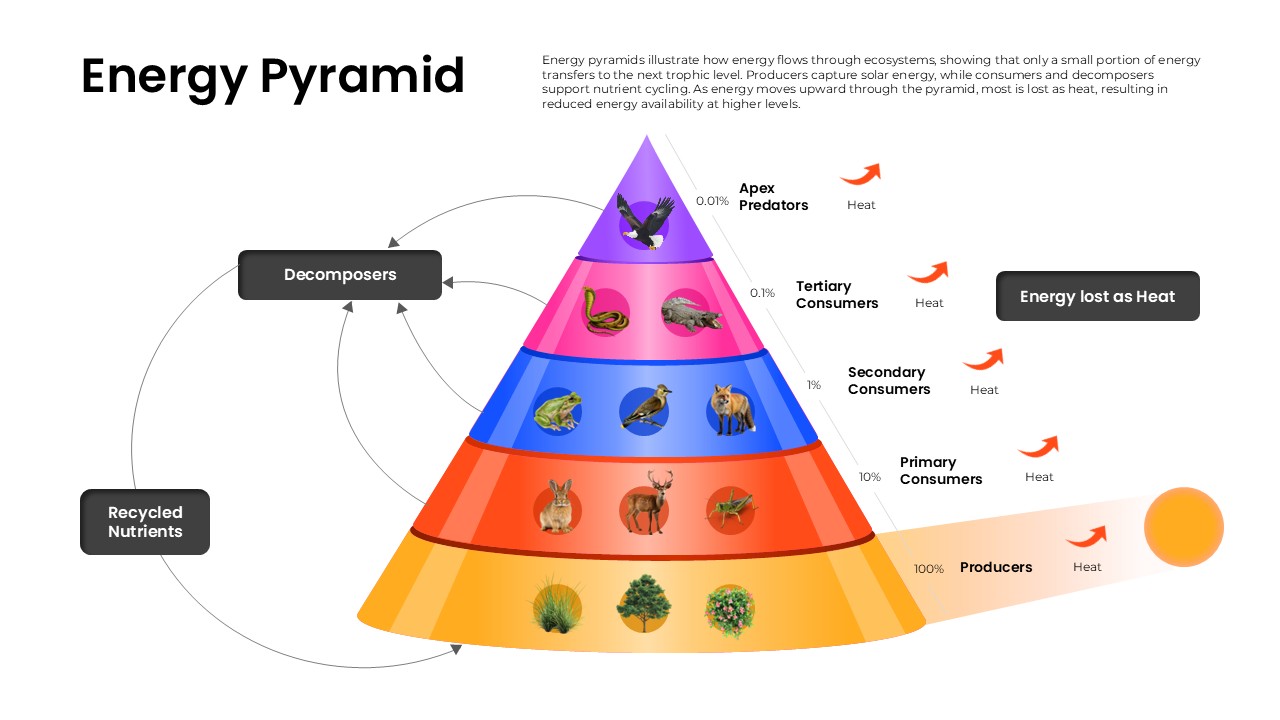
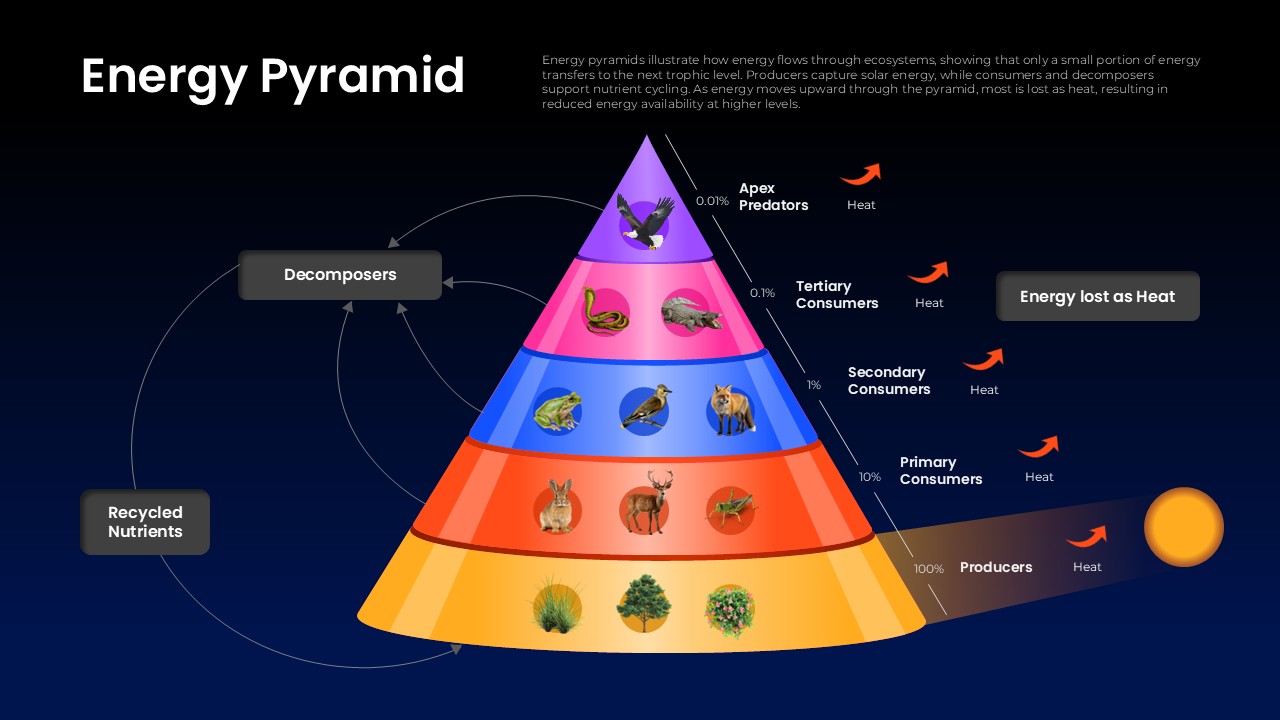
The pyramid itself is hard to miss. A wide golden base rises through five bold color-coded layers, each one narrower than the last, each one telling a precise story about how energy shrinks as it moves up the food chain. Producers anchor the bottom with 100 percent energy availability, illustrated with three plant species. As you climb, the numbers tell the real story fast.
- Primary Consumers sit at 10 percent, with rabbits, deer, and grasshoppers representing animals that feed directly on plants.
- Secondary Consumers drop to just 1 percent, with a frog, bird, and fox showing how much energy is already gone by the third level.
- Tertiary Consumers hold only 0.1 percent, illustrated by a snake and platypus.
- Apex Predators reach the tip at 0.01 percent, with an eagle representing the top of the chain where almost nothing is left.
What makes this slide genuinely useful in a classroom is everything around the pyramid, not just inside it. The heat loss arrows on the right explain energy dissipation at each transfer without needing a separate slide. The Decomposers loop on the left closes the nutrient cycle visually. The Recycled Nutrients label and circular flow path turn a single slide into a complete ecosystem story that students can read on their own.
It opens and edits without any fuss in both Microsoft PowerPoint and Google Slides. Change the species, adjust the percentages, swap the colors for a marine or desert ecosystem version, and it is ready for your next lesson, course module, or presentation without starting over. For digital classroom and remote learning presentations, browse our E-learning templates.
Frequently Asked Questions
How does an energy pyramid template work?
Does the template include energy transfer percentages?
Login to download this file

Item ID
SB05938Designed By
Naseeba Sithara
Related Templates

Free Ecological Energy Flow Pyramid Template for PowerPoint & Google Slides
Pyramid
Free
Floating Island Ecosystem Infographics Template for PowerPoint & Google Slides
Graphics
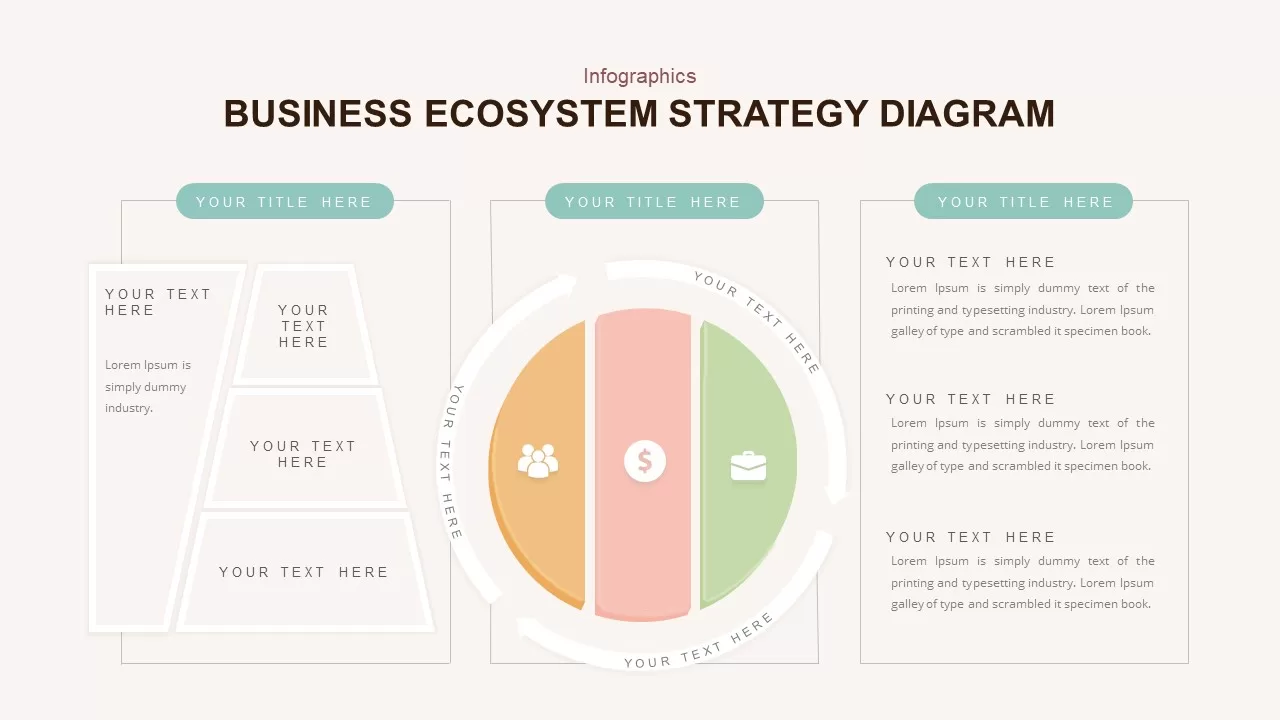
Business Ecosystem Strategy Diagram template for PowerPoint & Google Slides
Business Strategy
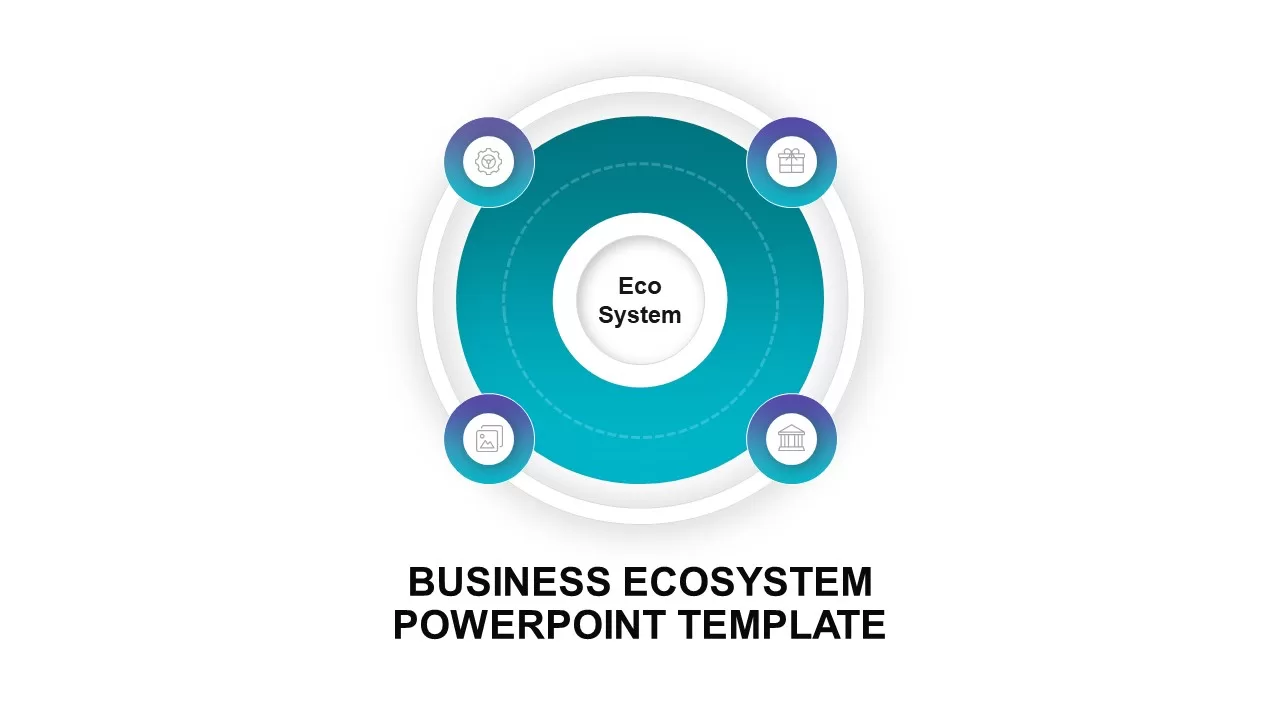
Circular Business Ecosystem Diagram Template for PowerPoint & Google Slides
Business Strategy
AI and Data Ecosystem Map Template for PowerPoint & Google Slides
AI
Digital Ecosystem Circular Model Template for PowerPoint & Google Slides
Information Technology
Renewable Energy PowerPoint Template
Graphics
Renewable Energy Landscape Illustration Template for PowerPoint & Google Slides
Graphics
Clean Renewable Energy Wind Turbine Template for PowerPoint & Google Slides
Pitch Deck
Nuclear Energy Presentation Deck Template for PowerPoint & Google Slides
Pitch Deck
Free Solar Energy Infographic Slide Template for PowerPoint & Google Slides
Circular
Free
Renewable Energy Template For PowerPoint
Pitch Deck

Renewable Energy Theme Template for PowerPoint & Google Slides
Company Profile
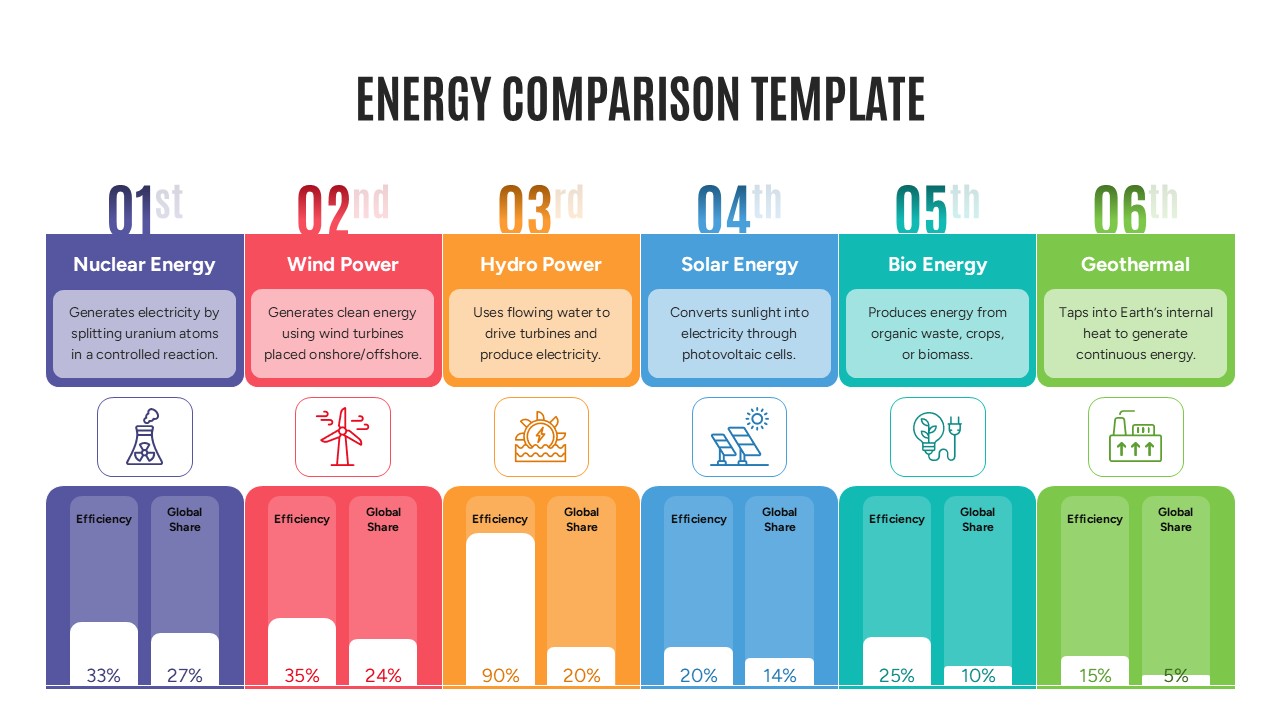
Energy Comparison Template for PowerPoint & Google Slides
Comparison
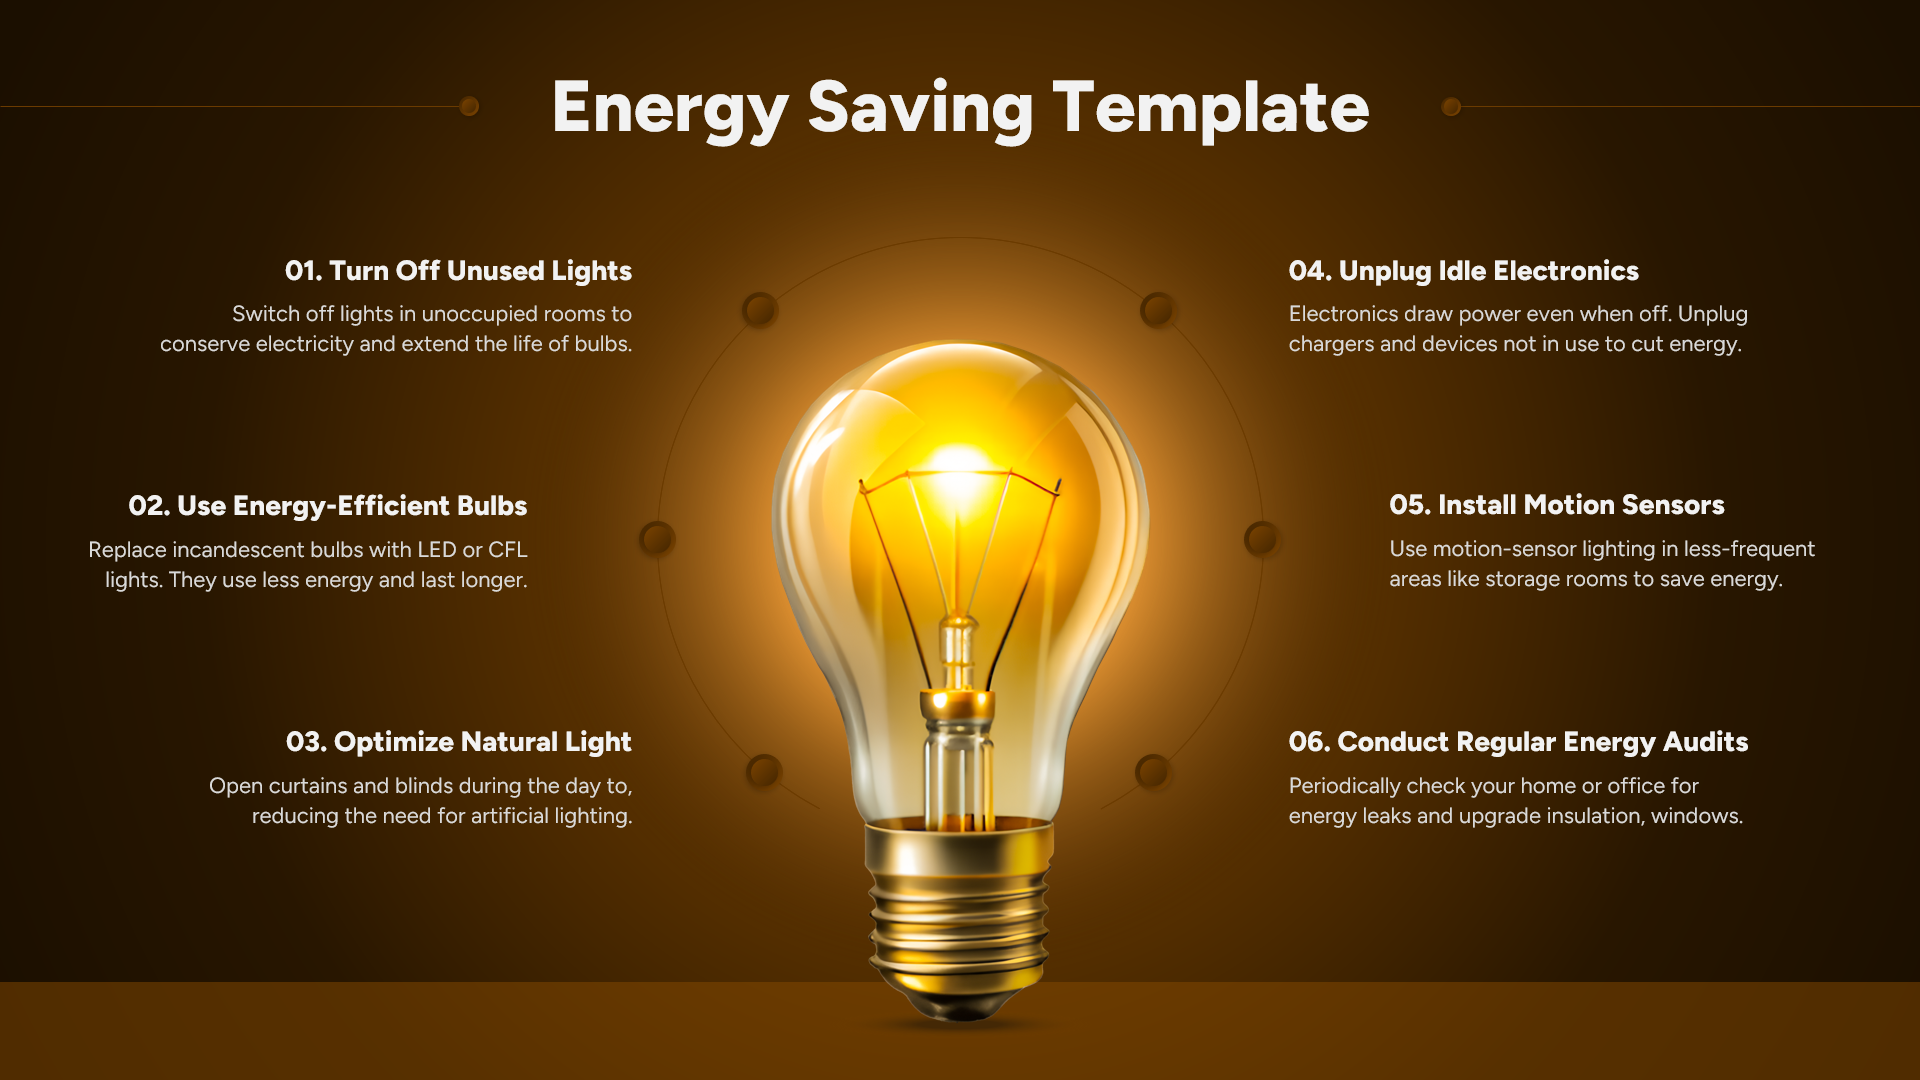
Energy Saving Tips Presentation Template for PowerPoint & Google Slides
Business Strategy

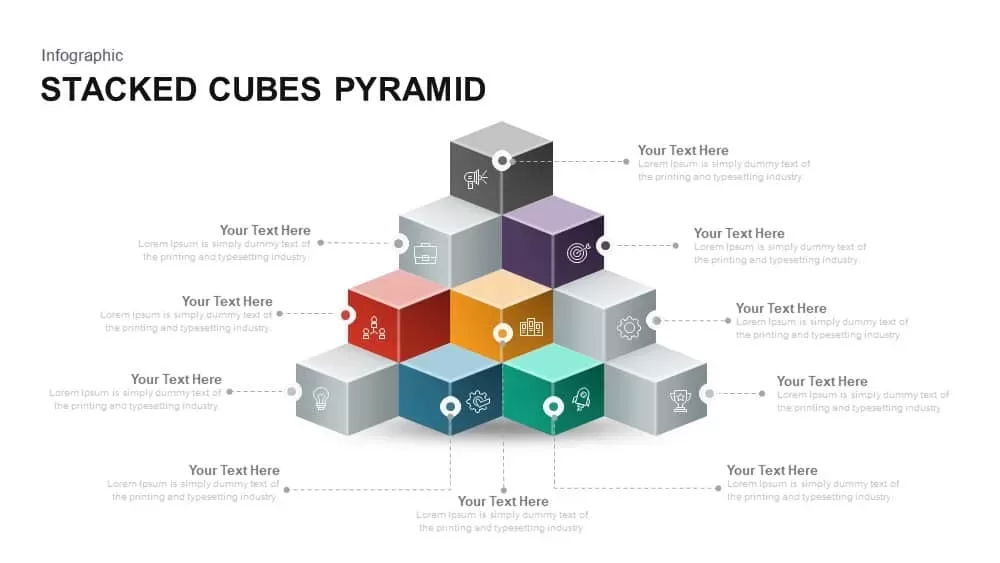
Stacked Cubes Pyramid PowerPoint Template
Pyramid
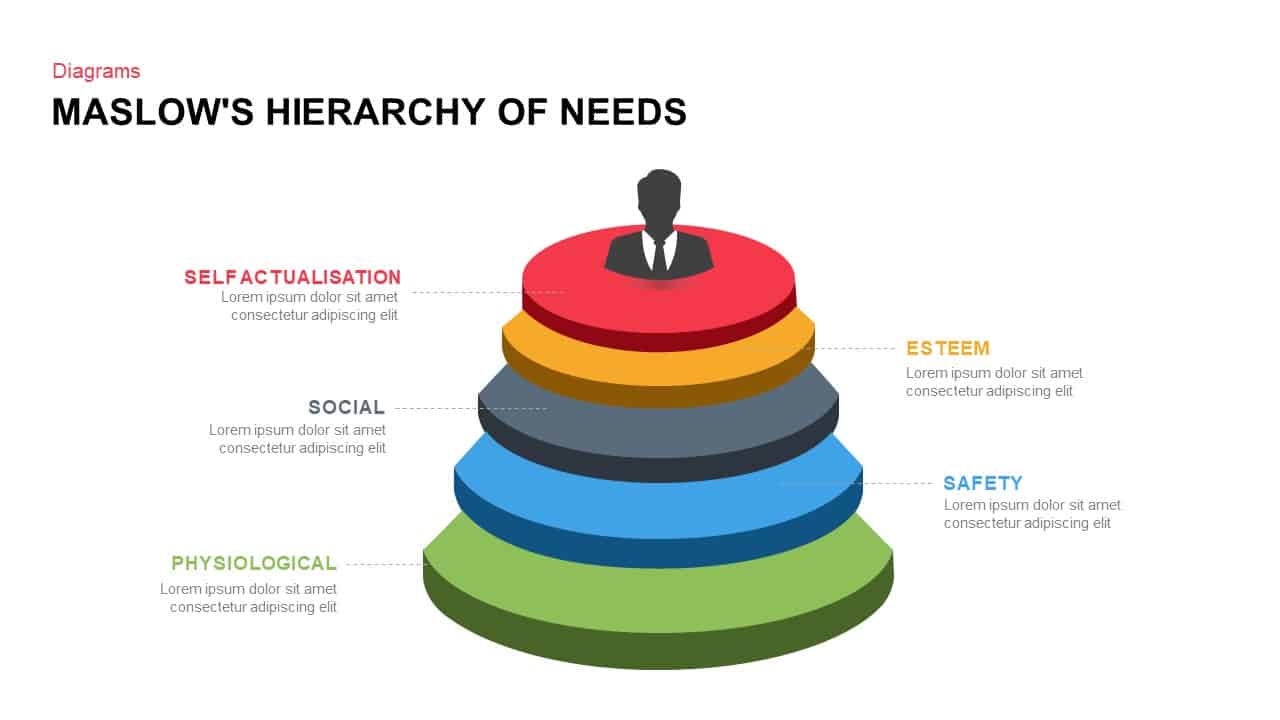
Maslow’s Hierarchy of Needs Pyramid Template for PowerPoint & Google Slides
Pyramid
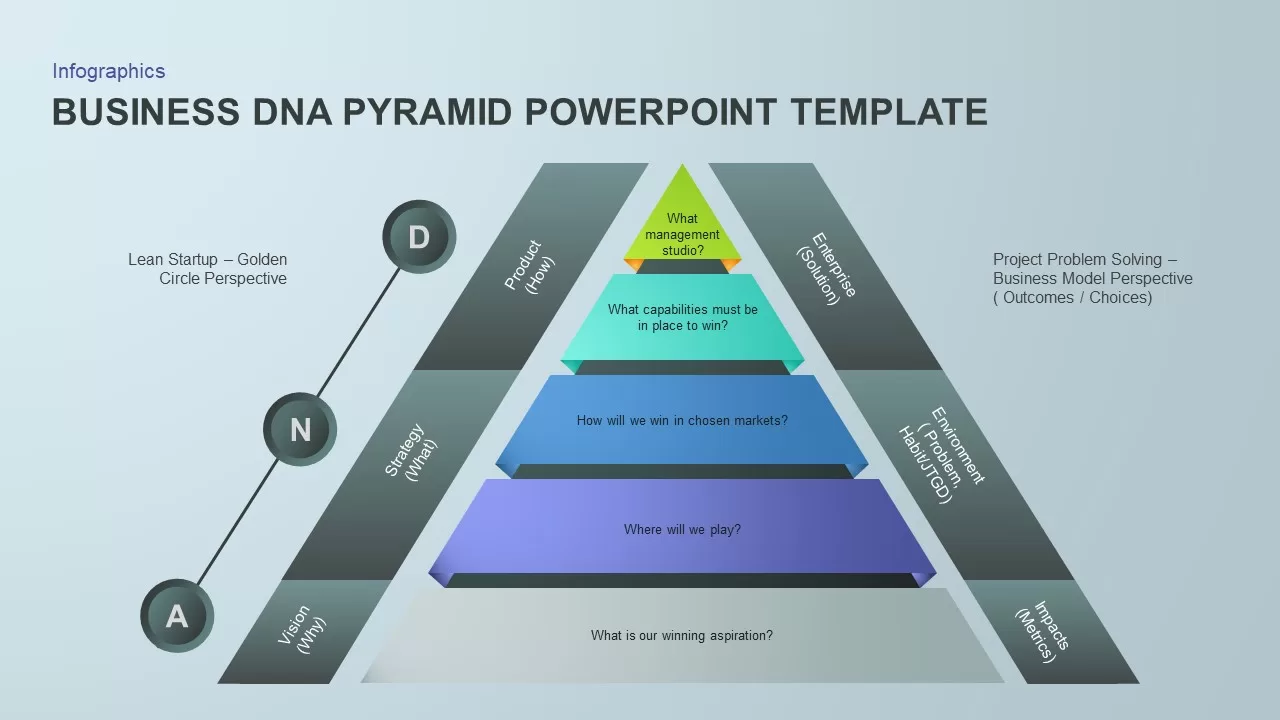
Business DNA Pyramid PowerPoint Template for PowerPoint & Google Slides
Pyramid
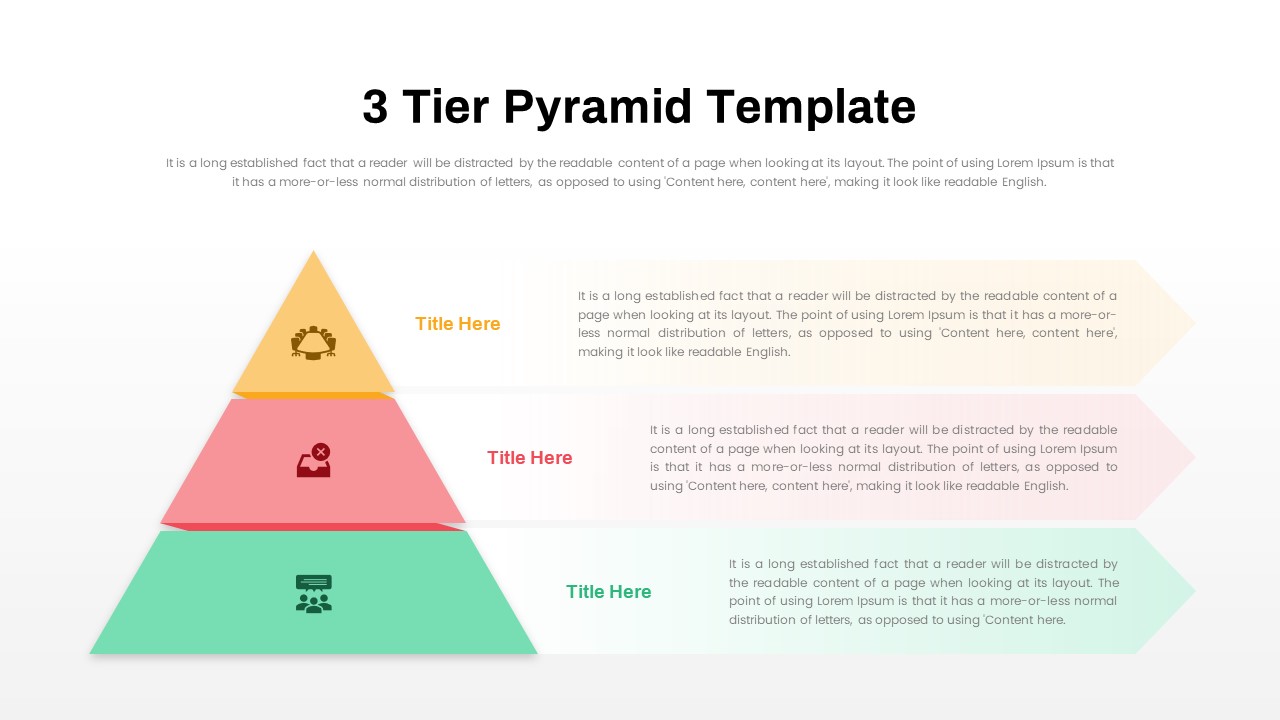
3 Tier Pyramid Template for PowerPoint & Google Slides
Pyramid
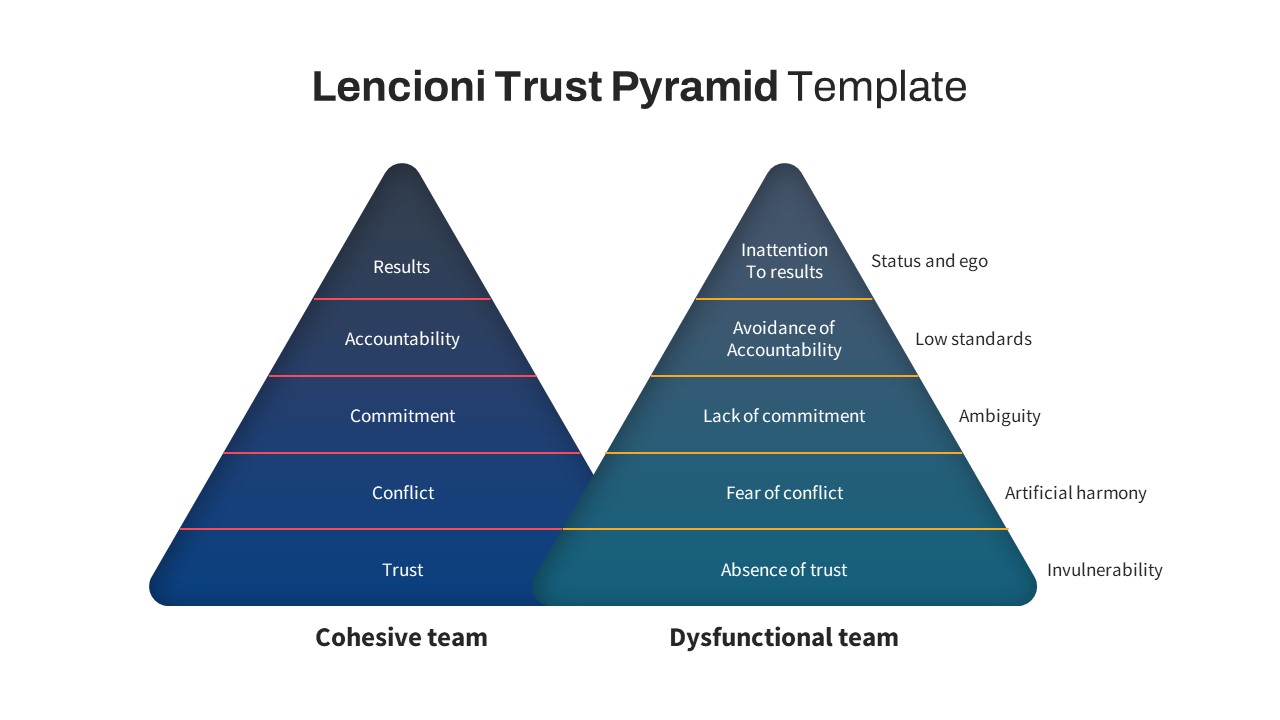
Lencioni Trust Pyramid Diagram Template for PowerPoint & Google Slides
Pyramid