search

Essentials

Must-have decks for quick wins

By Industry

Professionally tailored slides for every sector

By Style

Minimal, modern and creative designs

By Topic

Explore slides curated by purpose and theme

TimelineTimelineRoadmapRoadmapStrategyStrategyGoalsGoalsTableTableComparisonComparisonSWOTSWOTAgendaAgendaArrowArrowWorld MapWorld MapMapsMapsProcessProcessFunnelFunnelTeamTeamOrg ChartOrg ChartPyramidPyramidCircularCircular

Business PlanBusiness PlanBusiness StrategyBusiness StrategyBusiness ProposalBusiness ProposalBusiness ModelsBusiness ModelsDigital MarketingDigital MarketingMarketing FunnelMarketing FunnelCustomer ExperienceCustomer ExperienceProject StatusProject StatusGantt ChartGantt ChartRecruitmentRecruitmentEmployee PerformanceEmployee PerformanceLeadershipLeadershipAIAIMachine LearningMachine Learning

AI Presentation Maker

Install the Windows plugin for quick access to templates and design tools.

AI Infographics Maker

Use our Office 365 add - in to access templates directly from the cloud.

Exe Version

Install the Windows plugin for quick access to templates and design tools.

Office 365

Use our Office 365 add - in to access templates directly from the cloud.

Mac Version

Get the Mac plugin to easily browse, insert, and customize templates and visuals within PowerPoint.

Energy Pyramid PPT Slide for Ecosystem Energy Flow

Energy pyramid diagram illustrating producers, consumers, decomposers, nutrient recycling, and energy transfer across trophic levels.
This template is part of a deck featuring multiple slides. To check out all slides, click on See All. See All round right arrow
Colorful energy pyramid template showing trophic levels, heat loss, decomposers, and ecosystem energy distribution.

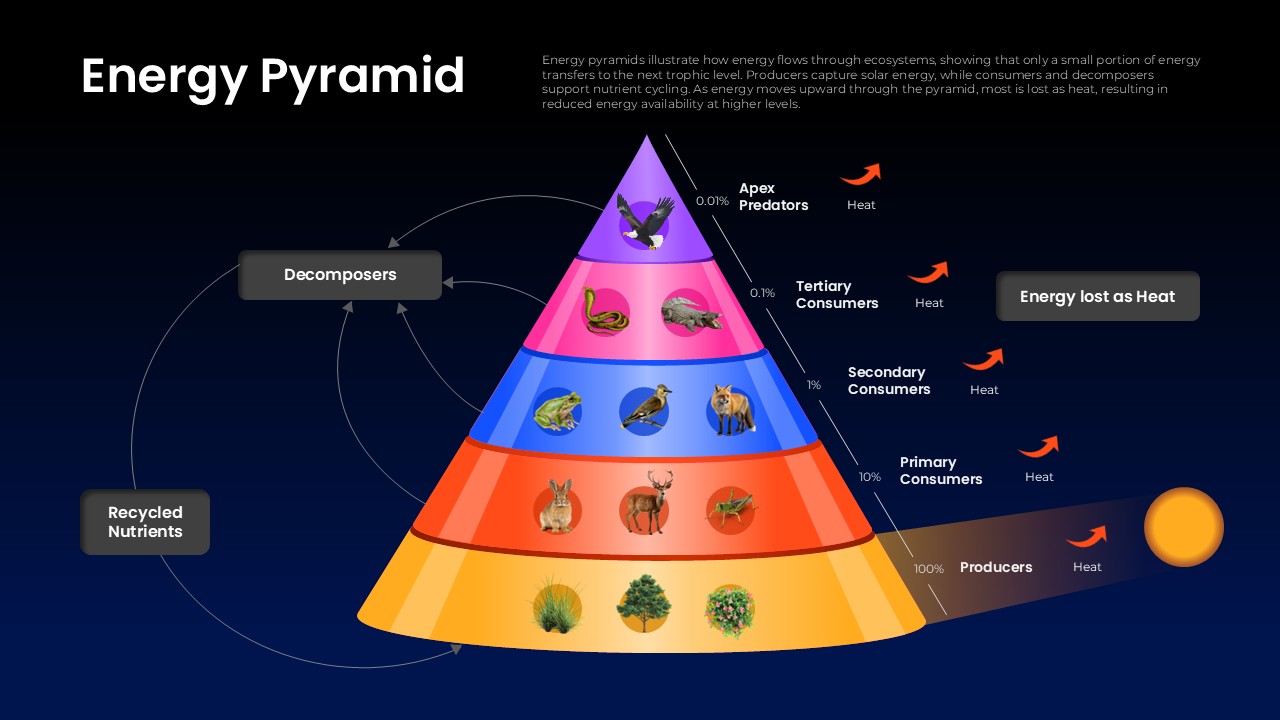
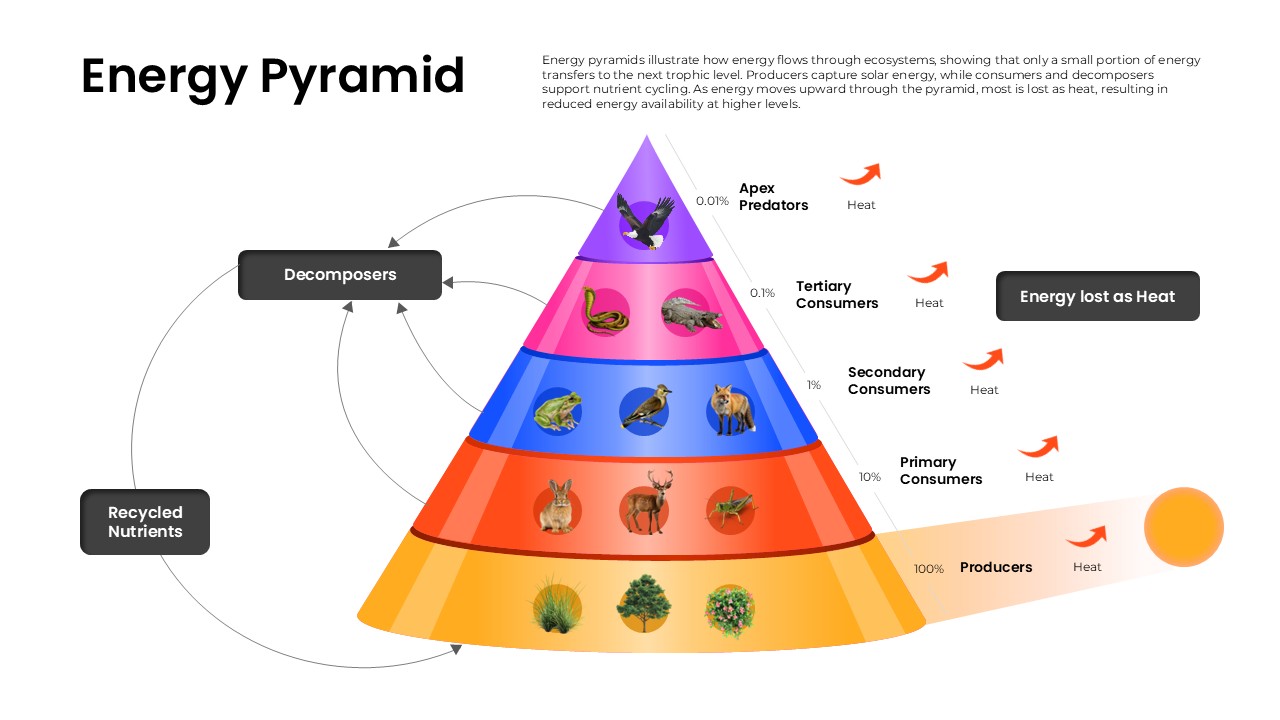
This energy pyramid PPT slide provides a clear visual representation of how energy flows through an ecosystem. The diagram highlights producers, primary consumers, secondary consumers, tertiary consumers, apex predators, and decomposers while illustrating the gradual loss of energy between trophic levels. Arrows and labels help explain nutrient recycling, heat loss, and ecological relationships within food chains and food webs. Ideal for biology lessons, environmental science presentations, ecology lectures, classroom teaching materials, and educational reports, this editable slide simplifies complex ecosystem concepts into an engaging visual format. Compatible with PowerPoint, Google Slides, and other presentation platforms, it is suitable for students, teachers, researchers, and science educators.

Login to download this file