Modern Dunning Kruger Effect Diagram Template for PowerPoint & Google Slides
Description
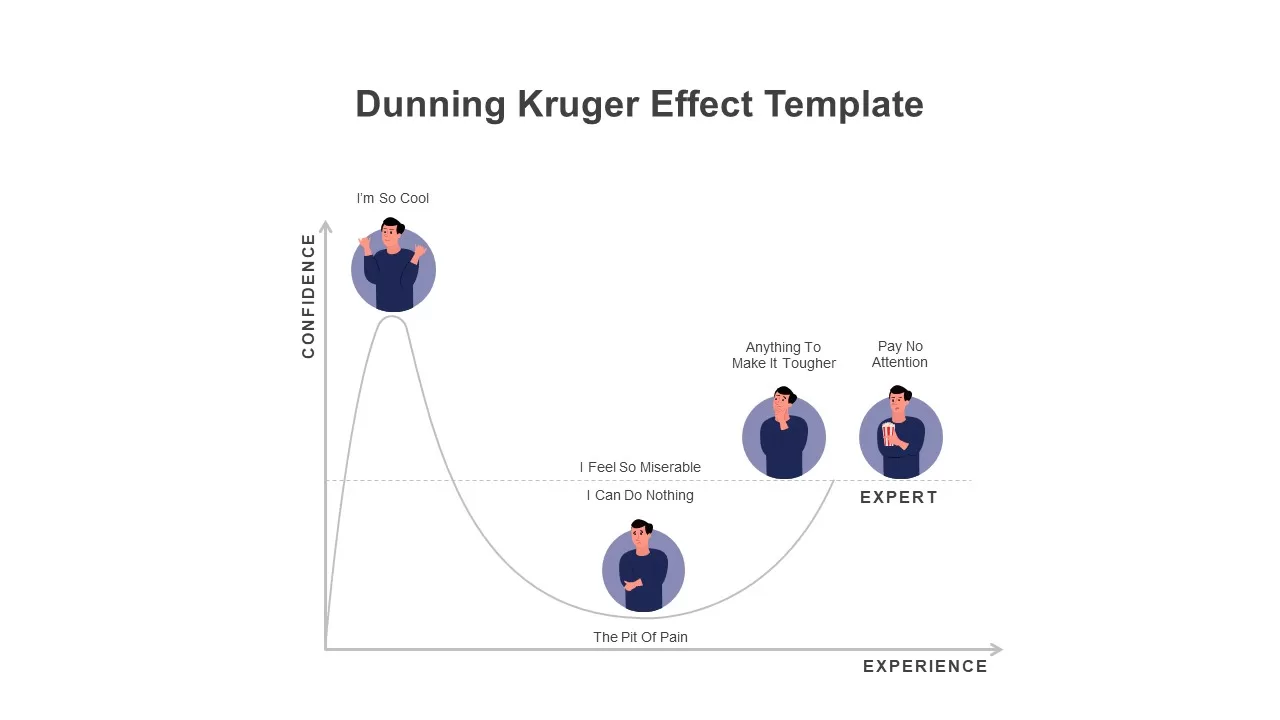
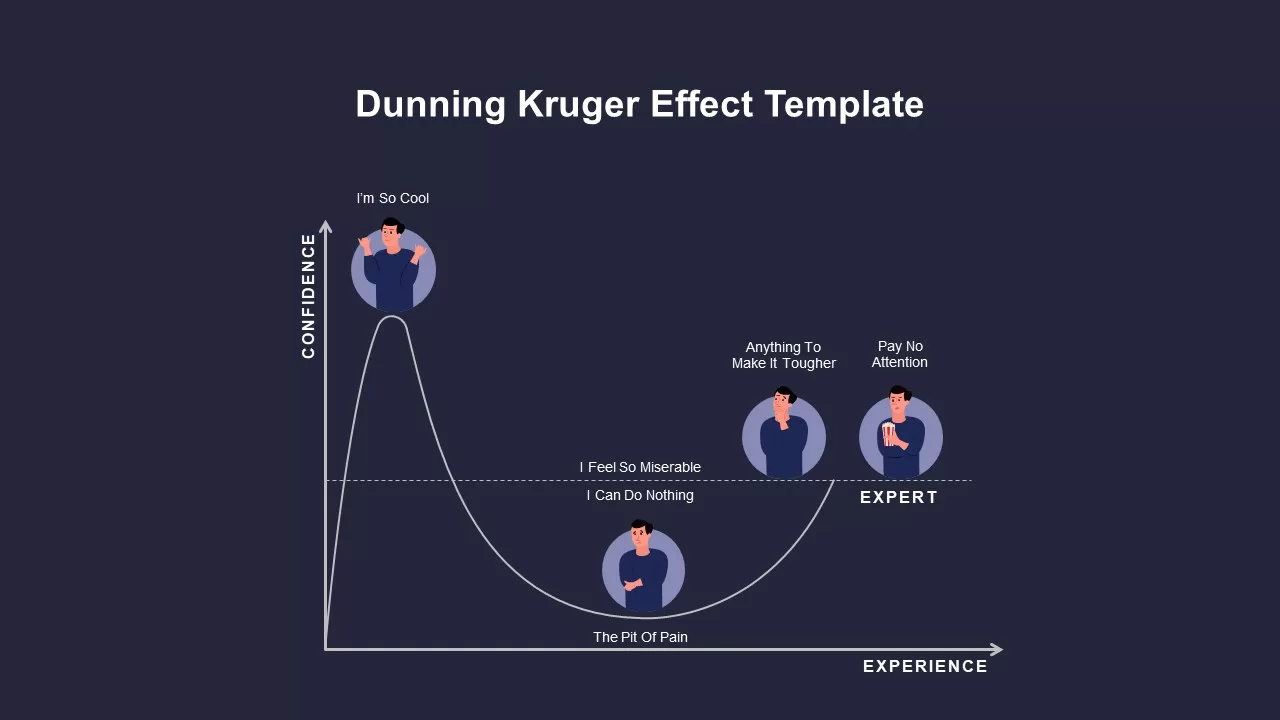
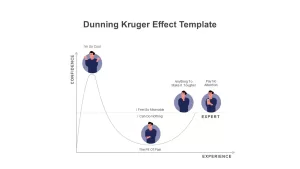
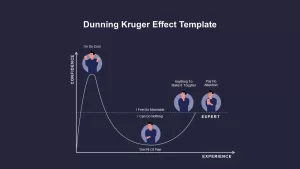
Use this Modern Dunning Kruger Effect Diagram to illustrate the relationship between confidence and experience in your presentations. This fully editable slide features a smooth, arcing curve that traces the classic Dunning-Kruger effect, with key milestones such as “I’m So Cool” at peak overconfidence, “The Pit of Pain” at deep self-doubt, and the expert plateau with clear callouts. Customizable circular markers, concise labels, and subtle annotations ensure your audience can instantly grasp the progression from initial ignorance to experienced mastery. The axes are clearly defined—confidence on the vertical axis and experience on the horizontal axis—offering a precise visual narrative of learning curves and cognitive bias.
Designed with high-resolution vector graphics and master slides, this template allows you to adjust colors, fonts, and positions with a few clicks. Swap out icons, refine text, or extend the curve to match your data story without losing clarity. Its minimalist layout, clean lines, and modern typography deliver a professional aesthetic that aligns seamlessly with corporate branding and educational content. Optimized for both PowerPoint and Google Slides, the slide maintains full fidelity across devices and platforms, eliminating formatting issues and reducing preparation time.
The vector-based design supports easy color theming, while placeholder text blocks and scalable shapes ensure seamless customization. Use master slide layouts to maintain consistency and accelerate slide deck creation. The neutral color scheme can be swapped out for brand-specific palettes, and the slide’s high-contrast elements guarantee readability in any lighting environment.
Ideal for leadership workshops, team training, and academic lectures, this asset guides viewers through the psychological stages of competence. Whether you’re explaining cognitive biases, mapping skill development, or setting realistic learning objectives, the Modern Dunning Kruger Effect Diagram enhances audience engagement and retention.
Who is it for
Presenters, trainers, and educators in leadership development, human resources, and organizational psychology can leverage this slide to demonstrate cognitive bias and learning progression. Business consultants, team managers, and executive coaches will benefit when designing training modules, workshops, and strategic briefings. Academic instructors and students in psychology and management programs will find this diagram invaluable for illustrating competence models.
Other Uses
Beyond illustrating the Dunning Kruger effect, this slide can track product adoption curves, visualize project maturity stages, compare performance metrics over time, or depict onboarding and certification pathways. It also serves as a versatile tool for mapping customer journey touchpoints, highlighting skill development roadmaps, and framing self-assessment exercises in training sessions.
Login to download this file

Item ID
SB02157
Related Templates

Cause and Effect Diagram Infographic Template for PowerPoint & Google Slides
Bar/Column

Fishbone Diagram Cause-and-Effect Template for PowerPoint & Google Slides
Process
Fishbone Cause and Effect Diagram Template for PowerPoint & Google Slides
Process
Five-Input Cause and Effect Diagram Template for PowerPoint & Google Slides
Arrow
Underwater Fishbone Cause-Effect Diagram Template for PowerPoint & Google Slides
Process
Snowball Effect Process Diagram Template for PowerPoint & Google Slides
Process
5Cs of Network Effect Circular Diagram Template for PowerPoint & Google Slides
Circular
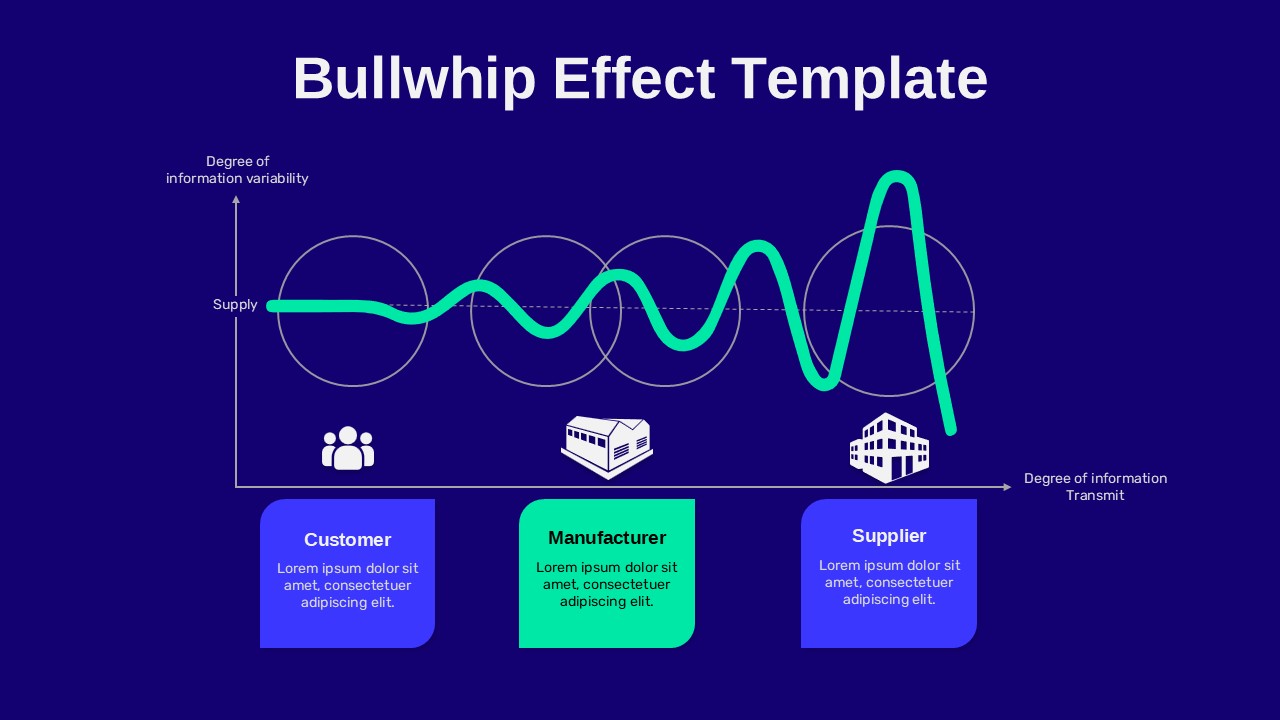
Bullwhip Effect Supply Chain Variability Diagram Template for PowerPoint & Google Slides
Business Models
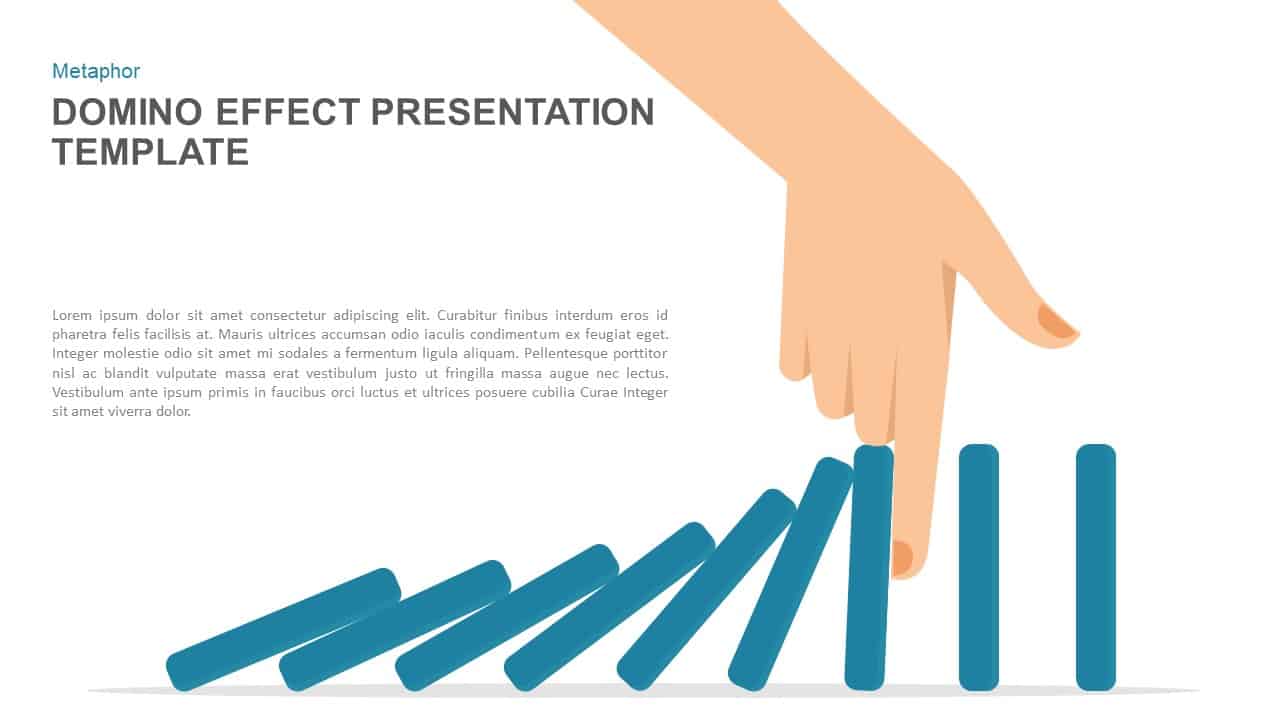
Domino Effect Prevention Presentation Template for PowerPoint & Google Slides
Process
Fishbone Cause and Effect Infographic Template for PowerPoint & Google Slides
Infographics
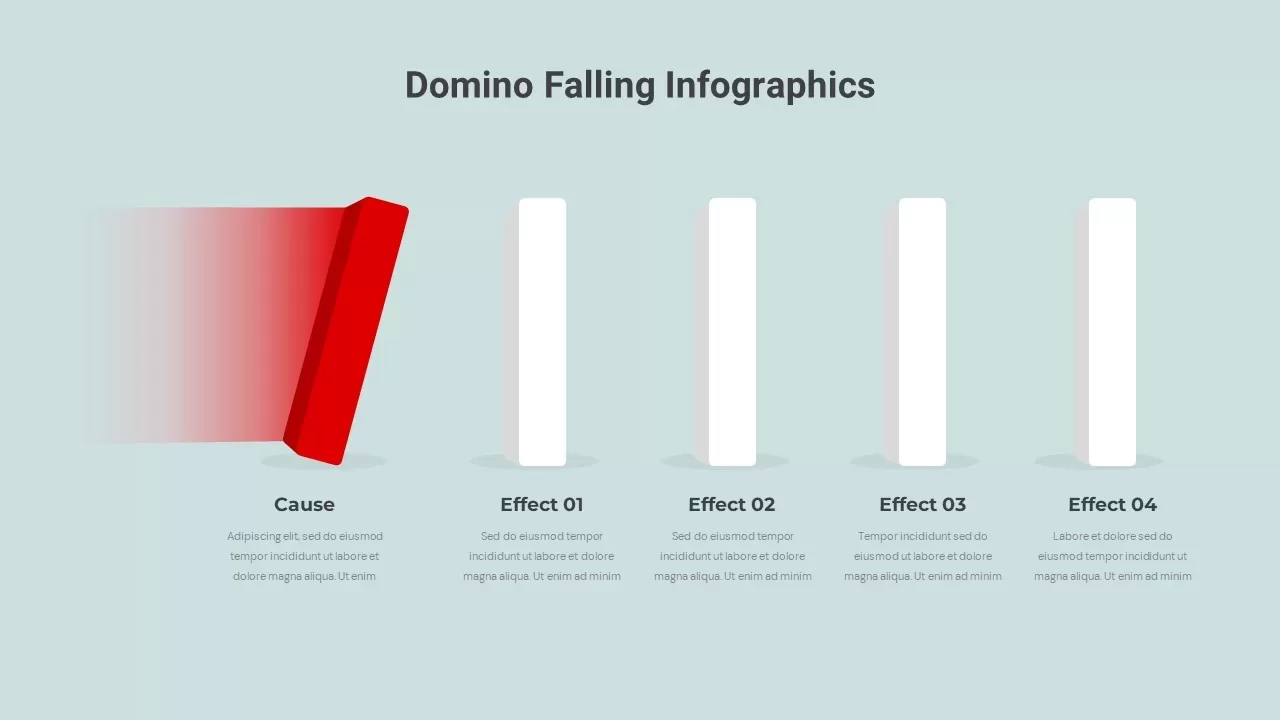
Domino Effect Sequential Infographics Template for PowerPoint & Google Slides
Process
Modern Circle SWOT Analysis Diagram Template for PowerPoint & Google Slides
SWOT
Modern Nine Circle Network Diagram Template for PowerPoint & Google Slides
Circular
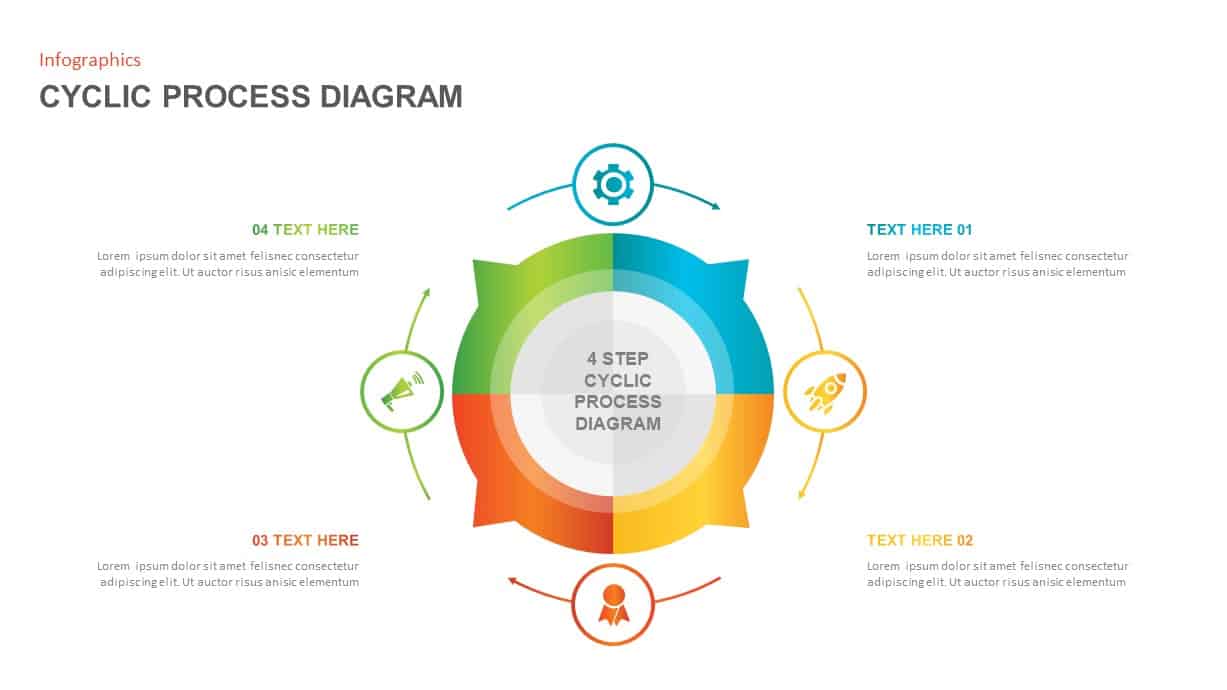
Modern 4-Step Cyclic Process Diagram Template for PowerPoint & Google Slides
Circular
Modern 3D Layer Section Diagram Template for PowerPoint & Google Slides
Circular

Modern Communication Process Diagram Template for PowerPoint & Google Slides
Process

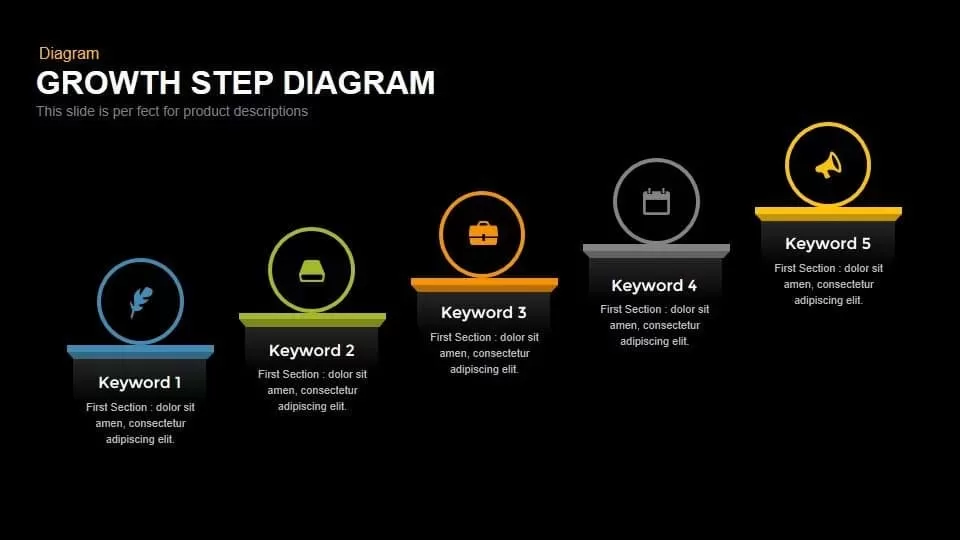
Modern Five-Step Growth Diagram Template for PowerPoint & Google Slides
Process
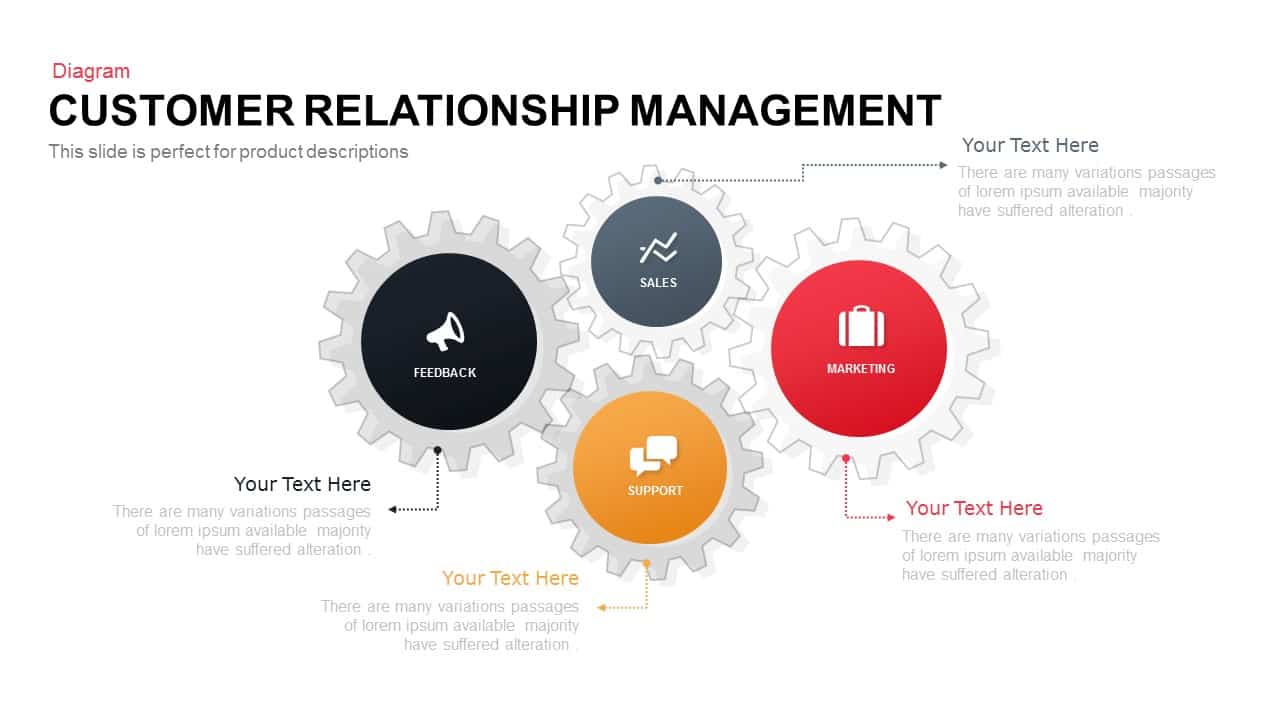
Colorful Modern CRM Gear Diagram Template for PowerPoint & Google Slides
Customer Experience
Modern Five-Stage Cycle Process Diagram Template for PowerPoint & Google Slides
Process
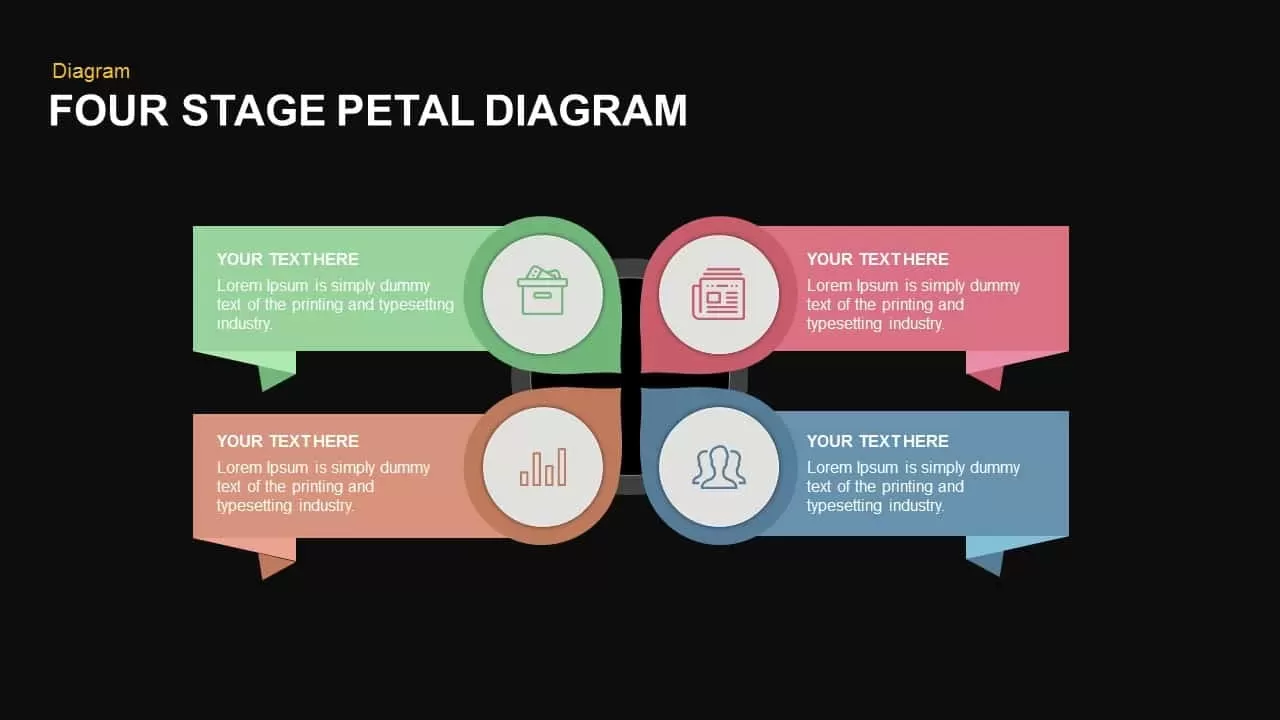
Modern Four-Stage Petal Diagram Template for PowerPoint & Google Slides
Circular
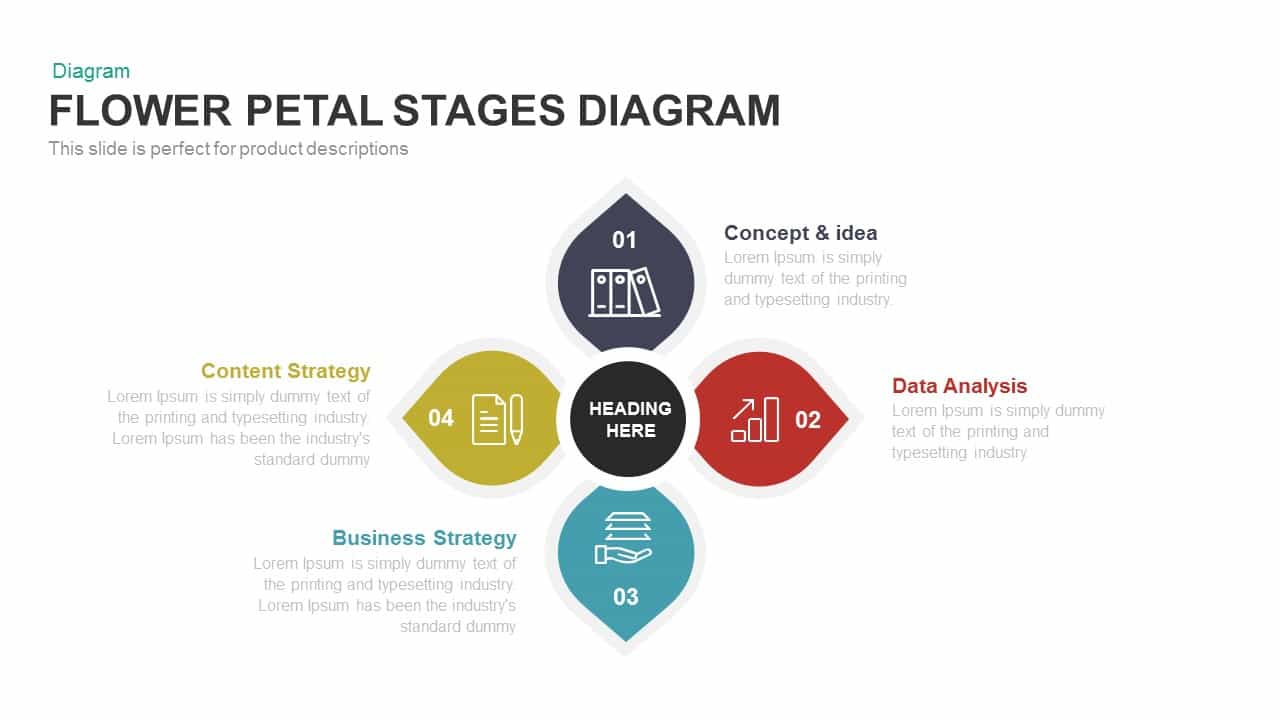
Modern Flower Petal Stages Diagram Template for PowerPoint & Google Slides
Circular
Modern Multi-Section Circle Diagram Template for PowerPoint & Google Slides
Circular

Modern Four Stage Gear Diagram Template for PowerPoint & Google Slides
Process
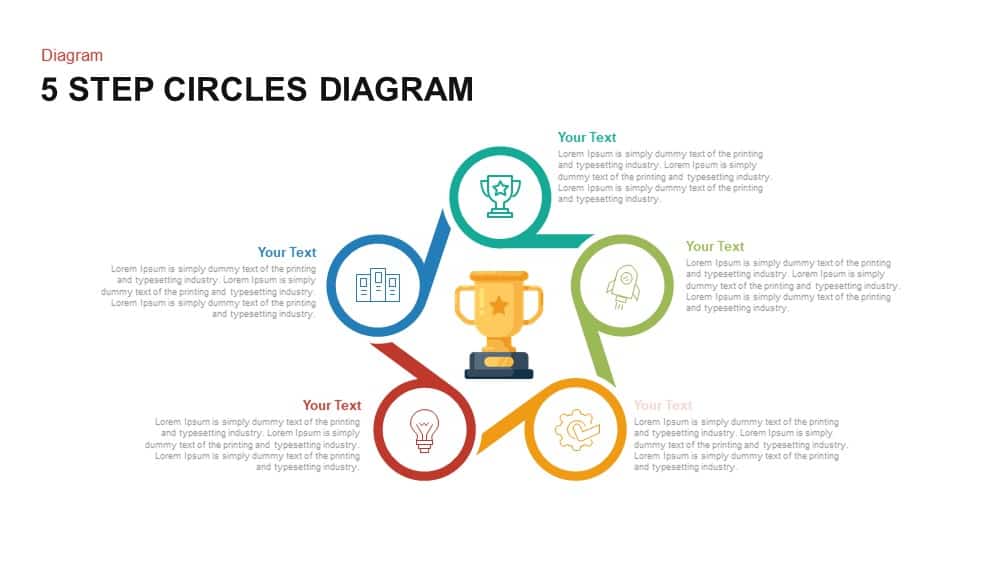
Modern Five-Step Circles Process Diagram Template for PowerPoint & Google Slides
Circular
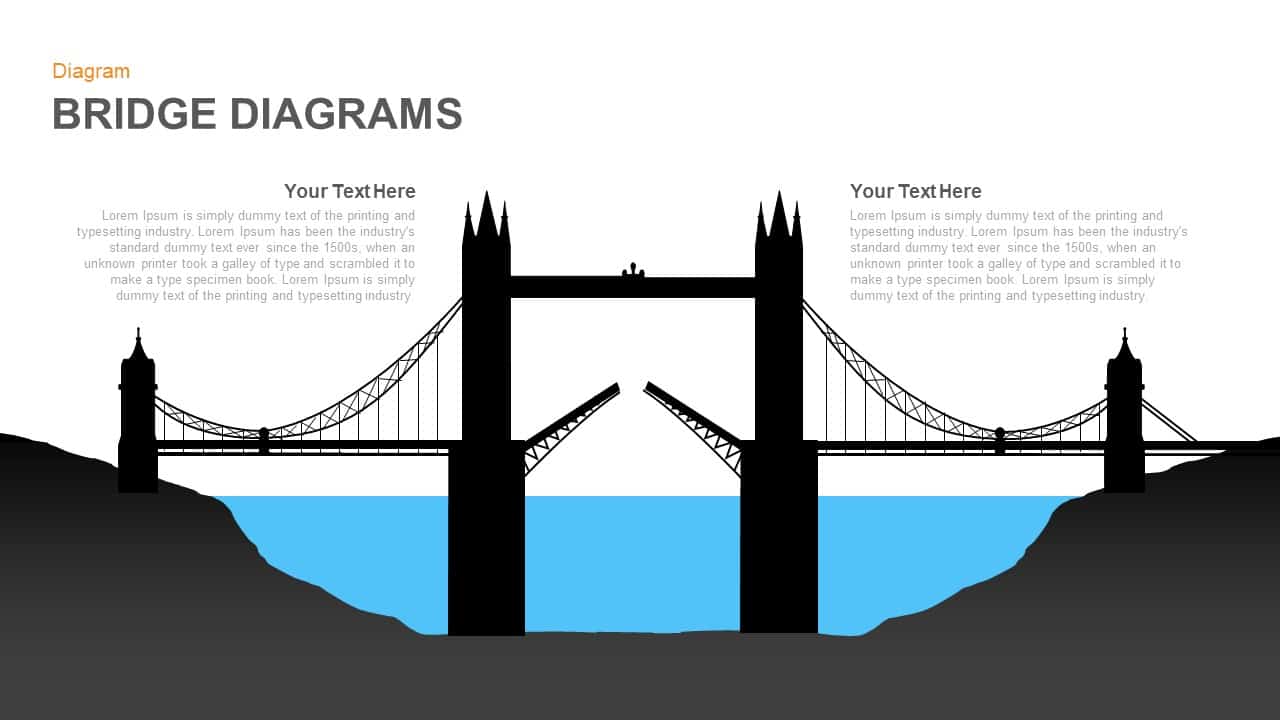
Modern Bridge Diagram Slide Design Template for PowerPoint & Google Slides
Process
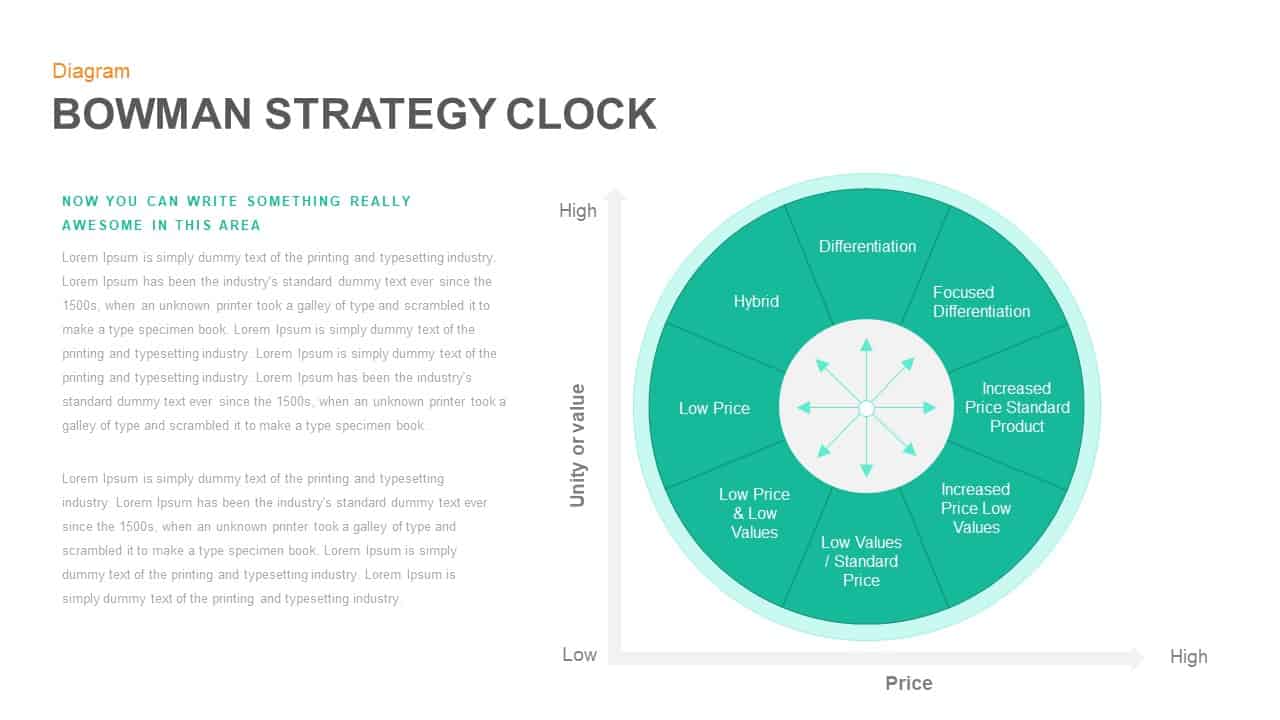
Modern Bowman Strategy Clock Diagram Slide Template for PowerPoint & Google Slides
Competitor Analysis
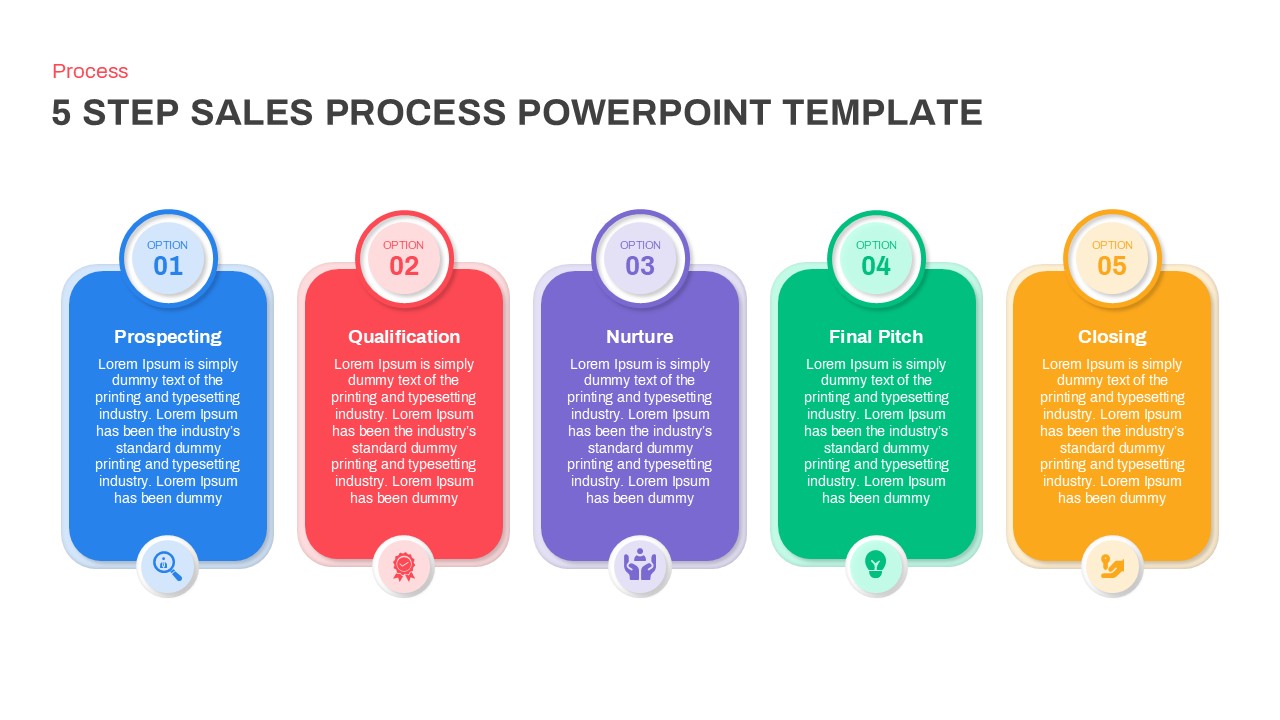
Modern 5-Step Sales Process Diagram Template for PowerPoint & Google Slides
Process
Modern Gear Venn Diagram Infographic Template for PowerPoint & Google Slides
Comparison

Modern 6-Step Cycle Diagram Slide Deck Template for PowerPoint & Google Slides
Process
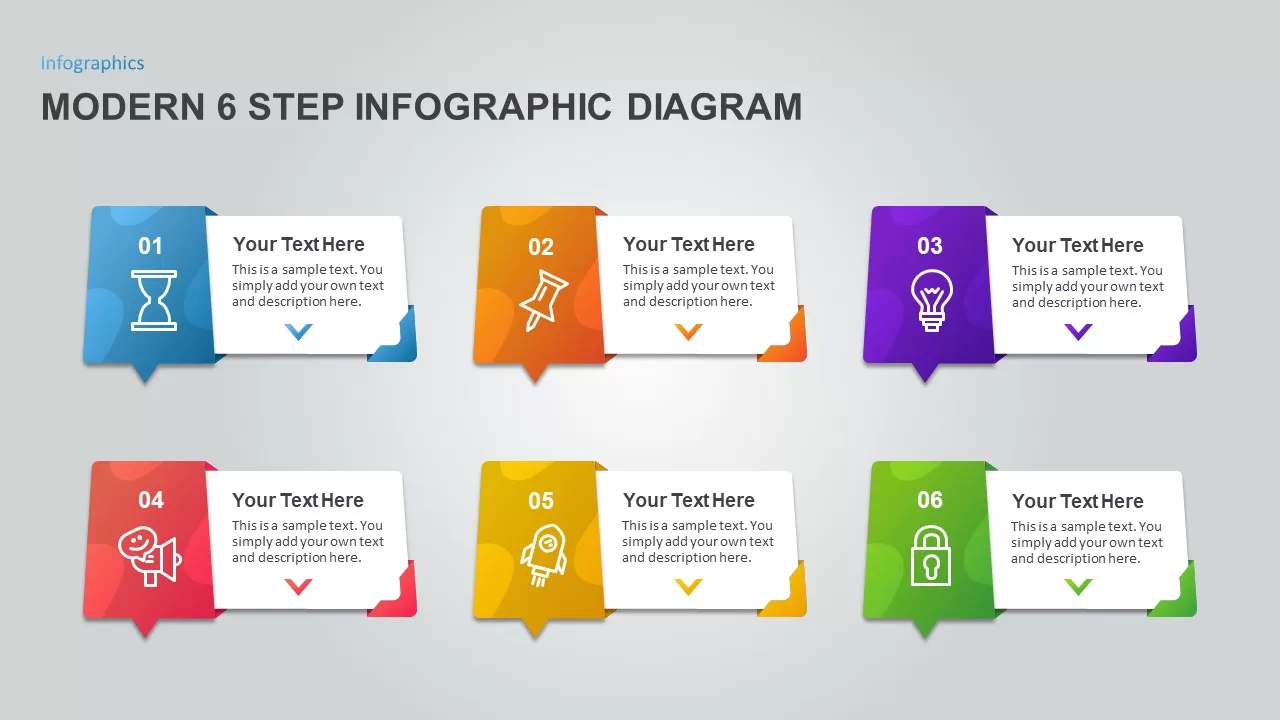
Modern 6 Step Infographic Diagram template for PowerPoint & Google Slides
Process
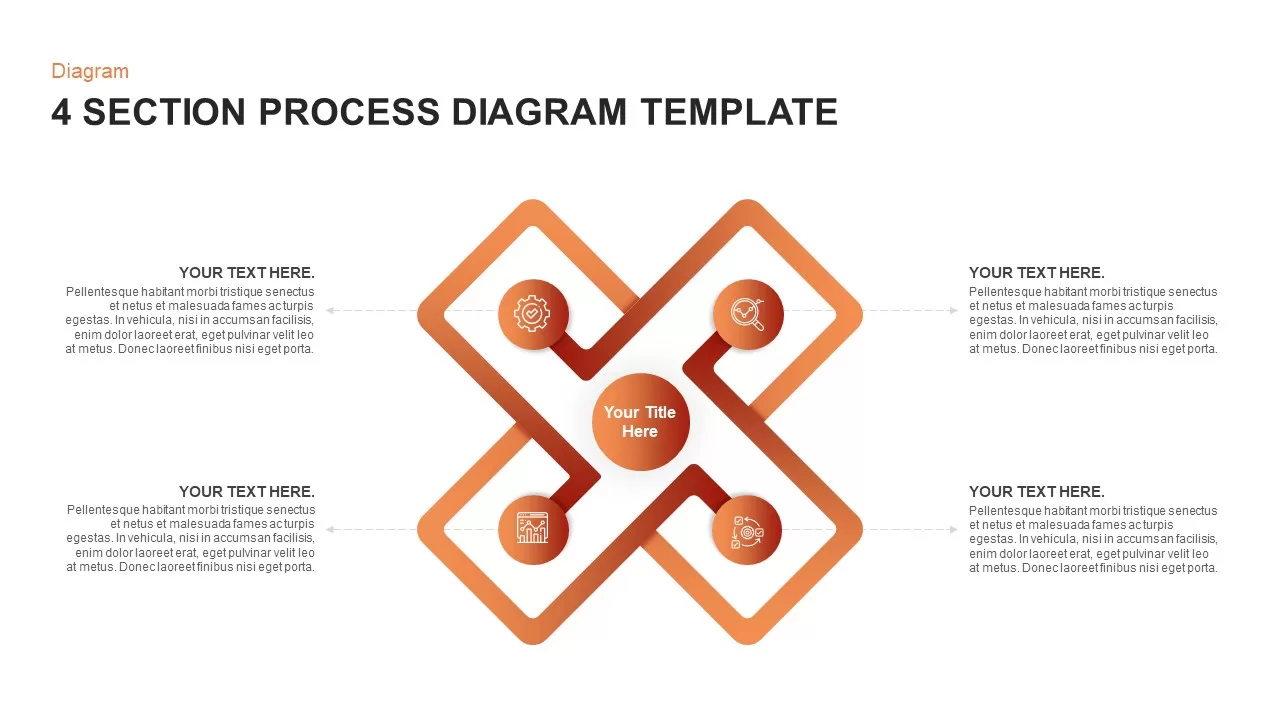
Modern 4 Section Process Diagram Template for PowerPoint & Google Slides
Process
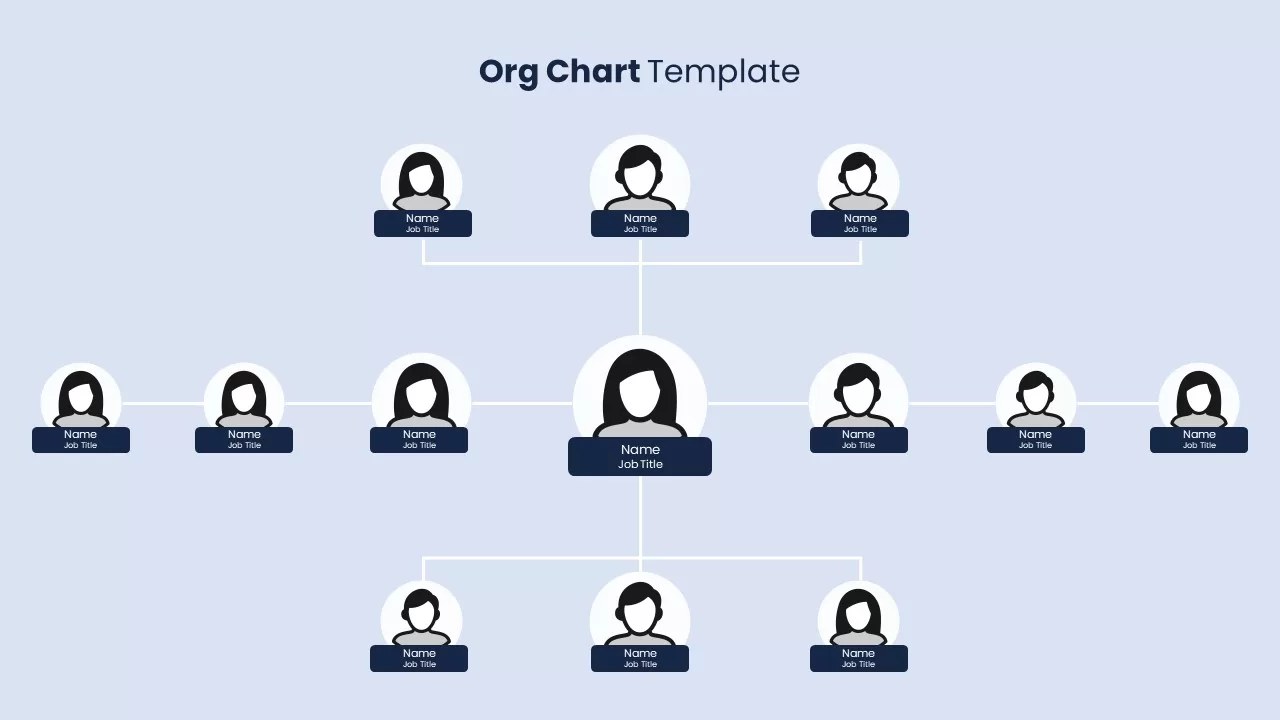
Modern Organizational Hierarchy Diagram Template for PowerPoint & Google Slides
Org Chart
Modern Chess Infographic Diagram Template for PowerPoint & Google Slides
Comparison
Modern Four-Level Pyramid Diagram Template for PowerPoint & Google Slides
Pyramid
Modern Seven-Step 3D Prism Diagram Template for PowerPoint & Google Slides
Process
Modern Multi-Color Polar Chart Diagram Template for PowerPoint & Google Slides
Charts
Modern Growth Hacking Venn Diagram Template for PowerPoint & Google Slides
Circular
Modern Three-Point Process Diagram Template for PowerPoint & Google Slides
Process
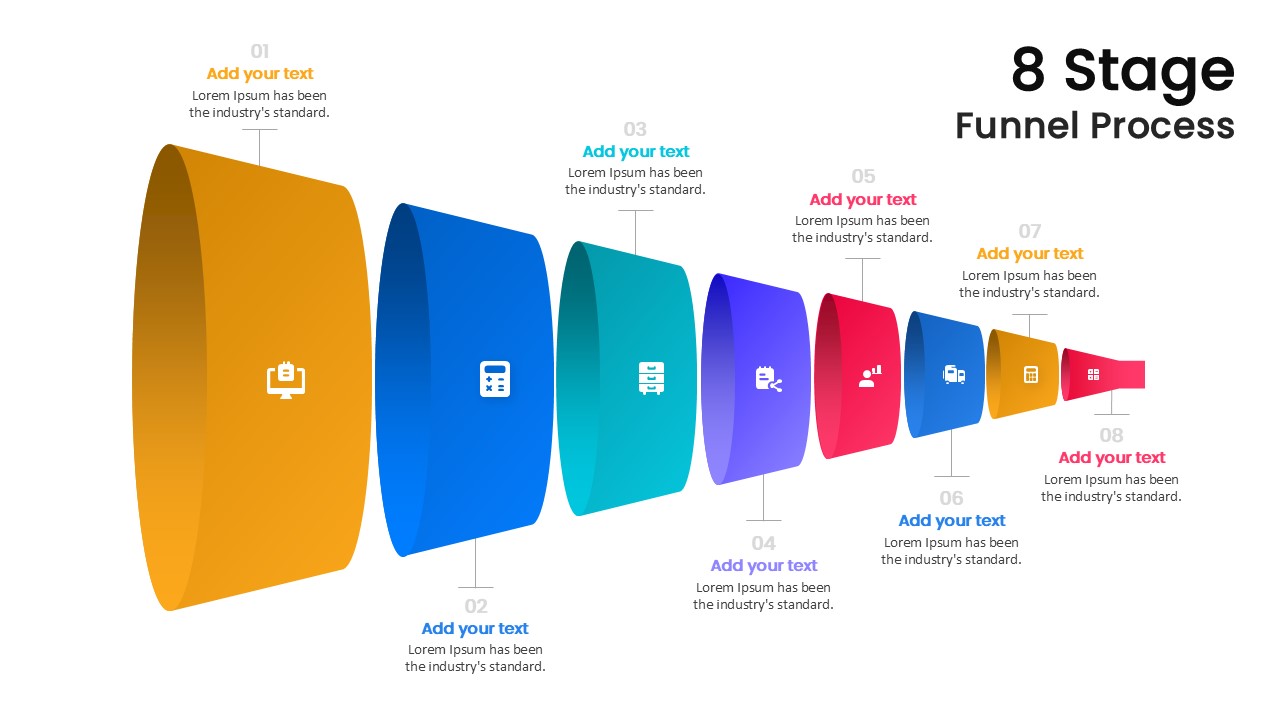
Modern 8-Stage Funnel Process Diagram Template for PowerPoint & Google Slides
Funnel
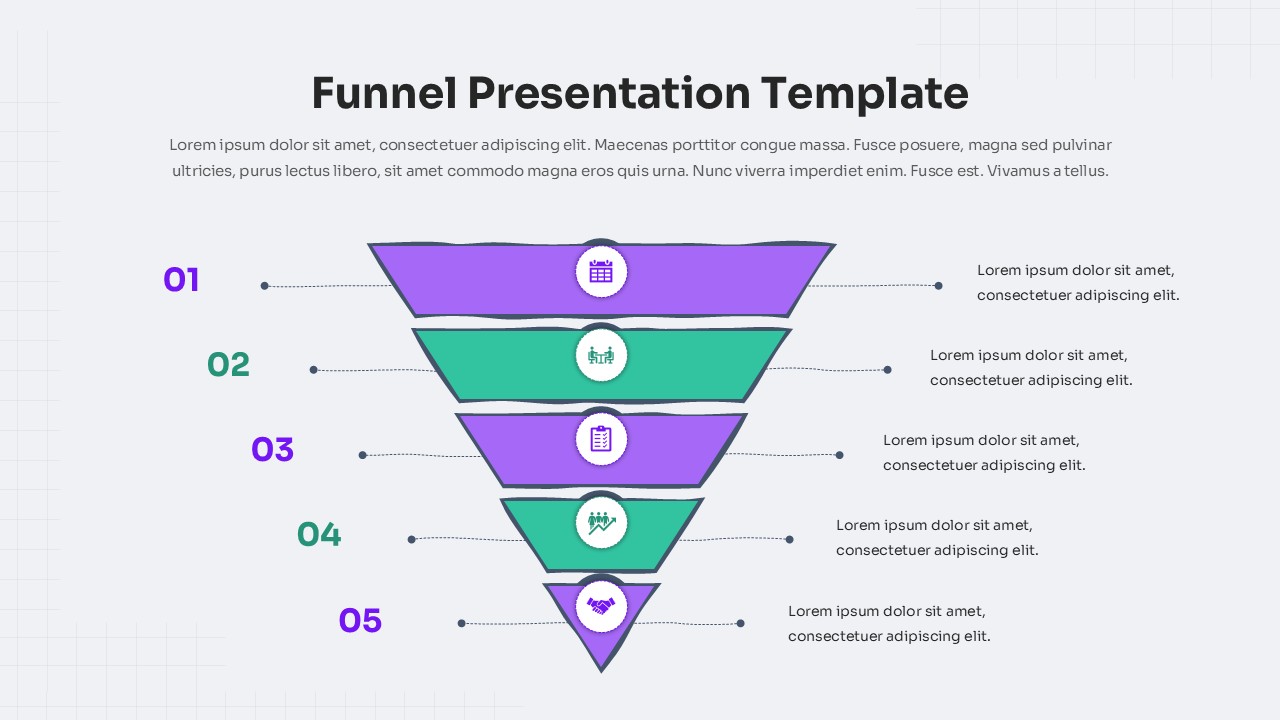
Five-Step Modern Funnel Diagram Template for PowerPoint & Google Slides
Funnel

Free Modern Gradient Wave Welcome Slides Template for PowerPoint & Google Slides
Free
Free

Modern Business Agency PowerPoint Template for PowerPoint & Google Slides
Company Profile
Modern Business Speech Slide Design Template for PowerPoint & Google Slides
Business
Modern Ten-Block Section Title Chart template for PowerPoint & Google Slides
Comparison
Modern Customer Acquisition Strategy Template for PowerPoint & Google Slides
Customer Journey
Modern Recruiting Process Cover Slide Template for PowerPoint & Google Slides
Pitch Deck
Modern Colorful Circular Org Chart Template for PowerPoint & Google Slides
Org Chart
Modern 5-Stage Folder Agenda Layout Template for PowerPoint & Google Slides
Agenda
Modern Noise Analysis Infographic Template for PowerPoint & Google Slides
Process
Modern Work Relationship Cover Slide Template for PowerPoint & Google Slides
HR
Modern Galerio Company Profile Deck template for PowerPoint & Google Slides
Company Profile
Modern Isometric Company Profile Template for PowerPoint & Google Slides
Company Profile
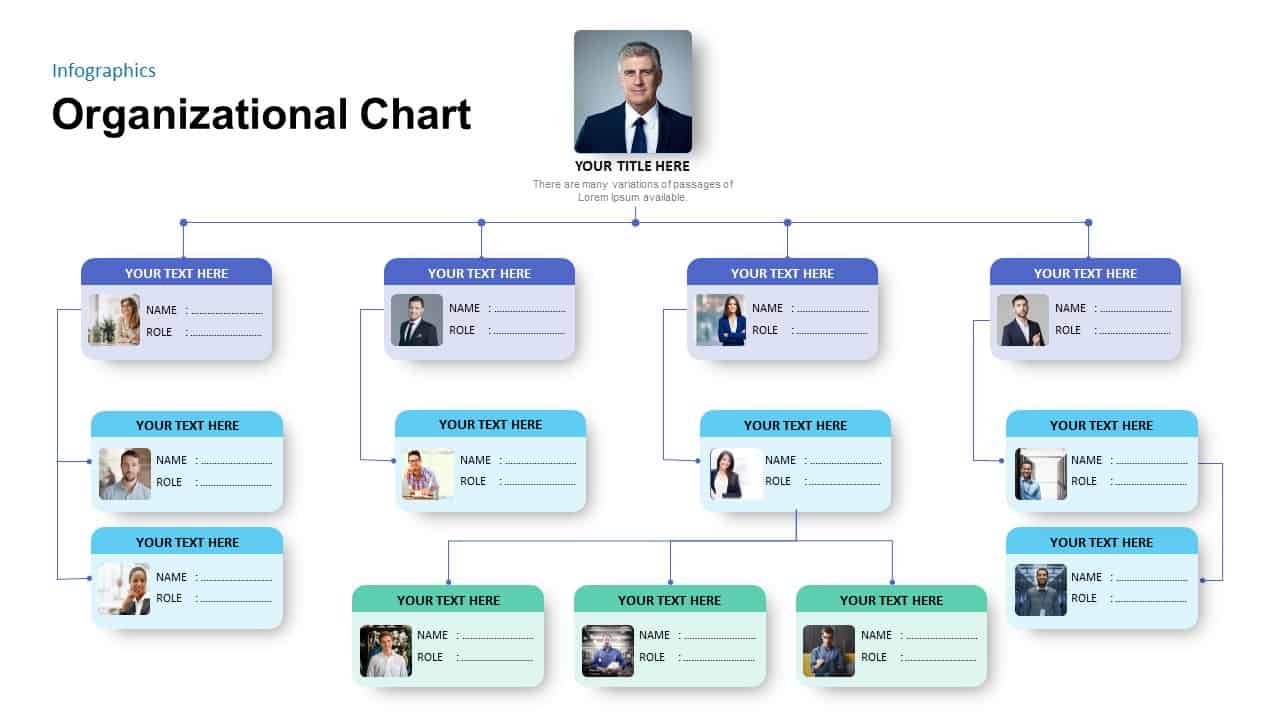
Modern Organizational Chart Hierarchy Template for PowerPoint & Google Slides
Org Chart
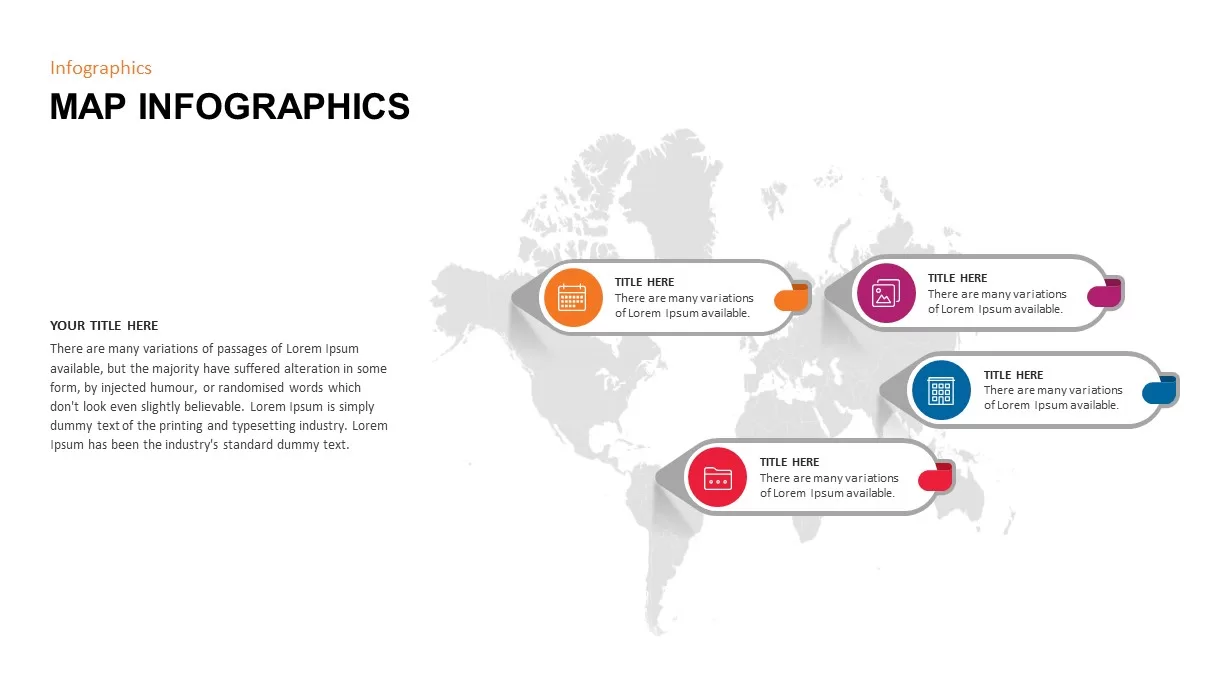
Modern World Map Callout Infographic Template for PowerPoint & Google Slides
World Maps
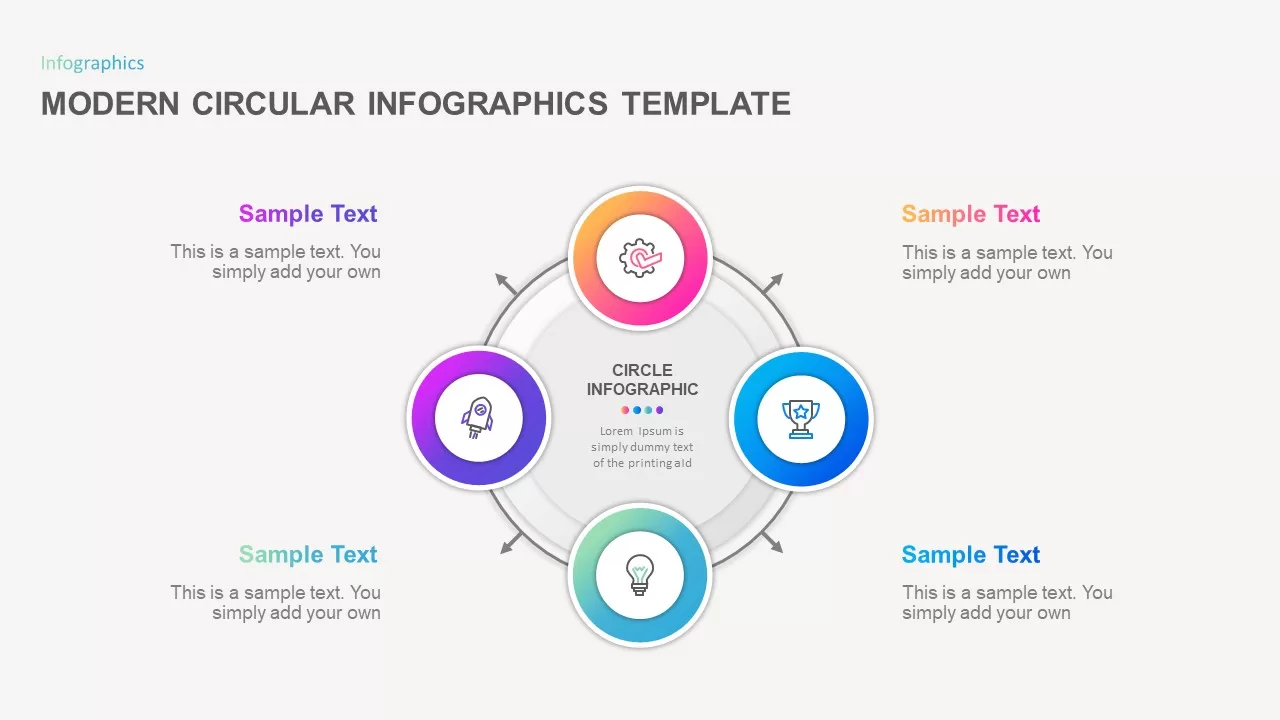
Modern Circular Infographics Template for PowerPoint & Google Slides
Circular
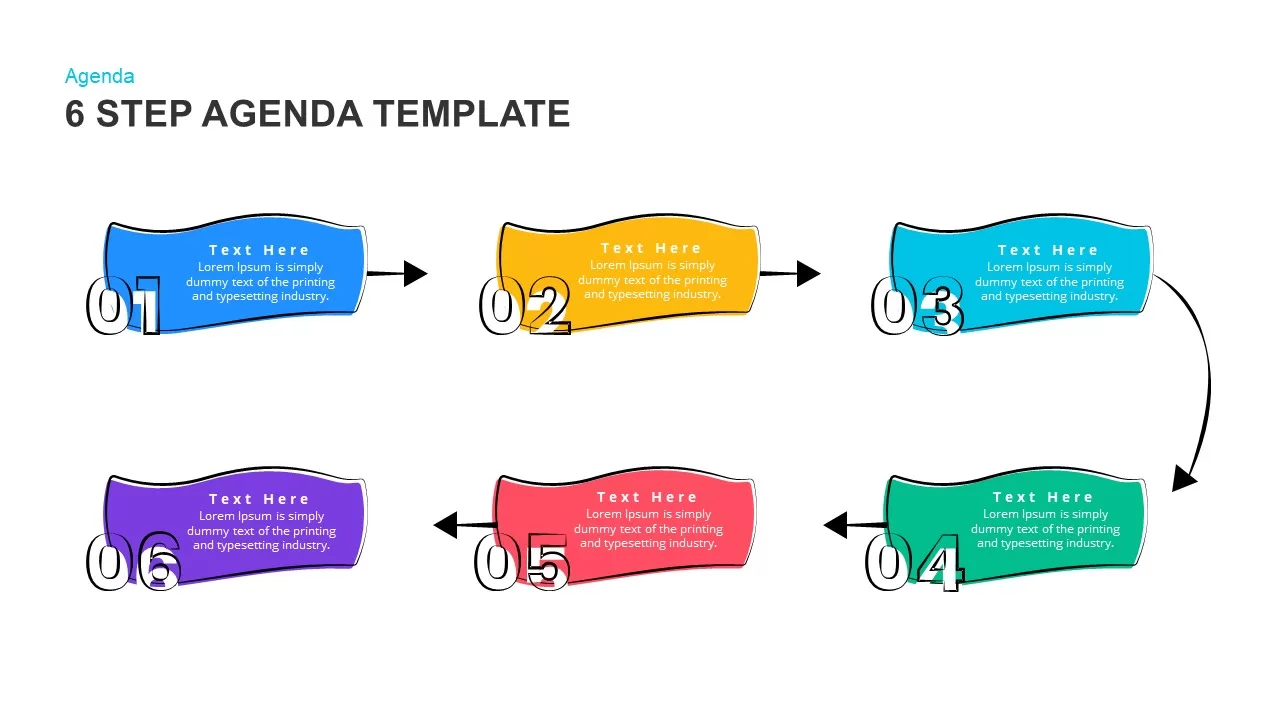
Modern & Dynamic 6-Step Agenda Sequence Template for PowerPoint & Google Slides
Agenda
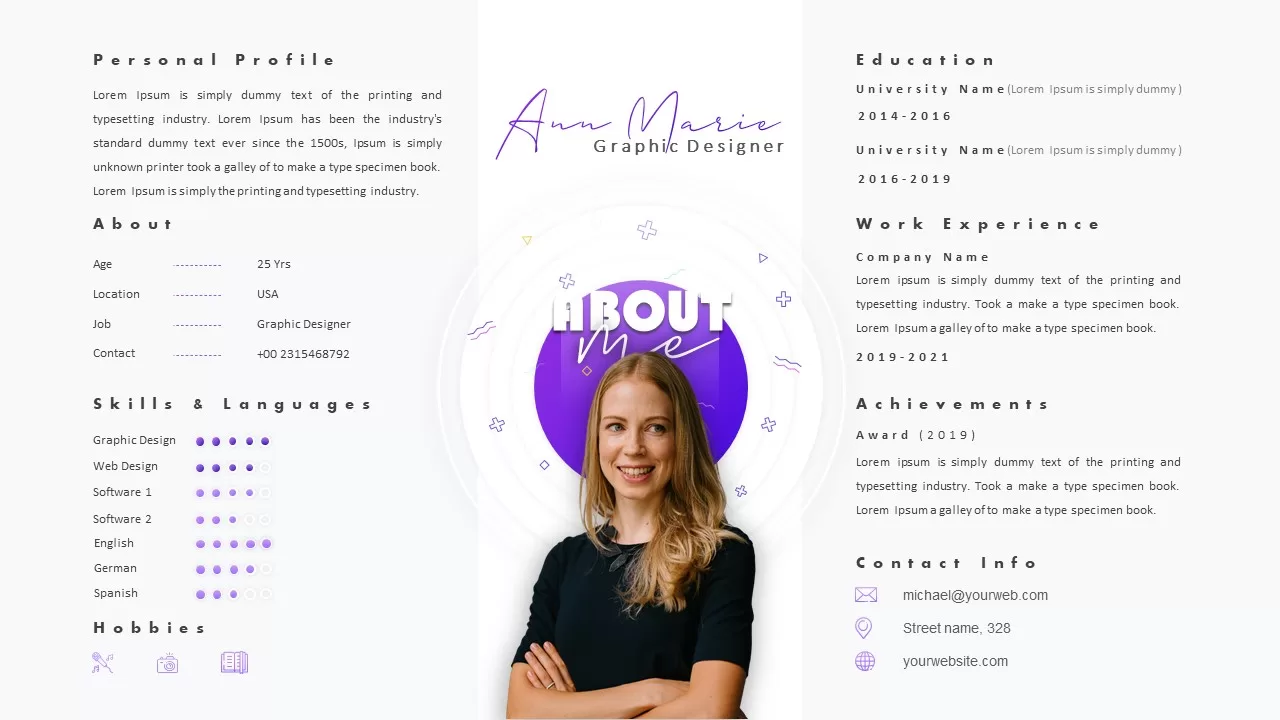
Modern About Me Personal Profile Presentation Template for PowerPoint & Google Slides
Business
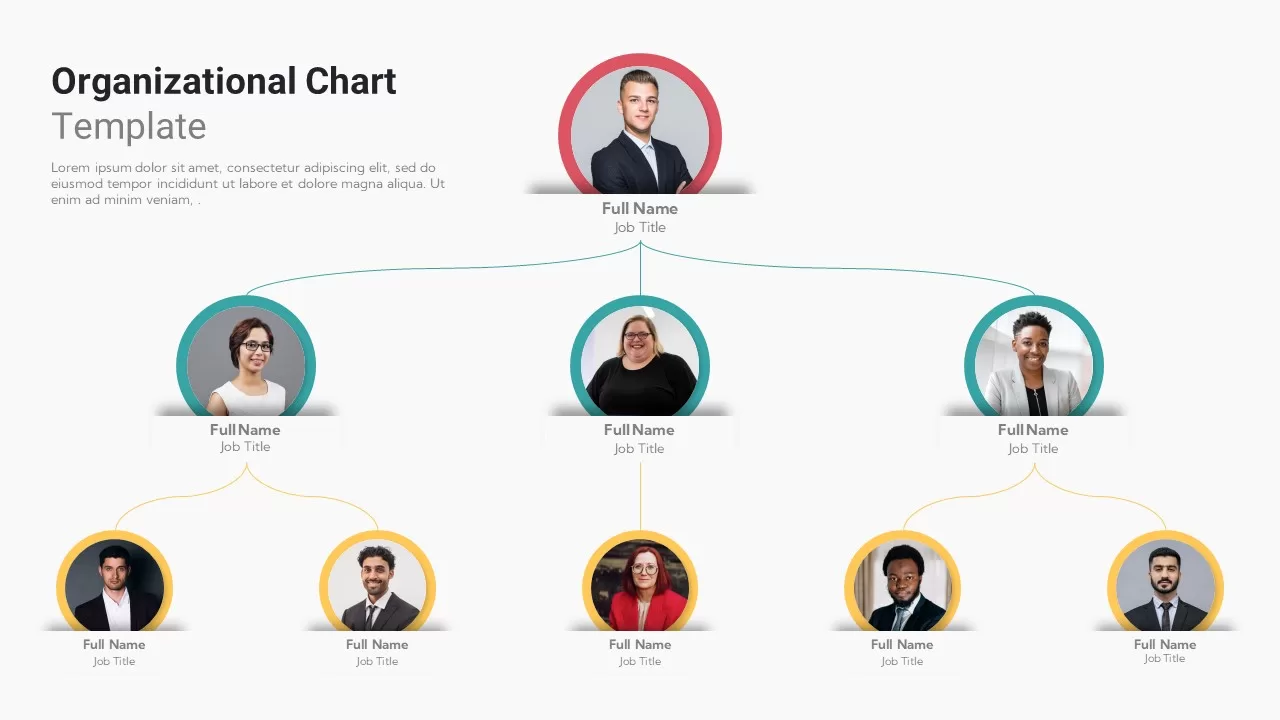
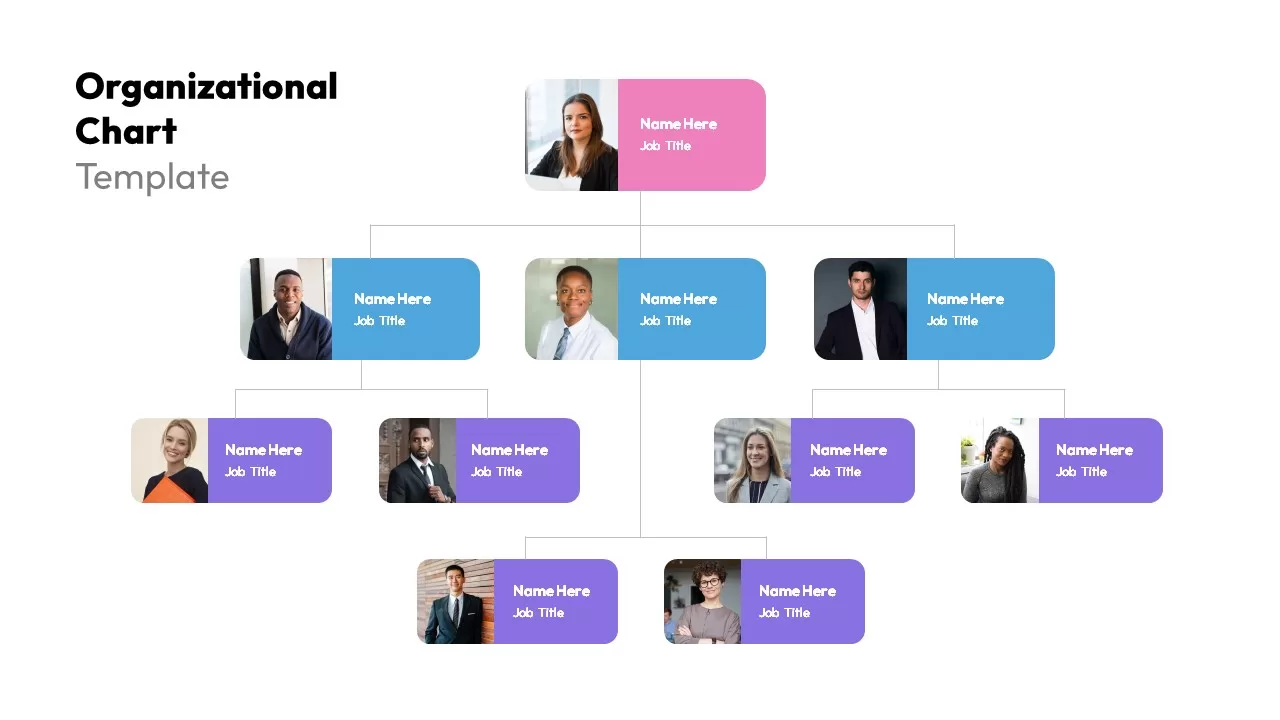
Modern Photo-Based Organizational Chart Template for PowerPoint & Google Slides
Org Chart
Modern Colorful SWOT Quadrant Analysis Template for PowerPoint & Google Slides
SWOT
Modern Image-Based Organizational Chart Template for PowerPoint & Google Slides
Infographics
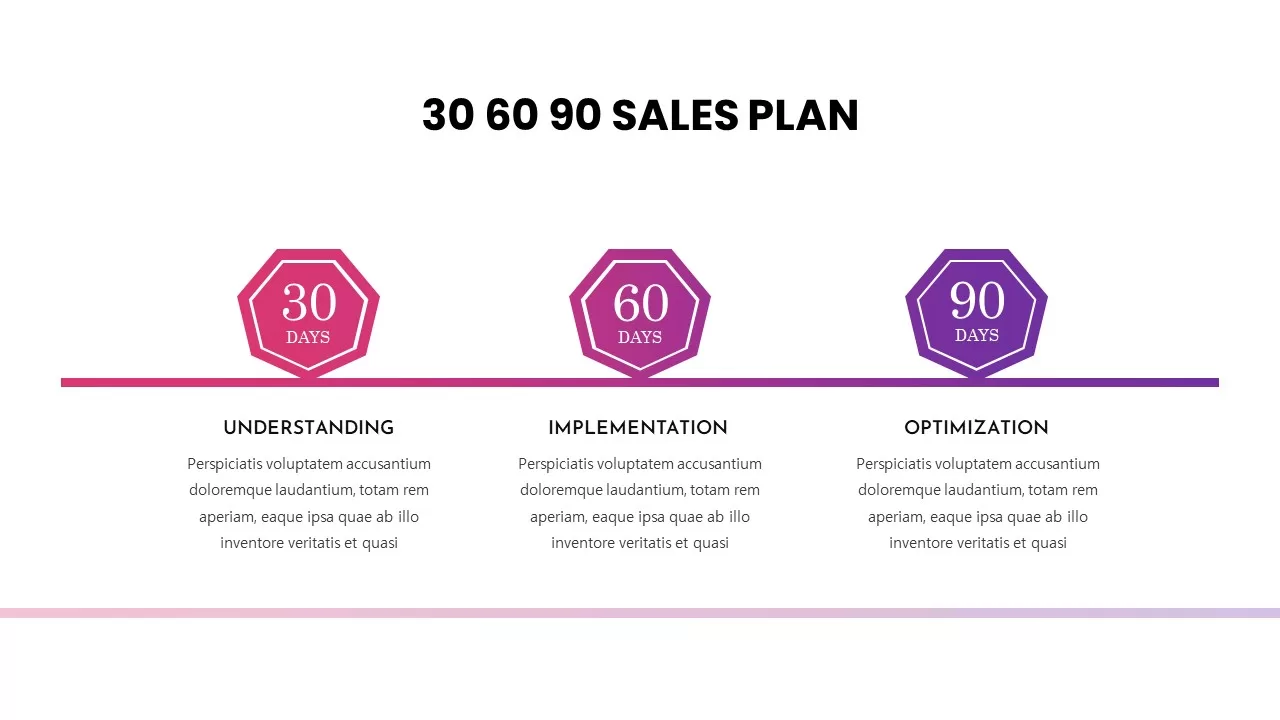
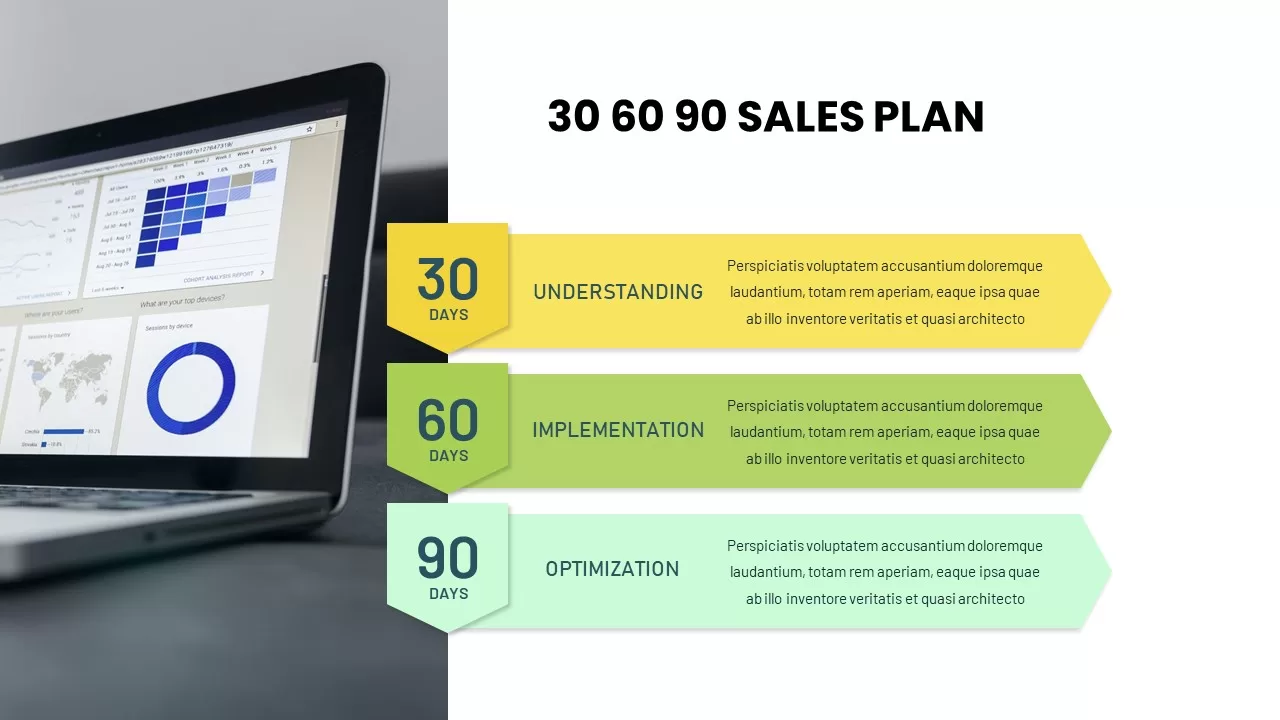
Modern 30-60-90 Sales Plan Timeline Template for PowerPoint & Google Slides
Timeline
Modern 30-60-90 Sales Plan Timeline Template for PowerPoint & Google Slides
Timeline
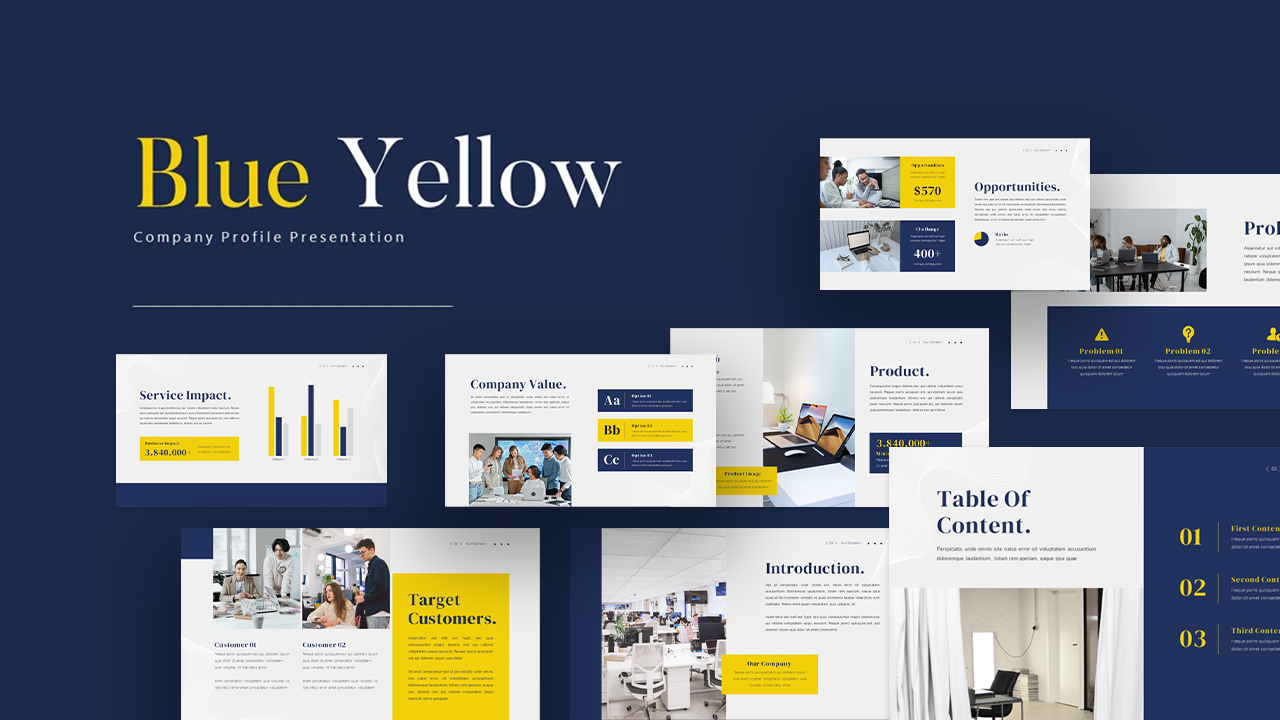
Modern Blue Yellow Company Profile Template for PowerPoint & Google Slides
Company Profile

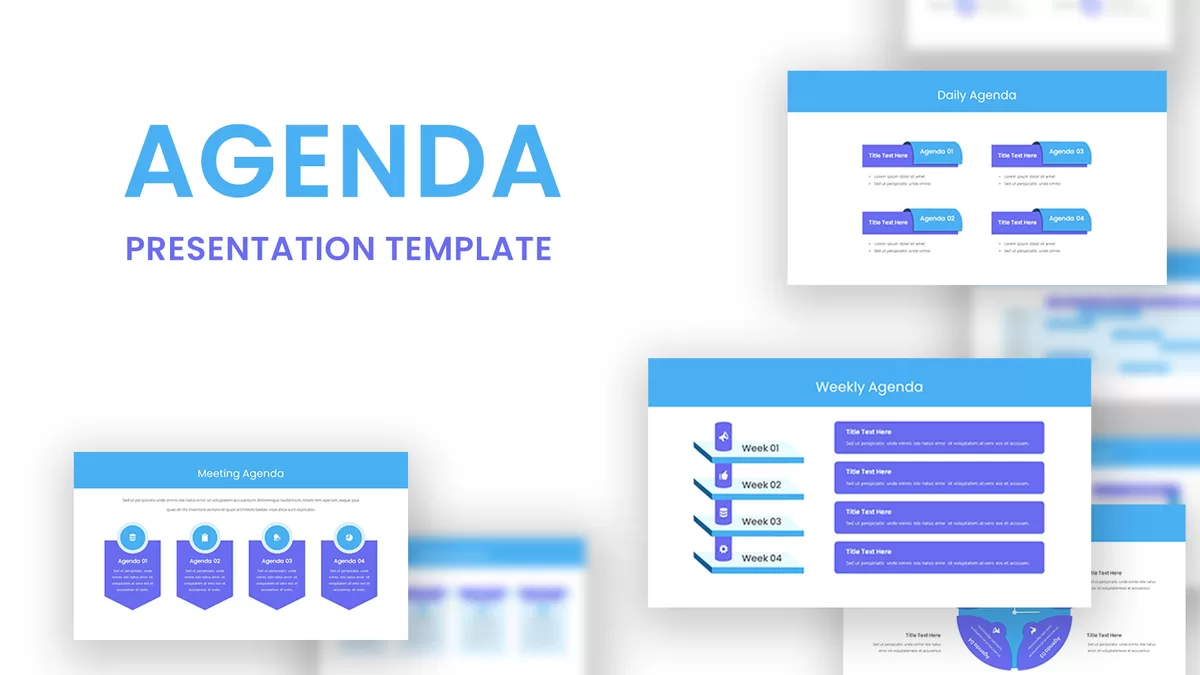
Modern Agenda Presentation Template for PowerPoint & Google Slides
Agenda
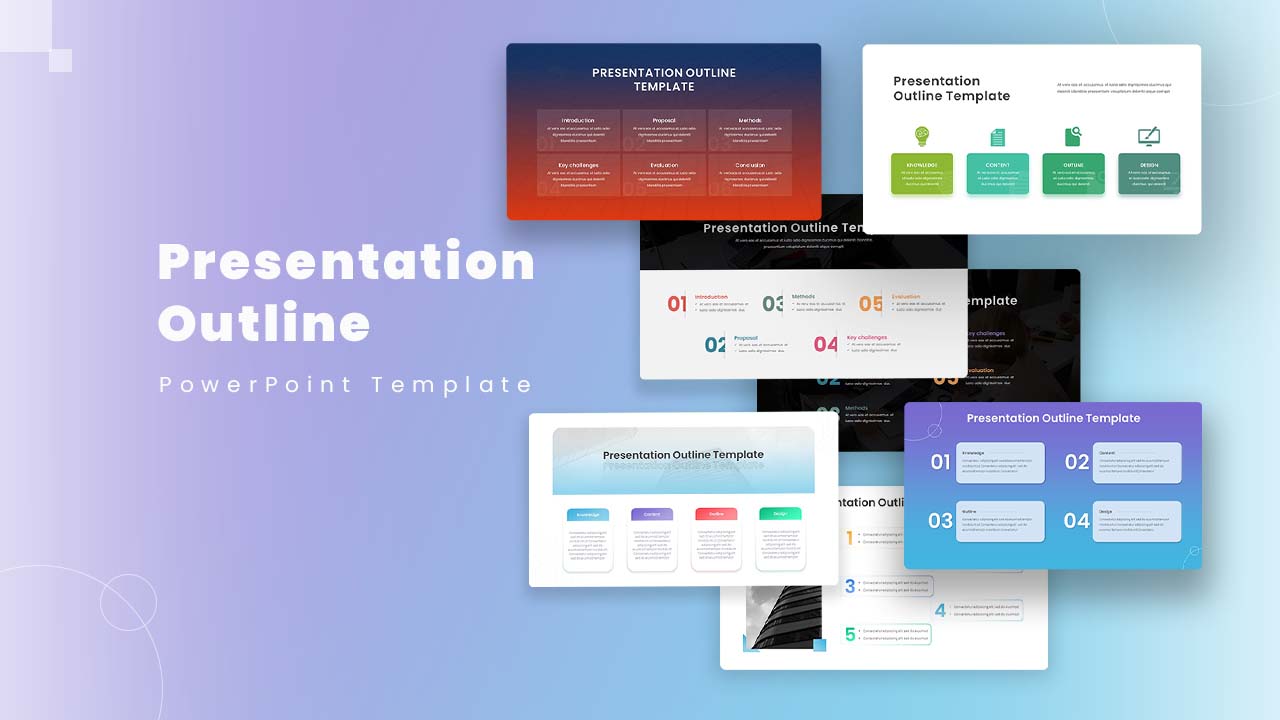
Modern Presentation Outline Template for PowerPoint & Google Slides
Process
Modern Gradient Startup Pitch Deck Template for PowerPoint & Google Slides
Pitch Deck
Modern Gradient Business Plan Deck Template for PowerPoint & Google Slides
Pitch Deck
Modern Resume & Self-Introduction Slide Template for PowerPoint & Google Slides
Recruitment
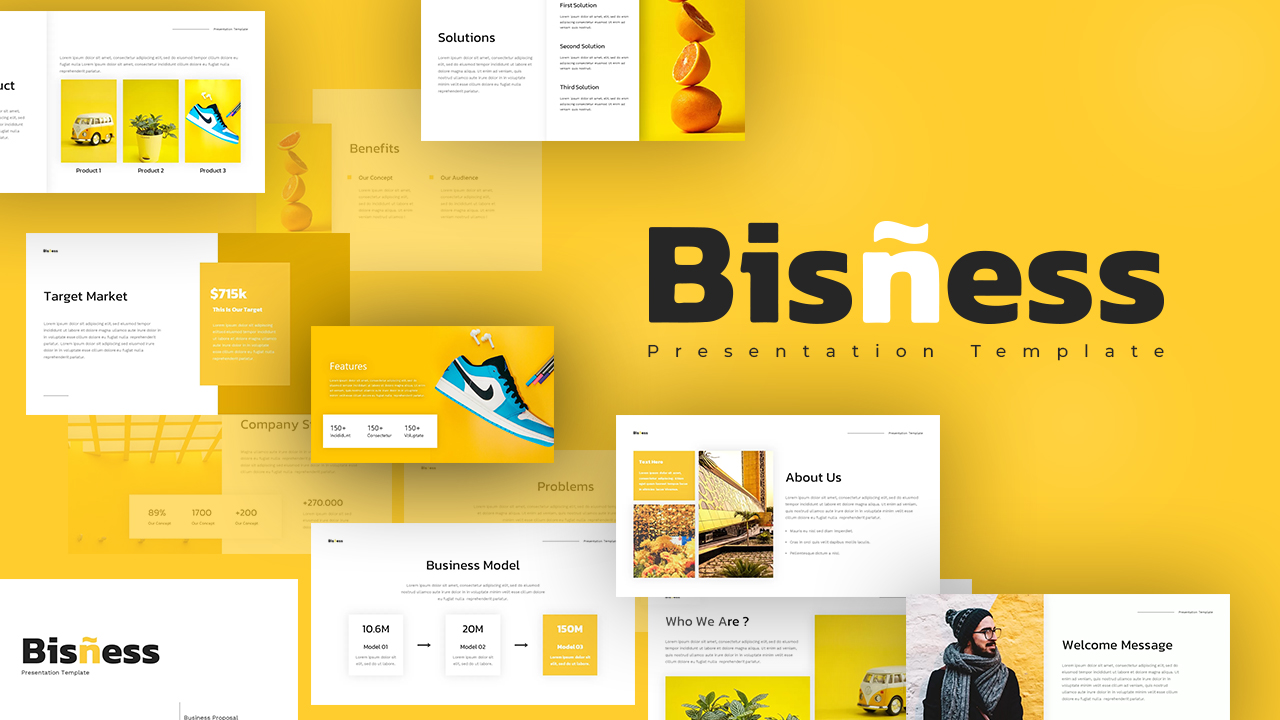
Modern Yellow Business Proposal Deck Template for PowerPoint & Google Slides
Business Proposal
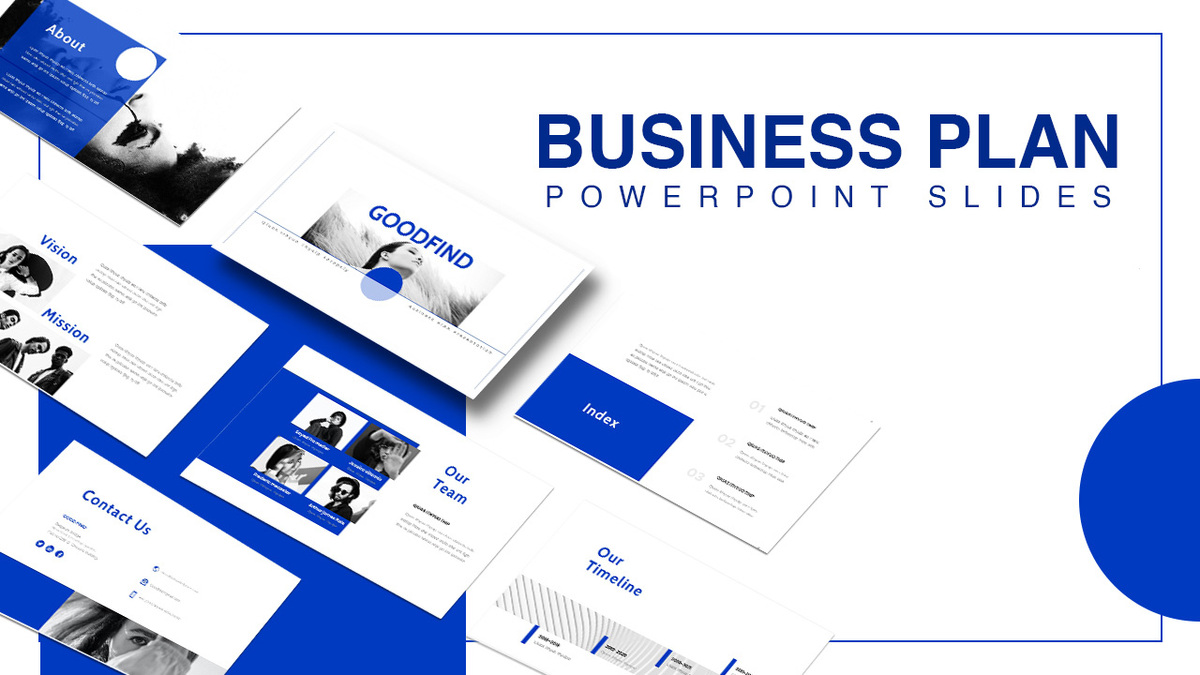
Modern Blue Business Plan Deck Template for PowerPoint & Google Slides
Business Plan
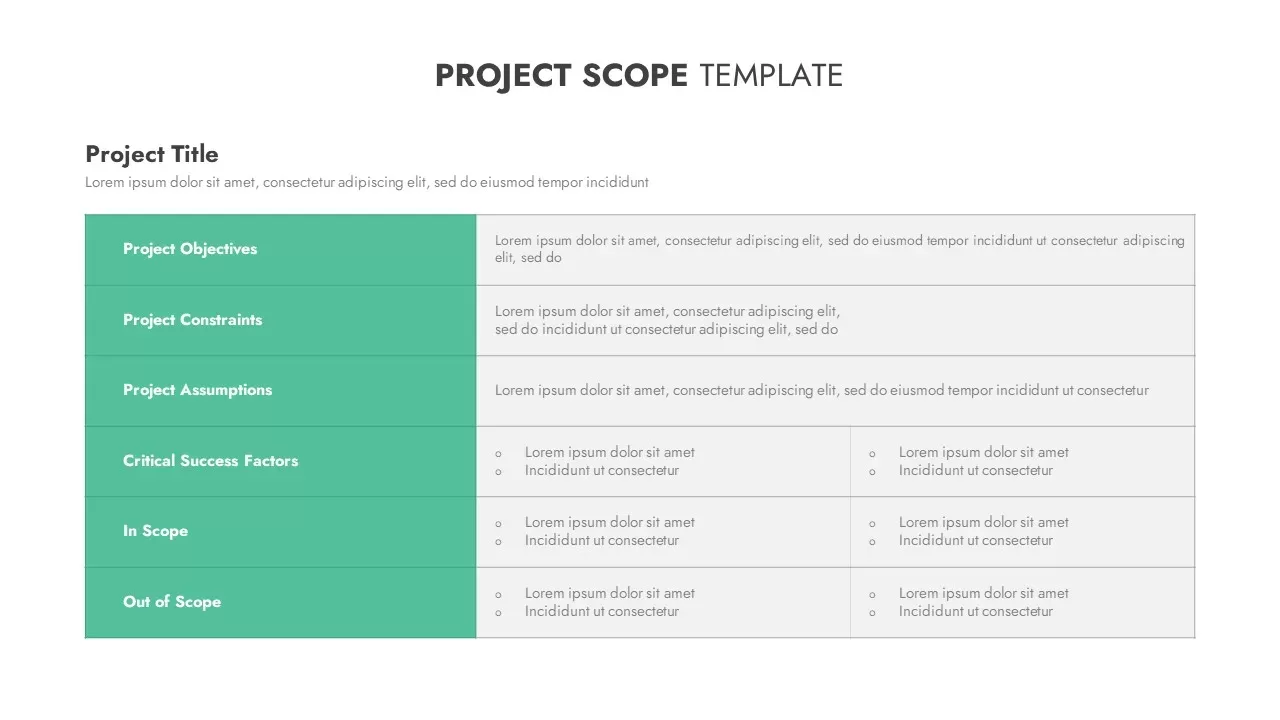
Modern Project Scope Template for PowerPoint & Google Slides
Project
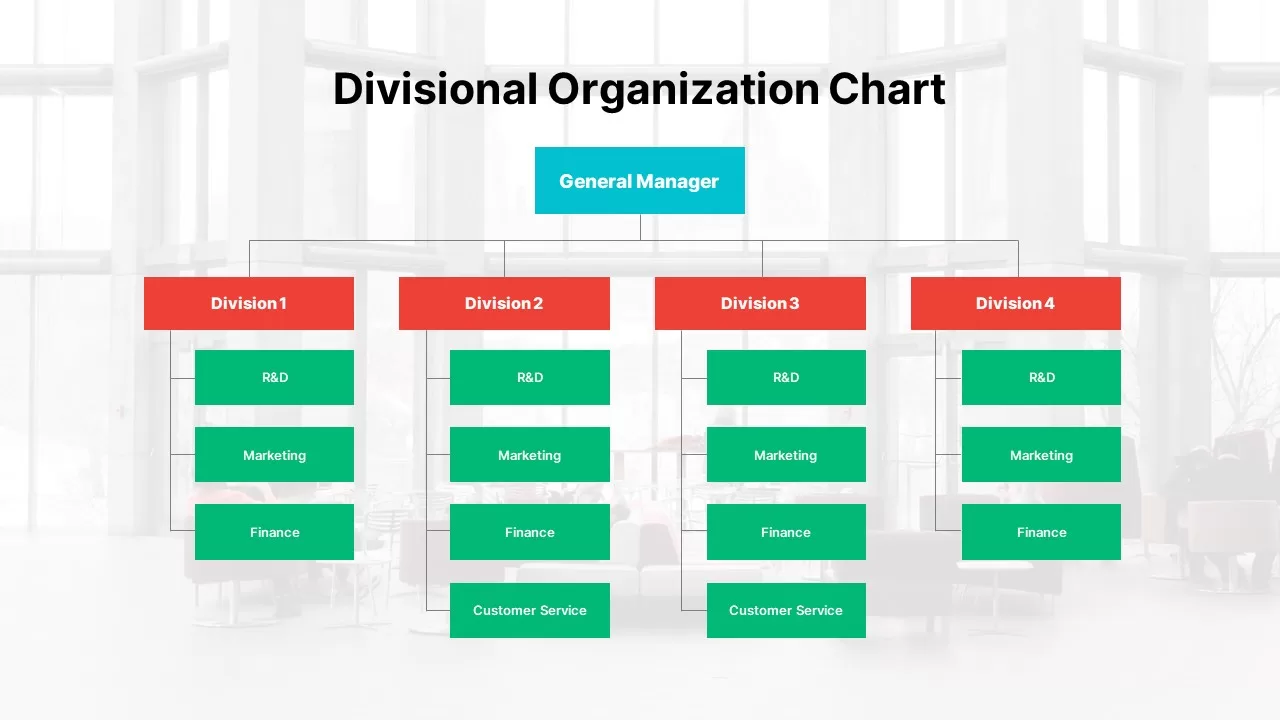
Modern Divisional Organization Chart Template for PowerPoint & Google Slides
Org Chart
Modern Cosmetics Photo Collage Layout Template for PowerPoint & Google Slides
Graphics
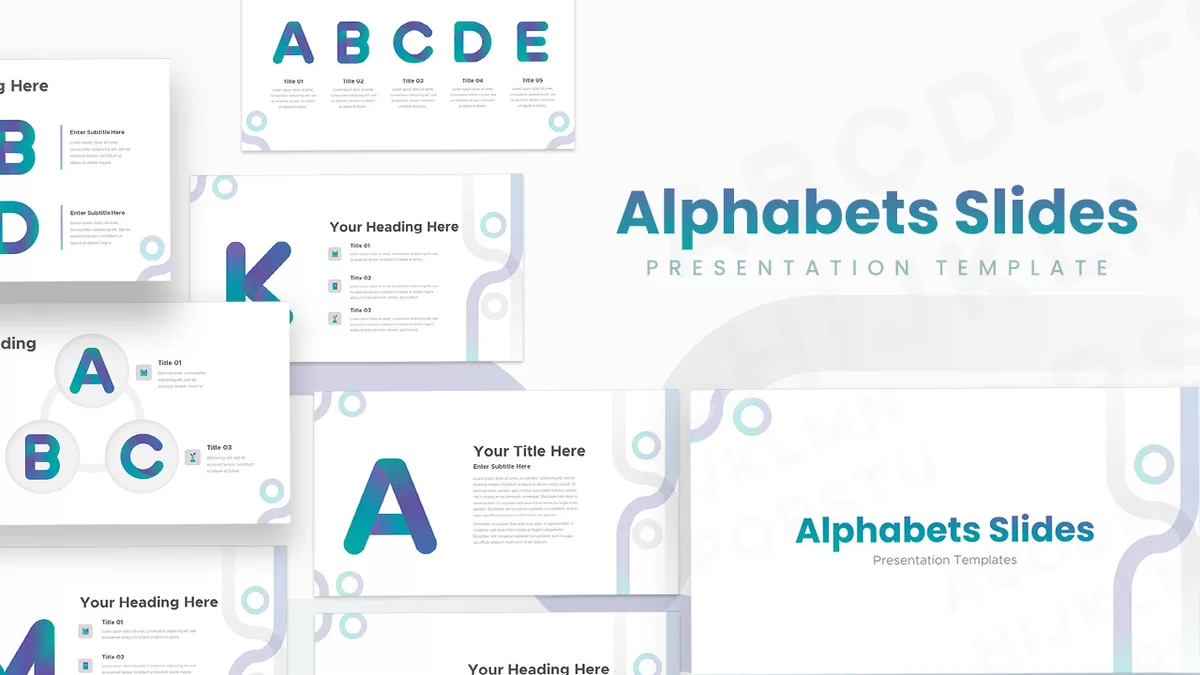
Modern Alphabet Letter Slide Deck Template for PowerPoint & Google Slides
Decks
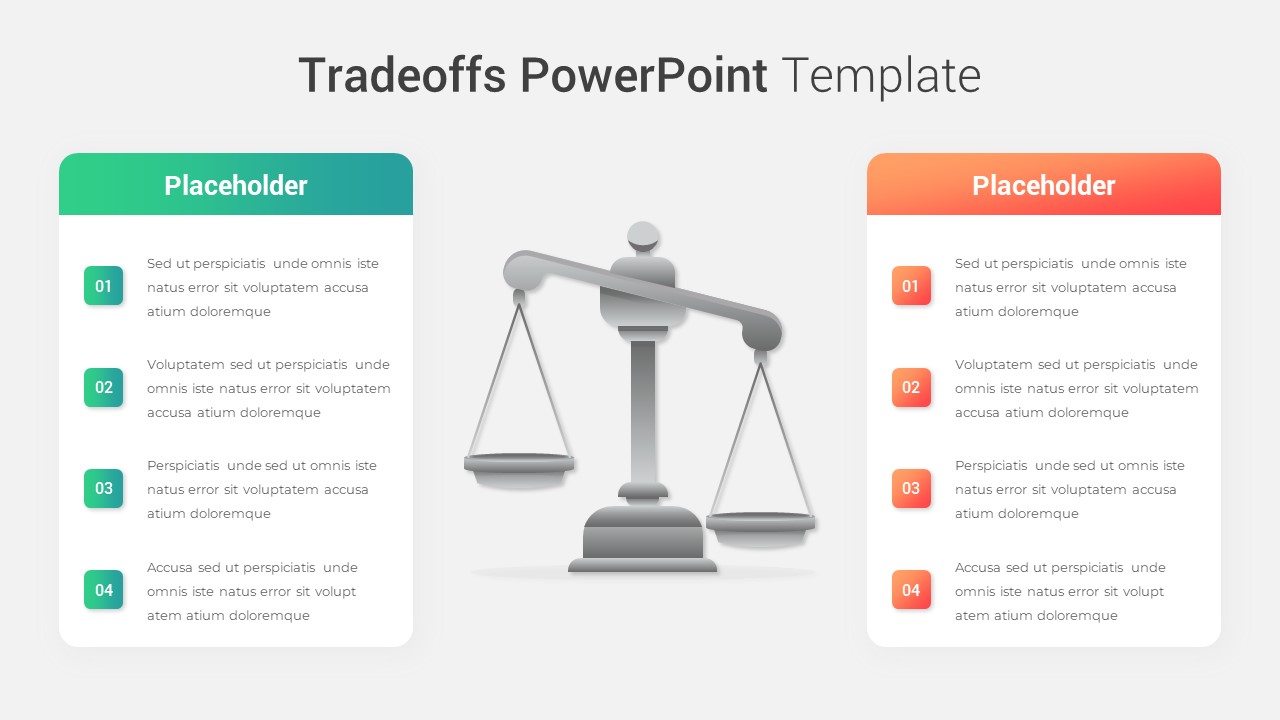
Modern Tradeoffs Comparison Slide Template for PowerPoint & Google Slides
Comparison
Modern Horizontal History Timeline Template for PowerPoint & Google Slides
Timeline
Modern Numbered References Slide Template for PowerPoint & Google Slides
Business Report
Modern Professional References Slide Template for PowerPoint & Google Slides
Business Report
Modern Marketing Agency Pitch Deck Template for PowerPoint & Google Slides
Pitch Deck
Modern Big Data Infographic Deck Template for PowerPoint & Google Slides
Decks
Modern Biotechnology Services & Research Template for PowerPoint & Google Slides
Health
Modern Crowdfunding Pitch Deck Template for PowerPoint & Google Slides
Pitch Deck
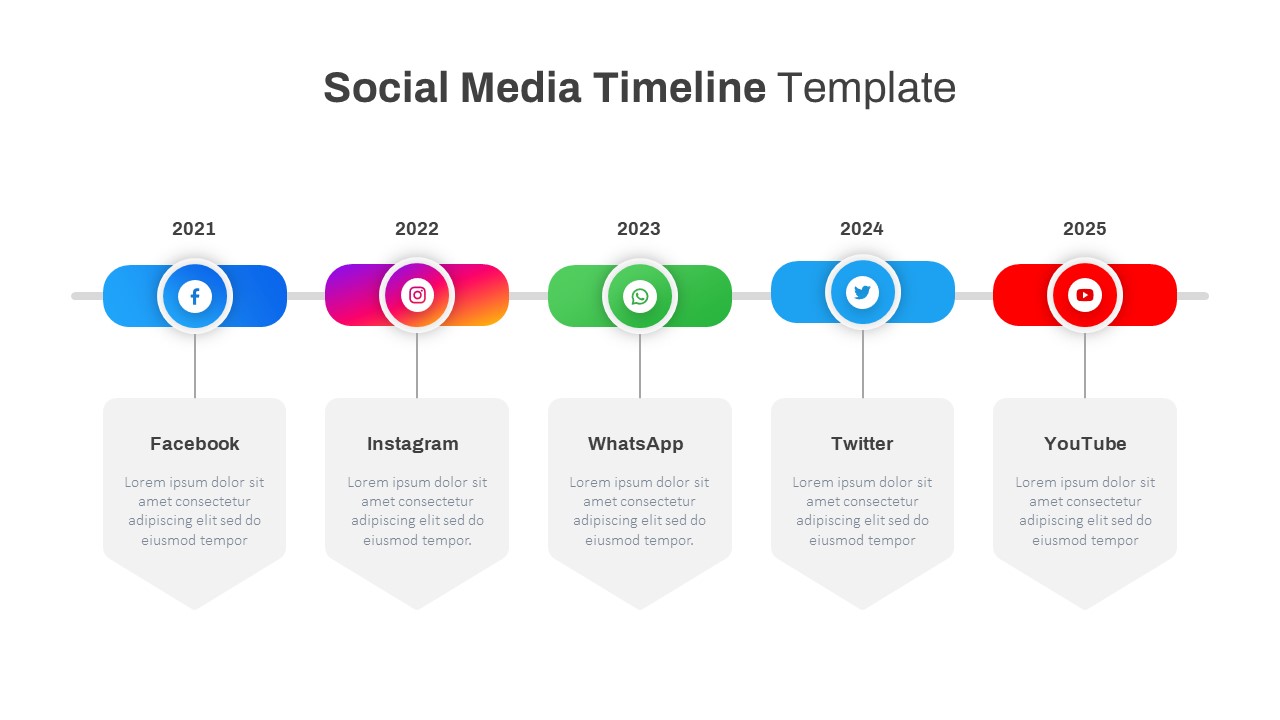
Modern Social Media Timeline Roadmap Template for PowerPoint & Google Slides
Timeline
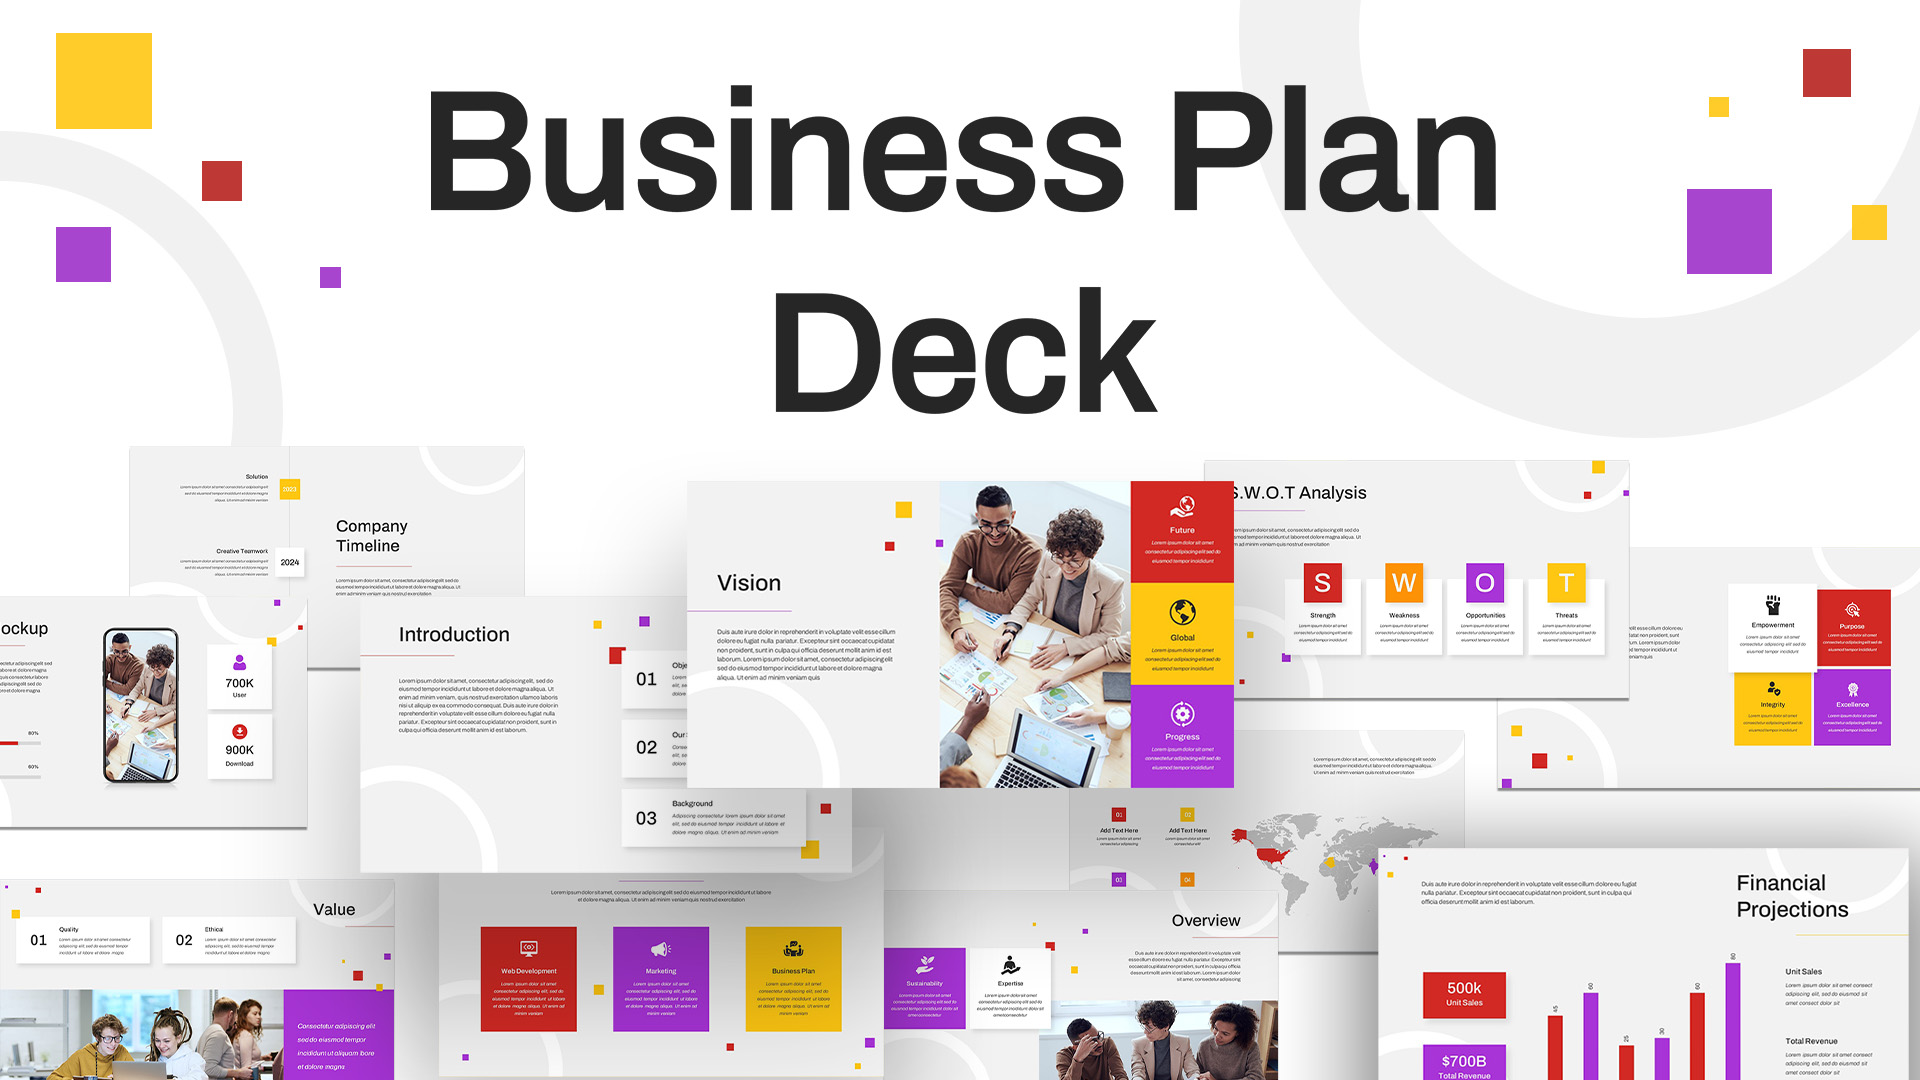
Free Modern Colorful Business Plan Deck Template for PowerPoint & Google Slides
Business Plan
Free
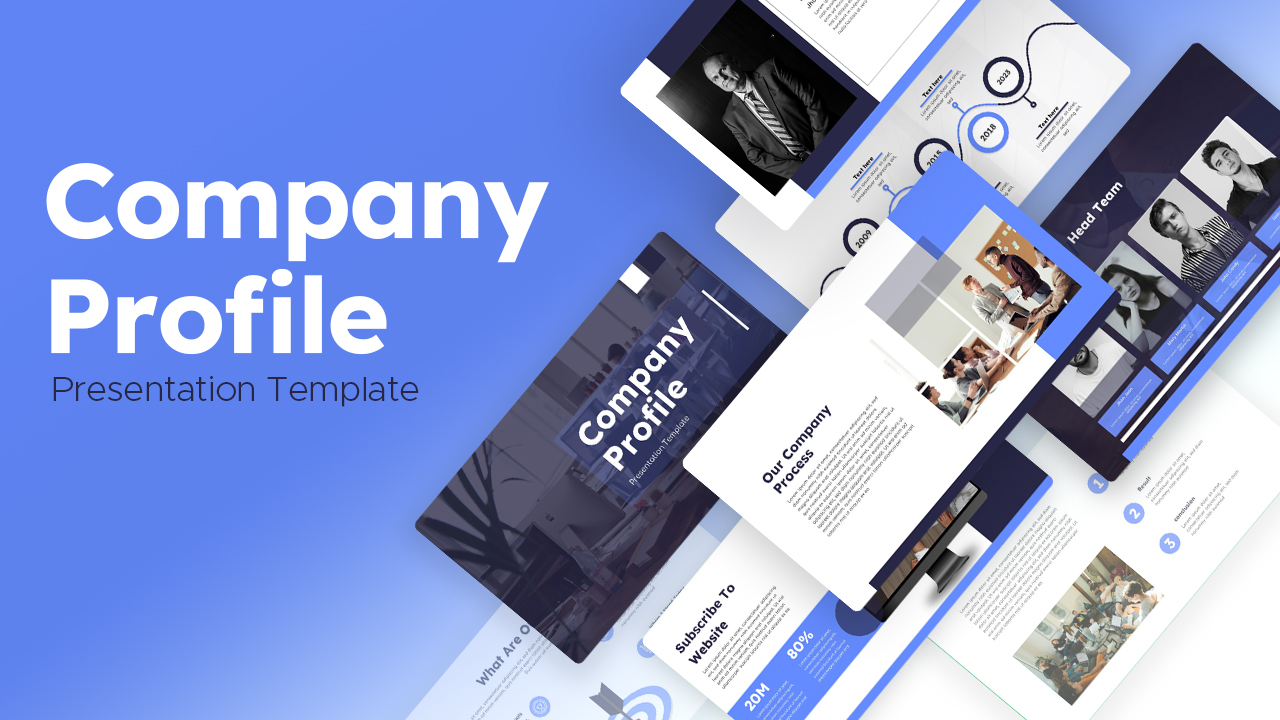
Free Modern Blue Company Profile Deck Template for PowerPoint & Google Slides
Company Profile
Free
Free Modern Green Finance Slide Deck Template for PowerPoint & Google Slides
Finance
Free
Free Modern Dunder Mifflin Pitch Deck Template for PowerPoint & Google Slides
Pitch Deck
Free
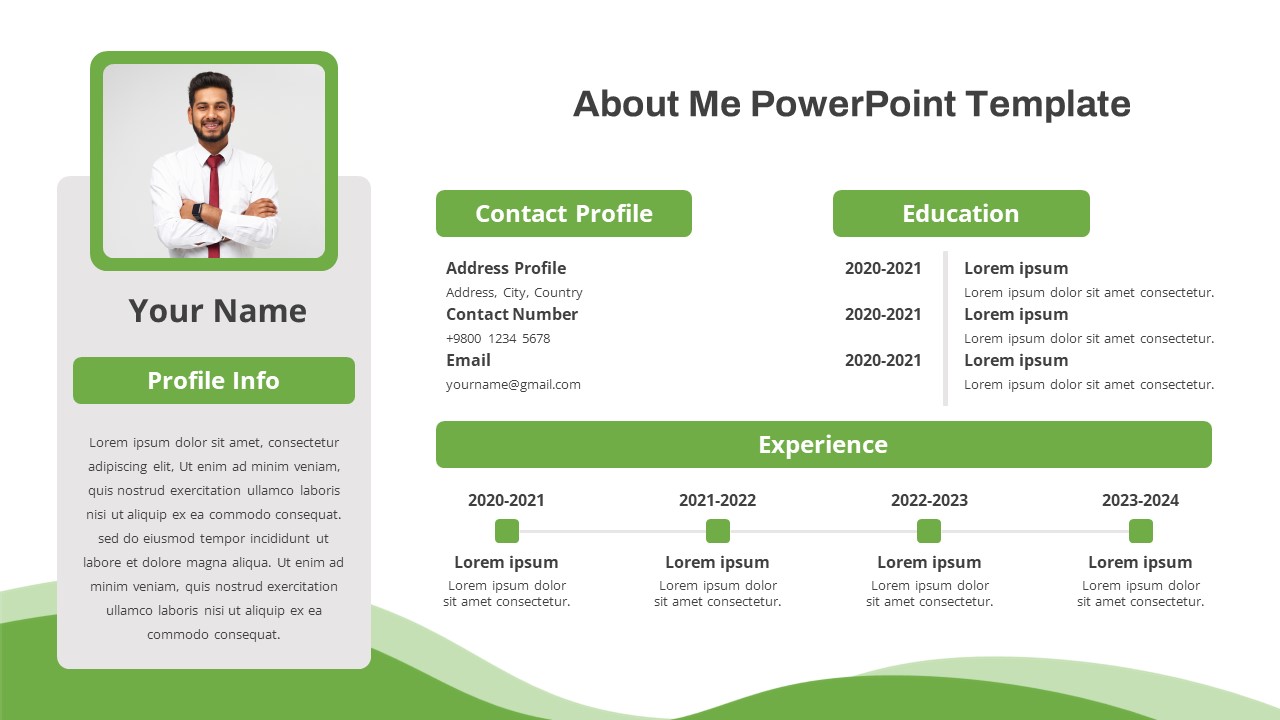
Free Modern About Me Profile Slide Template for PowerPoint & Google Slides
Company Profile
Free
Modern Aviation Pitch Deck Template for PowerPoint & Google Slides
Decks
Free
Modern Abstract Blue Wave Theme Template for PowerPoint & Google Slides
Decks
Modern Tax Consulting Slide Deck Template for PowerPoint & Google Slides
Finance
Modern Digital Agency Presentation Template for PowerPoint & Google Slides
Digital Marketing
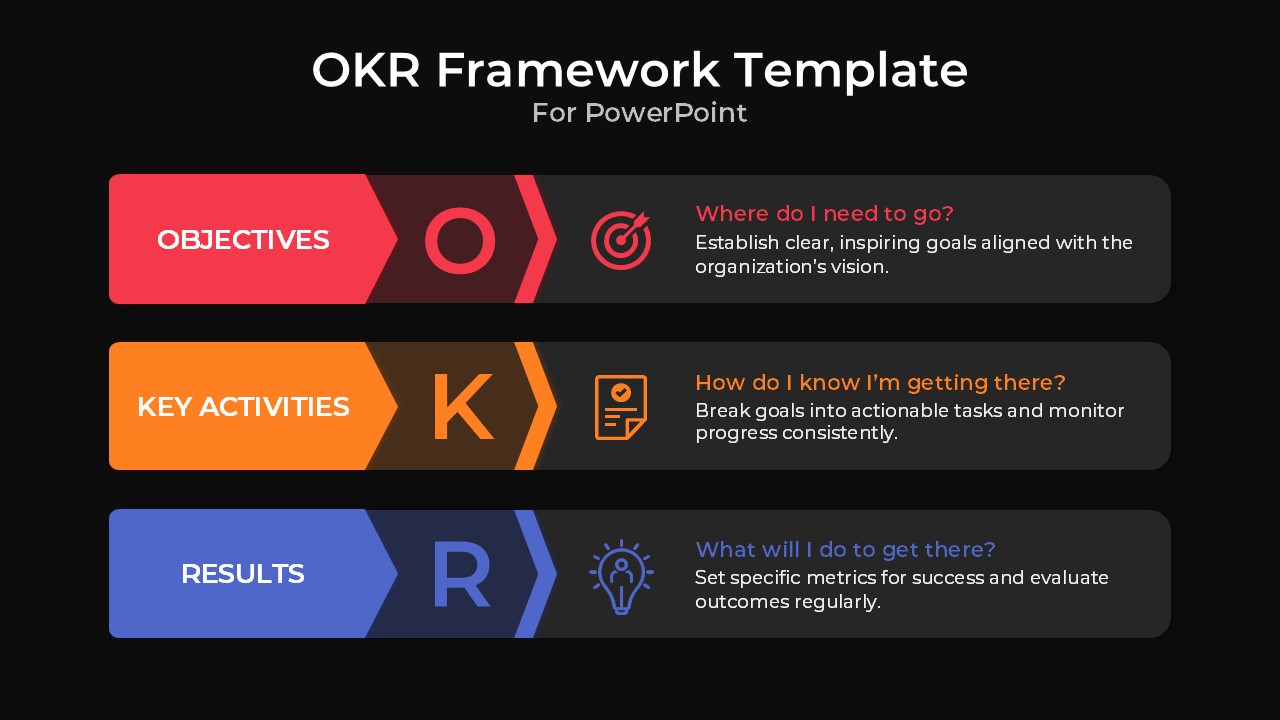
OKR Framework Template for PowerPoint & Google Slides
Process
Modern Marketing Presentation Template for PowerPoint & Google Slides
Pitch Deck
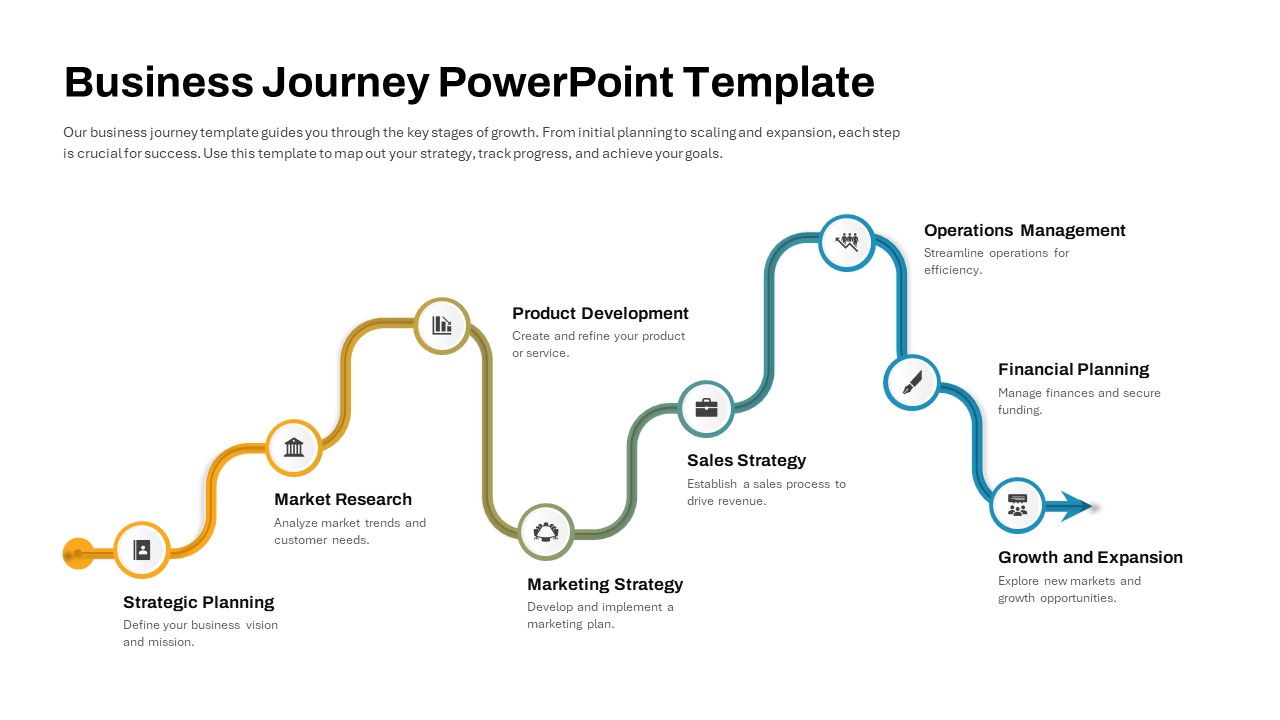
Modern Business Journey Roadmap Template for PowerPoint & Google Slides
Roadmap
Modern Proposal Agenda Presentation Template for PowerPoint & Google Slides
Agenda
Modern Business Flyer Template for PowerPoint & Google Slides
Advertising
Modern Team Introduction Profile Slide Template for PowerPoint & Google Slides
Business
Modern Blue Our Team Introduction Template for PowerPoint & Google Slides
Business
Modern Team Introduction Template for PowerPoint & Google Slides
Our Team