Creative World Map template for PowerPoint & Google Slides


Description
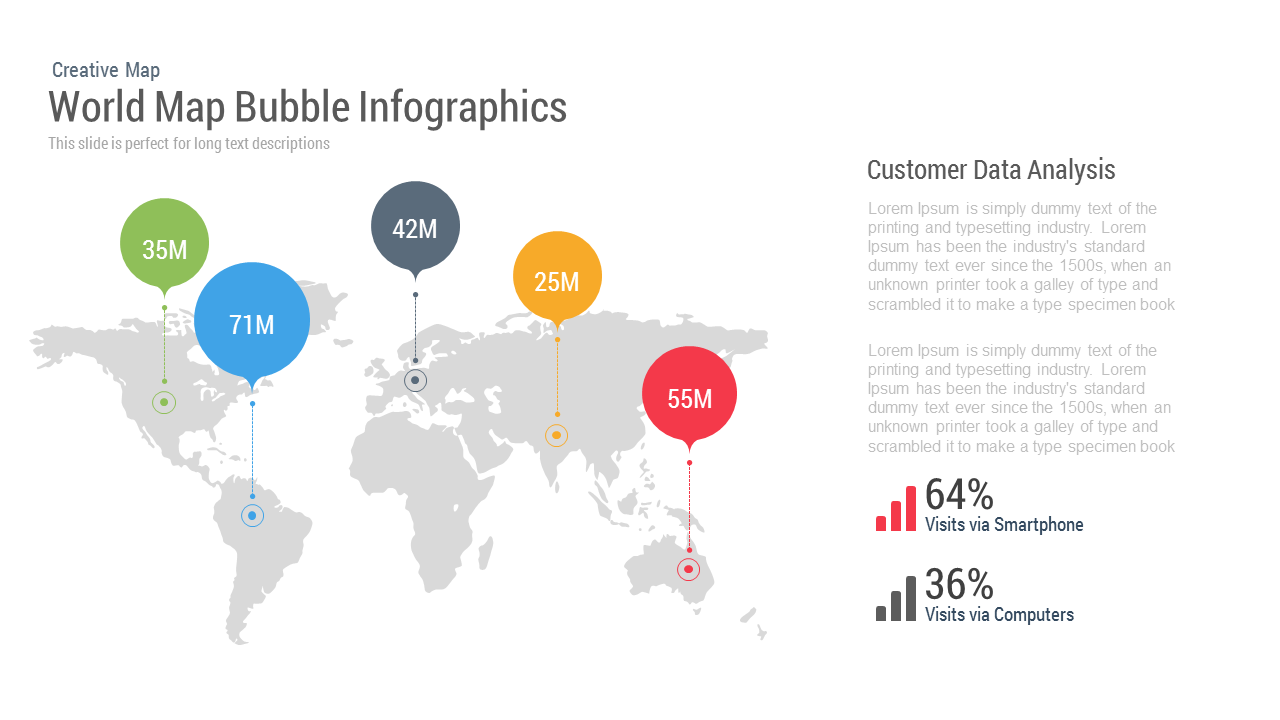
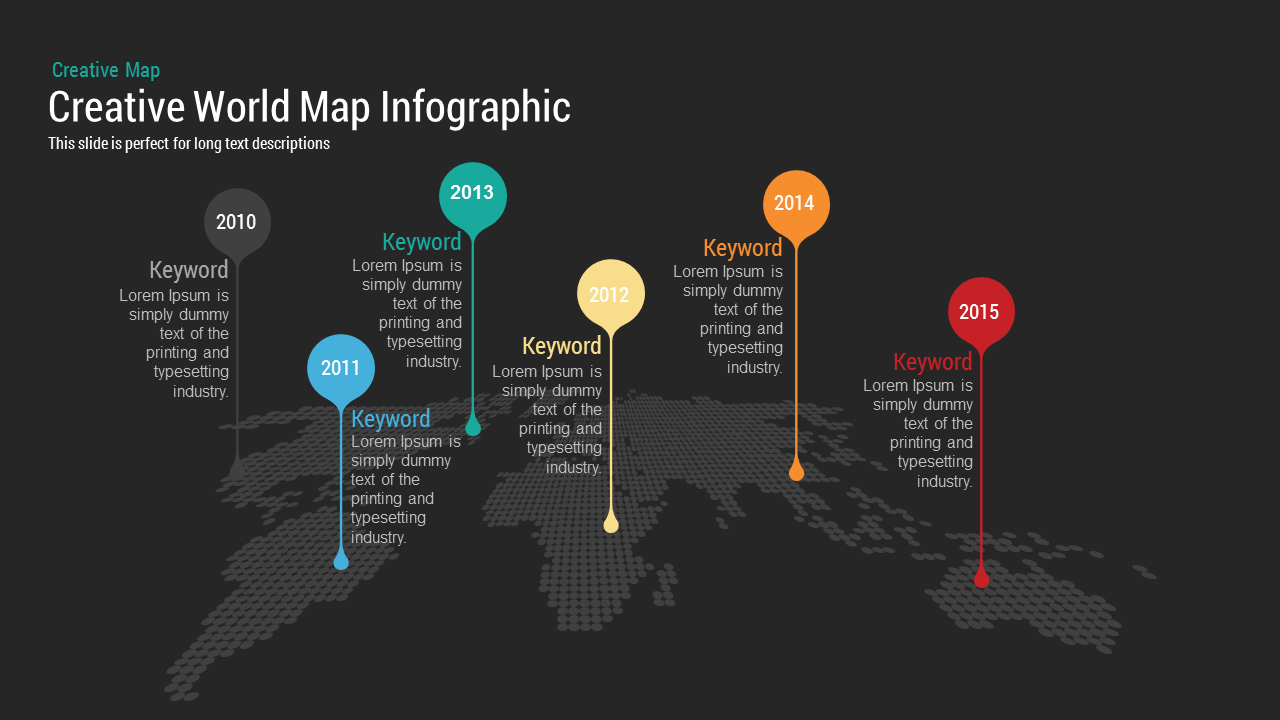
This Creative World Map template features a stylized dotted‐vector map backdrop on a clean white canvas, punctuated by five vibrant bubble markers indicating regional data points. Each bubble is rendered in a distinct accent hue and labeled with year values from 2010 to 2015. Sleek vertical connectors anchor the bubbles to precise map locations, and adjacent text callouts provide editable headings and descriptive placeholders. Generous title and subtitle fields at the top enable clear framing of your infographic theme.
Built on master slides, every element—from the dotted map to bubble shapes and connector lines—is fully editable in PowerPoint and Google Slides. Update bubble colors, resize markers to reflect relative values, or swap connectors for arrows in seconds via theme-color controls. Text placeholders support long-form descriptions, while free web fonts ensure typographic consistency across platforms. Drag-and-drop icons and images into any bubble or callout without redesigning layouts.
Optimized for both 16:9 widescreen and classic 4:3 formats, the template maintains crisp clarity on HD projectors, retina displays, and virtual meeting backgrounds. Subtle drop shadows beneath bubbles and connectors add depth, while precise alignment grids ensure perfect balance. A hidden variation slide offers alternate color palettes and node positions for rapid theme switching. Apply built-in entrance animations to each bubble or use morph transitions to guide viewer focus across regions.
Whether you’re presenting global sales figures, market-penetration metrics, or audience segmentation insights, this map-based infographic accelerates professional, data-driven slide creation with zero design headaches.
Who is it for
Marketing managers, data analysts, consultants, and business strategists who need to illustrate geospatial metrics or regional trends. Executives and educators can leverage the design for investor pitches, academic research, or corporate reports.
Other Uses
Repurpose this layout to display sales territories, supply-chain networks, epidemiological data, or product rollouts. Swap bubbles for icons to create risk heat maps, resource allocation charts, or global campaign overviews.
Login to download this file

Item ID
SB00046
Related Templates

World Map Data template for PowerPoint & Google Slides
World Maps
World Map Bubble template for PowerPoint & Google Slides
World Maps

Modern World Map Callout Infographic Template for PowerPoint & Google Slides
World Maps
Fully Editable World Map Infographic Template for PowerPoint & Google Slides
World Maps
Editable World Map Callout Infographic Template for PowerPoint & Google Slides
World Maps
Editable World Map Callout Infographic Template for PowerPoint & Google Slides
World Maps
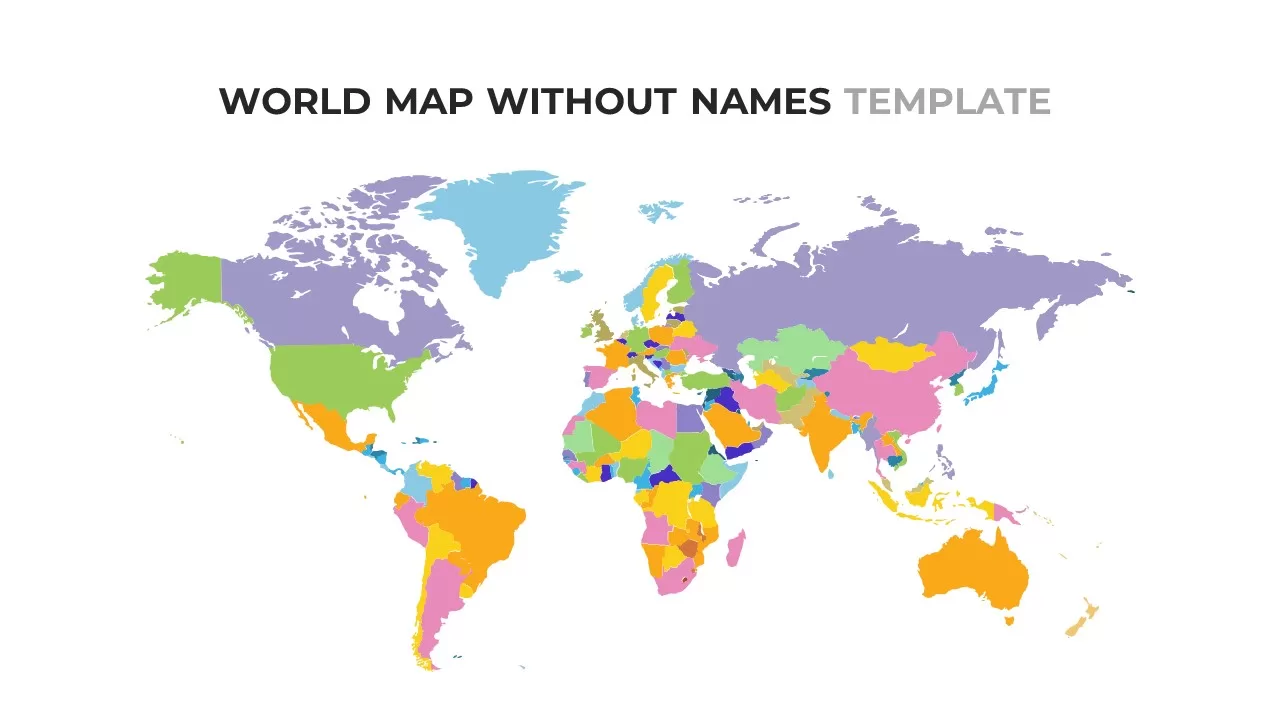
World Map Without Names Template for PowerPoint & Google Slides
World Maps
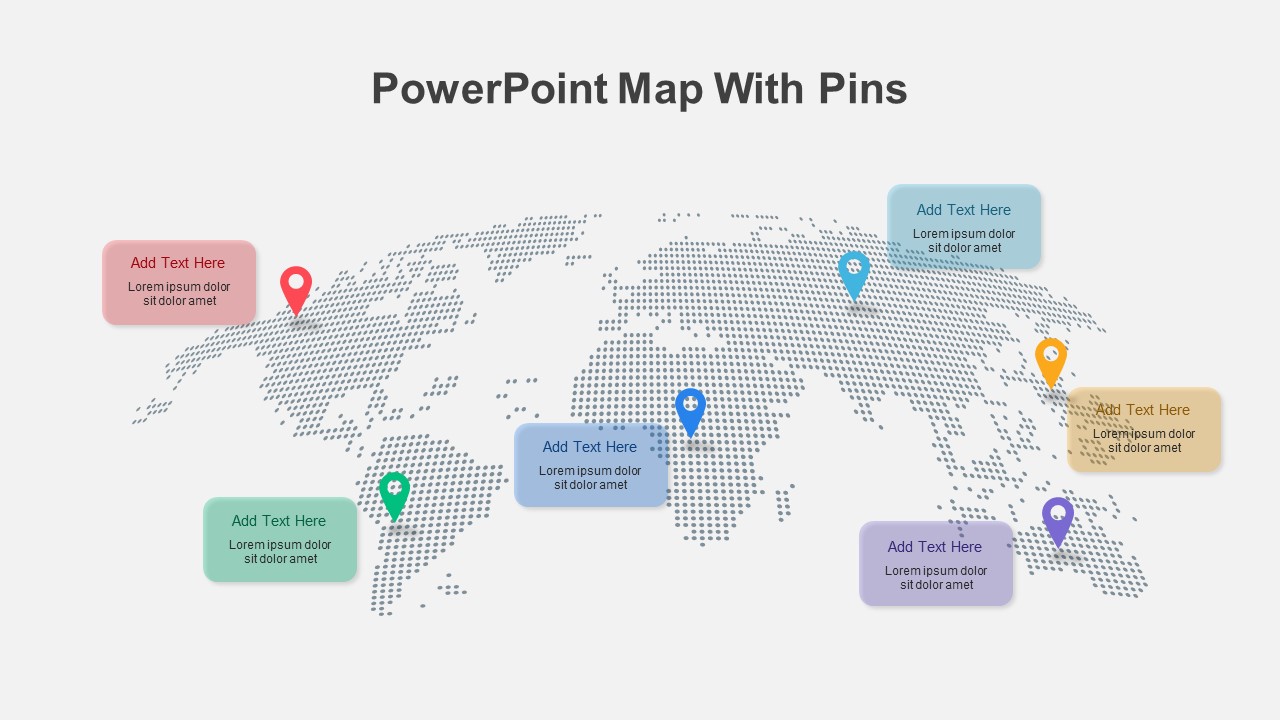
Colorful World Map with Location Pins Template for PowerPoint & Google Slides
World Maps
Colorful Creative Mind Map Diagram template for PowerPoint & Google Slides
Mind Maps
Creative Bubble Mind Map Template for PowerPoint & Google Slides
Mind Maps
Travel Around World Template for PowerPoint & Google Slides
Infographics
VUCA World Infographic Presentation Template for PowerPoint & Google Slides
Pitch Deck
World Environment Day Celebration Template for PowerPoint & Google Slides
Graphics
Free
Free World UFO Day Slide Template for PowerPoint & Google Slides
Business
Free
World Trade Organization Profile Template for PowerPoint & Google Slides
Business
World Hello Day Celebration Slide Template for PowerPoint & Google Slides
Graphics
Free World Health Organization Presentation Deck for PowerPoint & Google Slides
Decks
Free
Creative Section Divider Slides Template for PowerPoint & Google Slides
Decks

Inspire Multipurpose Creative Deck PowerPoint Template for PowerPoint & Google Slides
Pitch Deck
Creative Studio PowerPoint Template for PowerPoint & Google Slides
Decks
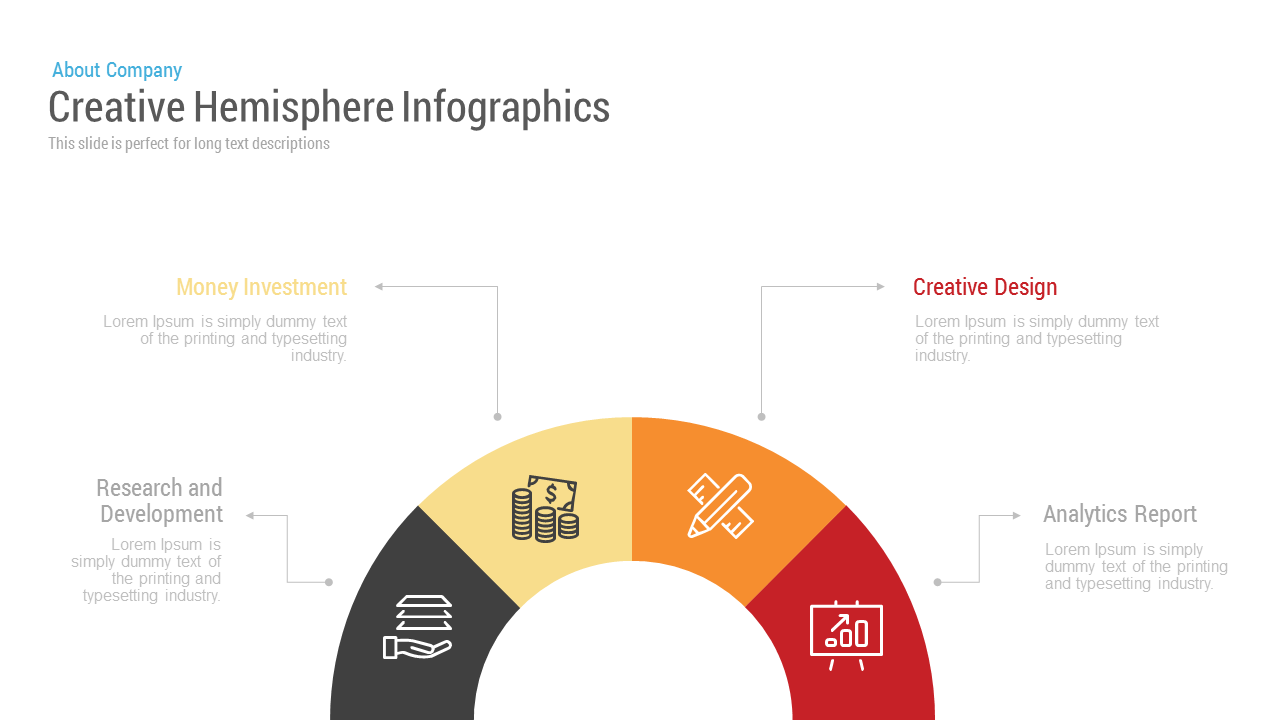
Free Creative Hemisphere Infographics template for PowerPoint & Google Slides
Infographics
Free
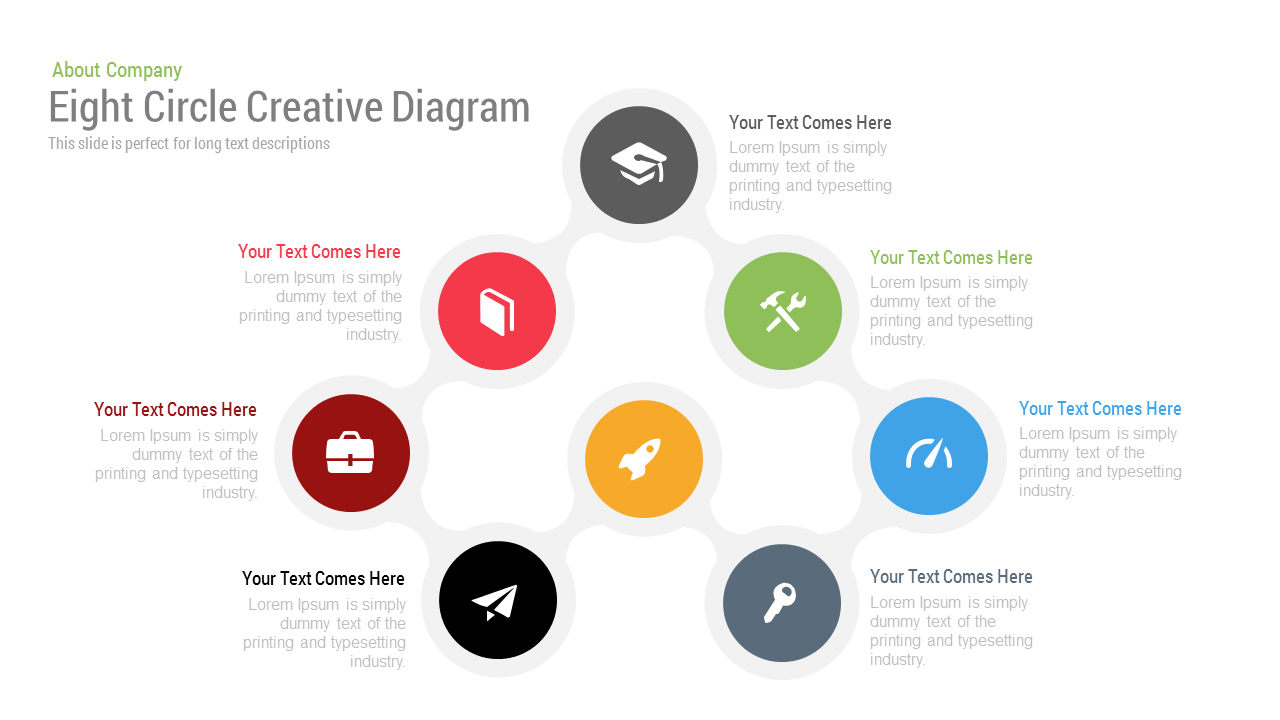
Free Eight Circle Creative Diagram template for PowerPoint & Google Slides
Circular
Free
Circle Strategy Creative Chart template for PowerPoint & Google Slides
Business Strategy
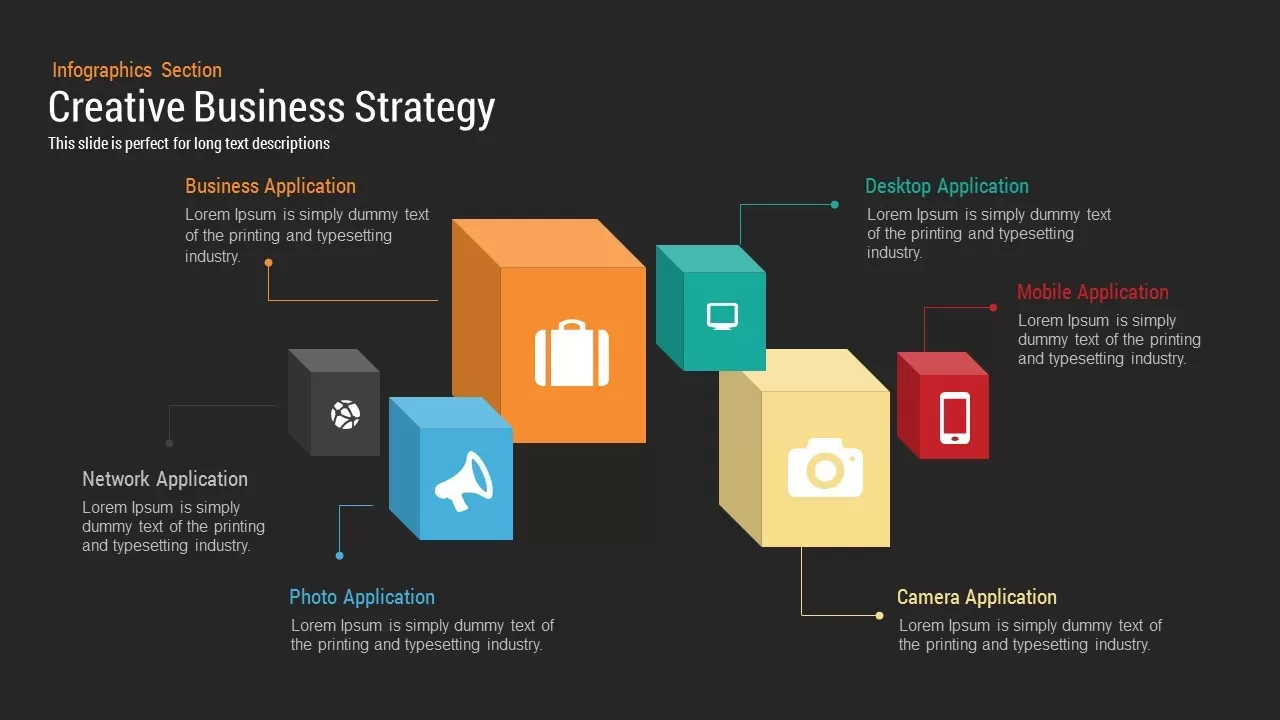
Creative Business Strategy Template for PowerPoint & Google Slides
Business Strategy

Creative data chart analytics template for PowerPoint & Google Slides
Charts
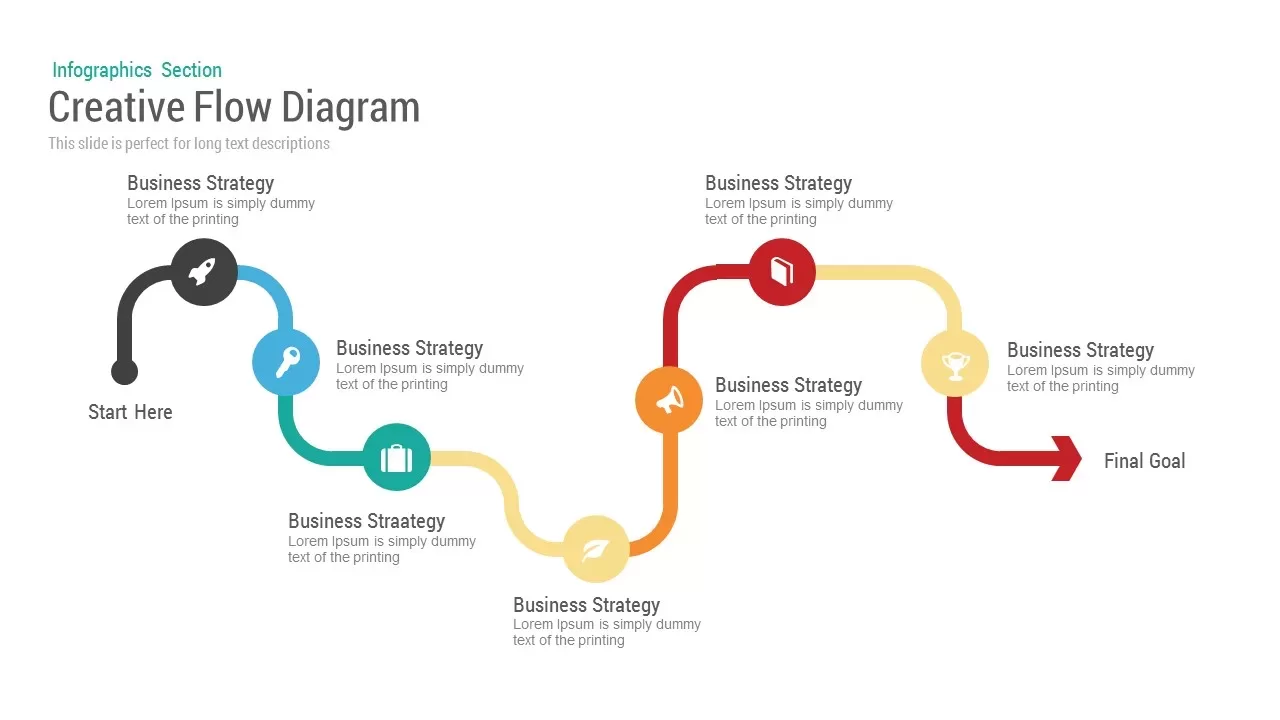
Creative flow diagram template for PowerPoint & Google Slides
Process
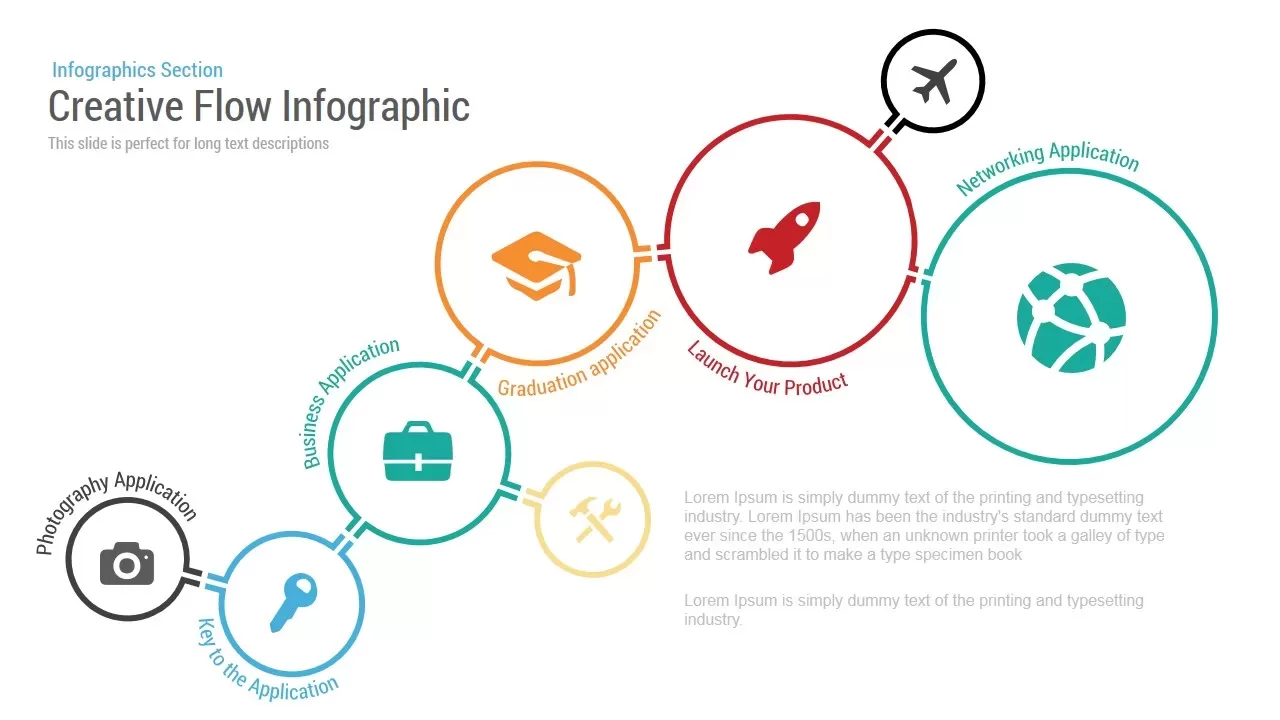
Creative Flow Infographic template for PowerPoint & Google Slides
Process
Creative Data Analysis Bar Chart template for PowerPoint & Google Slides
Bar/Column
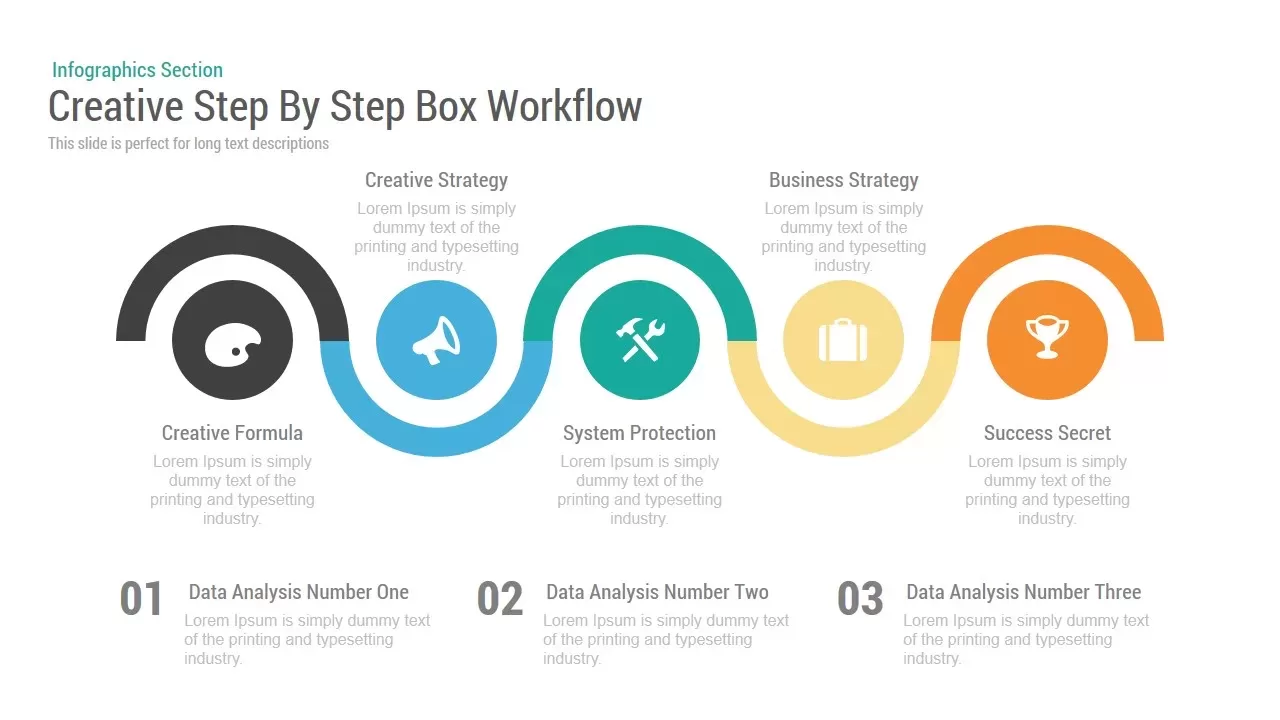
Creative Step By Step Workflow template for PowerPoint & Google Slides
Process
Creative SWOT Chart template for PowerPoint & Google Slides
SWOT
Creative Dynamic Gantt Chart Timeline Template for PowerPoint & Google Slides
Timeline
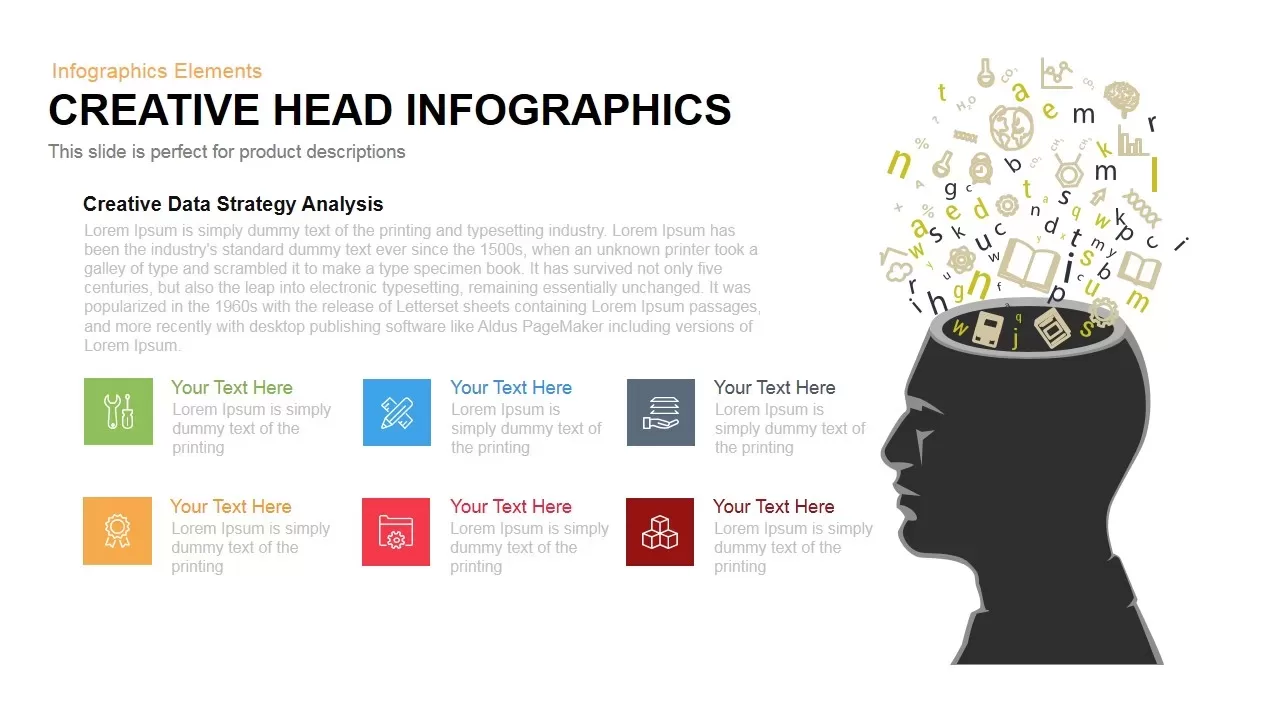
Dynamic Creative Head Infographics Template for PowerPoint & Google Slides
Circular
Creative Bar Chart template for PowerPoint & Google Slides
Charts
Creative Timeline template for PowerPoint & Google Slides
Timeline
4 Step Creative Process Diagram Template for PowerPoint & Google Slides
Infographics
4 Step Creative Circular Diagram Template for PowerPoint & Google Slides
Infographics
Six Step Creative Circular Diagram Template for PowerPoint & Google Slides
Circular
Animated Creative Timeline template for PowerPoint & Google Slides
Timeline
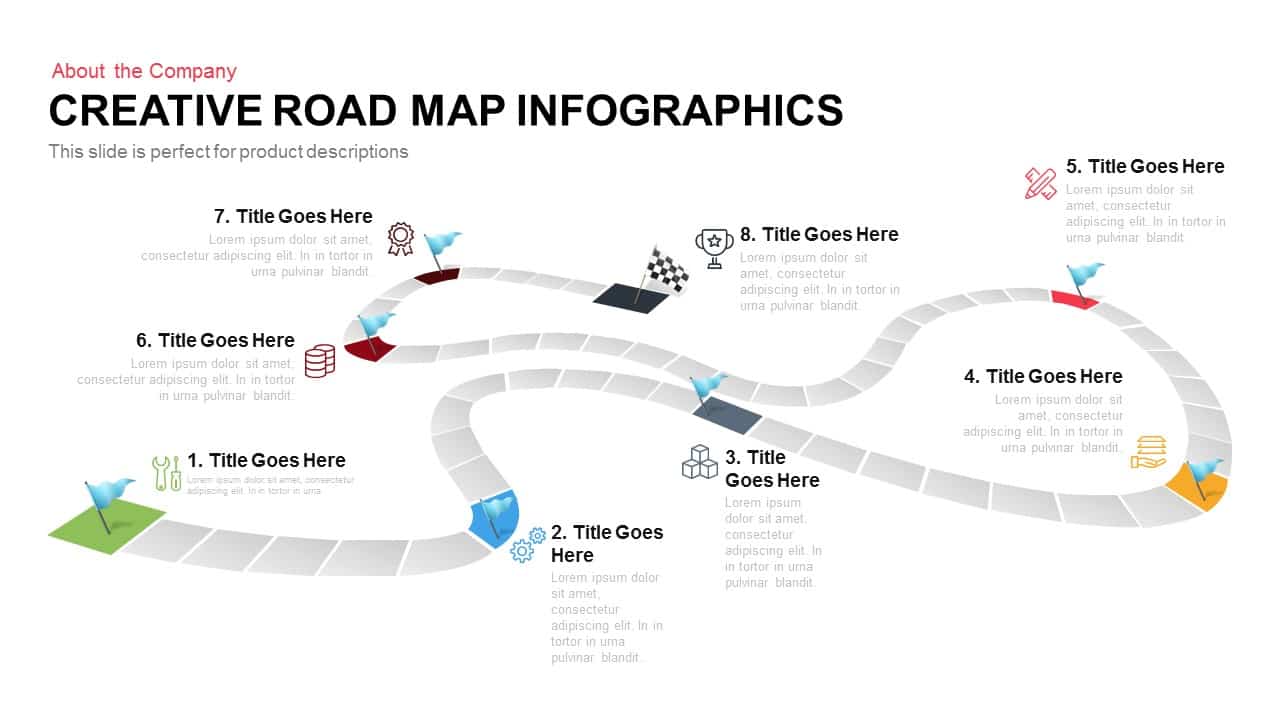
Creative Roadmap template for PowerPoint & Google Slides
Infographics
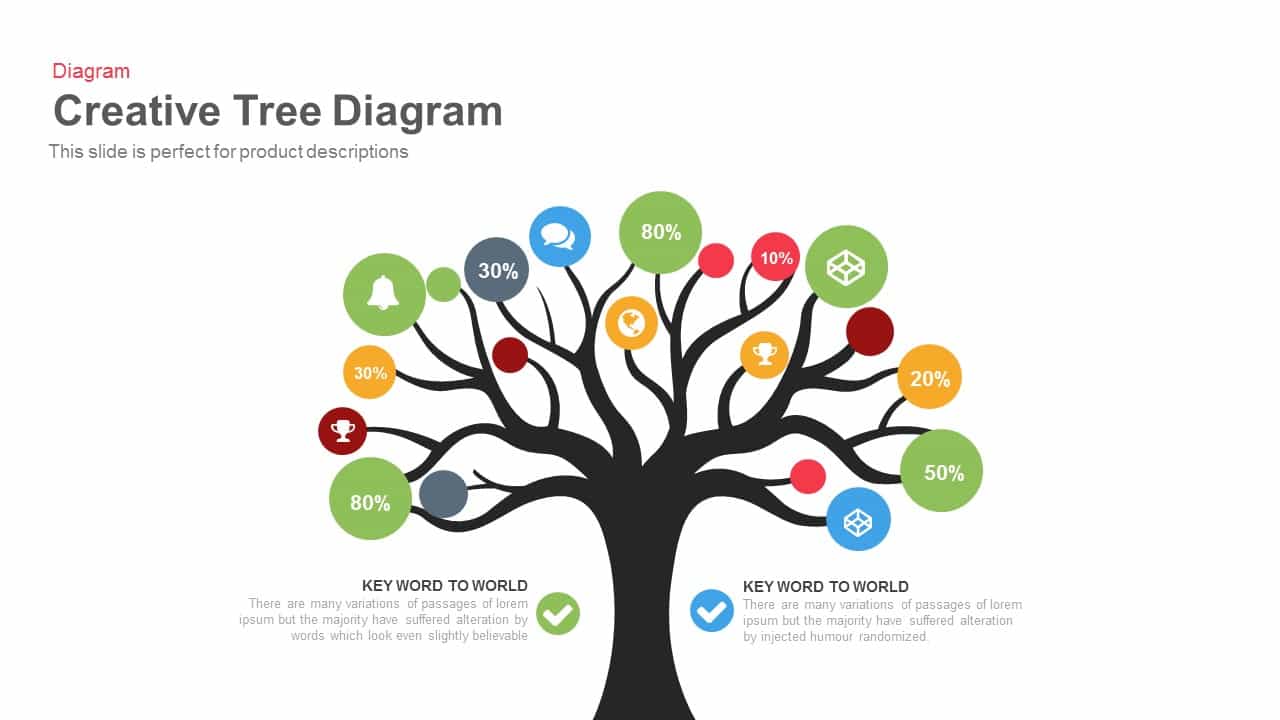
Engaging Creative Tree Diagram Slide Template for PowerPoint & Google Slides
Flow Charts
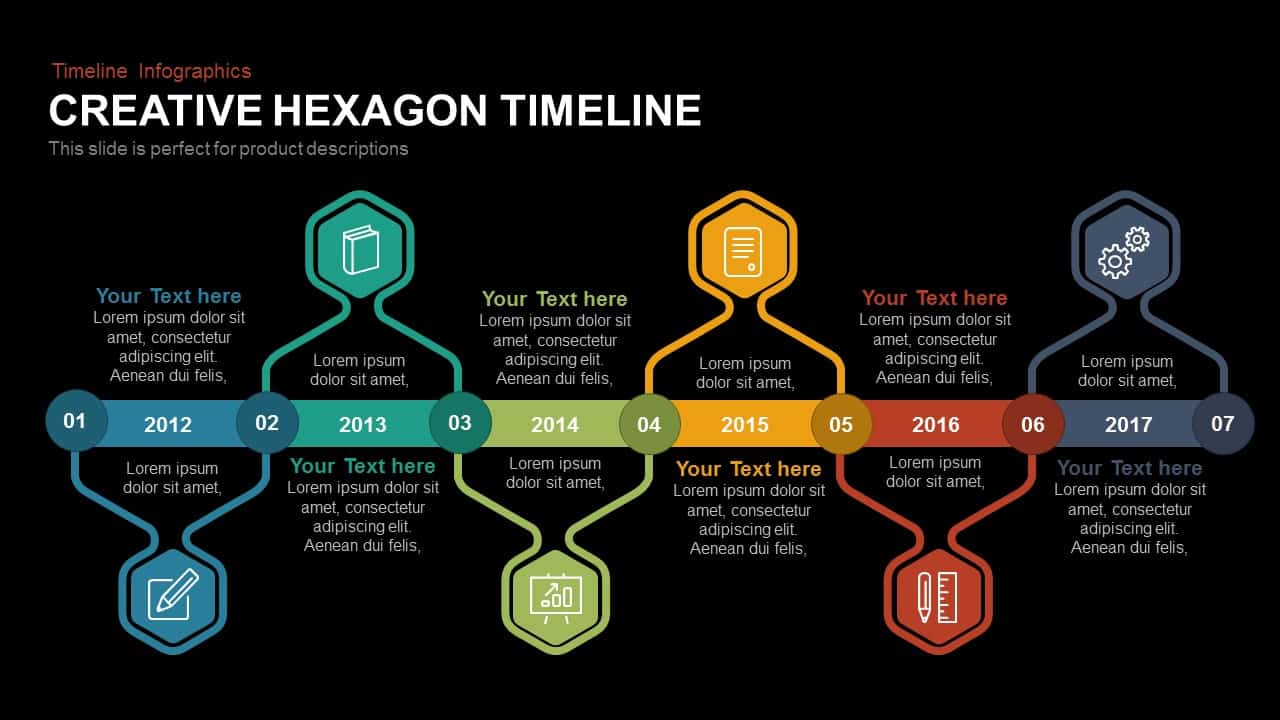
Annual Creative Hexagon Timeline Diagram Template for PowerPoint & Google Slides
Timeline
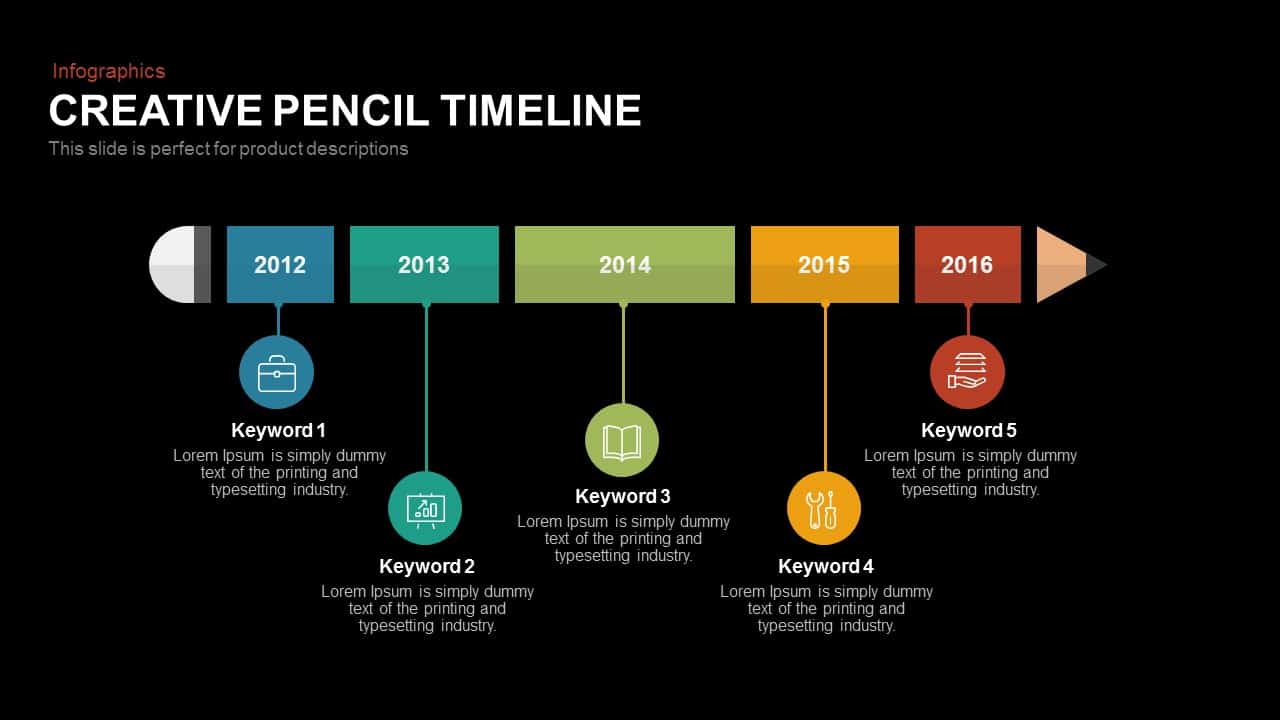
Creative Pencil Timeline Infographic Template for PowerPoint & Google Slides
Timeline
Creative Layered Oval Infographic Diagram Template for PowerPoint & Google Slides
Process
Creative Organization Chart Diagram Template for PowerPoint & Google Slides
Org Chart
Creative Organic Hub-and-Spoke Diagram template for PowerPoint & Google Slides
Circular
Creative Lab Beakers Data Infographic template for PowerPoint & Google Slides
Infographics

Creative Zigzag Circle Service Steps Template for PowerPoint & Google Slides
Process
Creative Brush Stroke Image Layouts Template for PowerPoint & Google Slides
Decks
Creative Tree Diagram with Percentages Template for PowerPoint & Google Slides
Decision Tree
Creative Bubble Timeline Infographic Template for PowerPoint & Google Slides
Timeline
Creative Tree Infographic Diagram Template for PowerPoint & Google Slides
Infographics
Creative Three-Circle Venn Diagram Template for PowerPoint & Google Slides
Comparison

PIXELS – Free Creative Presentation Template for PowerPoint & Google Slides
Pitch Deck
Free
Creative Tree Diagram Infographic Template for PowerPoint & Google Slides
Decision Tree
Creative Mind Mapping Diagram with Icons Template for PowerPoint & Google Slides
Mind Maps
Creative Tree Diagram template for PowerPoint & Google Slides
Process
Creative Cycle Process Infographics Template for PowerPoint & Google Slides
Process
Creative Strategy Diagram Template for PowerPoint & Google Slides
Business Strategy
Creative Tree Diagram Infographic Template for PowerPoint & Google Slides
Decision Tree
Creative Infinity Loop Process Diagram Template for PowerPoint & Google Slides
Process
Animated Business Trends Creative Deck Template for PowerPoint & Google Slides
Pitch Deck
Versatile Creative Diagram Infographics Template for PowerPoint & Google Slides
Process
Creative Tips Slide Template for PowerPoint & Google Slides
Business
Creative Organizational Chart Template for PowerPoint & Google Slides
Org Chart
Free Helooo Creative Company Profile Template for PowerPoint & Google Slides
Company Profile
Free
Creative Blue Blobs Abstract Title Slide Template for PowerPoint & Google Slides
Company Profile
Pop Art Creative Presentation Template for PowerPoint & Google Slides
Decks
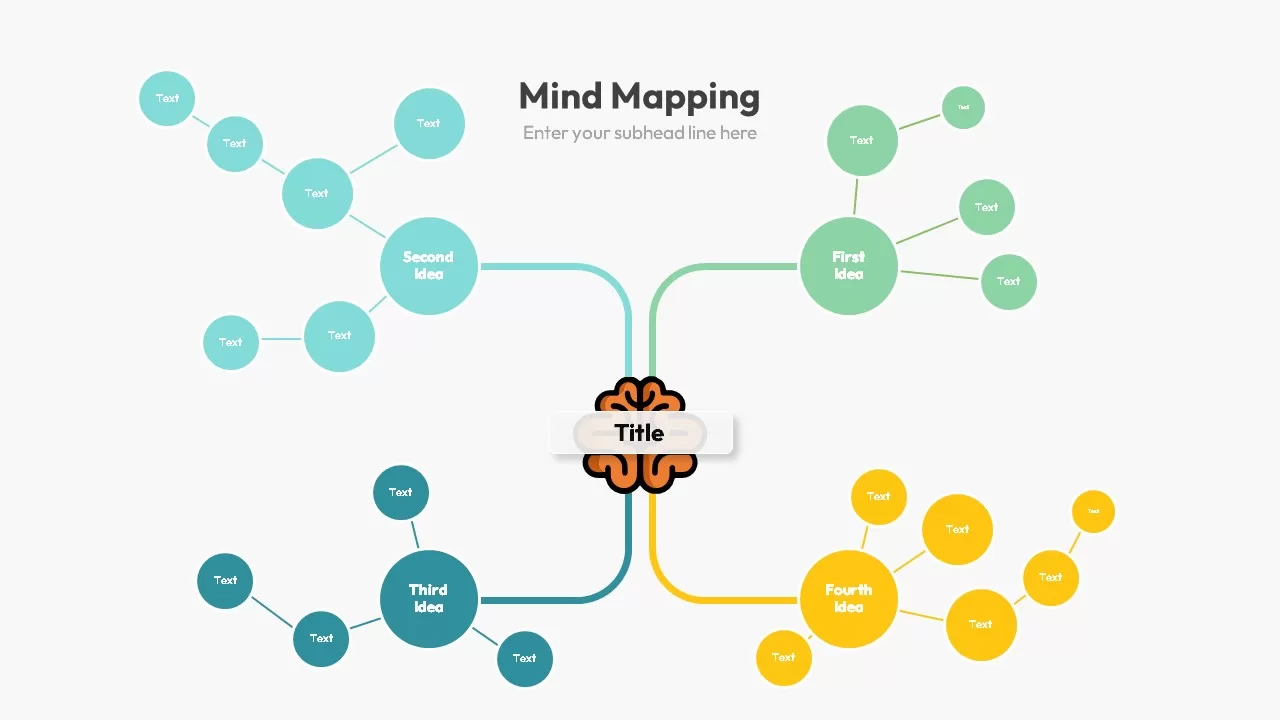
Creative Mind Mapping Template for PowerPoint & Google Slides
Mind Maps
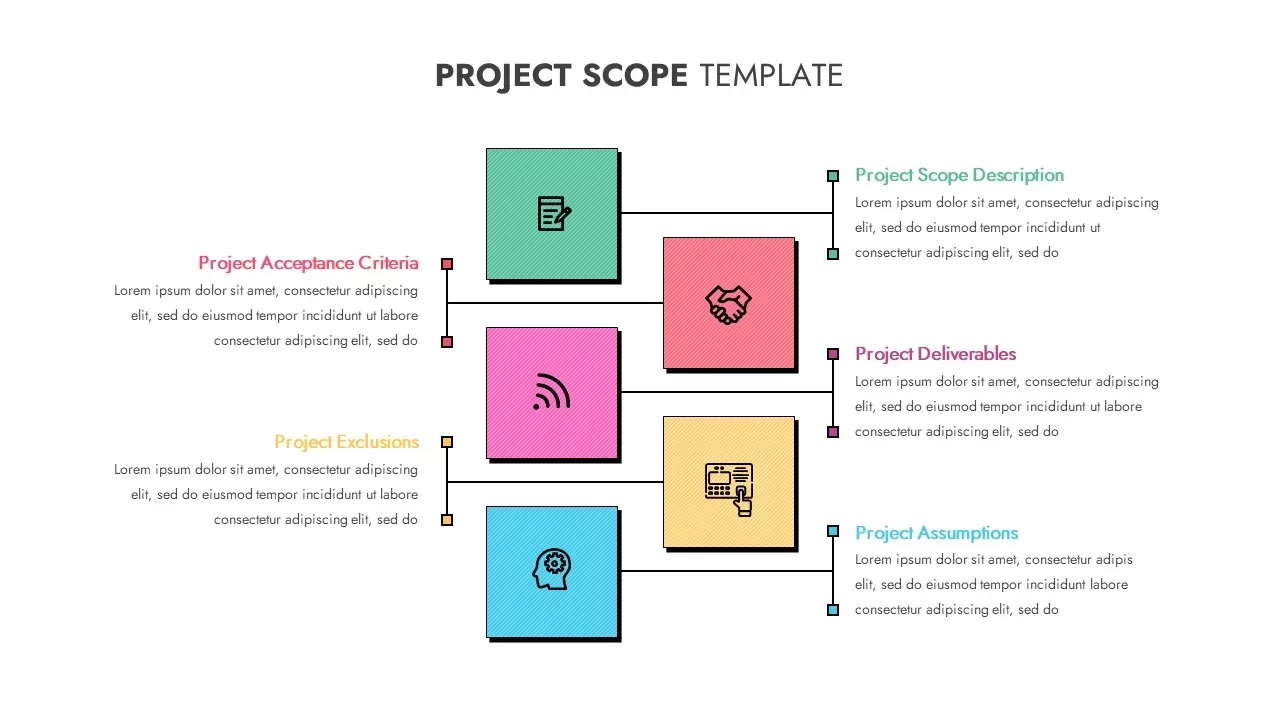
Creative Project Scope Template for PowerPoint & Google Slides
Project
Creative Polaroid Collage Photo Slide Template for PowerPoint & Google Slides
Graphics
Creative Photo Collage Grid Layout Template for PowerPoint & Google Slides
Graphics

Creative Portfolio Showcase Presentation Template for PowerPoint & Google Slides
Decks
Creative Brainstorming Process Diagram Template for PowerPoint & Google Slides
Process
Creative Agency Visual Portfolio Template for PowerPoint & Google Slides
Company Profile
Creative Team Introduction template for PowerPoint & Google Slides
Our Team

Modern Creative Business Pitch Deck Template for PowerPoint & Google Slides
Pitch Deck
Memphis Style Creative Presentation Template for PowerPoint & Google Slides
Pitch Deck
Creative Chocolate Marketing Deck Template for PowerPoint & Google Slides
Company Profile
Creative Books Theme Presentation Template for PowerPoint & Google Slides
Pitch Deck
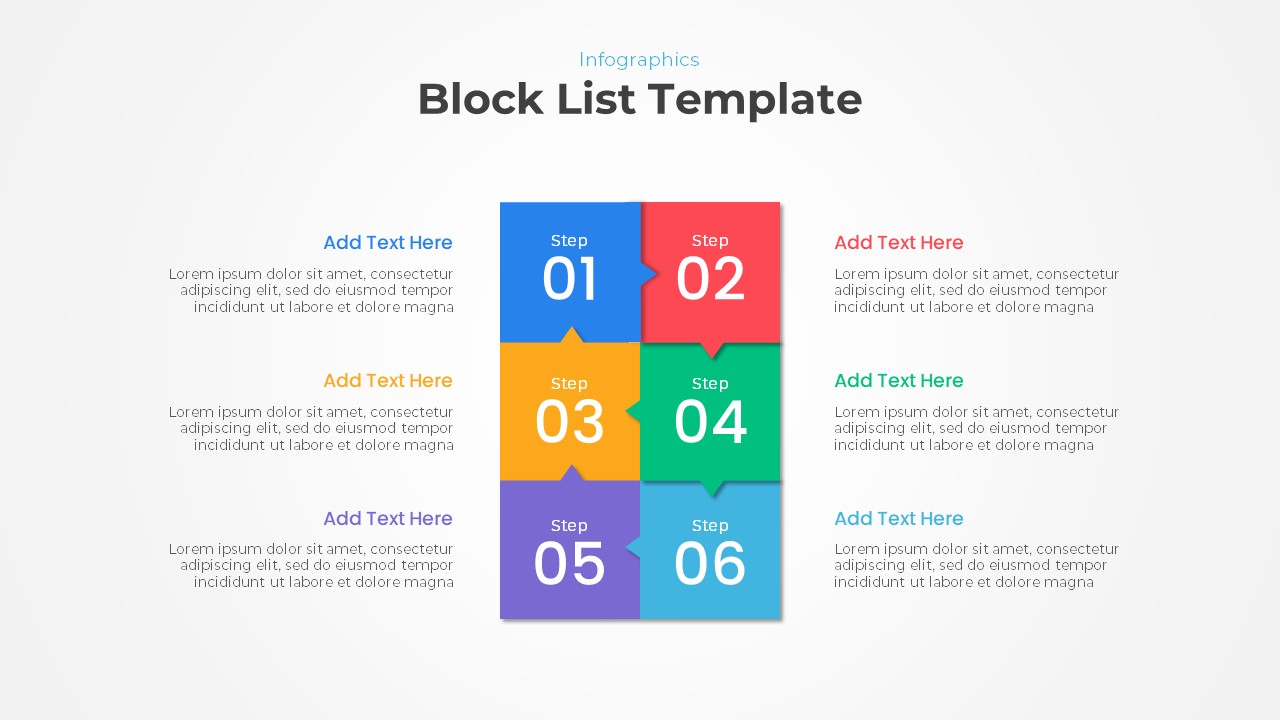
Creative Block List Infographic Template for PowerPoint & Google Slides
Agenda
Creative Power Analogy Metaphor Slide Template for PowerPoint & Google Slides
Leadership
Colorful Creative Presentation Deck Template for PowerPoint & Google Slides
Company Profile
Creative Doodle Transportation Theme Template for PowerPoint & Google Slides
Pitch Deck
Creative Host Introduction Slide Template for PowerPoint & Google Slides
Our Team
Creative Clothing Line Presentation Template for PowerPoint & Google Slides
Pitch Deck
Creative Influencer Marketing Framework Template for PowerPoint & Google Slides
Digital Marketing
Creative Project Roadmap template for PowerPoint & Google Slides
Business
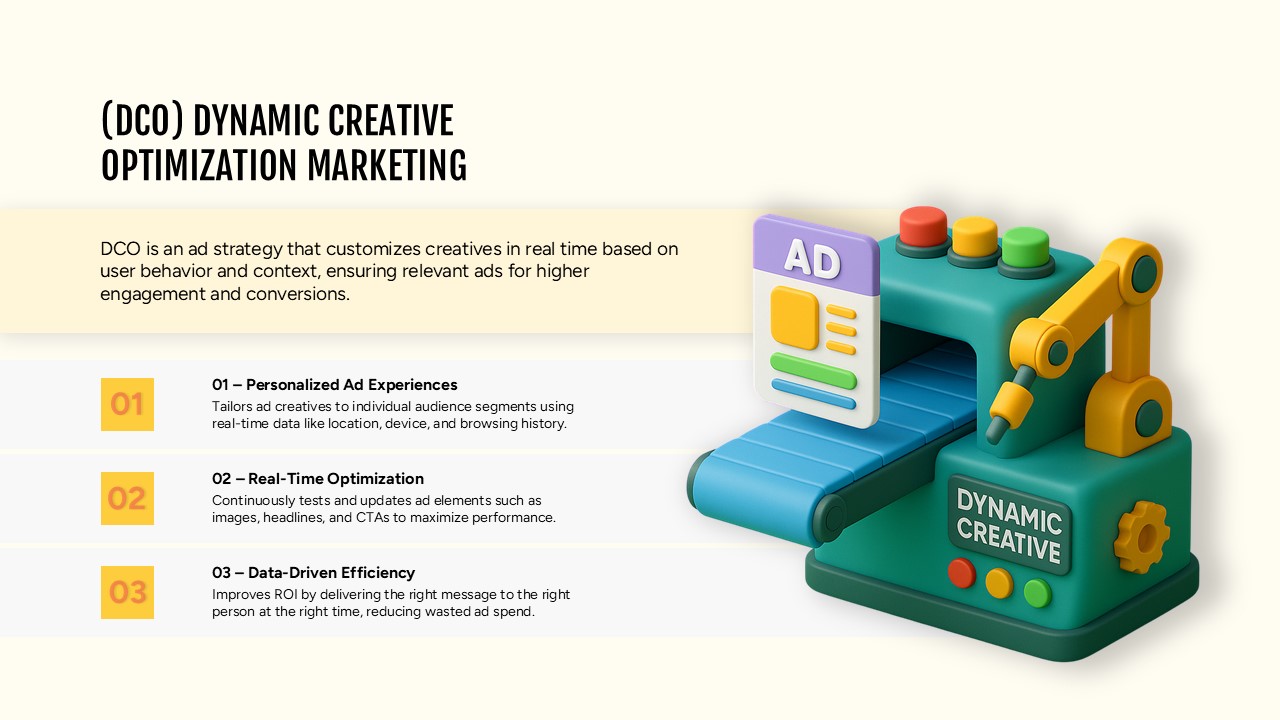
Dynamic Creative Optimization Marketing Template for PowerPoint & Google Slides
Digital Marketing
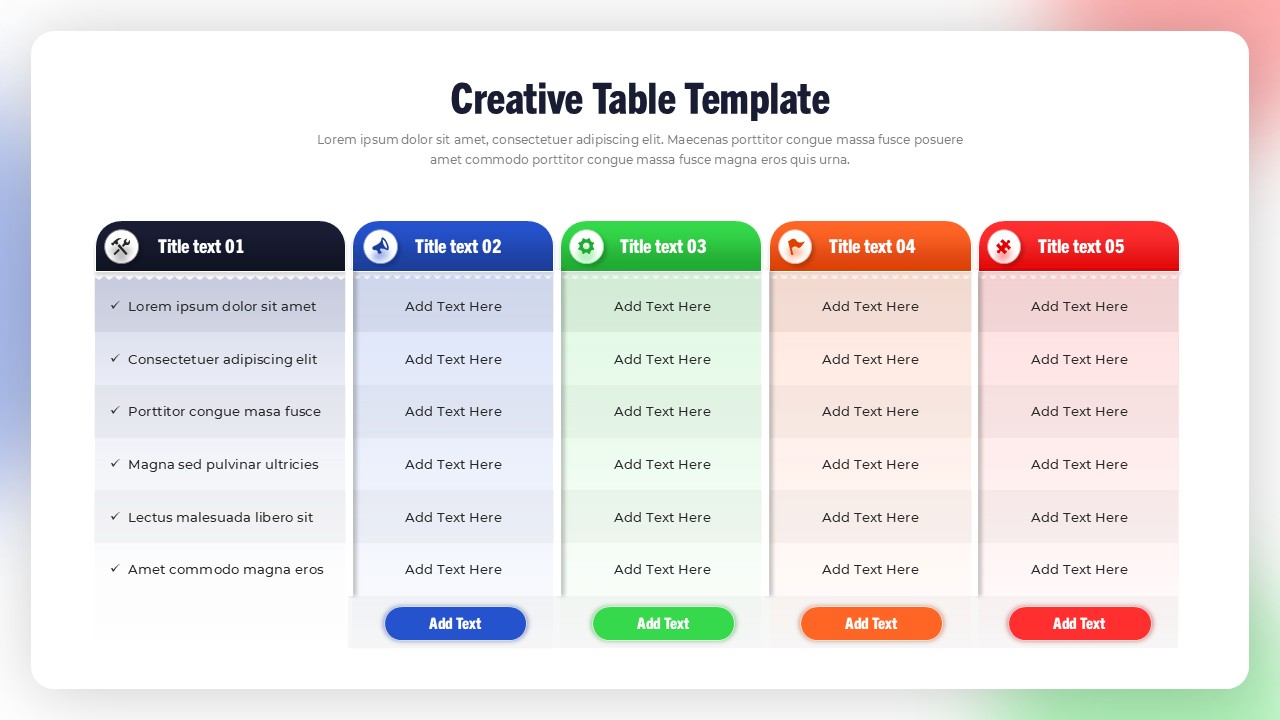
Creative Table Template for PowerPoint & Google Slides
Table
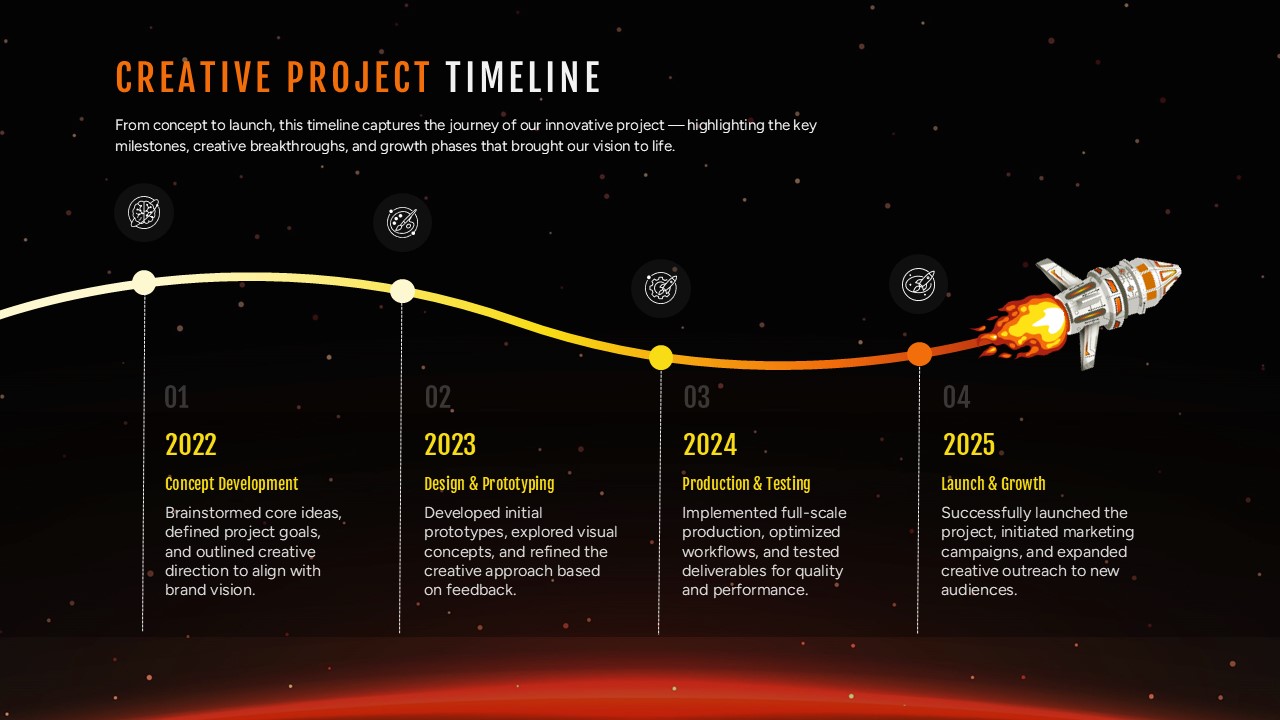
Creative Project Timeline Roadmap Template for PowerPoint & Google Slides
Timeline
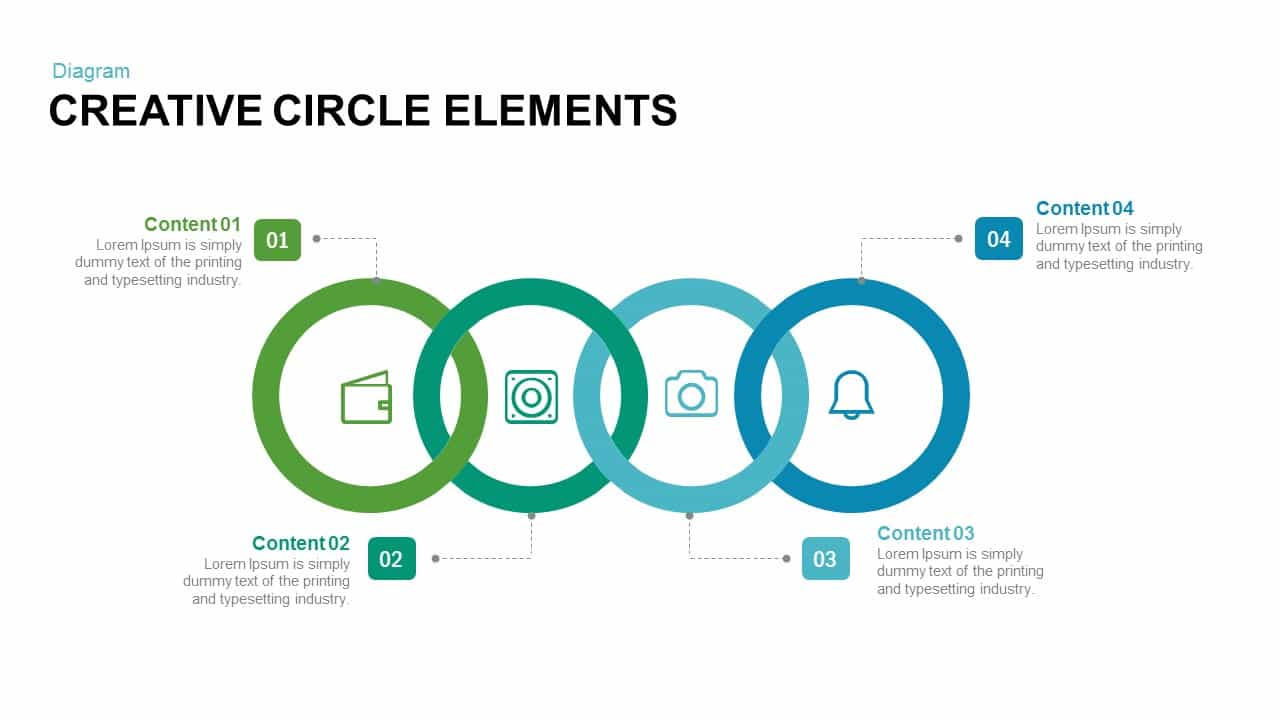
Creative Circle Elements for PowerPoint & Google Slides
Infographics
Free Helios Creative Business Deck for PowerPoint & Google Slides
Business
Free
3 Step Creative Circular Diagram for PowerPoint & Google Slides
Process
Creative Abstract Theme for PowerPoint & Google Slides
Decks
Creative Meet Our Team Presentation Slide for PowerPoint & Google Slides
Our Team
Creative New Year Resolution Planner for PowerPoint & Google Slides
Leadership
Free
Mind Map PowerPoint template for PowerPoint & Google Slides
Mind Maps
Editable Colombia Map PowerPoint Template for PowerPoint & Google Slides
Business Models
Mexico Map With States Template for PowerPoint & Google Slides
World Maps
Colorful Mind Map with Icons Template for PowerPoint & Google Slides
Mind Maps