Comparative Analysis Template for PowerPoint & Google Slides
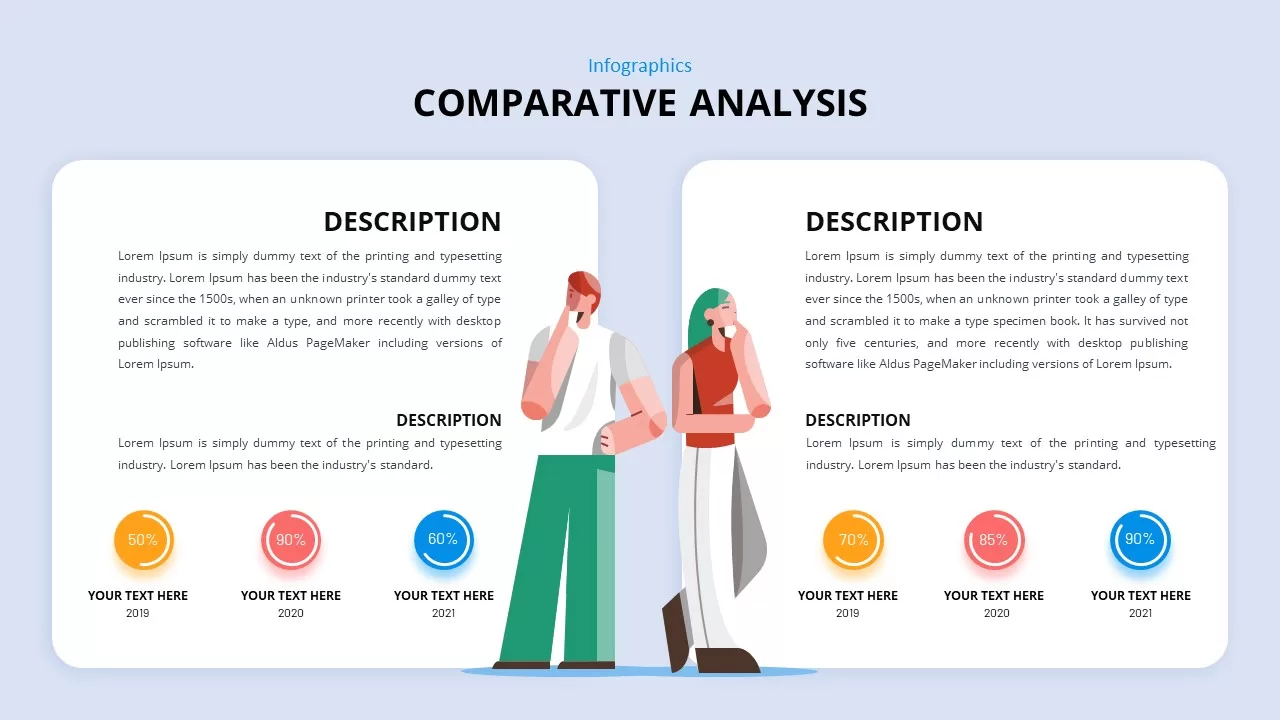
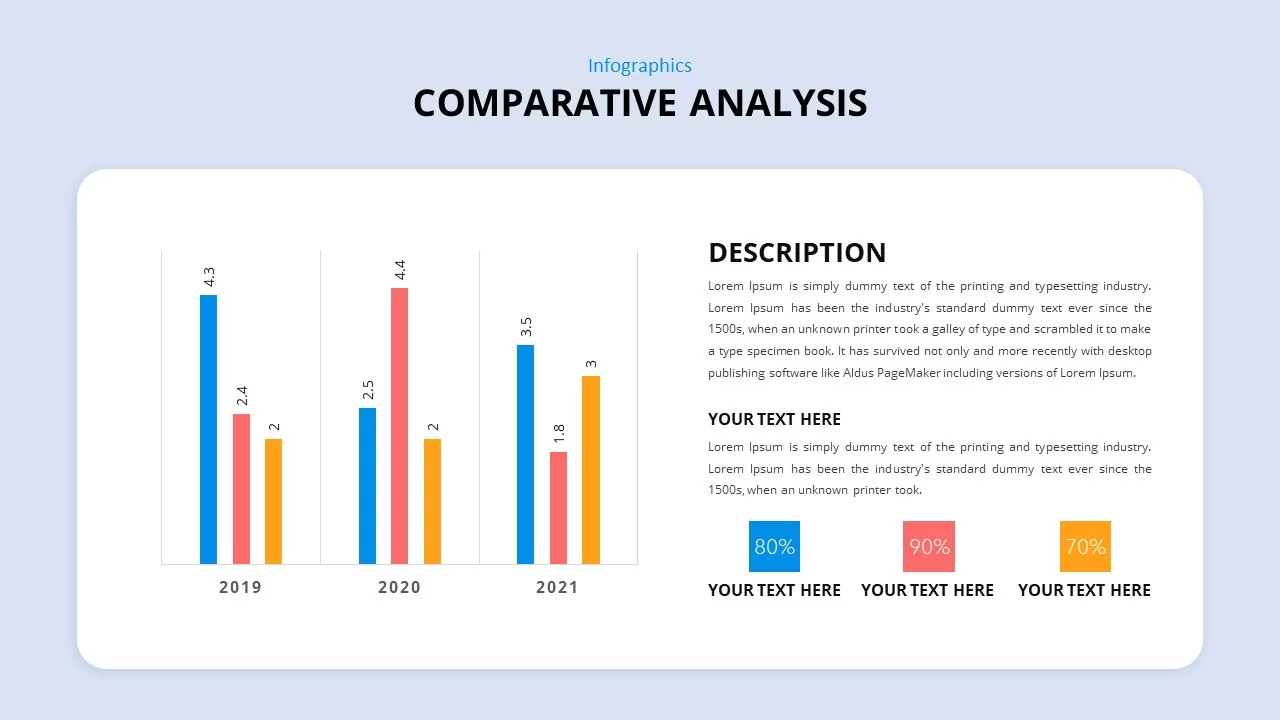
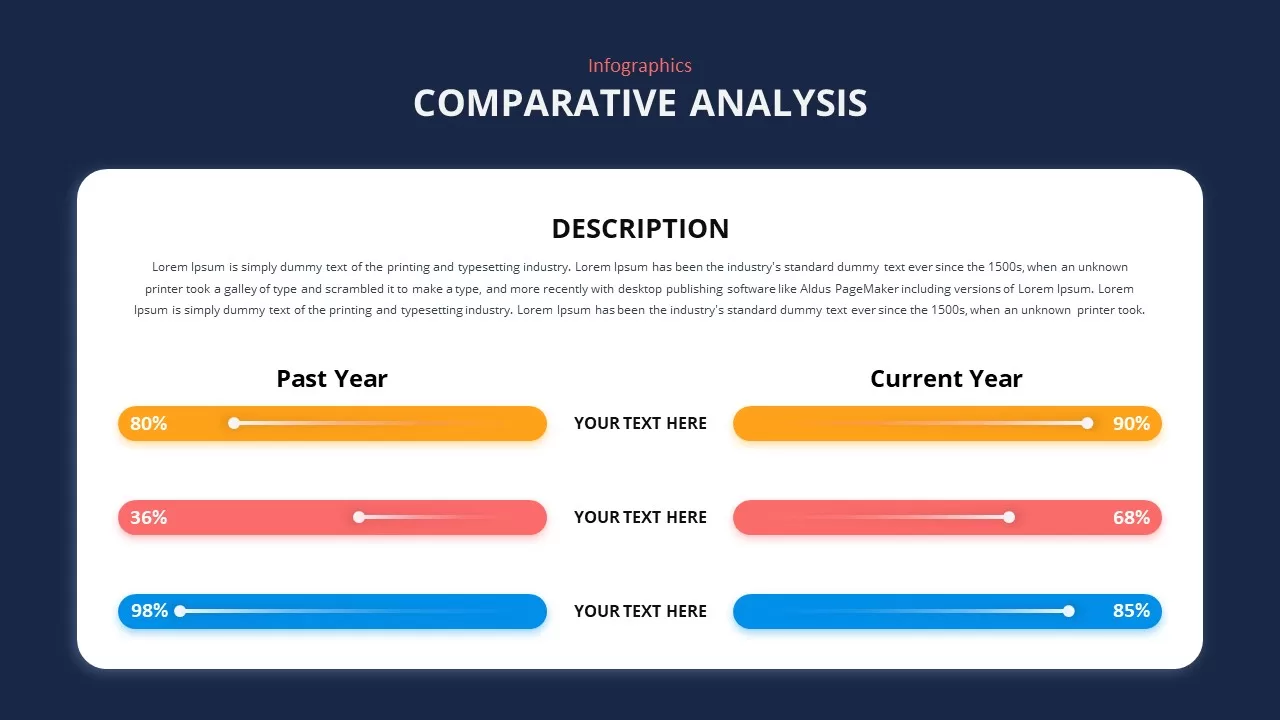
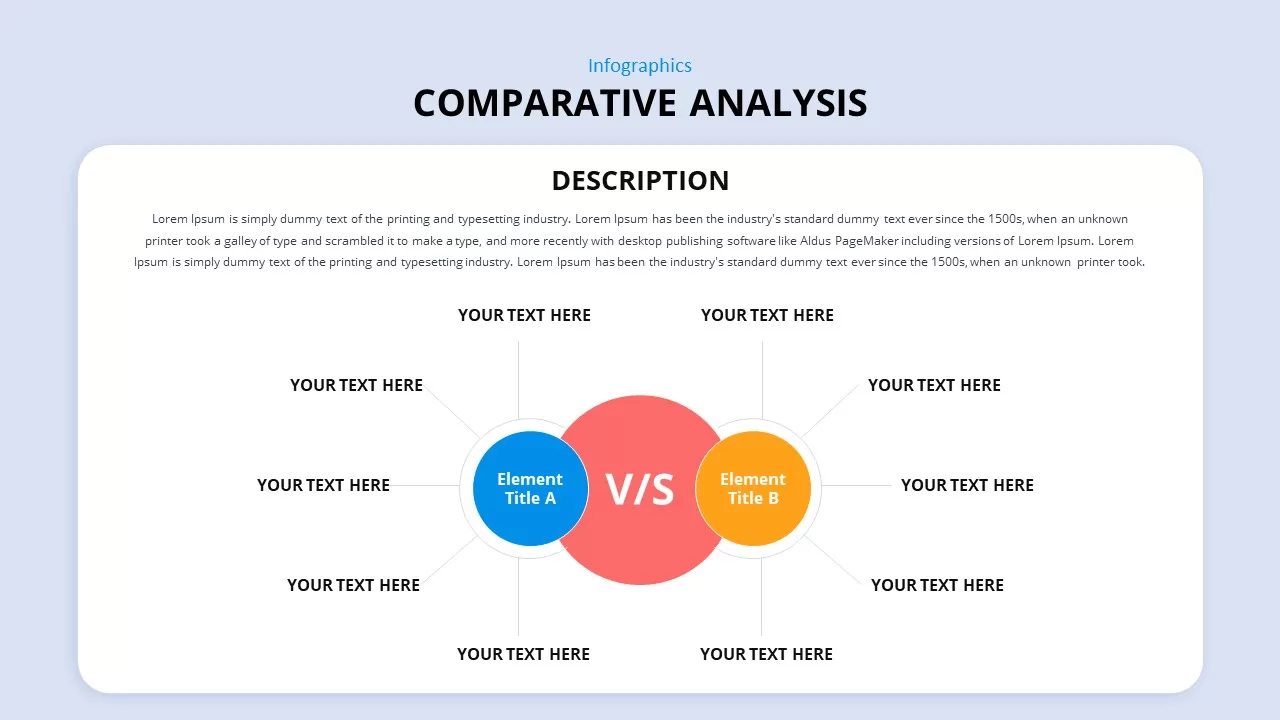
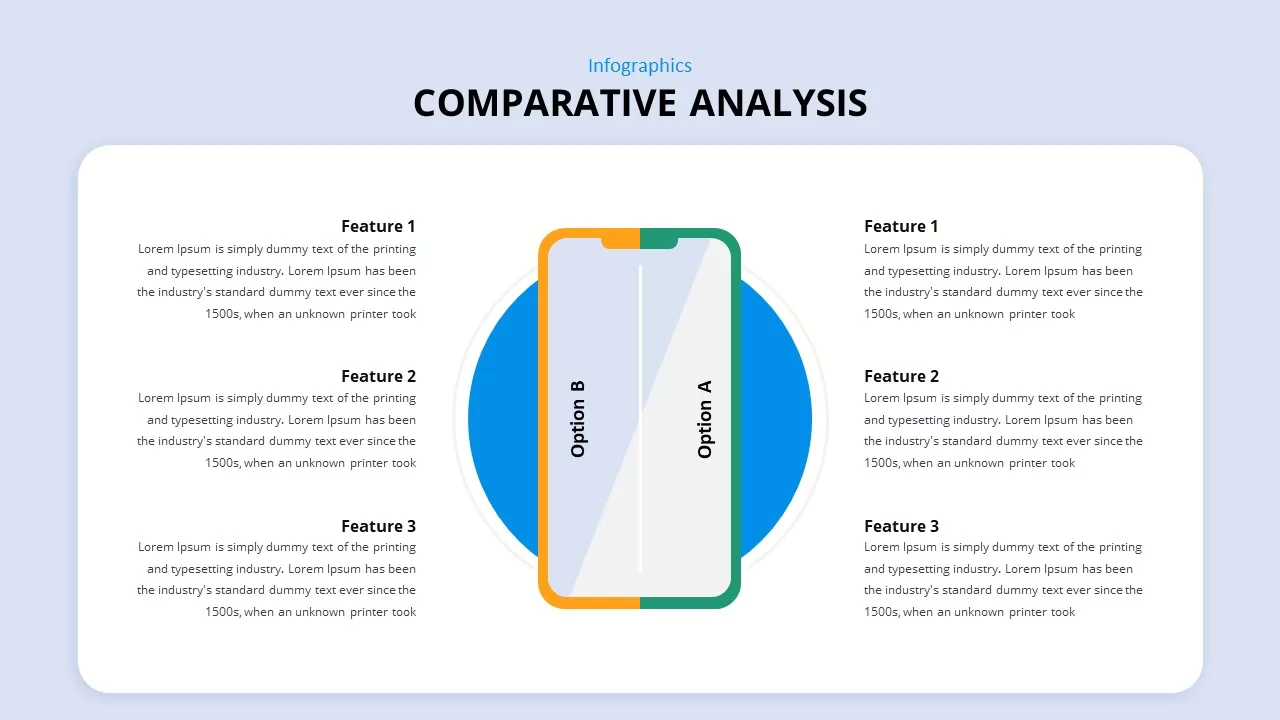
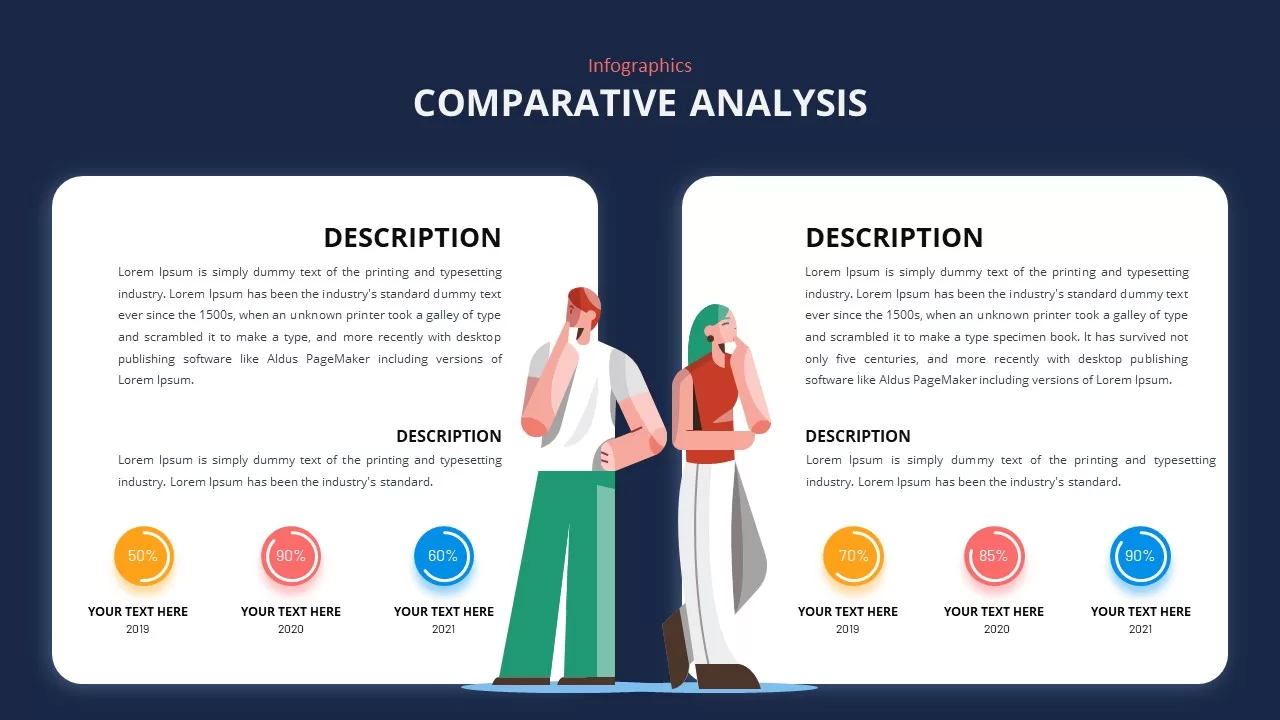
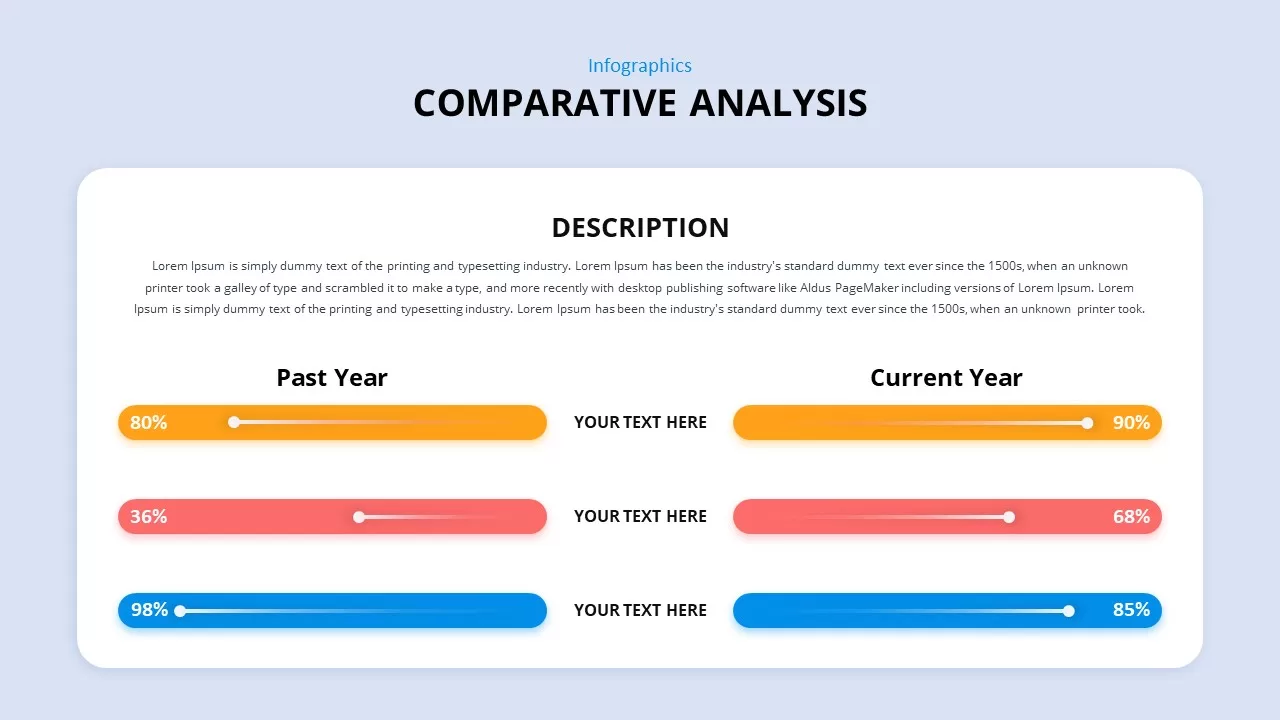


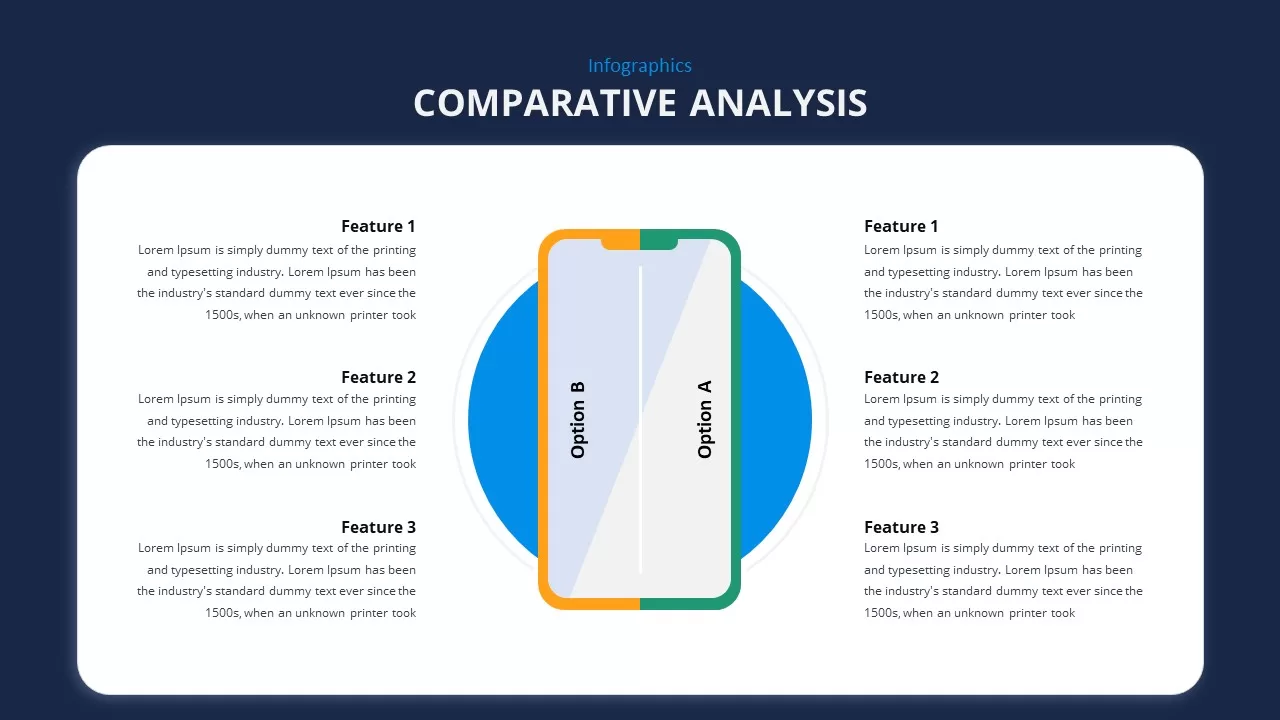
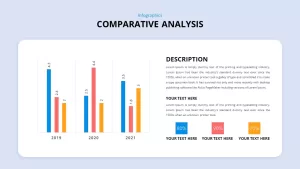
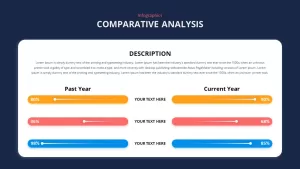
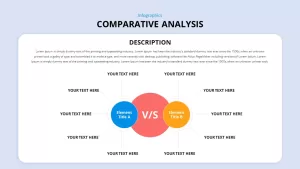
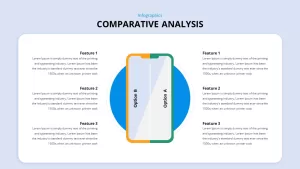
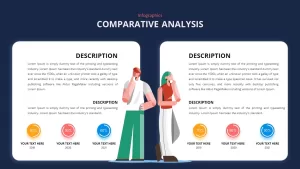
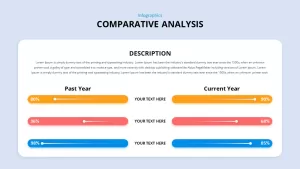
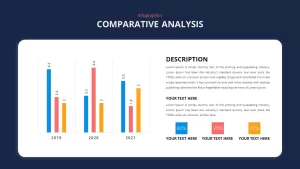
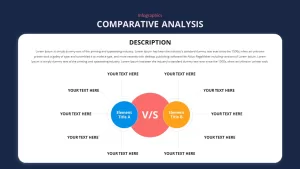
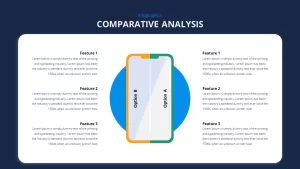
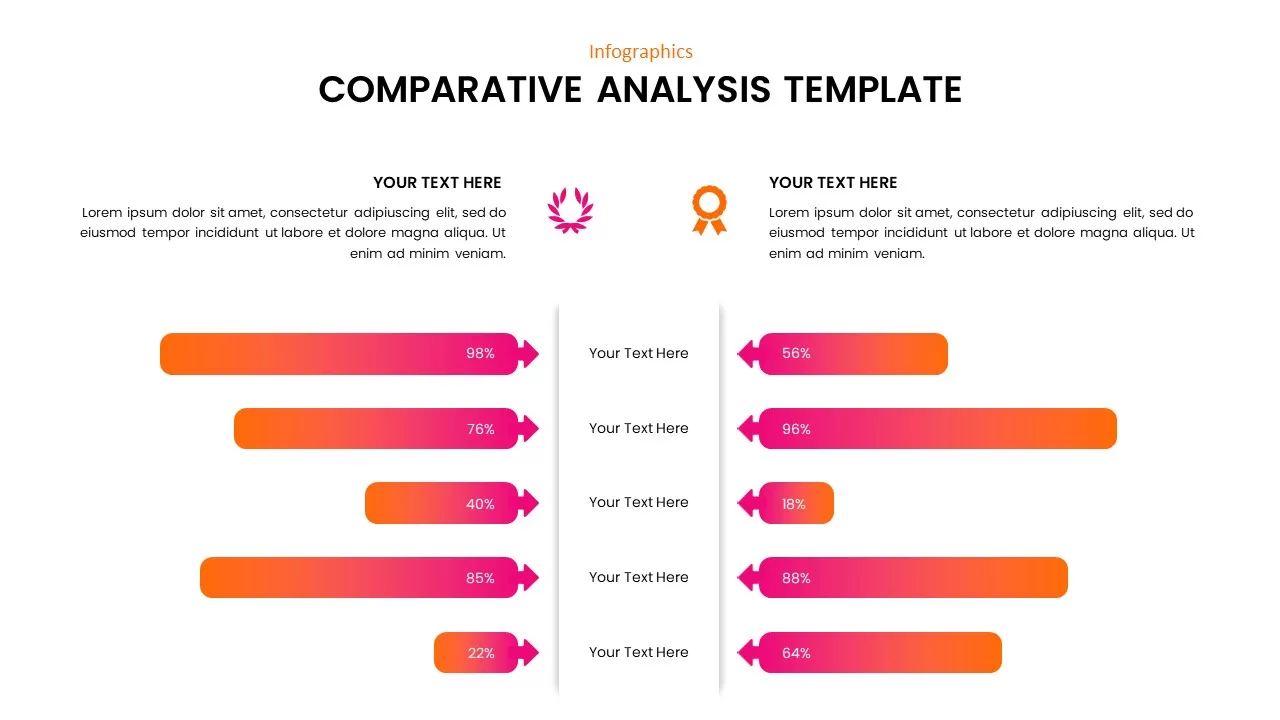
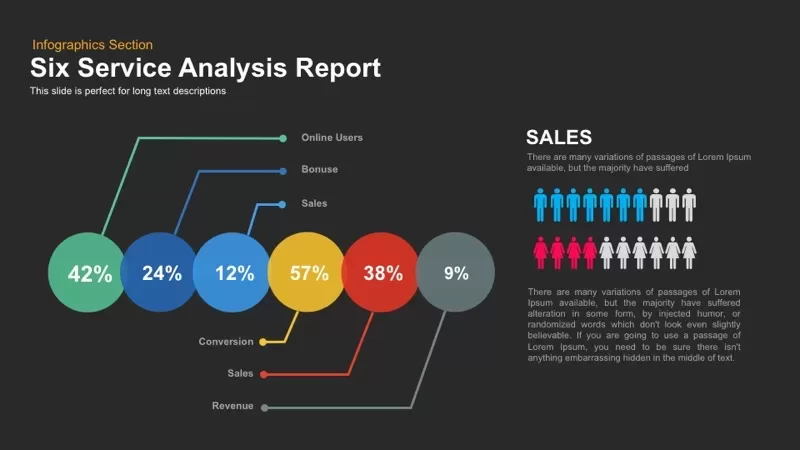
This comparative analysis slide provides a visually engaging and intuitive framework for contrasting multiple elements, making it ideal for showing performance, features, or trends over different periods or categories. The template offers a range of variations, including side-by-side comparisons, bar charts, and percentage-based analyses. Whether you’re comparing key metrics between two products, performance over time, or year-to-year statistics, this slide organizes data into clear, concise blocks, with customizable labels for text and visual elements.
The colorful design features contrasting sections, including circular icons with percentage indicators, bar graphs, and slider controls, each corresponding to a different comparative variable. The visually distinct colors (blue, red, orange, and yellow) make it easy for audiences to follow each comparison, while the modern and minimal design ensures clarity and visual appeal.
Perfect for boardroom presentations, sales pitches, or strategic workshops, this template allows users to easily insert their own data, tweak the color scheme, and adapt text blocks without losing the integrity of the layout. The slide is fully compatible with both PowerPoint and Google Slides, ensuring high-resolution output for smooth presentations across devices and platforms.
Who is it for
Ideal for business analysts, project managers, and marketing professionals, this comparative analysis slide is perfect for presentations involving competitive analysis, market research, performance tracking, or strategic reviews. It also serves well for academic purposes, where comparisons between different models or approaches are necessary.
Other Uses
Beyond traditional comparative analysis, use this slide to compare project milestones, product features, or market trends over time. It’s also a useful tool for showing pros and cons, analyzing competitor data, or illustrating a before-and-after scenario.
Login to download this file

Item ID
SB02041
Related Templates

Comparative Analysis template for PowerPoint & Google Slides
Business Report
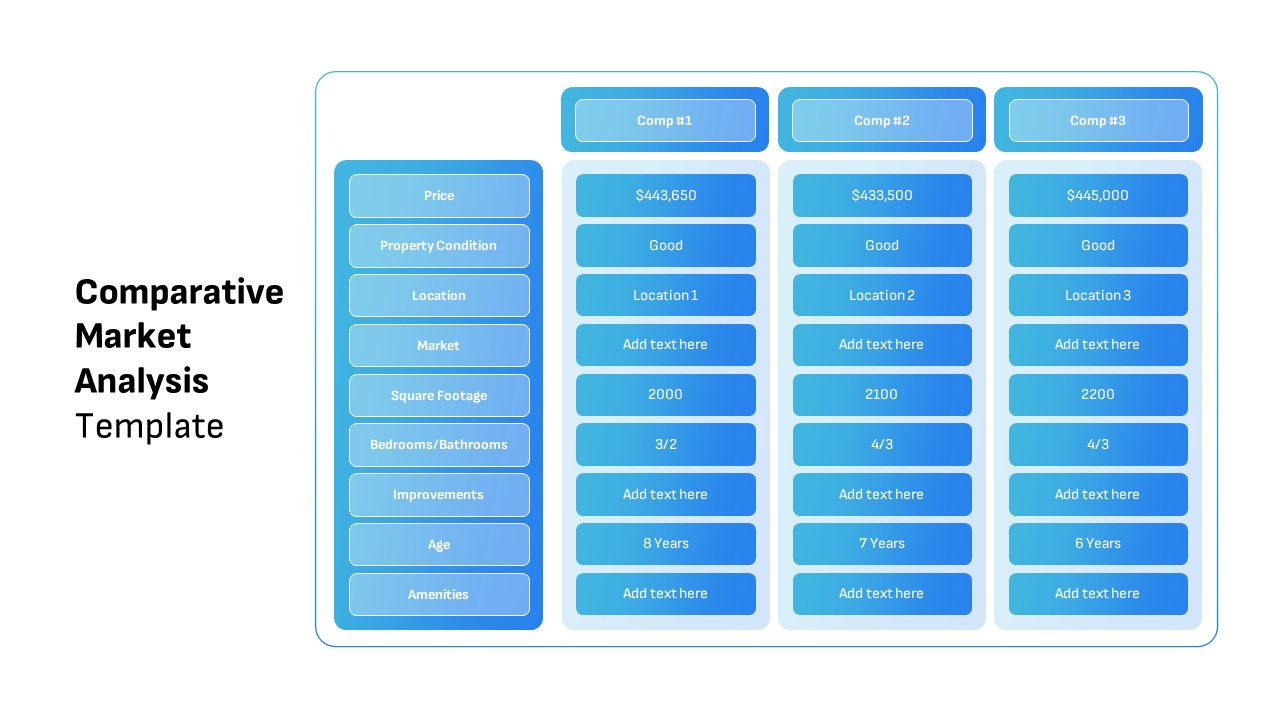
Comparative Market Analysis Template for PowerPoint & Google Slides
Comparison

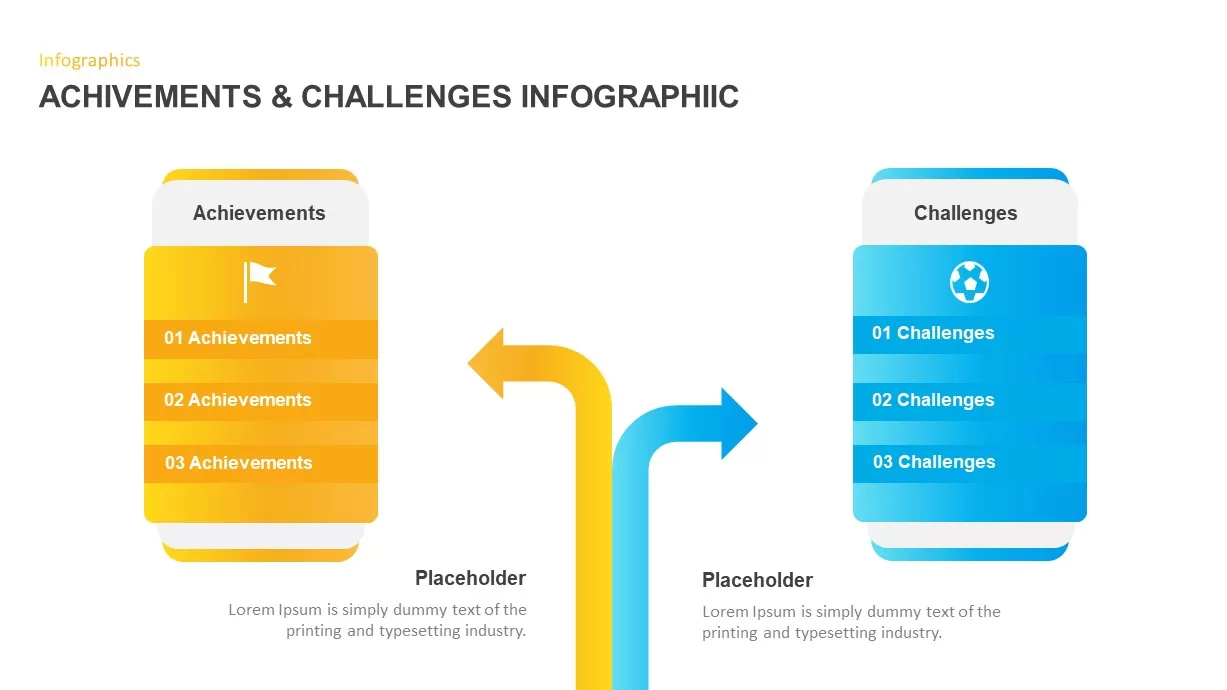
Achievements and Challenges Comparative Infographic Template for PowerPoint & Google Slides
Opportunities Challenges
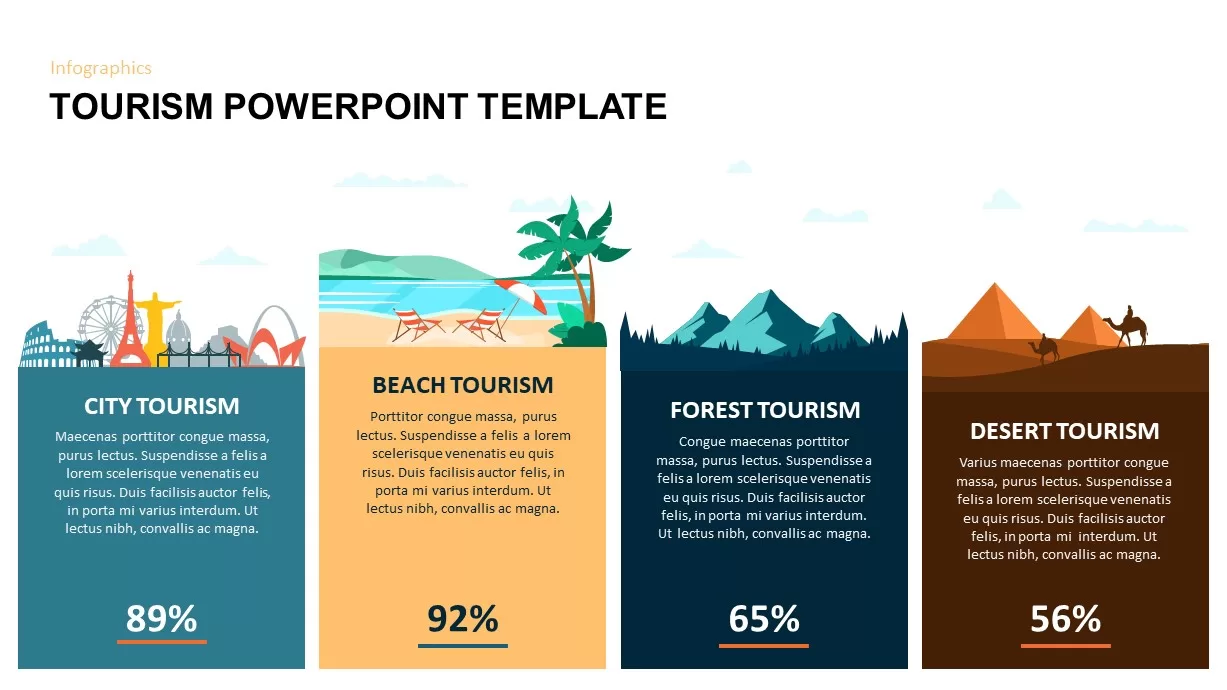
Comparative Tourism Infographics Template for PowerPoint & Google Slides
Comparison
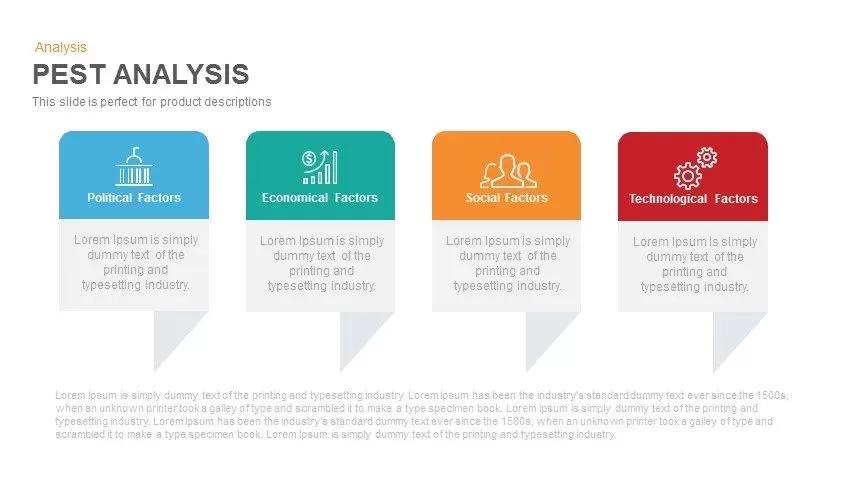
PEST Analysis PowerPoint Template for PowerPoint & Google Slides
Business Strategy
Donut Split Analysis template for PowerPoint & Google Slides
Pie/Donut
Line Graph Analysis template for PowerPoint & Google Slides
Charts

Six Service Analysis Report template for PowerPoint & Google Slides
Infographics
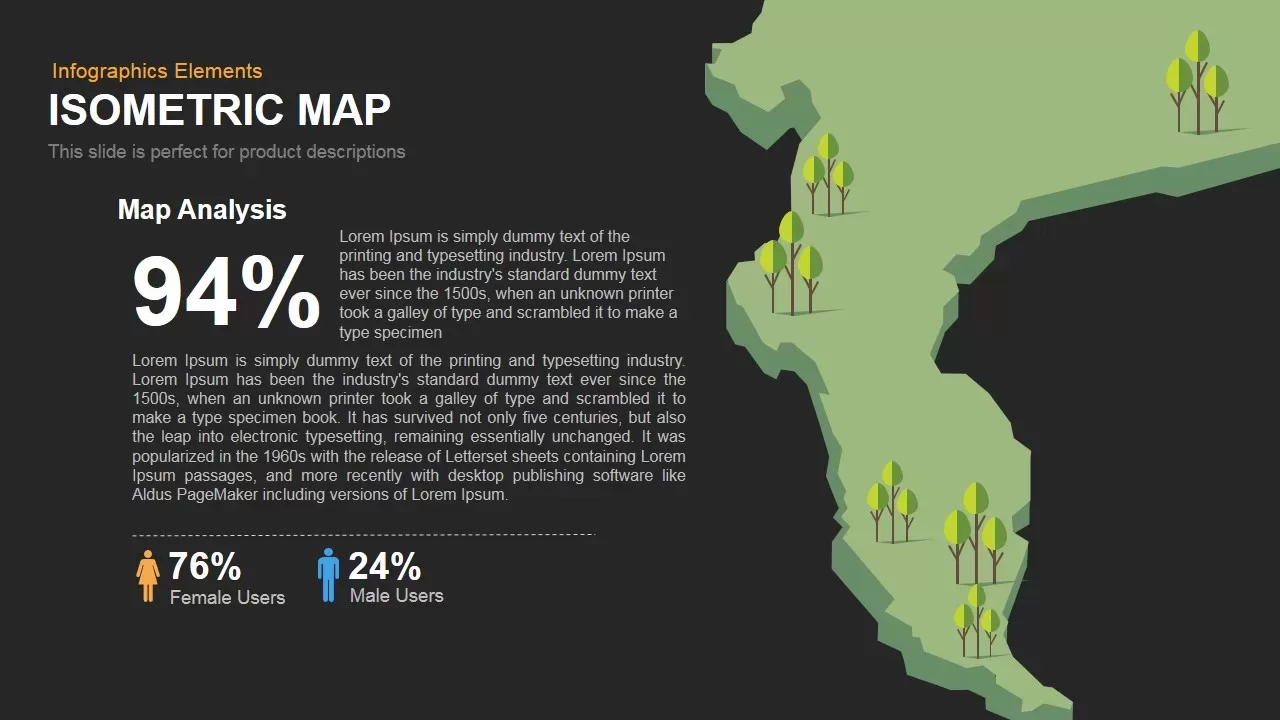
Isometric Map Analysis Slide Template for PowerPoint & Google Slides
World Maps
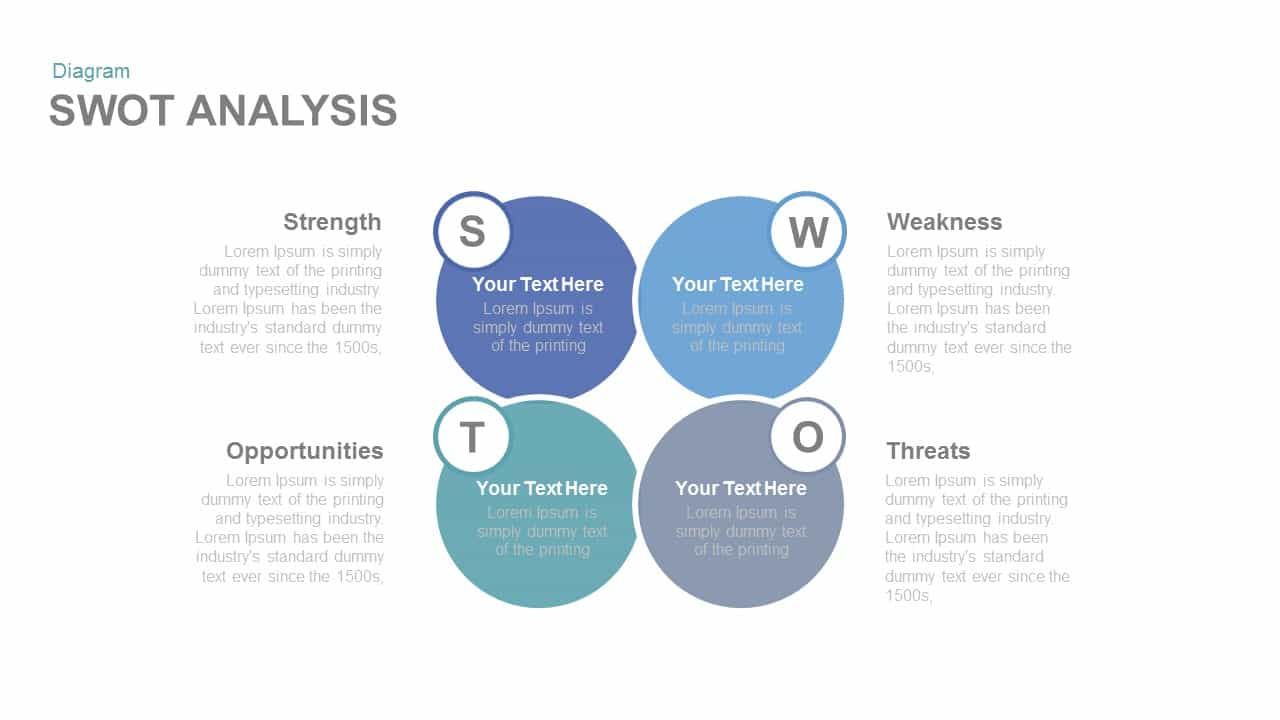
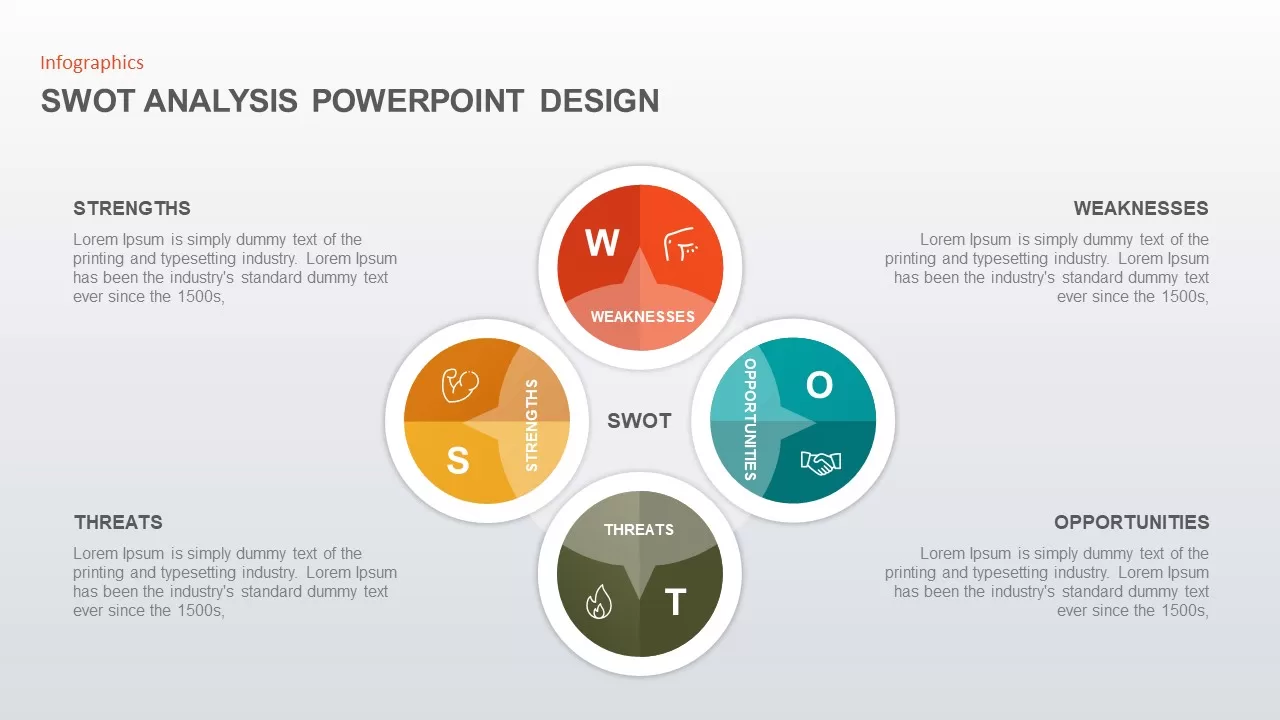
Modern Circle SWOT Analysis Diagram Template for PowerPoint & Google Slides
SWOT
E-Learning Report Analysis Template for PowerPoint & Google Slides
Infographics
Pencil Bar Chart Data Analysis Template for PowerPoint & Google Slides
Bar/Column

PEST Analysis Template for PowerPoint & Google Slides
PEST
PESTLE Analysis Deck Template for PowerPoint & Google Slides
Decks
Free SWOT Analysis template for PowerPoint & Google Slides
SWOT
Free
Puzzle-Style SWOT Analysis Table Diagram Template for PowerPoint & Google Slides
SWOT
PEST Analysis Circular Diagram Template for PowerPoint & Google Slides
PEST
SWOT Analysis Gear Diagram Slide Template for PowerPoint & Google Slides
SWOT

Interactive Gap Analysis Puzzle Diagram Template for PowerPoint & Google Slides
Gap
Employee Skill Analysis Dashboard Template for PowerPoint & Google Slides
Employee Performance
Modern Noise Analysis Infographic Template for PowerPoint & Google Slides
Process
Four-Quadrant SWOT Analysis Diagram Template for PowerPoint & Google Slides
SWOT
Interactive 3D Puzzle SWOT Analysis Slide Template for PowerPoint & Google Slides
SWOT
Team Building Hub-and-Spoke Analysis Template for PowerPoint & Google Slides
Process
Four-Part SWOT Analysis Diagram Template for PowerPoint & Google Slides
SWOT
Illustrated Business SWOT Analysis Template for PowerPoint & Google Slides
SWOT
Fishbone Cause Analysis Diagram Template for PowerPoint & Google Slides
Process
SWOT Analysis Petal Infographic Template for PowerPoint & Google Slides
SWOT
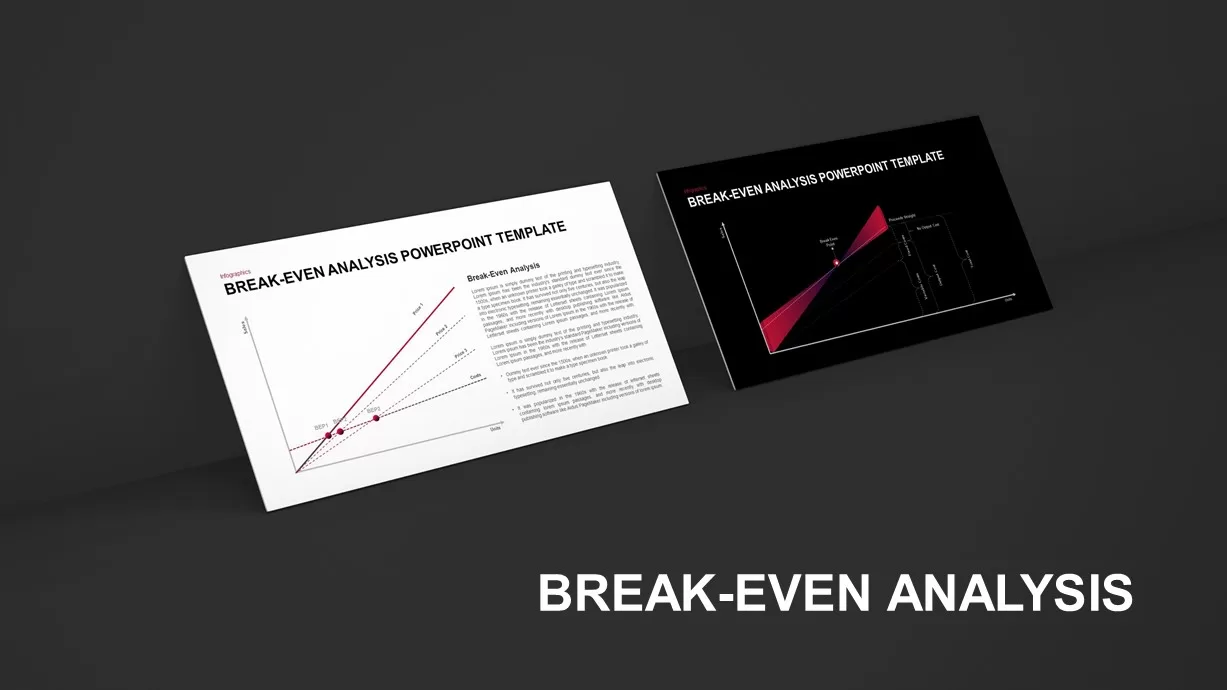
Break-Even Analysis template for PowerPoint & Google Slides
Process
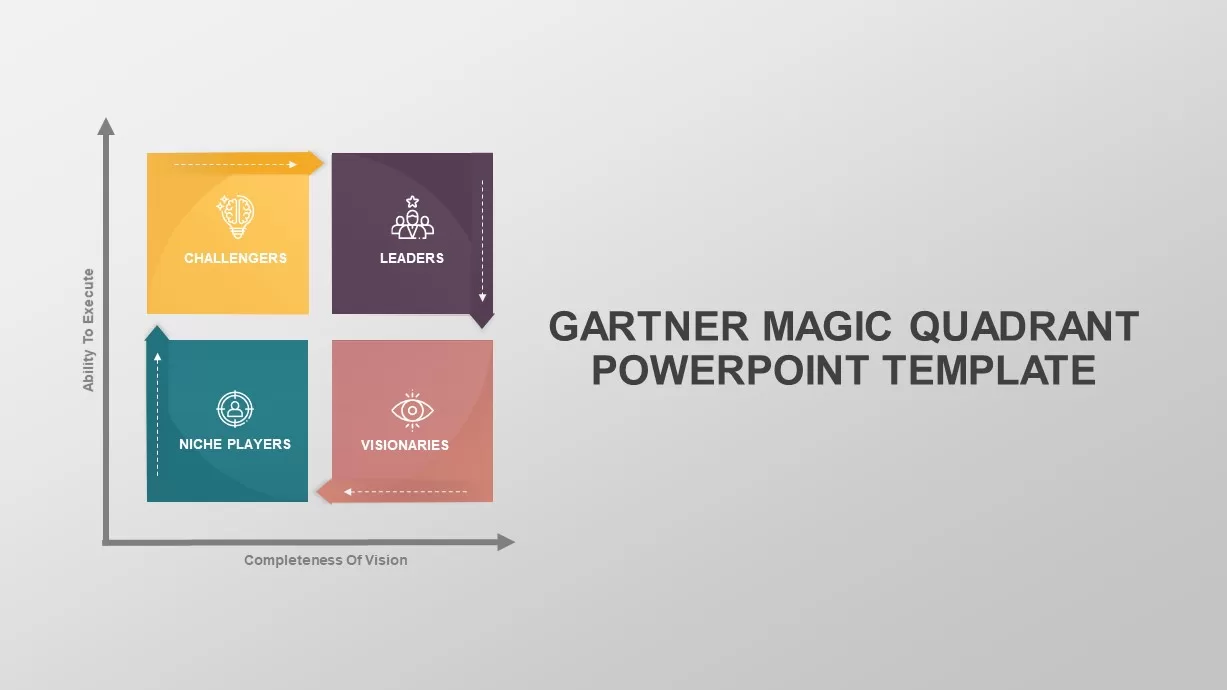
Gartner Magic Quadrant Analysis Template for PowerPoint & Google Slides
Business
Root Cause Analysis PowerPoint & Google Slides Template for Presentations
Business Strategy
SWOT Analysis Circular Infographic Template for PowerPoint & Google Slides
SWOT
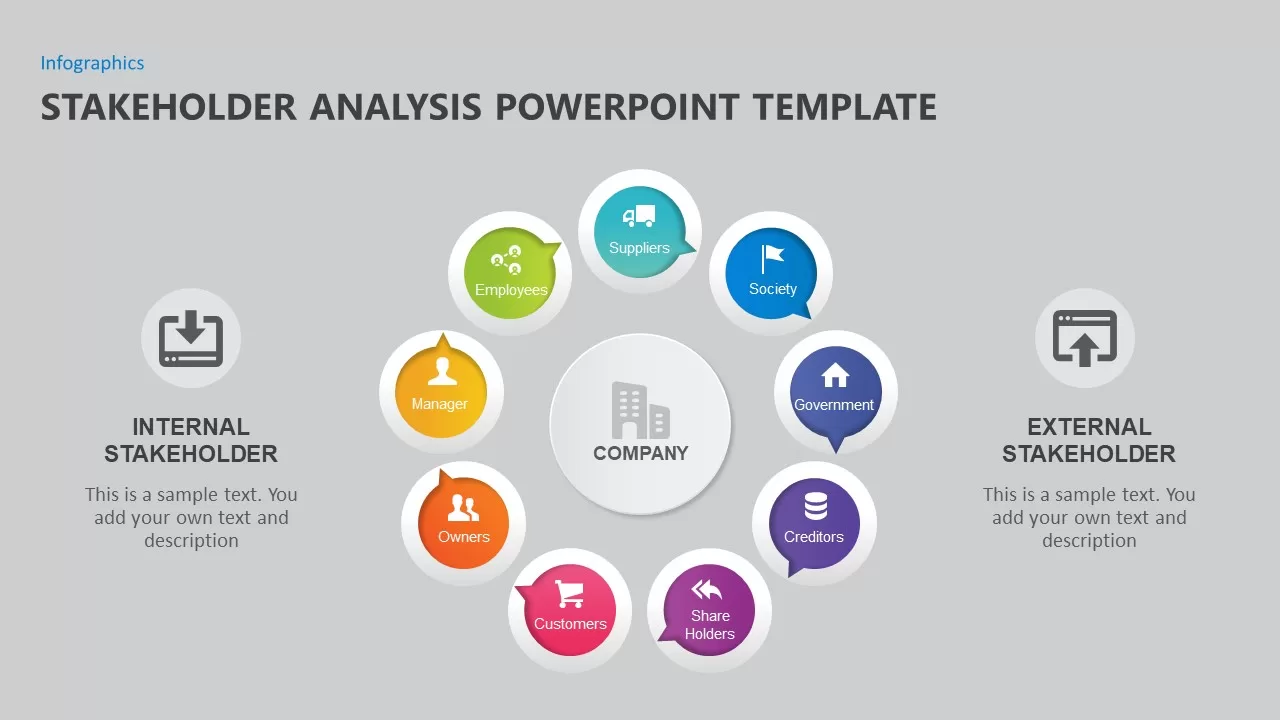
Stakeholder Analysis Template for PowerPoint & Google Slides
Business
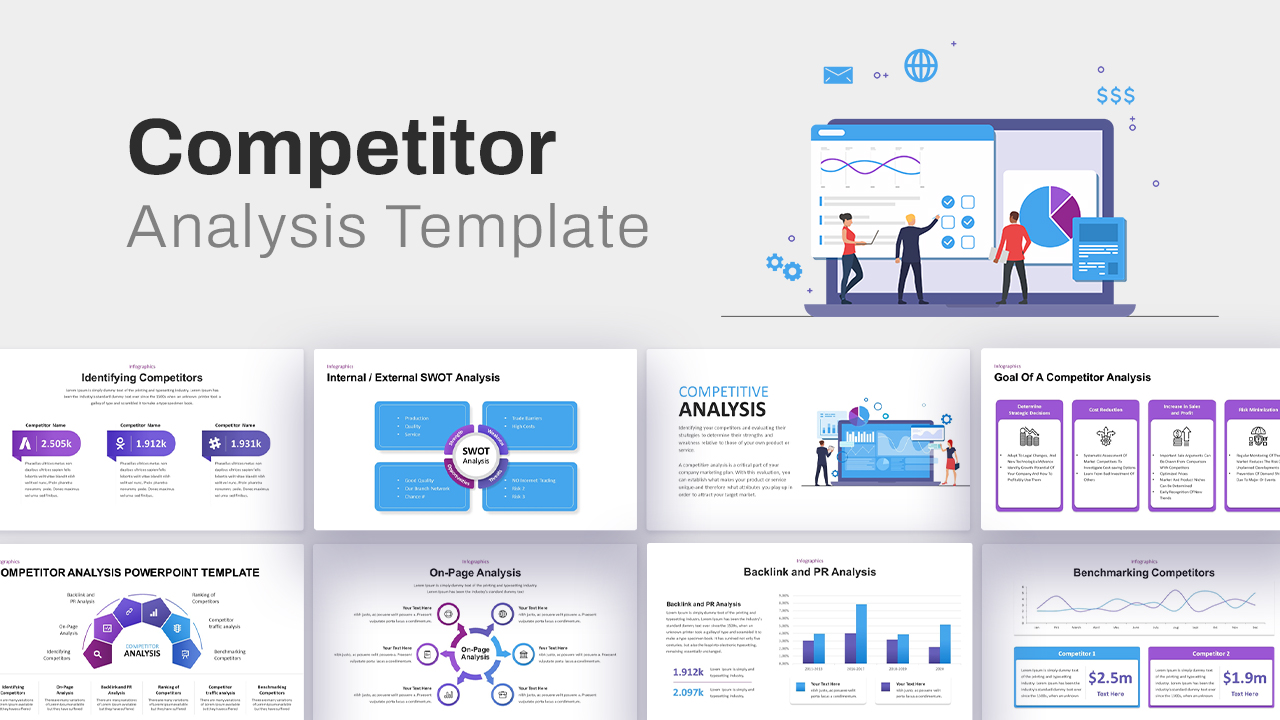
Comprehensive Competitor Analysis Template for PowerPoint & Google Slides
Competitor Analysis
Business Case Deck with Market Analysis Template for PowerPoint & Google Slides
Business Report
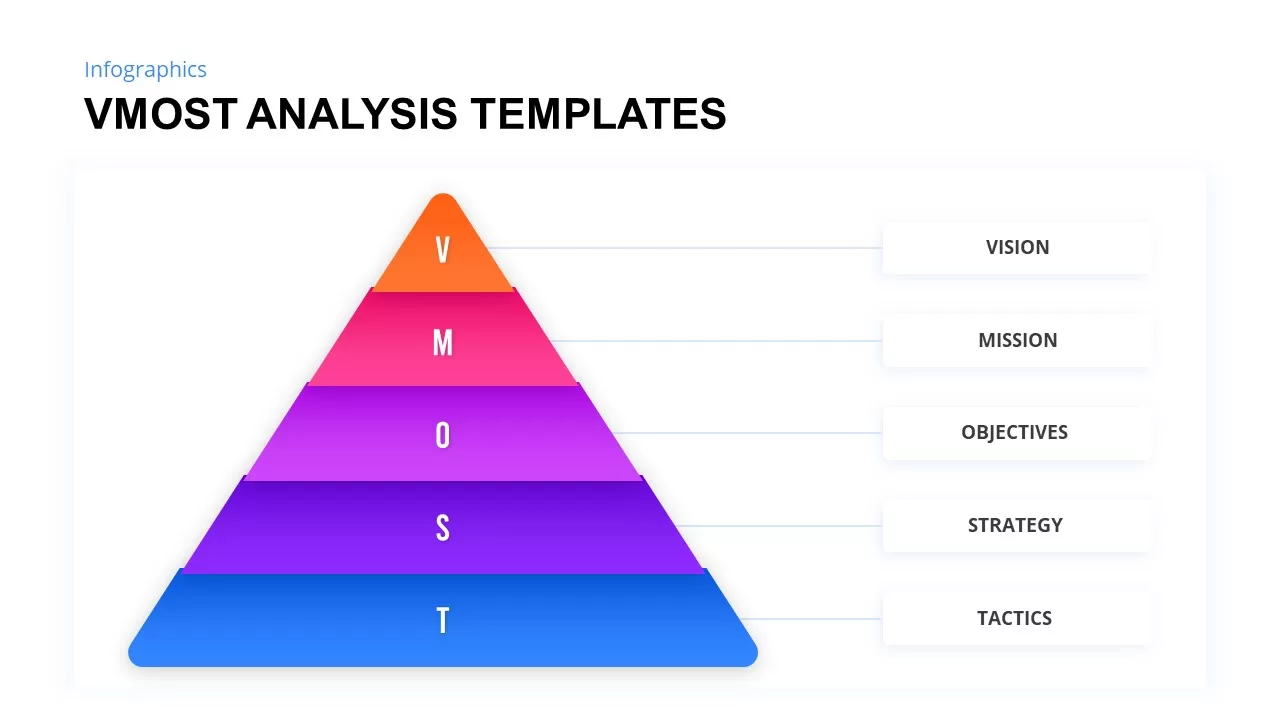
VMOST Analysis Template for PowerPoint & Google Slides
Business Strategy
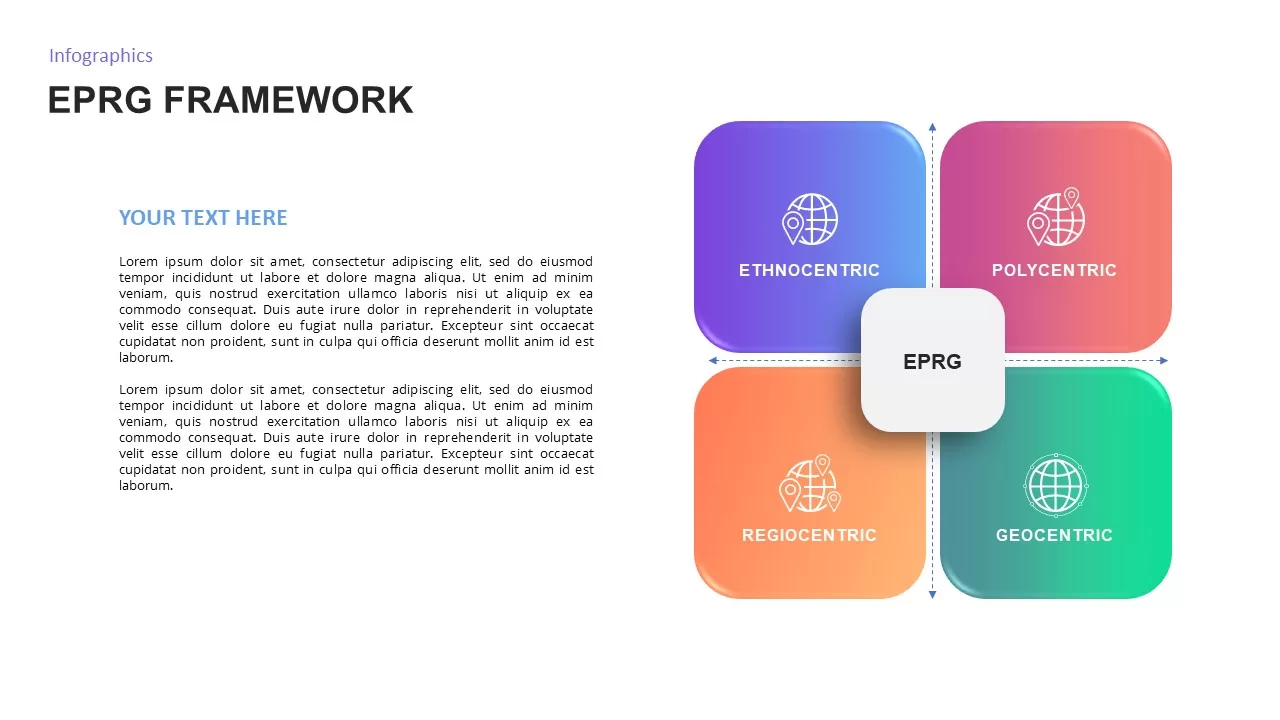
EPRG Framework Analysis template for PowerPoint & Google Slides
Business Strategy
IQ Scale Analysis Diagram template for PowerPoint & Google Slides
Employee Performance
Problem Statement Analysis template for PowerPoint & Google Slides
Business Strategy
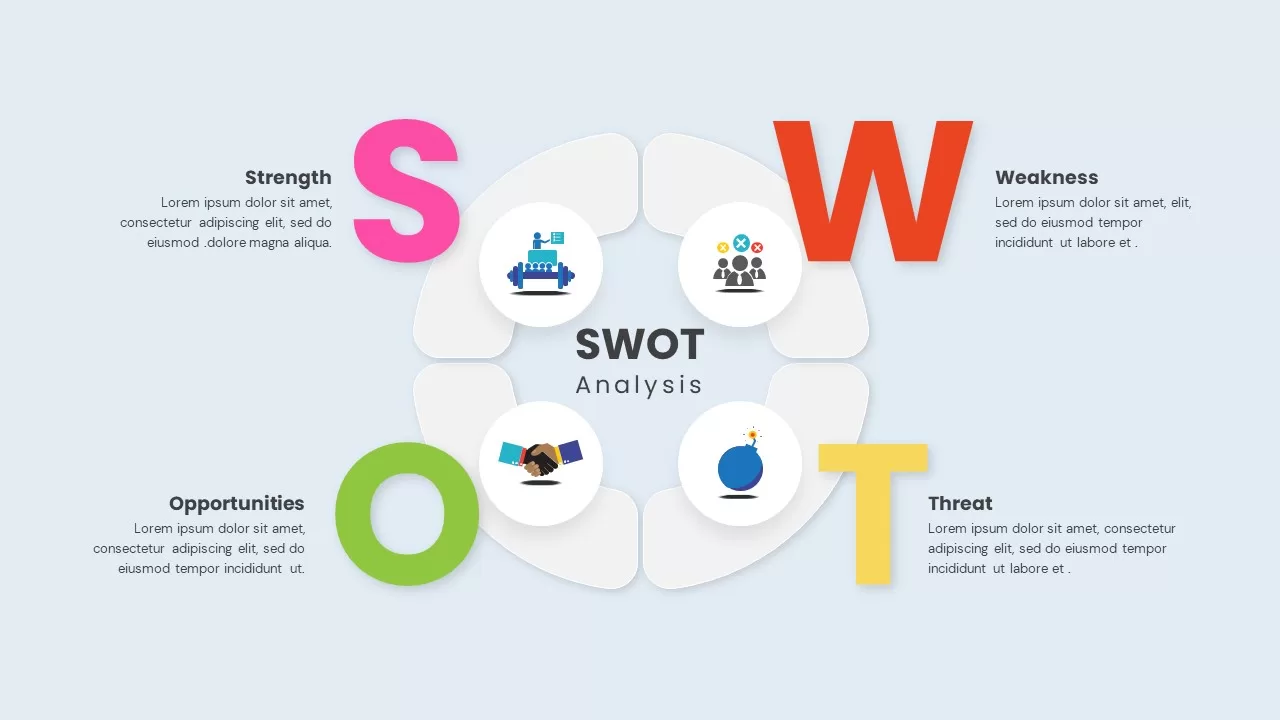
Circular SWOT Analysis Infographic Template for PowerPoint & Google Slides
SWOT
Modern Colorful SWOT Quadrant Analysis Template for PowerPoint & Google Slides
SWOT
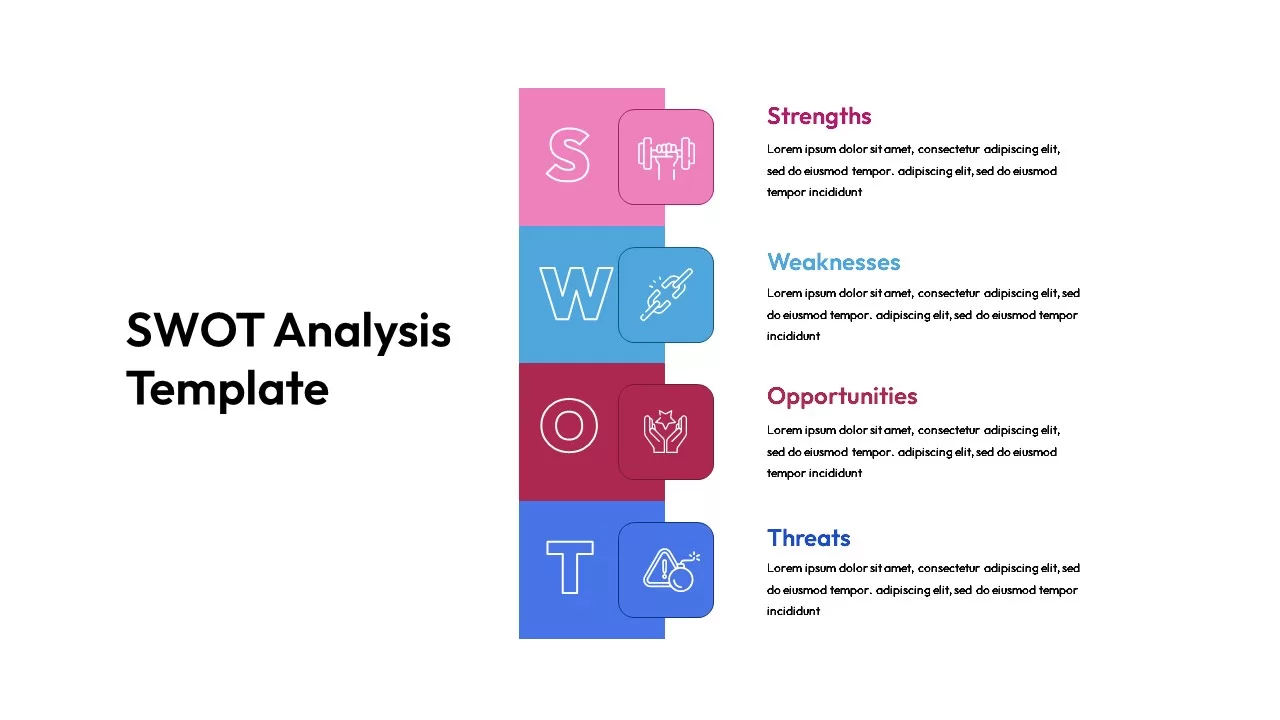
Colorful Vertical SWOT Analysis Layout Template for PowerPoint & Google Slides
SWOT
Root Cause Analysis Infographic Pack Template for PowerPoint & Google Slides
Process
SWOT Analysis Visual Overview template for PowerPoint & Google Slides
Business Strategy
SWOT Analysis Quadrant template for PowerPoint & Google Slides
Business Strategy

Free SWOT Analysis Template for PowerPoint & Google Slides
SWOT
Free
Free SWOT Analysis Overview template for PowerPoint & Google Slides
SWOT
Free
Puzzle Piece SWOT Analysis Diagram Template for PowerPoint & Google Slides
Opportunities Challenges
Photo Personal SWOT Analysis Callouts Template for PowerPoint & Google Slides
SWOT
Current vs Future State Gap Analysis template for PowerPoint & Google Slides
Comparison
Dual-Color Cost vs Benefit Analysis Template for PowerPoint & Google Slides
Comparison
CATWOE Analysis Template for PowerPoint & Google Slides
Process
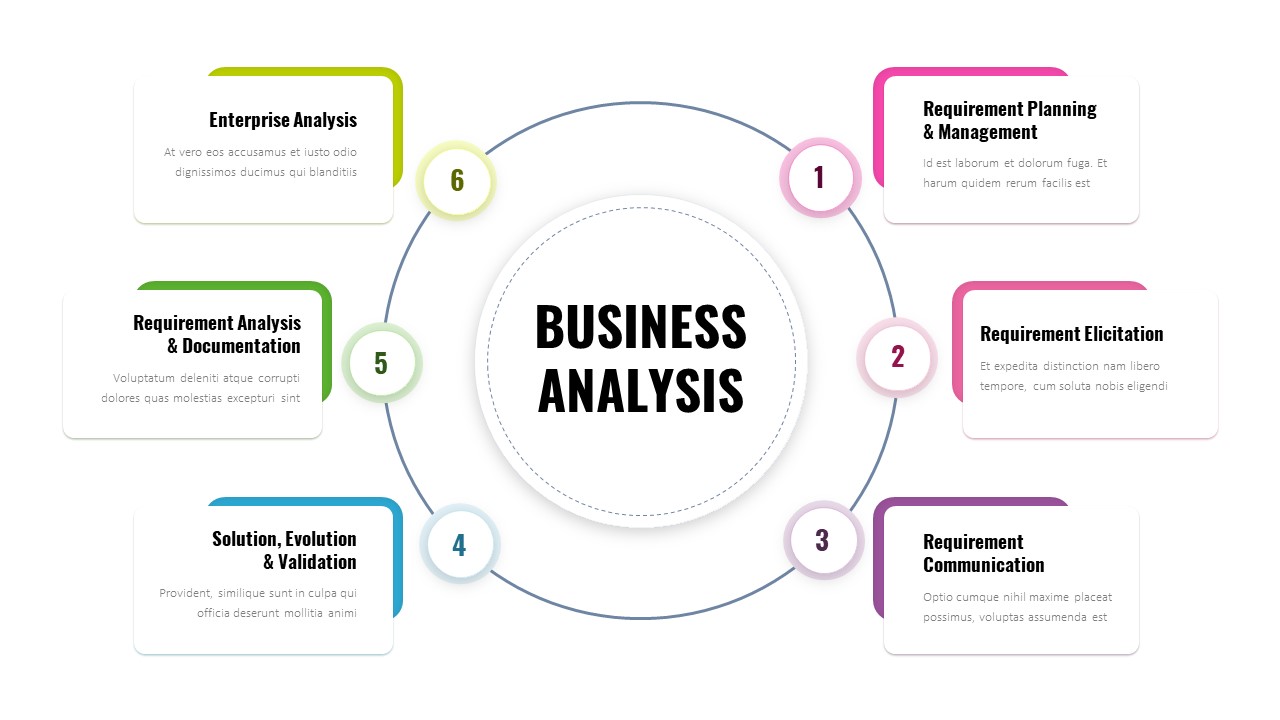
Six-Step Business Analysis Template for PowerPoint & Google Slides
Process
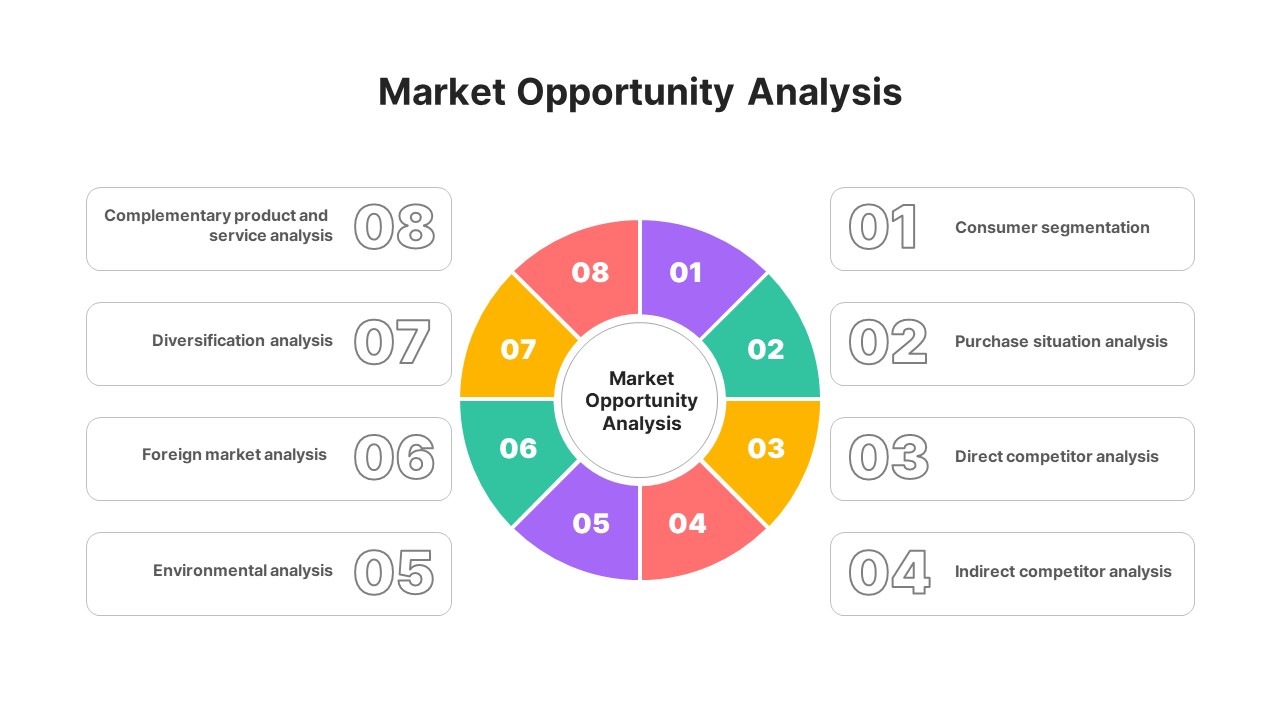
Market Opportunity Analysis Wheel template for PowerPoint & Google Slides
Business Strategy
Vendor Comparison Analysis template for PowerPoint & Google Slides
Comparison Chart
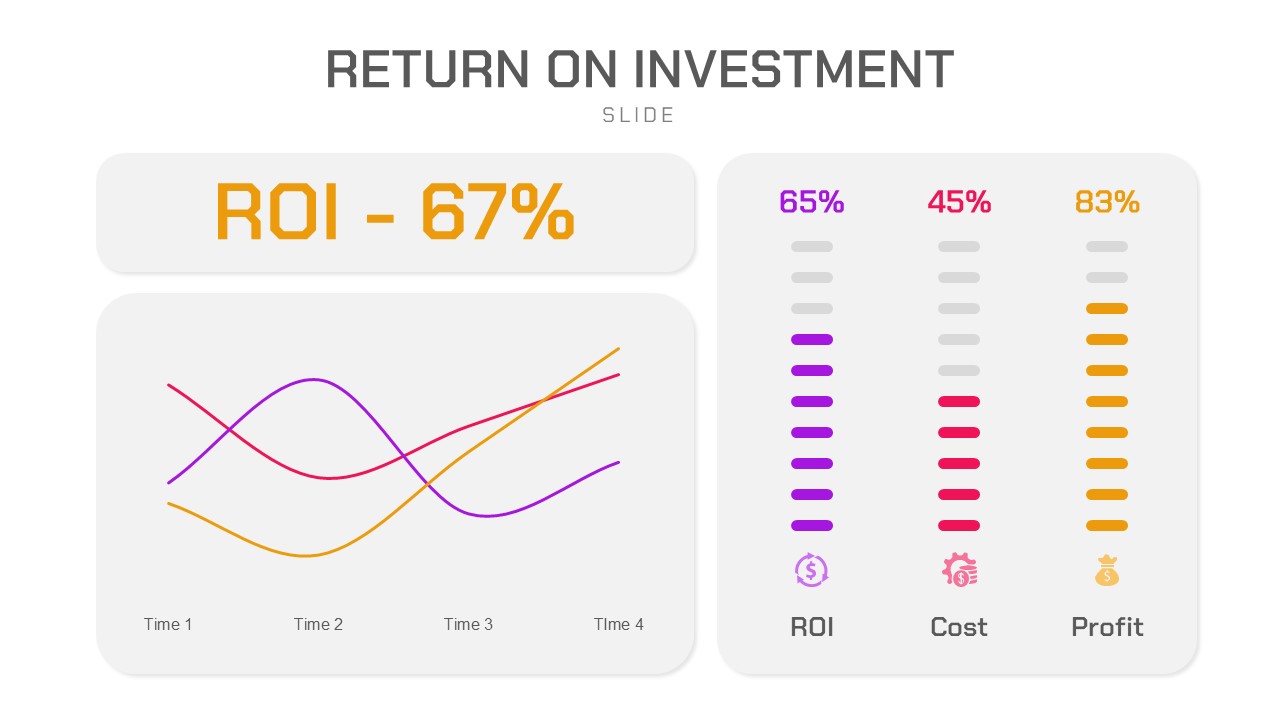
Return on Investment (ROI) Analysis template for PowerPoint & Google Slides
Business Report
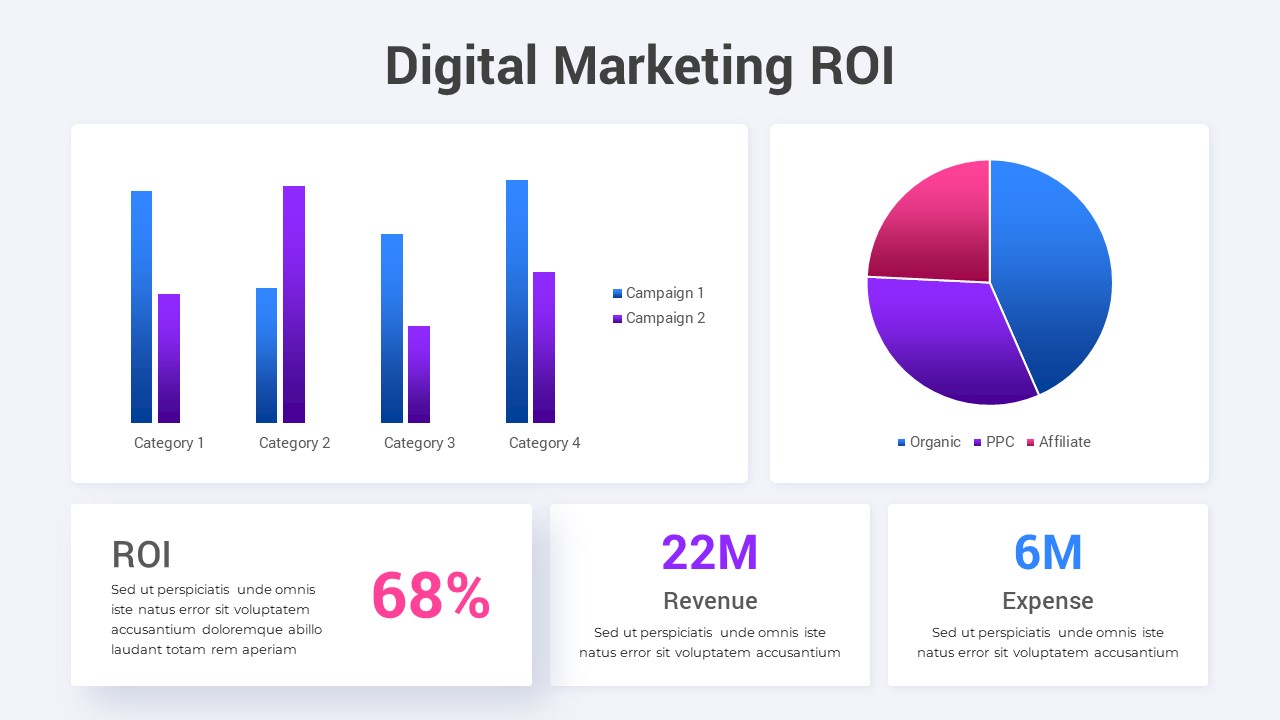
Digital Marketing ROI Analysis template for PowerPoint & Google Slides
Digital Marketing
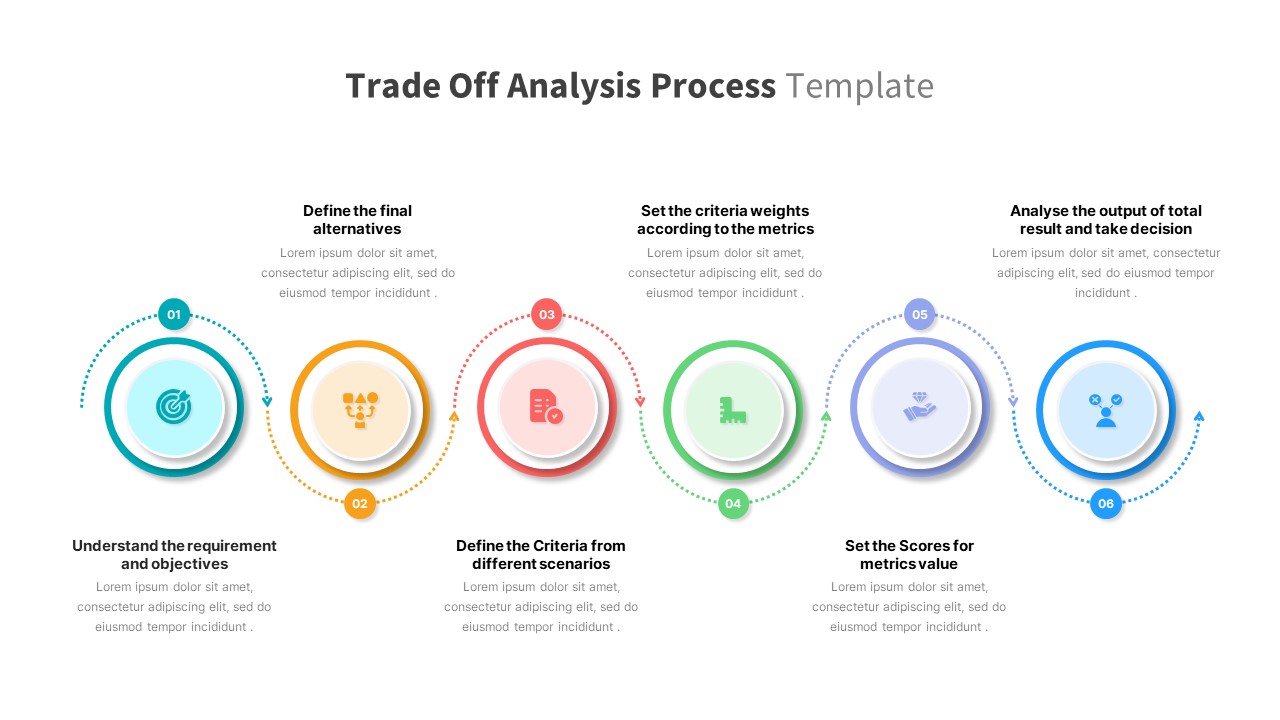
Trade Off Analysis Process template for PowerPoint & Google Slides
Process
Risk Pyramid Hierarchy Analysis Template for PowerPoint & Google Slides
Pyramid
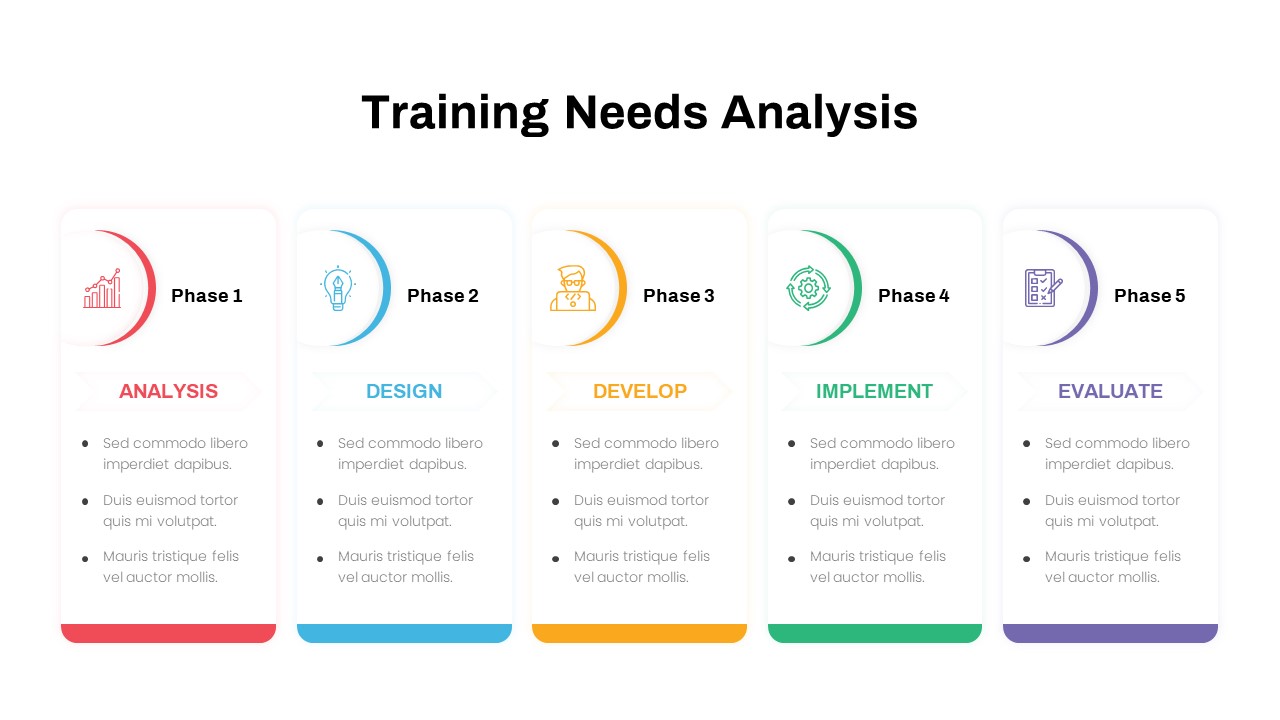
Training Needs Analysis Process Template for PowerPoint & Google Slides
Employee Performance
Business Process Analysis Cycle Diagram Template for PowerPoint & Google Slides
Business Strategy
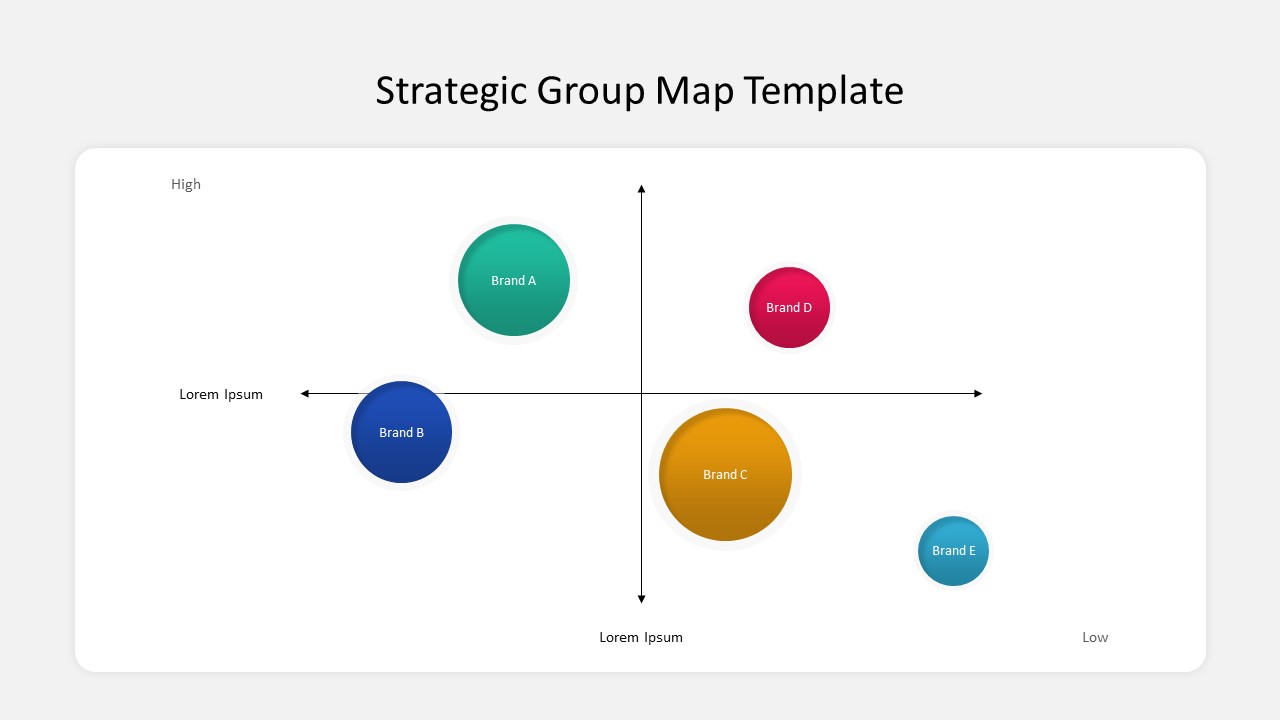
Business Strategic Group Map Analysis Template for PowerPoint & Google Slides
Competitor Analysis
Free
Four Quadrant Scatter Chart Analysis Template for PowerPoint & Google Slides
Comparison Chart
Experience Curve Analysis Diagram Template for PowerPoint & Google Slides
Business Strategy
Neon Dark Stock Market Analysis Template for PowerPoint & Google Slides
Pitch Deck
Free
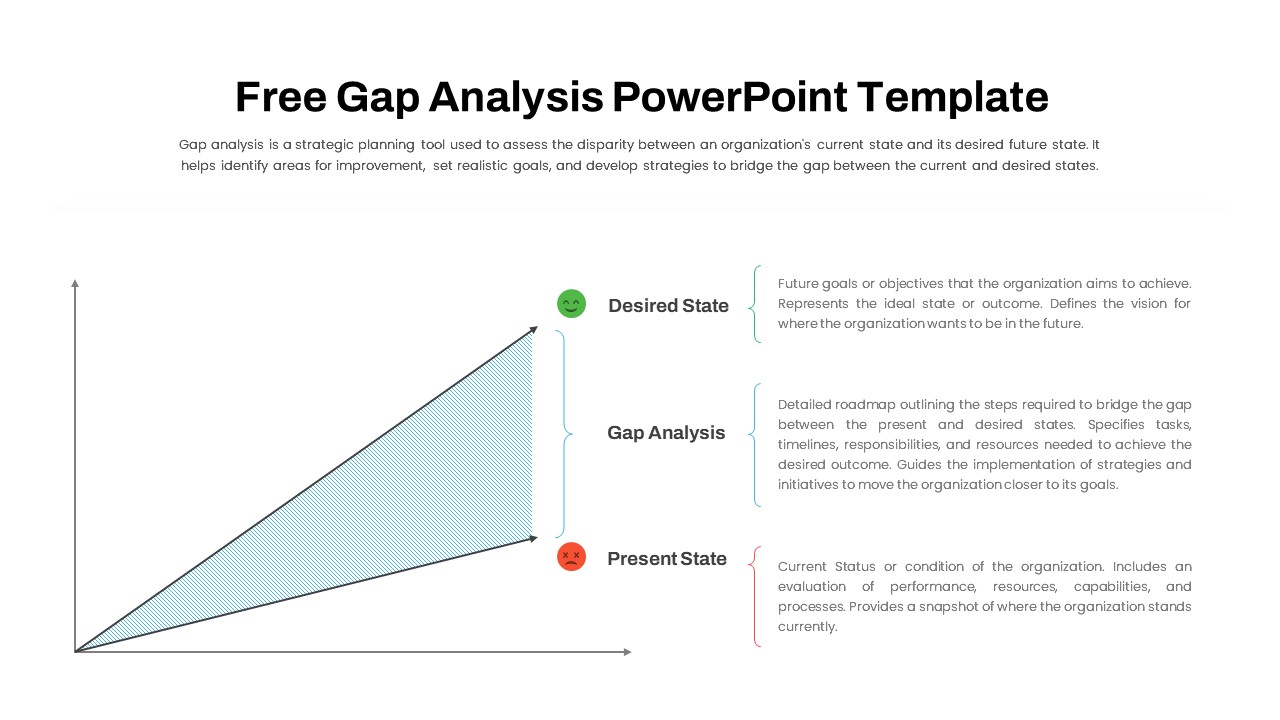
Free Comprehensive Gap Analysis Framework Template for PowerPoint & Google Slides
Opportunities Challenges
Free
Colorful SWOT Analysis Diagram Template for PowerPoint & Google Slides
SWOT
Expanding Margins Analysis Bar Chart Template for PowerPoint & Google Slides
Charts
Annual Growth Trend Analysis Chart template for PowerPoint & Google Slides
Business Report
Dynamic Financial Analysis Line Chart Template for PowerPoint & Google Slides
Finance
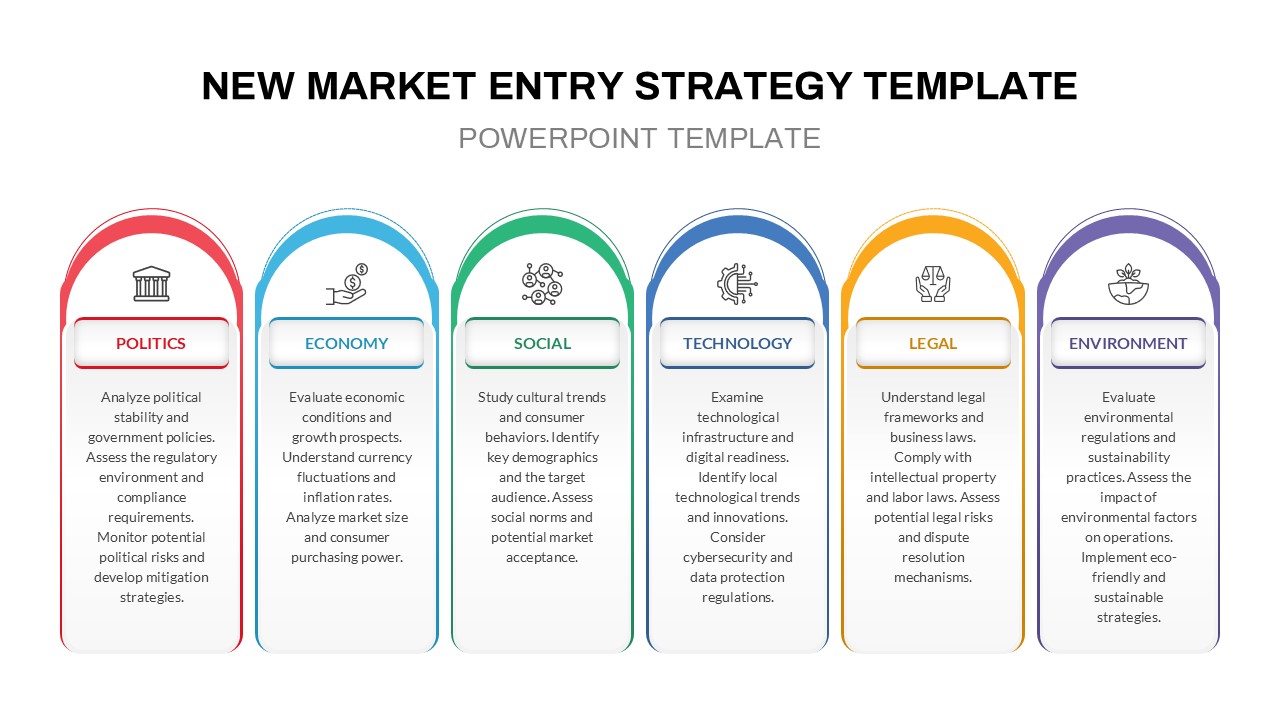
PESTLE Analysis for Market Entry Template for PowerPoint & Google Slides
PEST
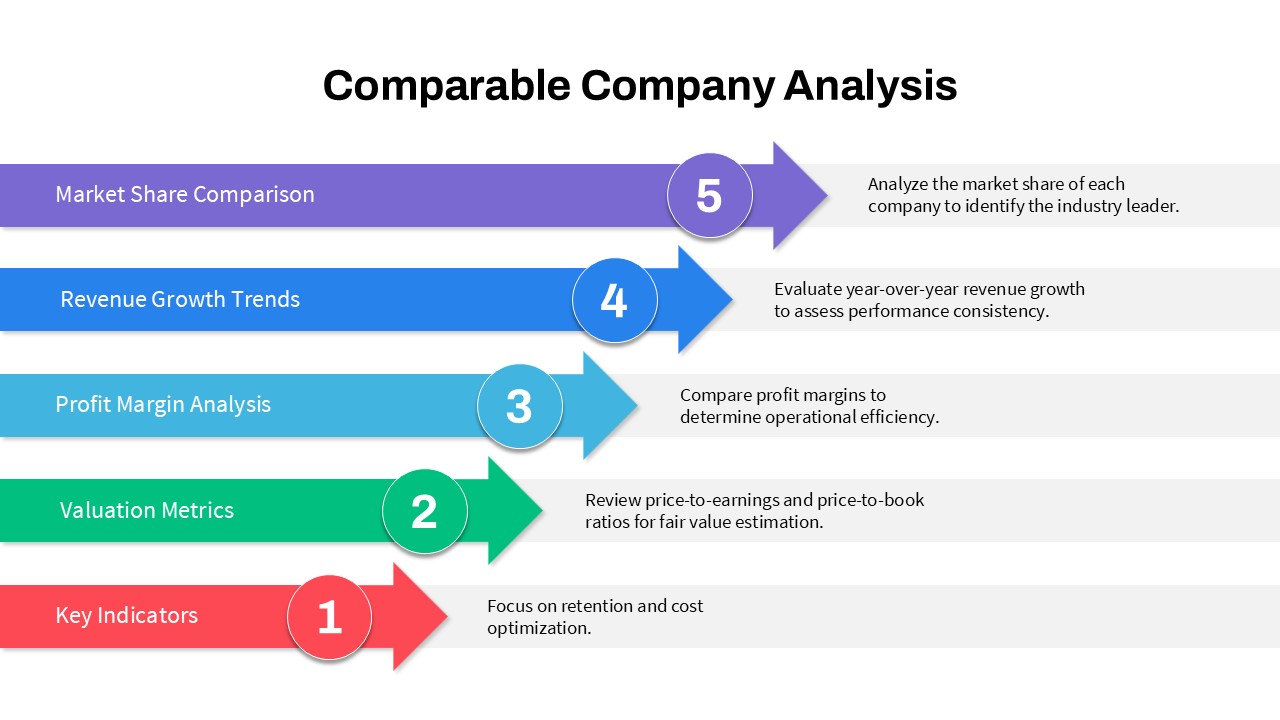
5-Step Comparable Company Analysis Template for PowerPoint & Google Slides
Arrow
Data Analysis Bar Chart with Insights Template for PowerPoint & Google Slides
Bar/Column
Free
Cultural Web Analysis Circular Diagram Template for PowerPoint & Google Slides
Circular
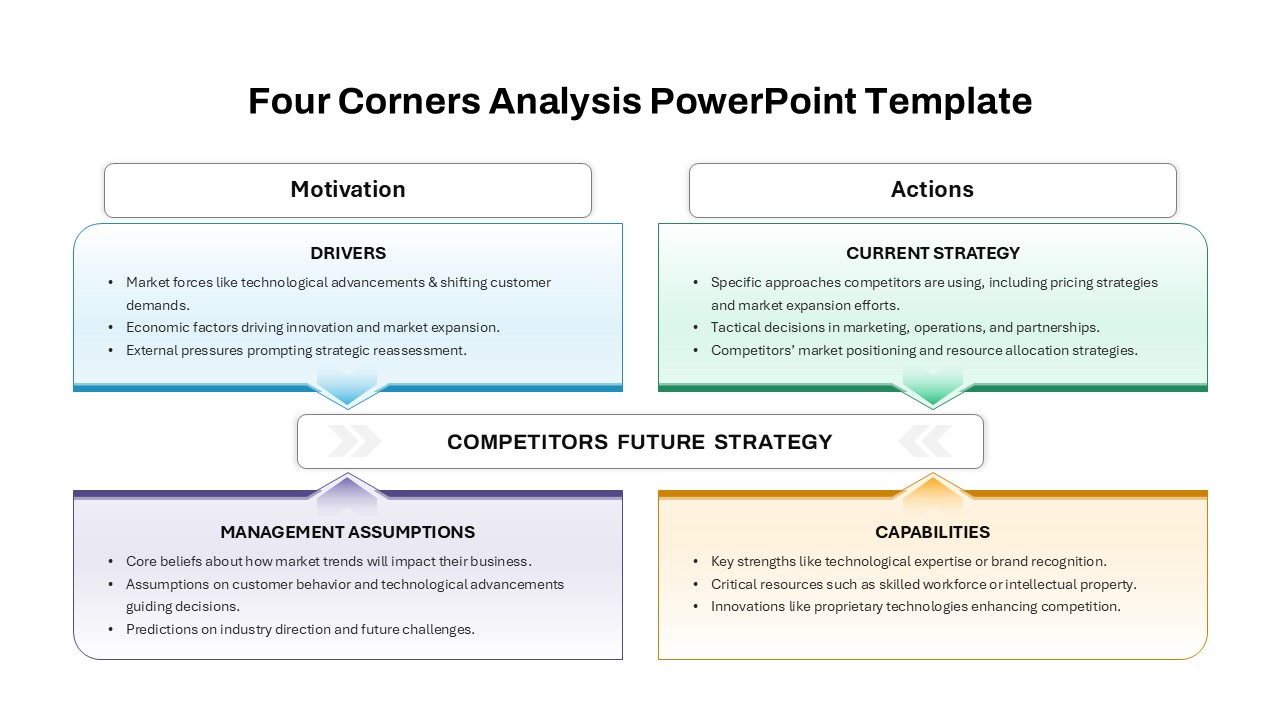
Four-Corners Strategic Analysis Quadrant Template for PowerPoint & Google Slides
SWOT
Marketing SWOT Analysis Slide Template for PowerPoint & Google Slides
SWOT
DESTEP Marketing Analysis Diagram Template for PowerPoint & Google Slides
Circular
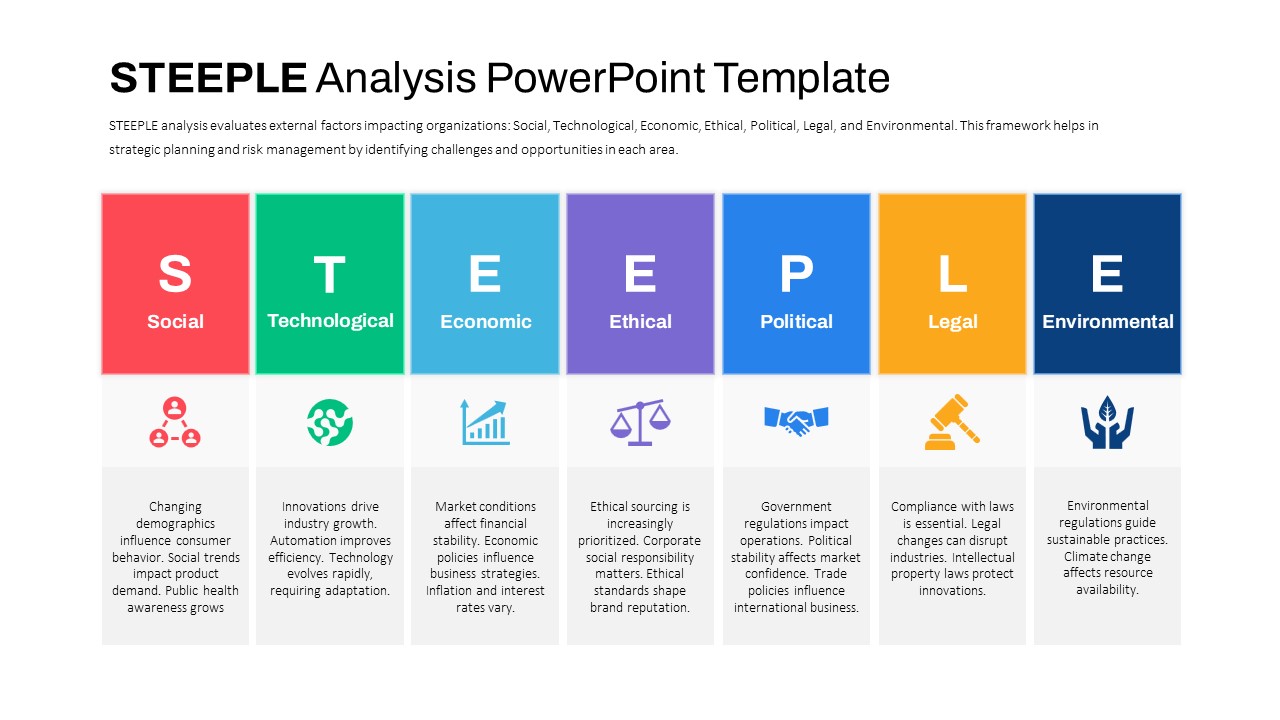
STEEPLE Analysis framework template for PowerPoint & Google Slides
Business Strategy
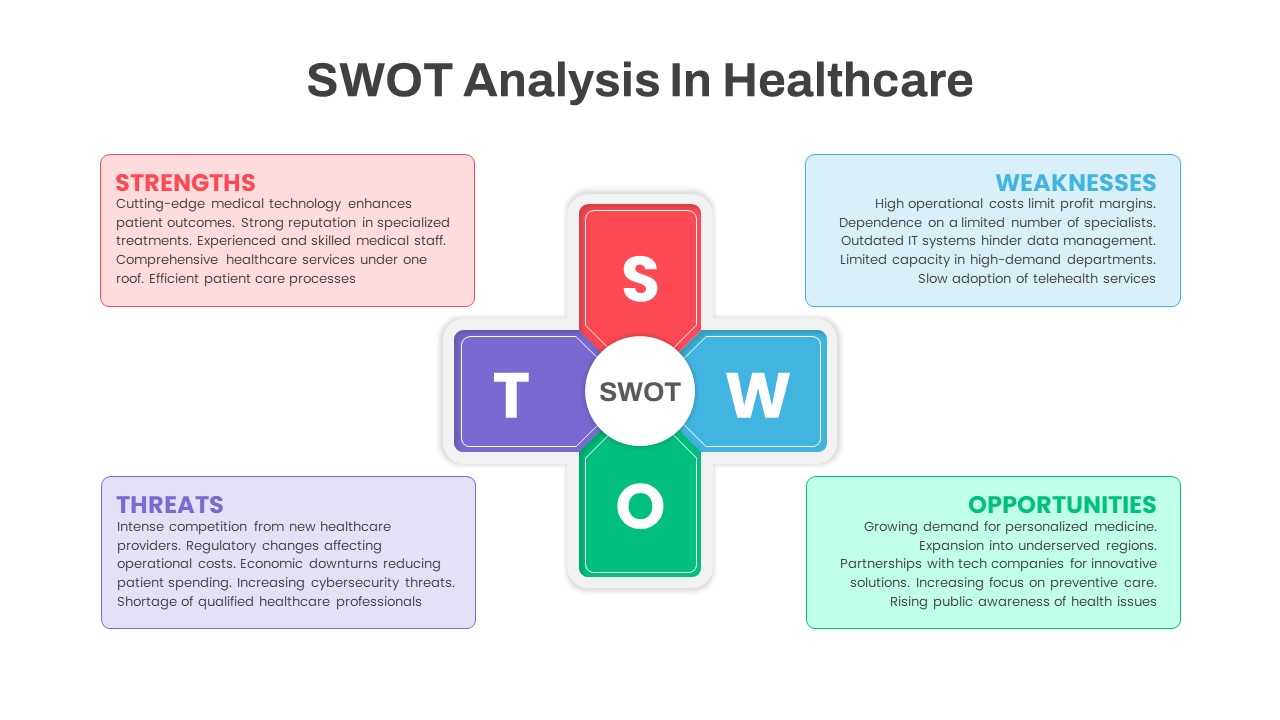
SWOT Analysis in Healthcare template for PowerPoint & Google Slides
SWOT
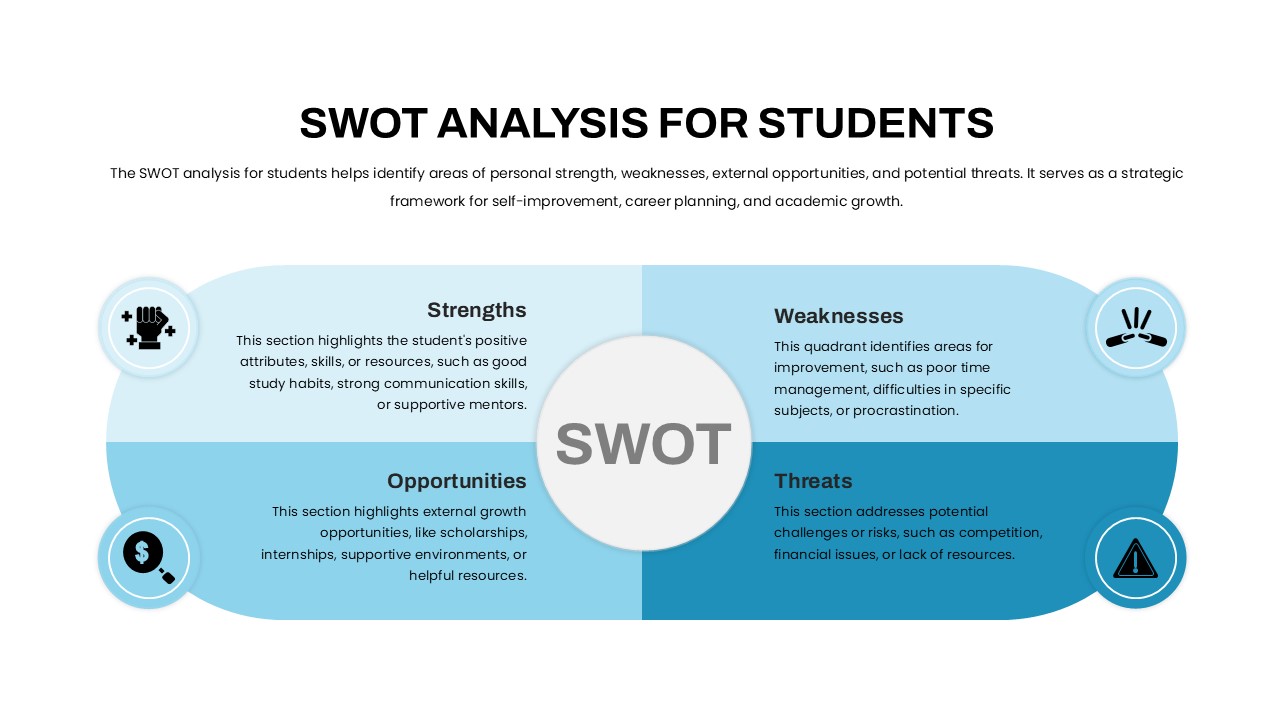
Student SWOT Analysis Framework Template for PowerPoint & Google Slides
SWOT
Two-Box Analysis & Target Comparison Template for PowerPoint & Google Slides
Comparison
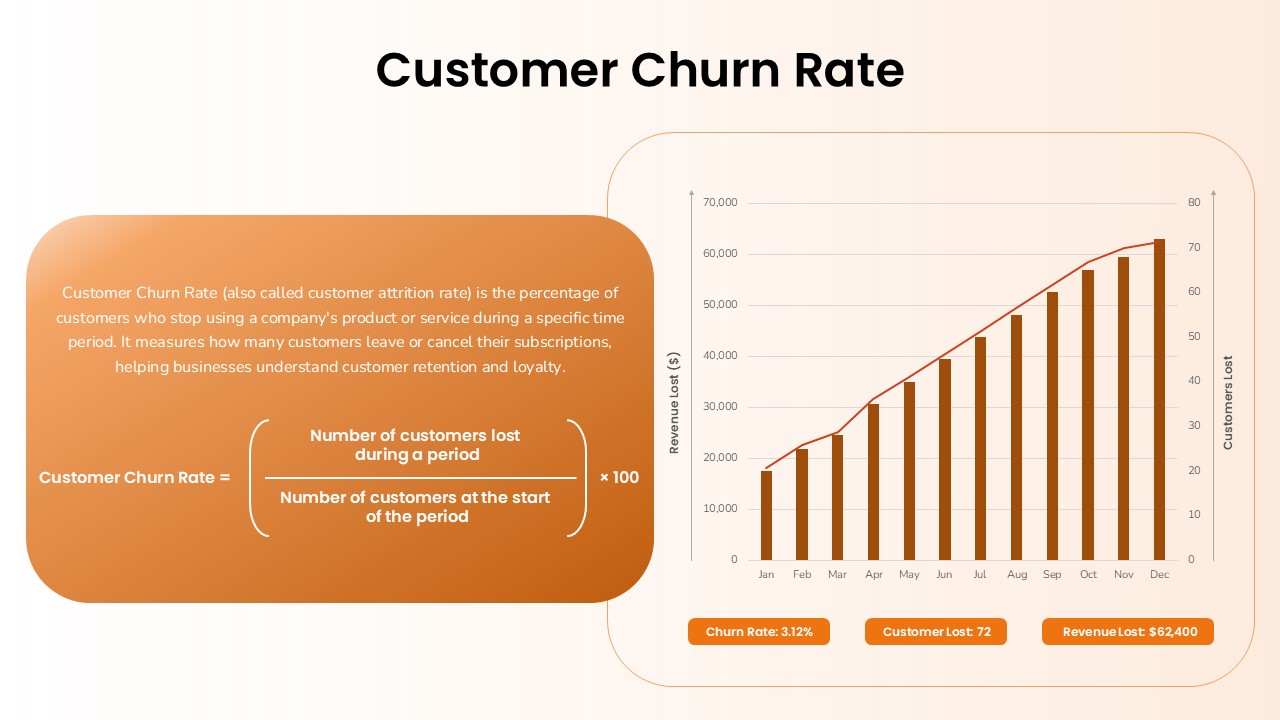
Customer Churn Rate Analysis template for PowerPoint & Google Slides
Business Report
Turnover Analysis Dashboard Template for PowerPoint & Google Slides
Employee Performance
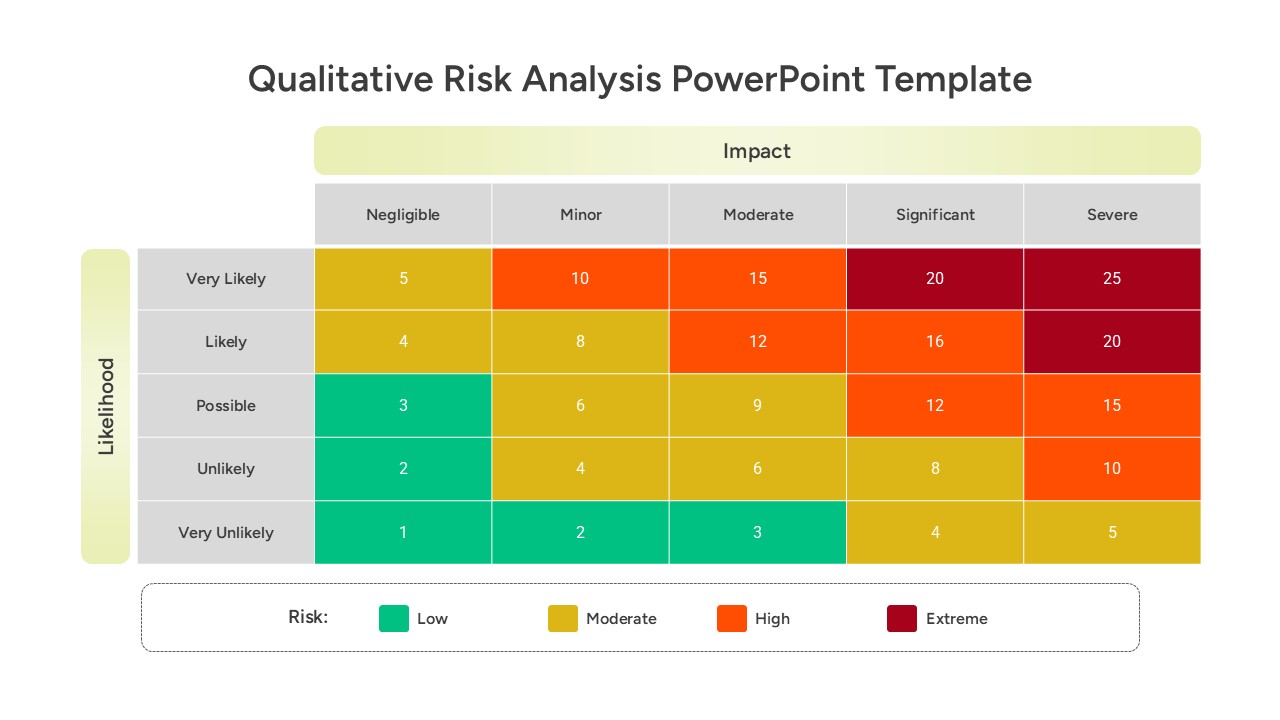
Qualitative Risk Analysis template for PowerPoint & Google Slides
Business
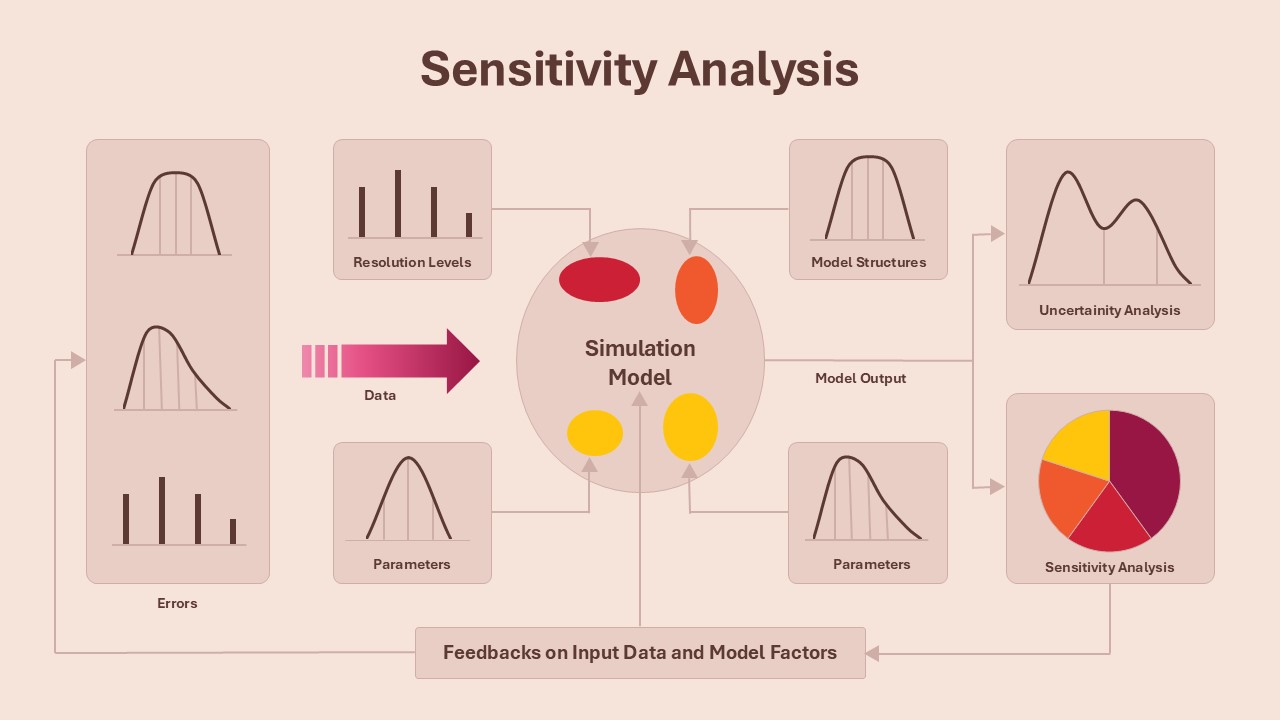
Sensitivity Analysis Framework template for PowerPoint & Google Slides
Business Strategy
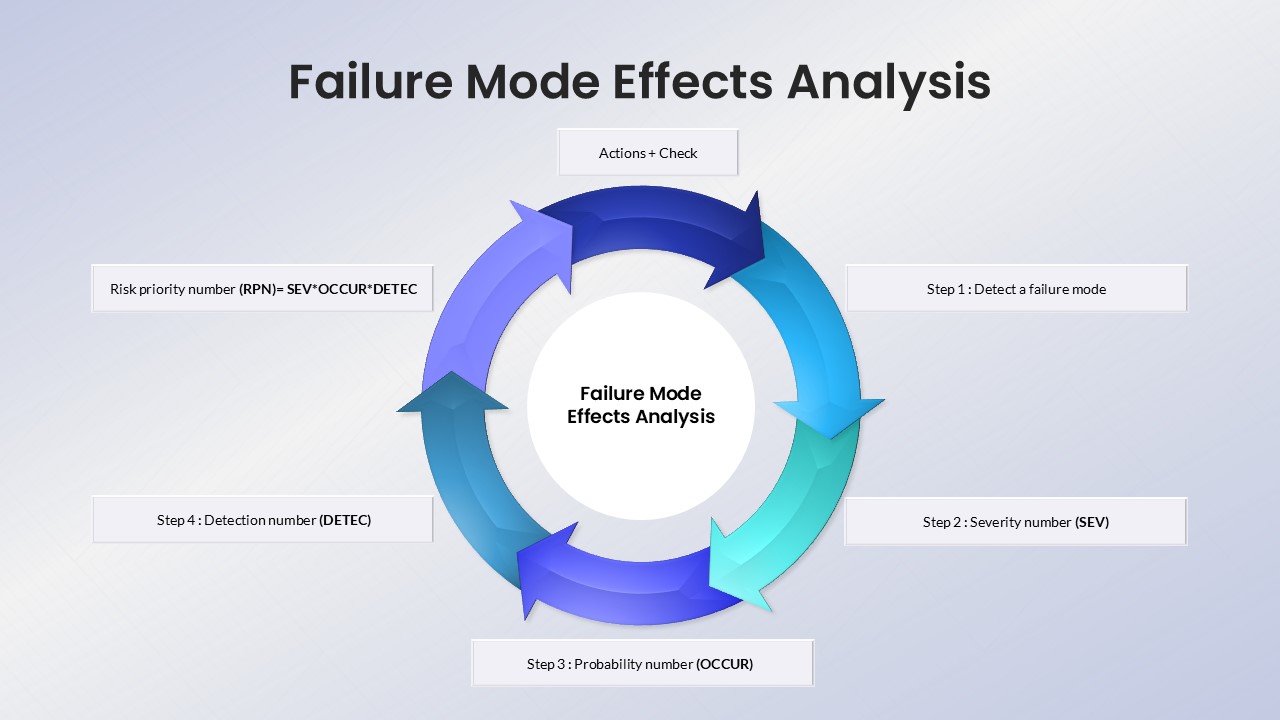
Failure Mode Effects Analysis (FMEA) Slide Template for PowerPoint & Google Slides
Process
Colorful SWOT Analysis Quadrant Template for PowerPoint & Google Slides
SWOT
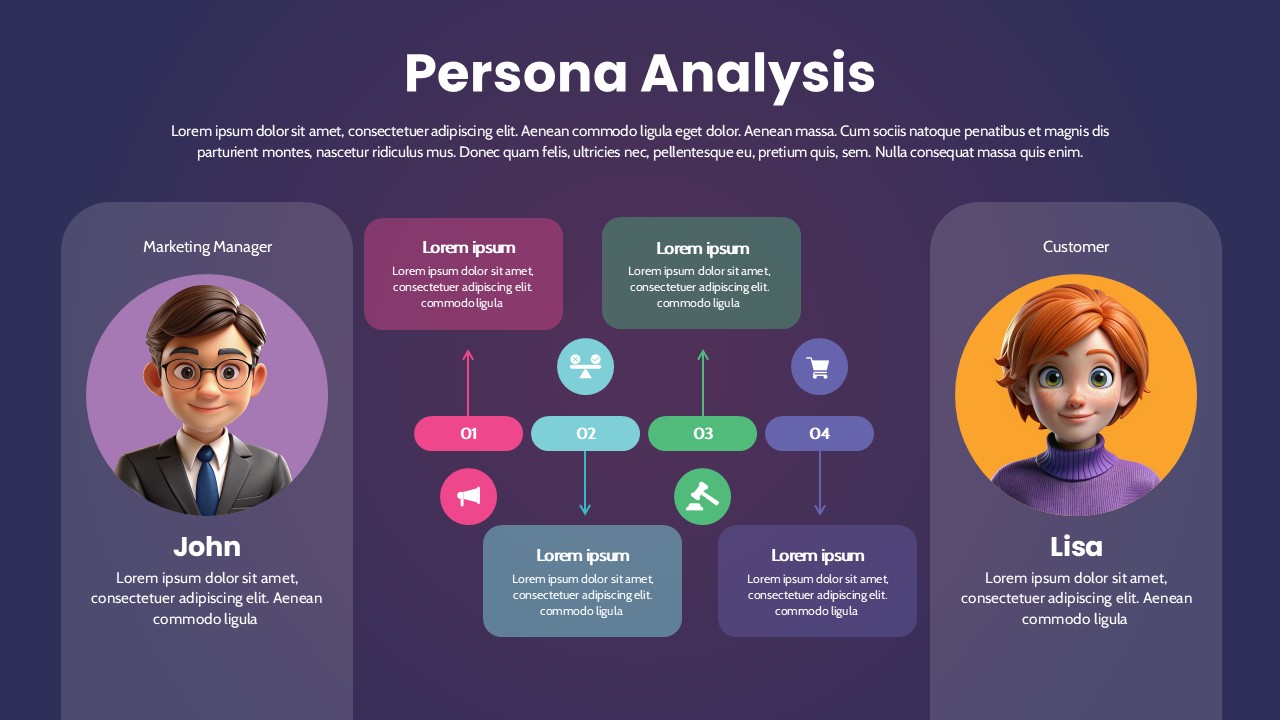
Persona Analysis Template for PowerPoint & Google Slides
Infographics
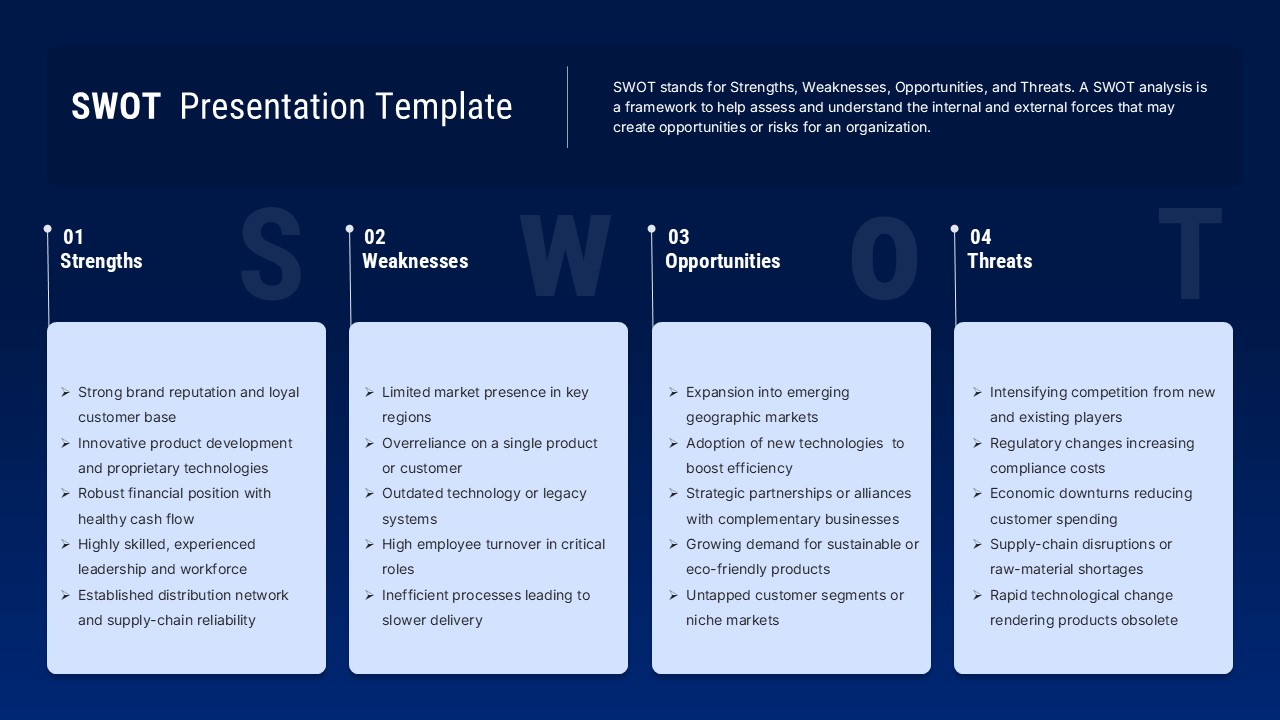
Blue SWOT Analysis Presentation Template for PowerPoint & Google Slides
SWOT
Cohort Analysis Retention Dashboard Template for PowerPoint & Google Slides
Comparison Chart
SWOT Analysis Infographic with Circular Icons Template for PowerPoint & Google Slides
SWOT
Multi Color SWOT Analysis Quadrant Template for PowerPoint & Google Slides
SWOT
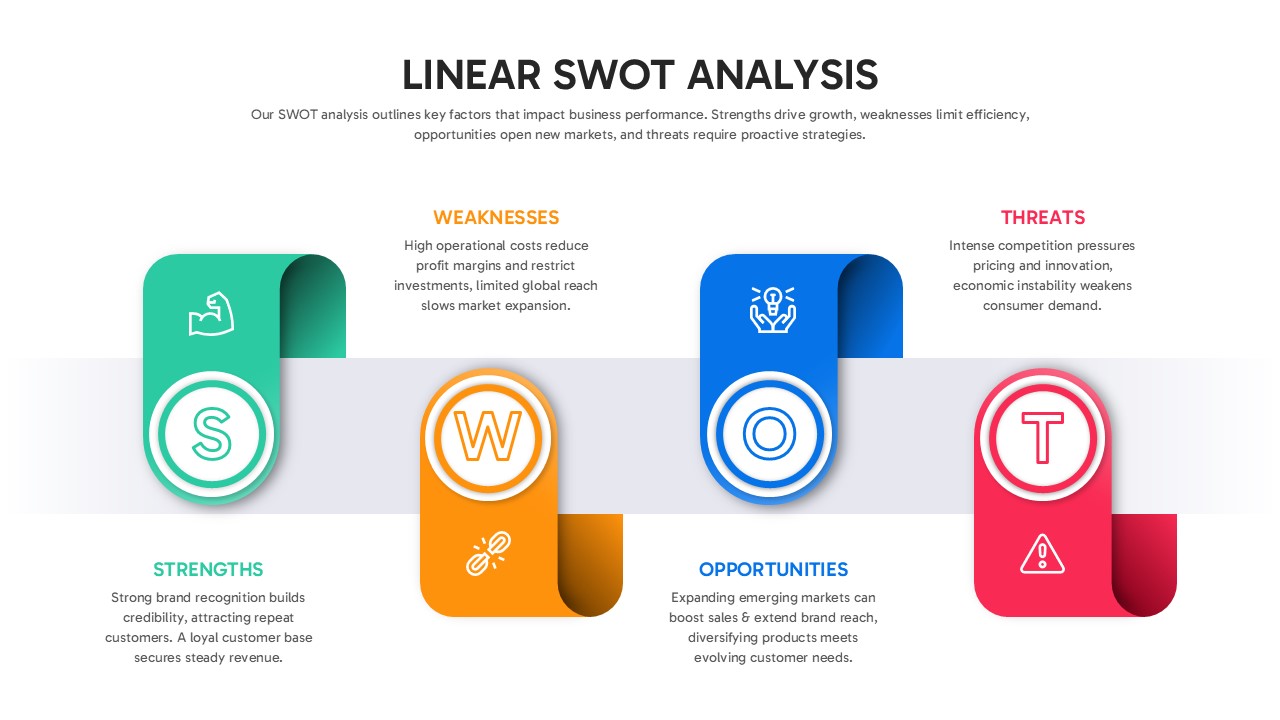
Linear SWOT Analysis Slide Template for PowerPoint & Google Slides
SWOT
Personal SWOT Analysis Matrix Cards Template for PowerPoint & Google Slides
SWOT
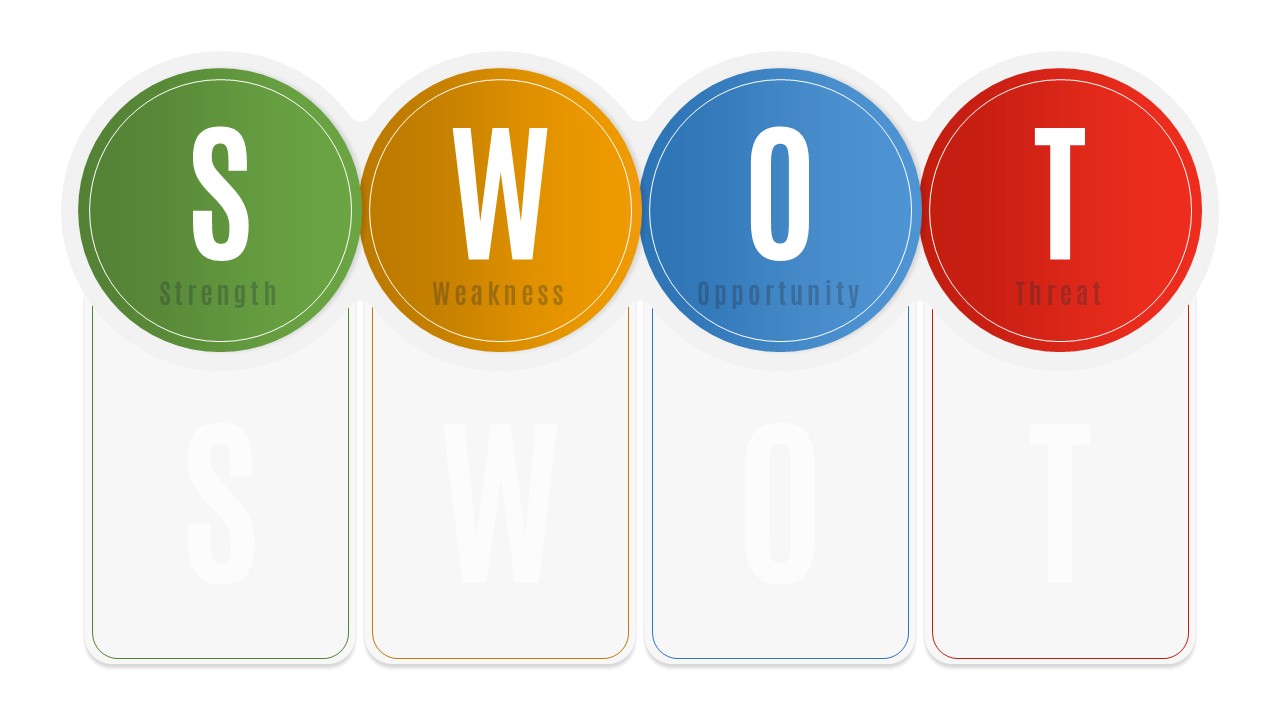
Blank SWOT Analysis Template for PowerPoint & Google Slides
SWOT
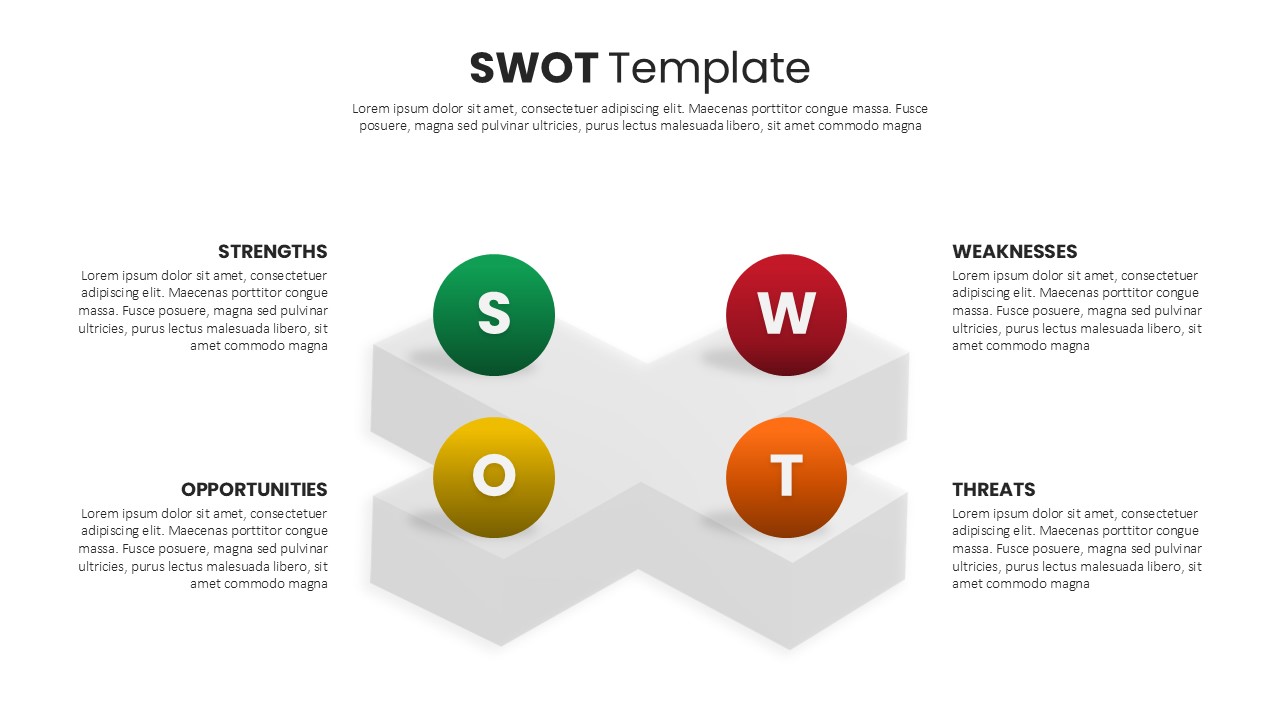
3D Quadrant SWOT Analysis Template for PowerPoint & Google Slides
SWOT
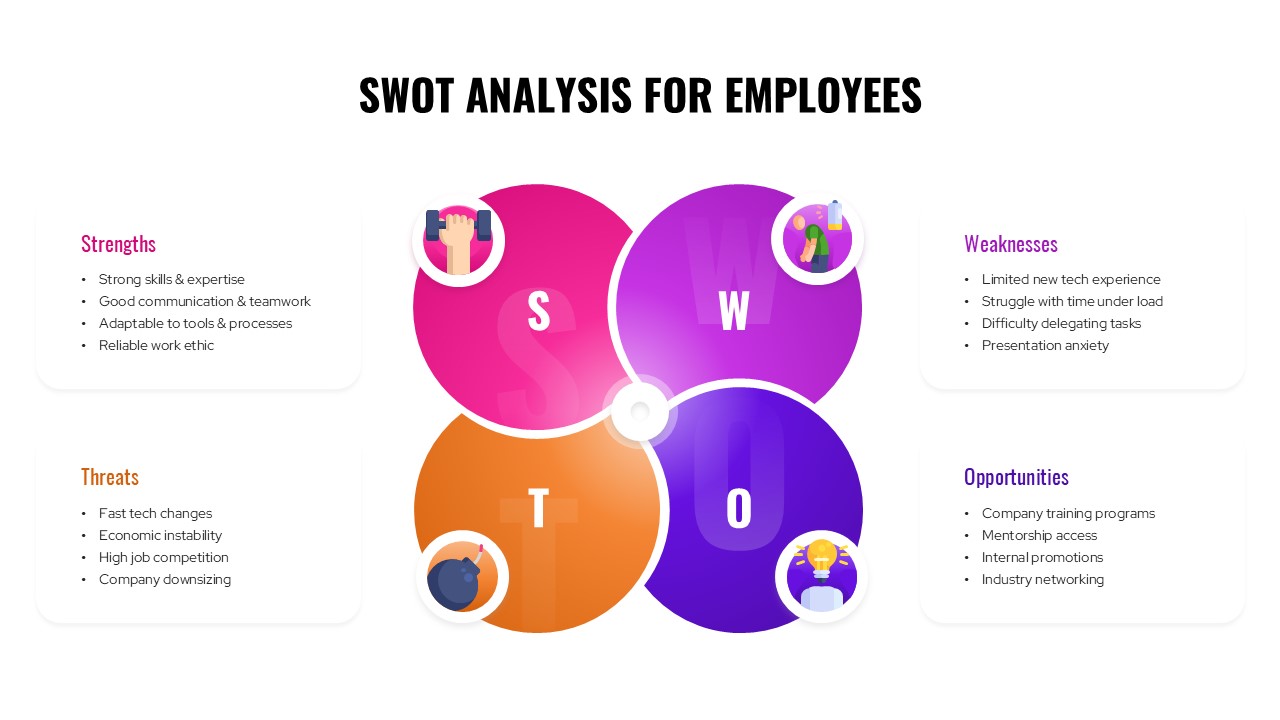
SWOT Analysis For Employees Template for PowerPoint & Google Slides
SWOT
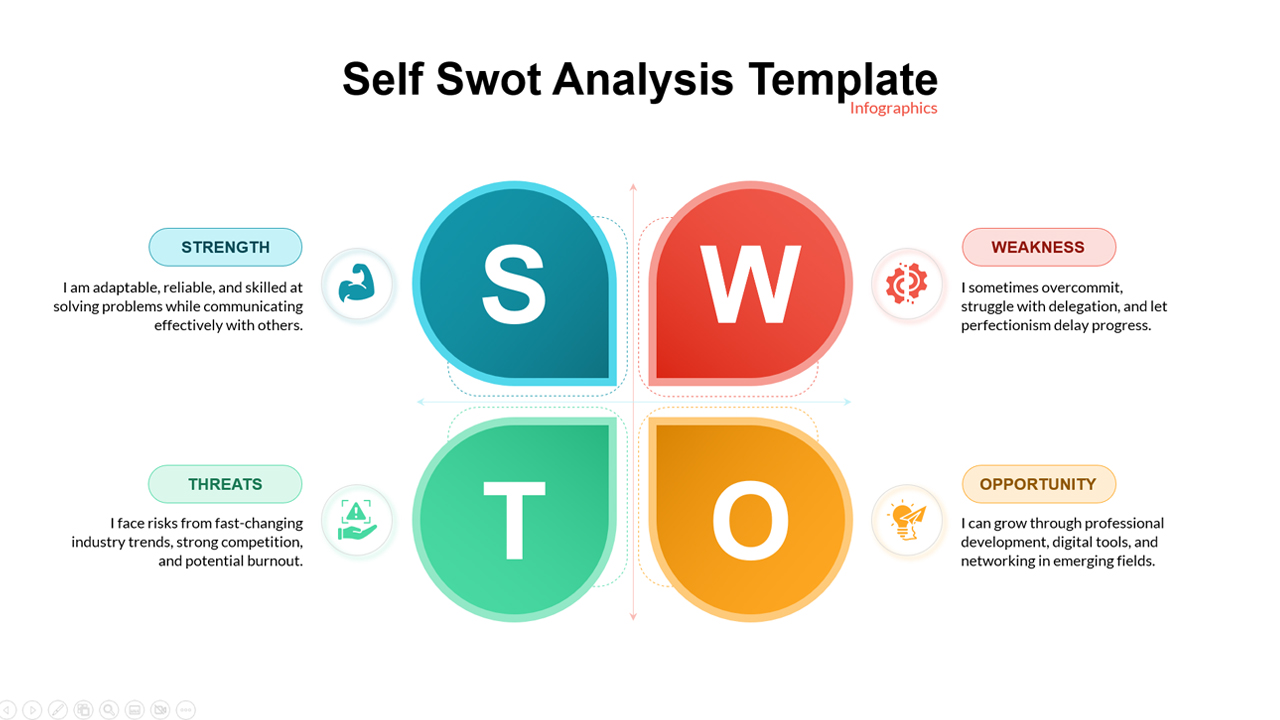
Self SWOT Analysis Template for PowerPoint & Google Slides
SWOT
Data Gap Analysis Template for PowerPoint & Google Slides
Business
Financial Gap Analysis Framework Template for PowerPoint & Google Slides
Finance