SWOT Analysis Circular Infographic Template for PowerPoint & Google Slides

Description
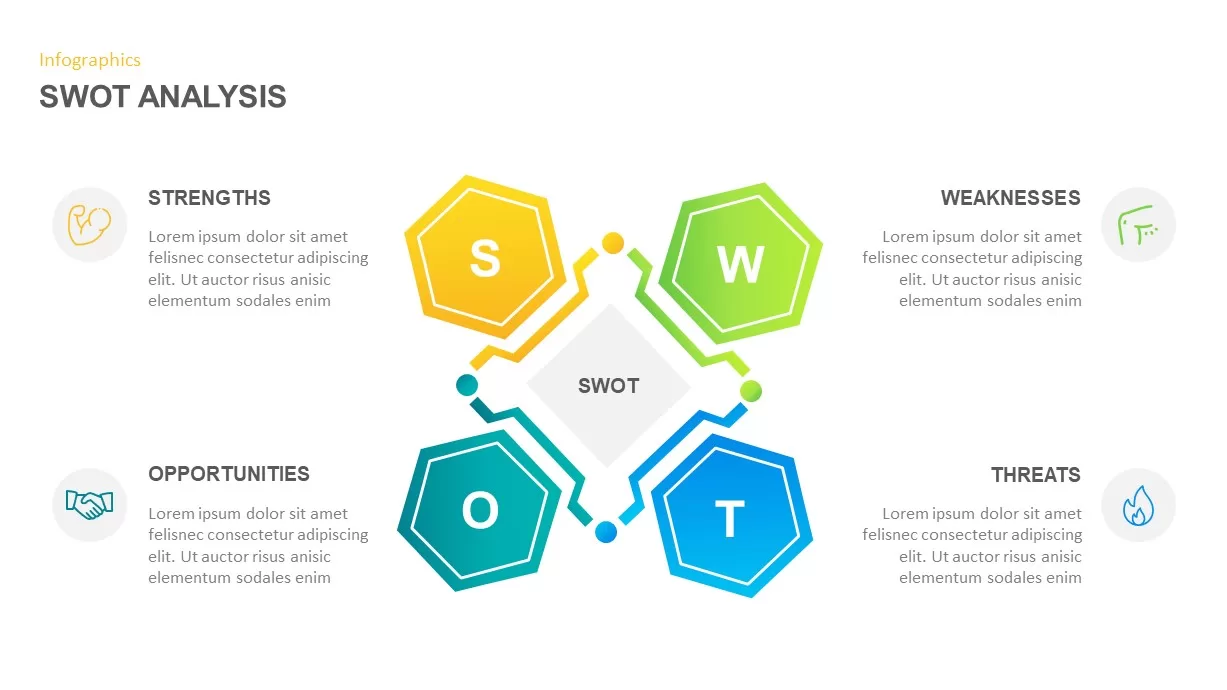
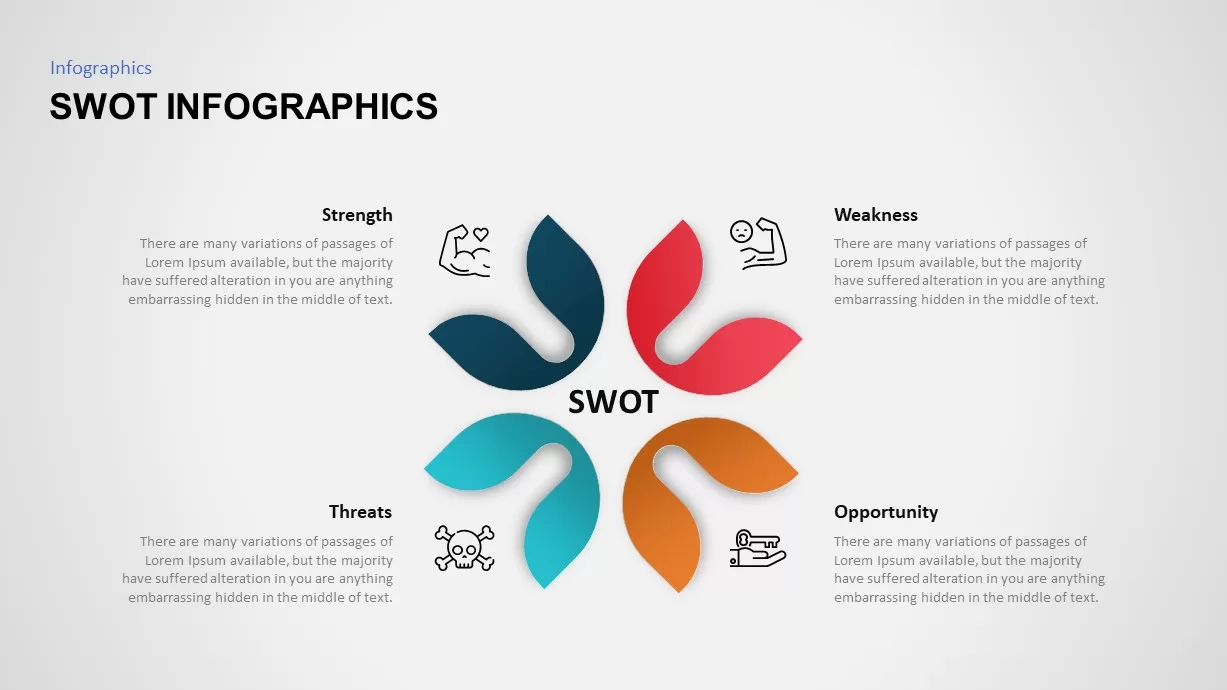
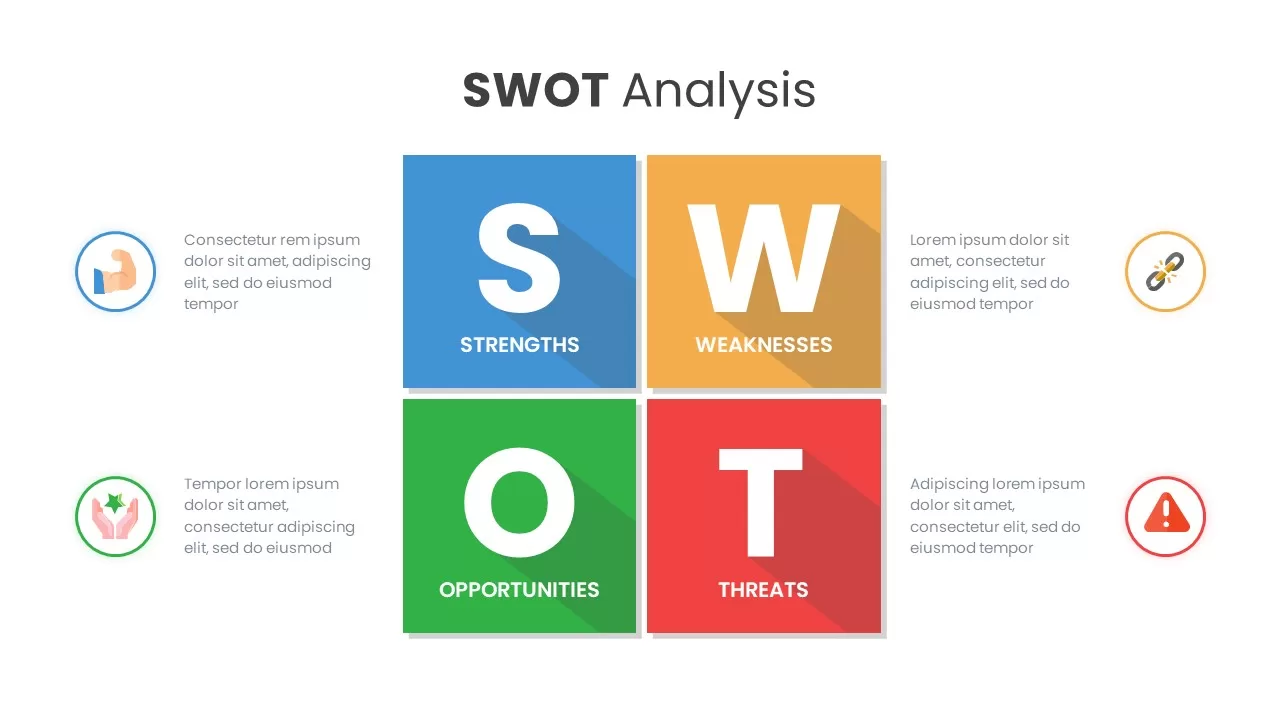
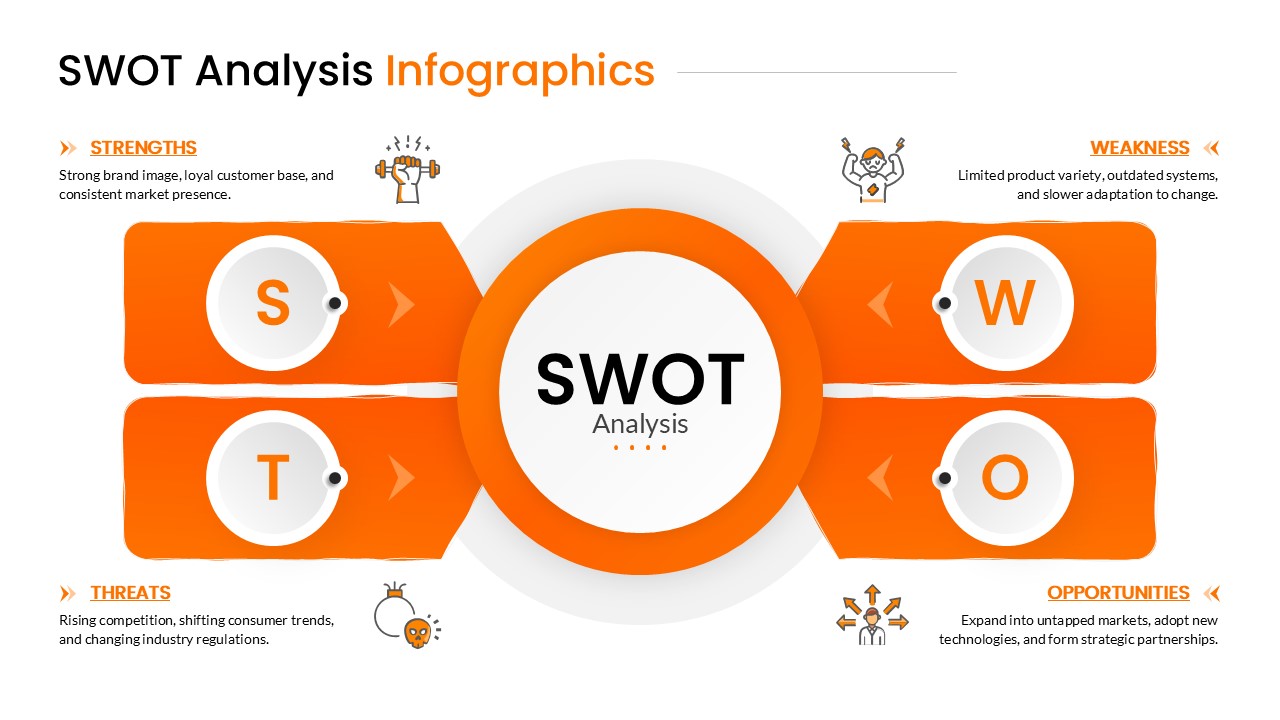
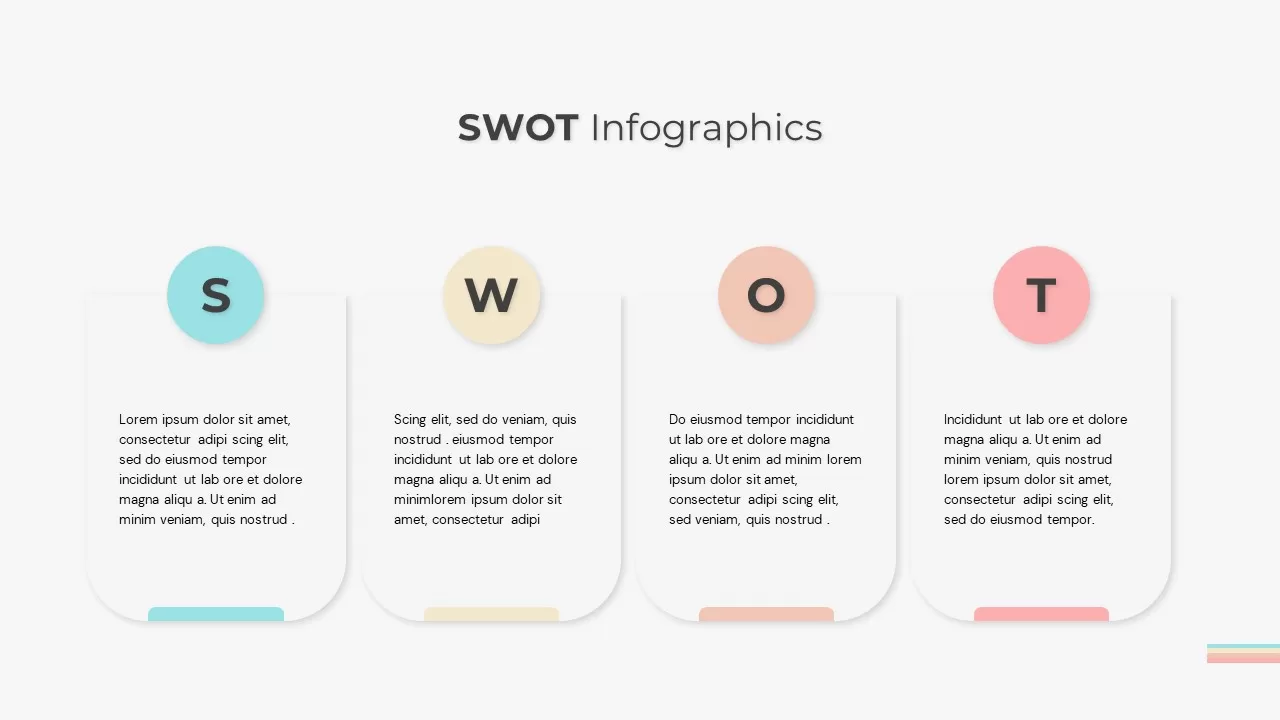
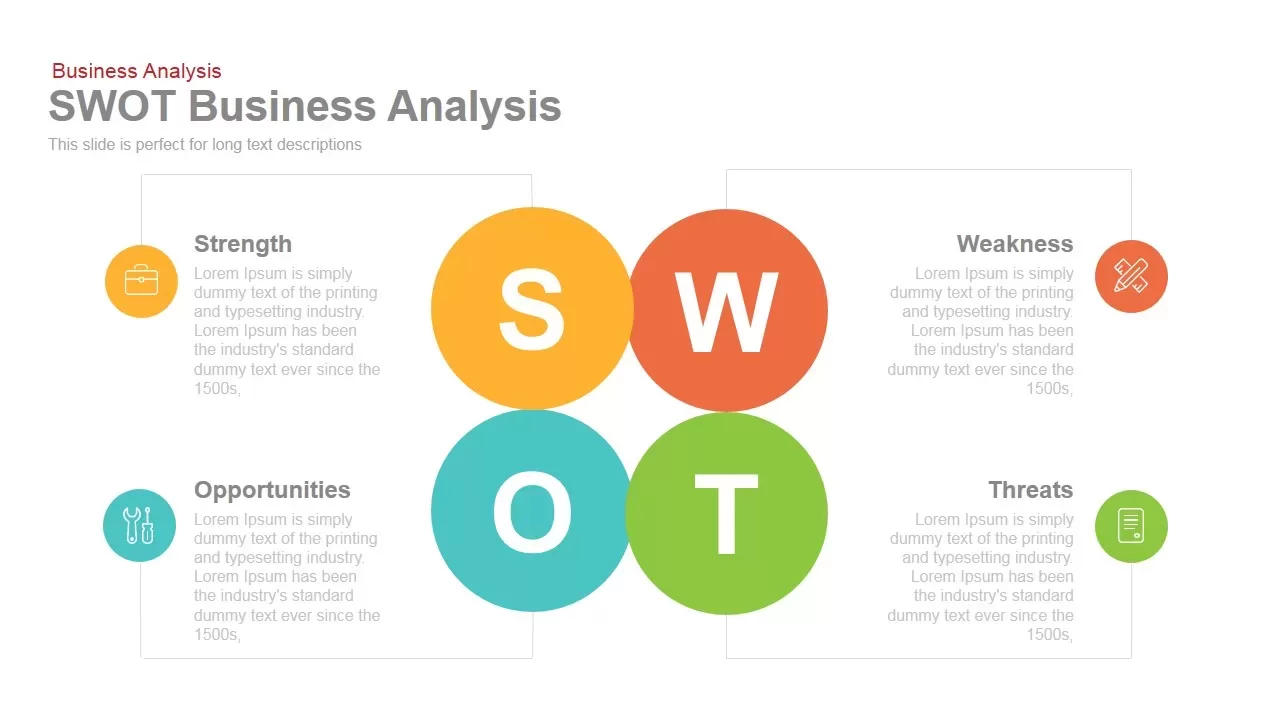
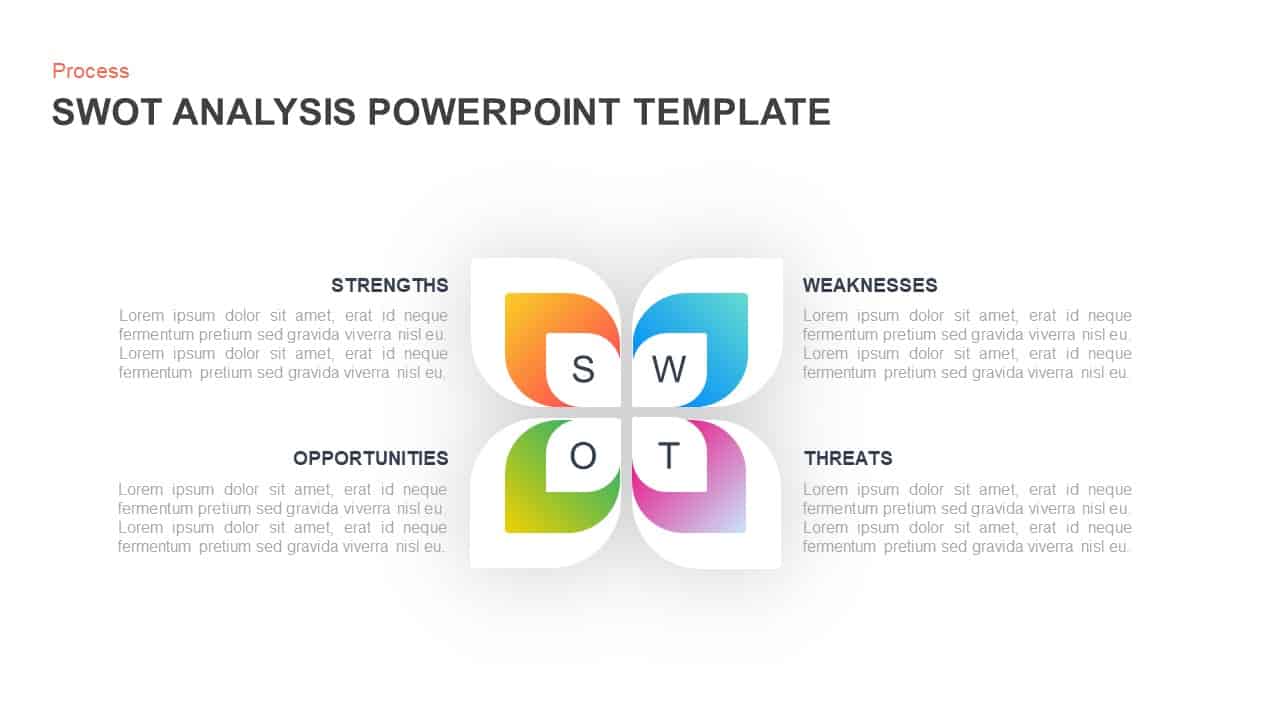
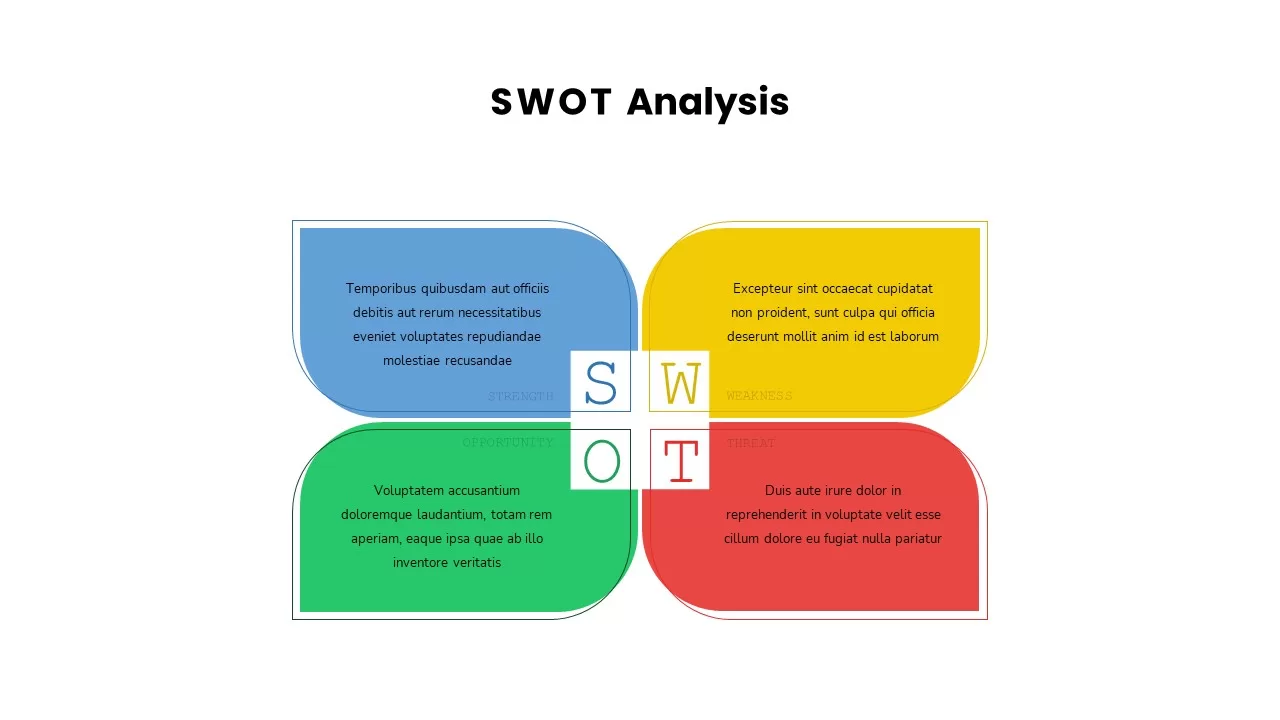
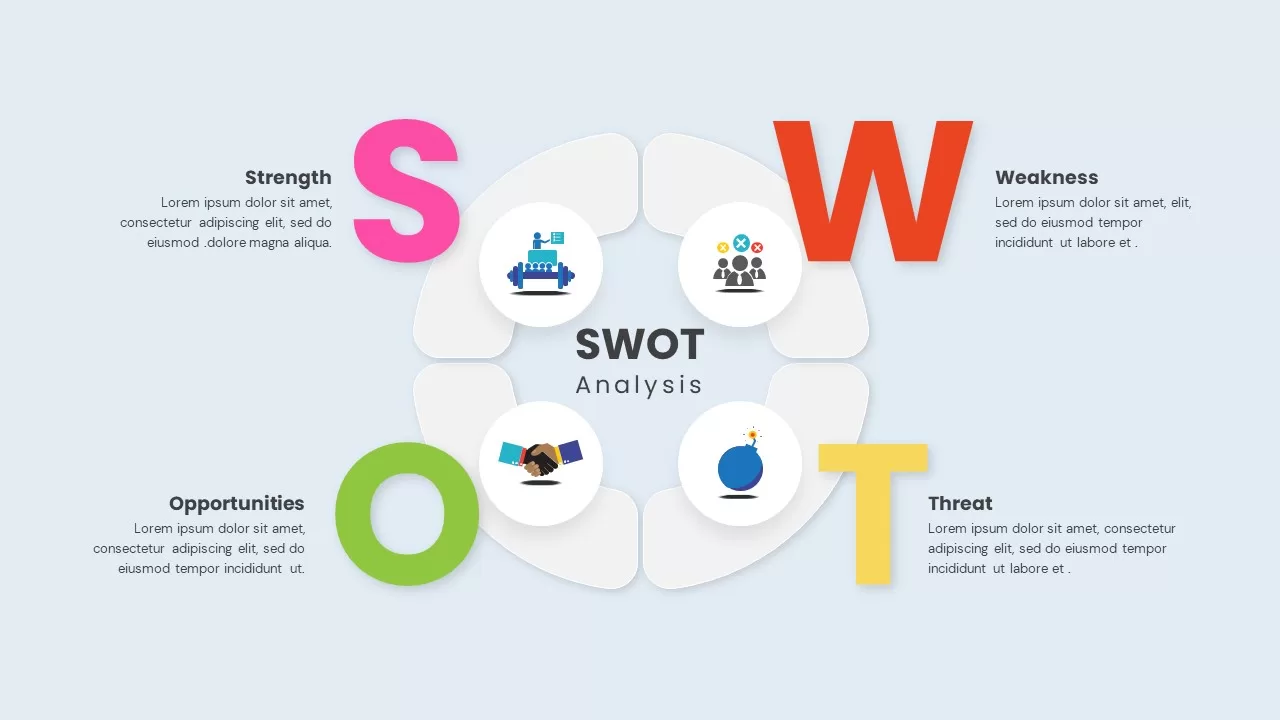
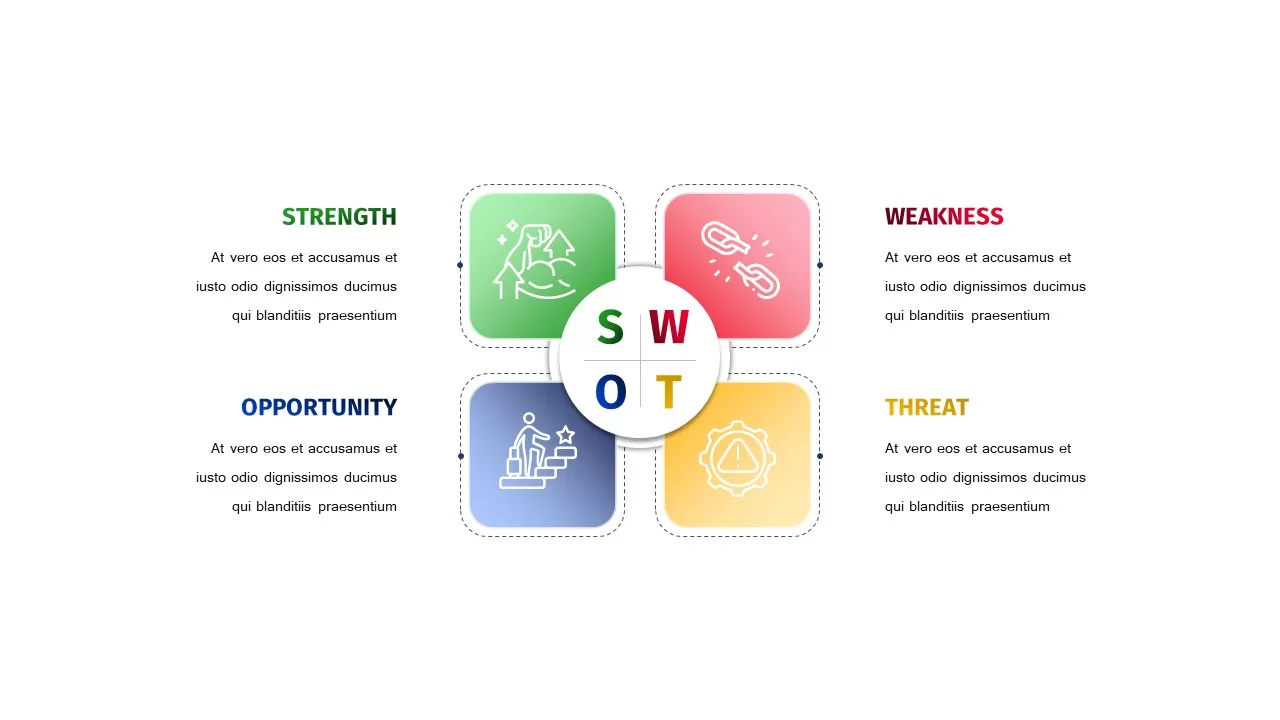
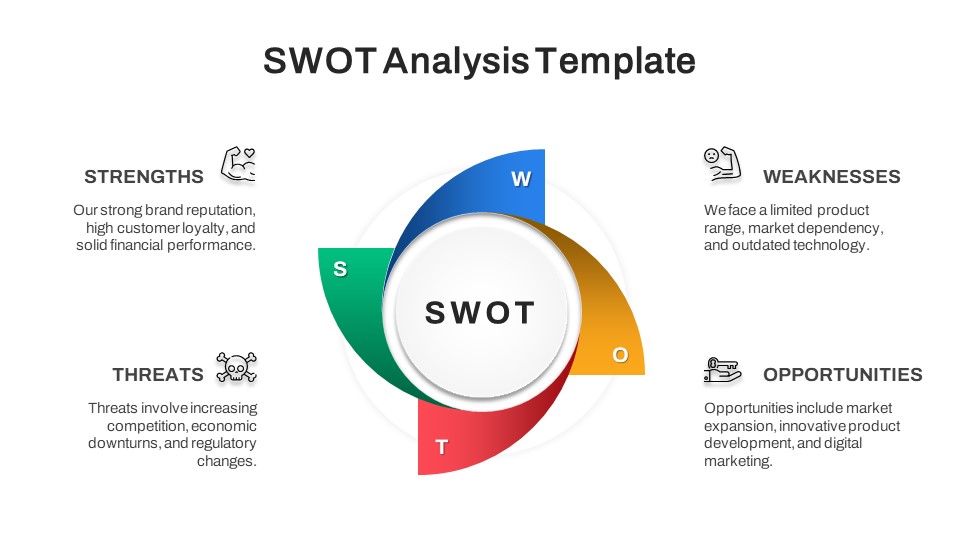
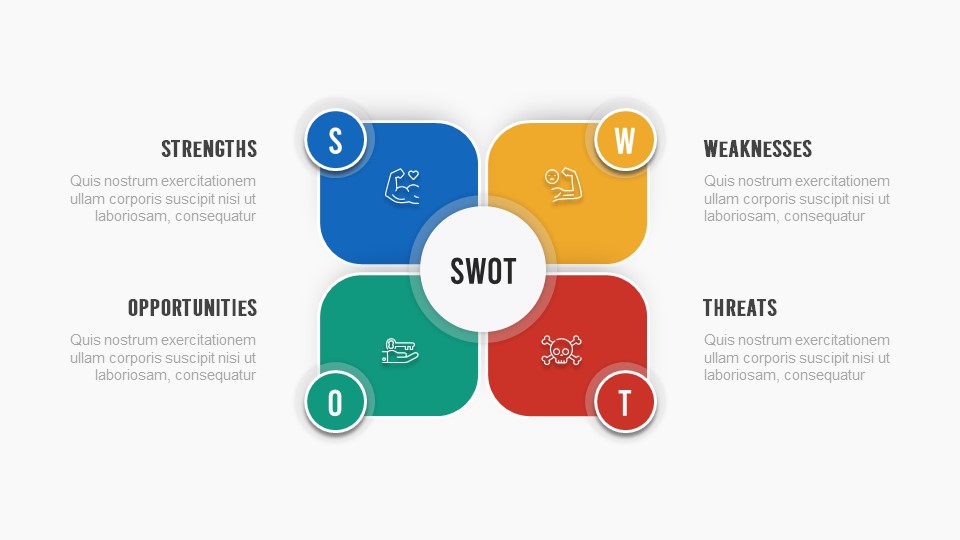
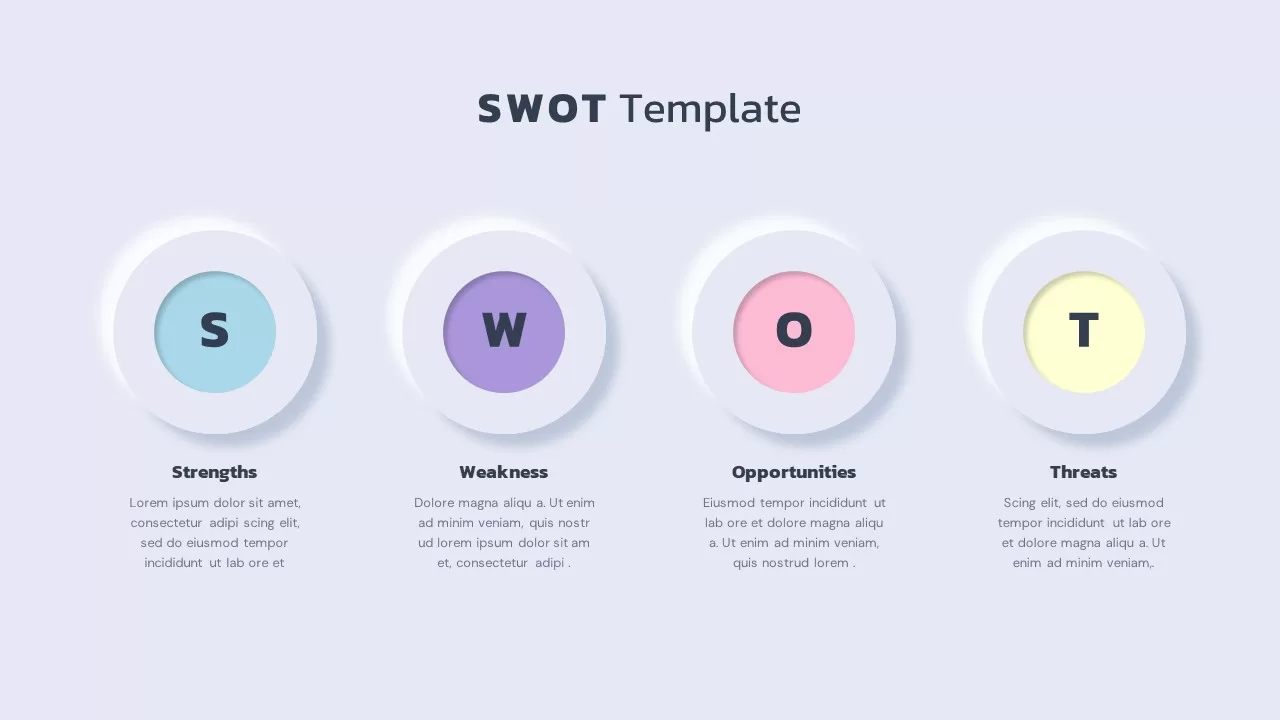
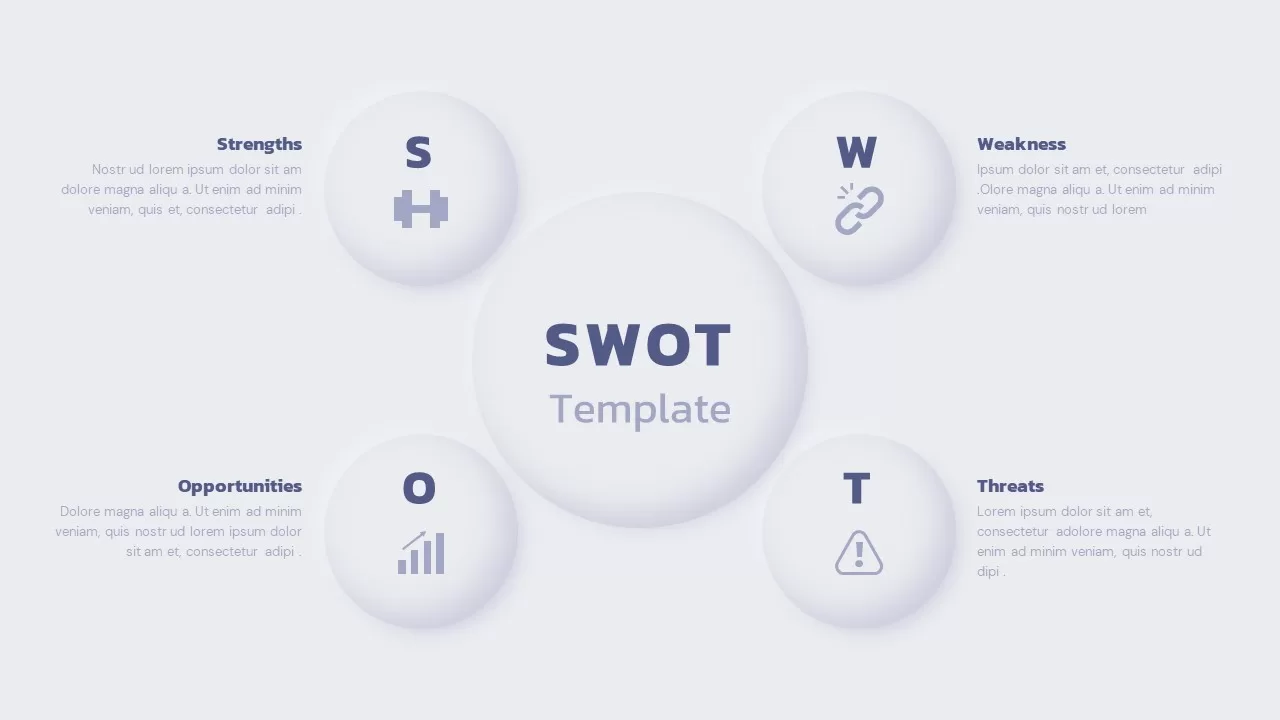
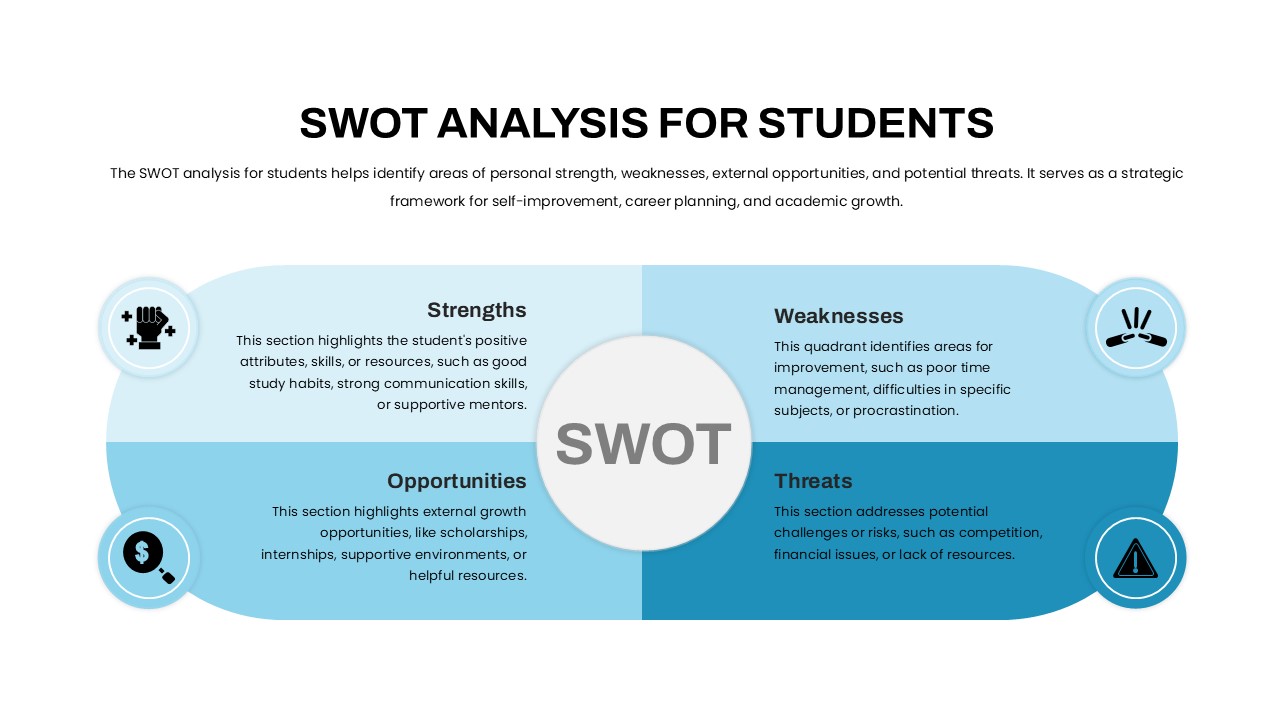
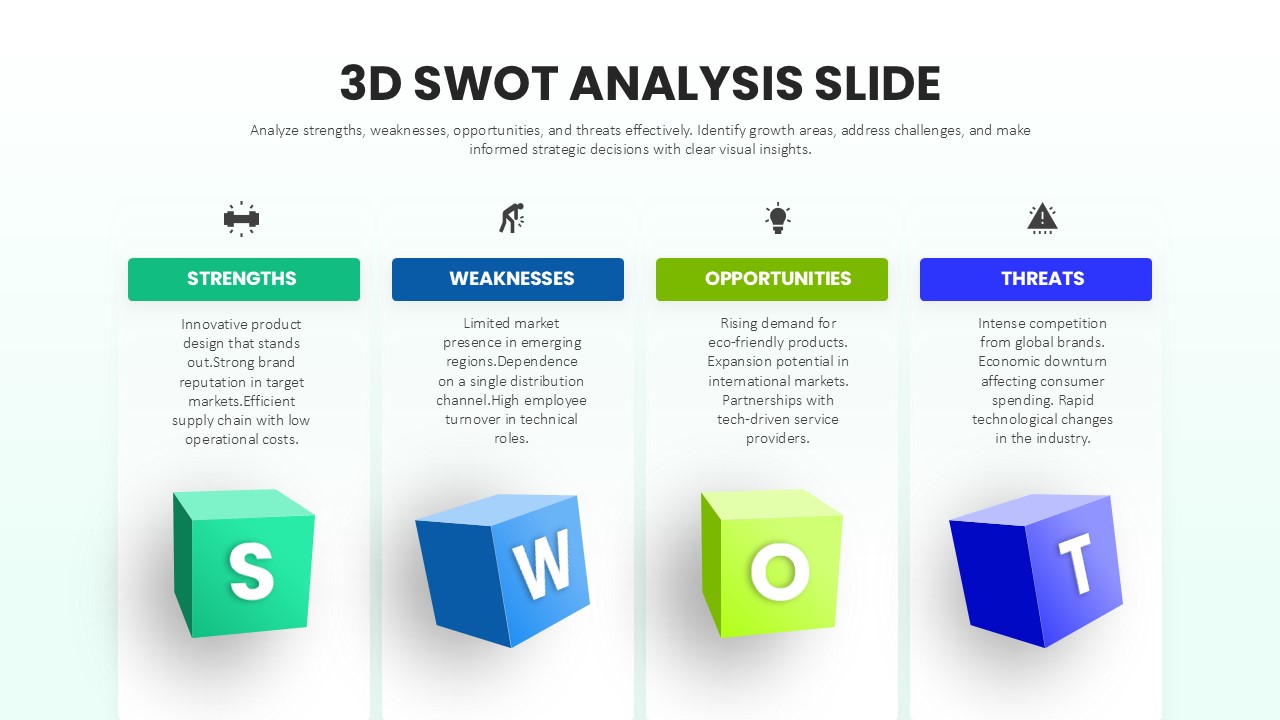
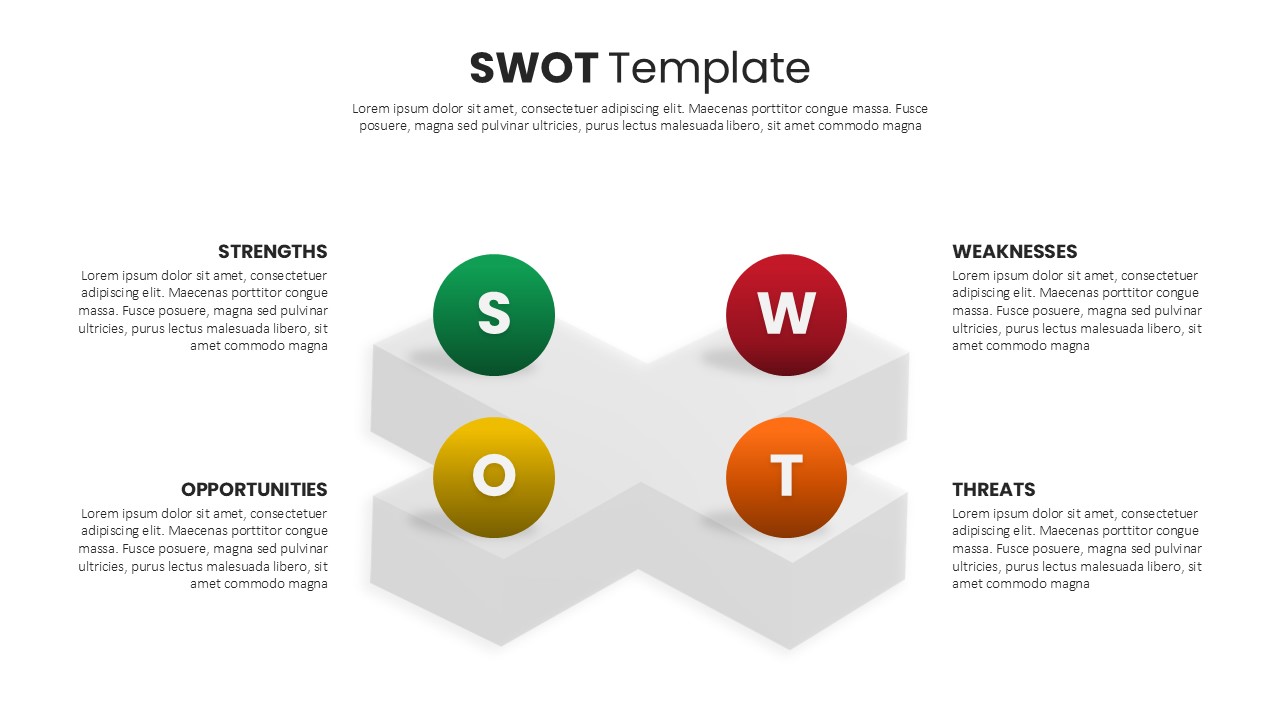
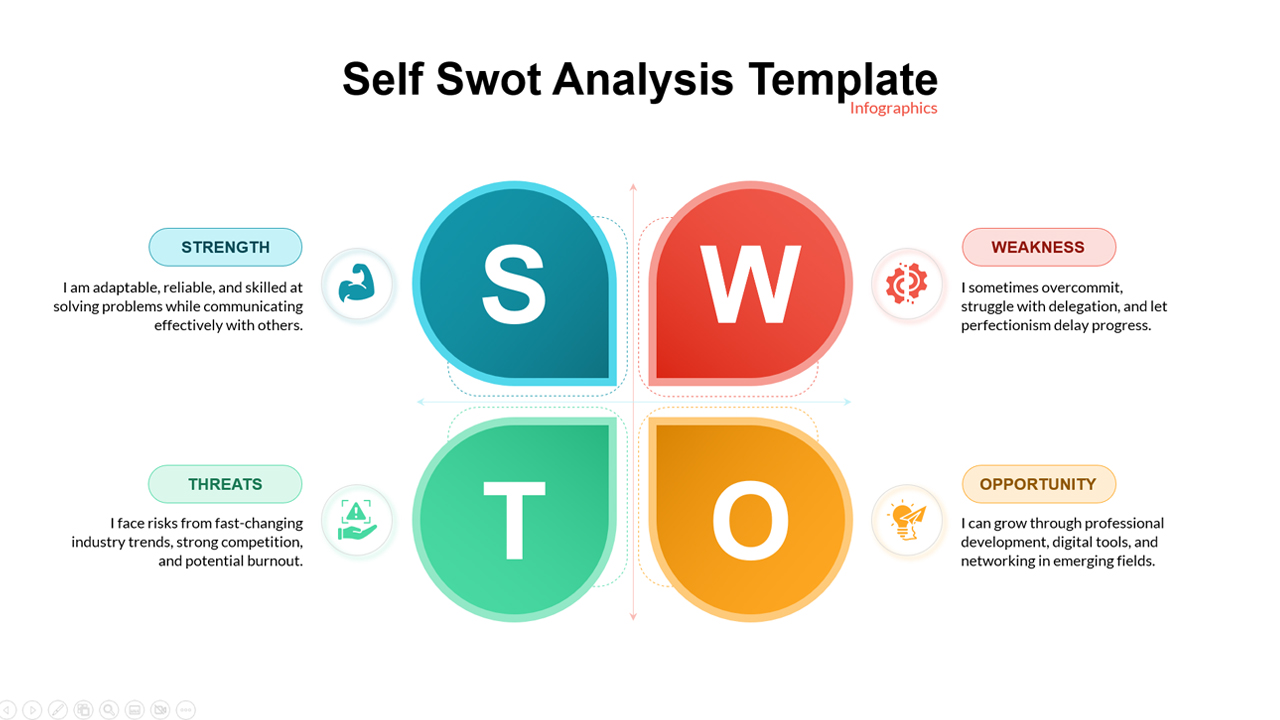
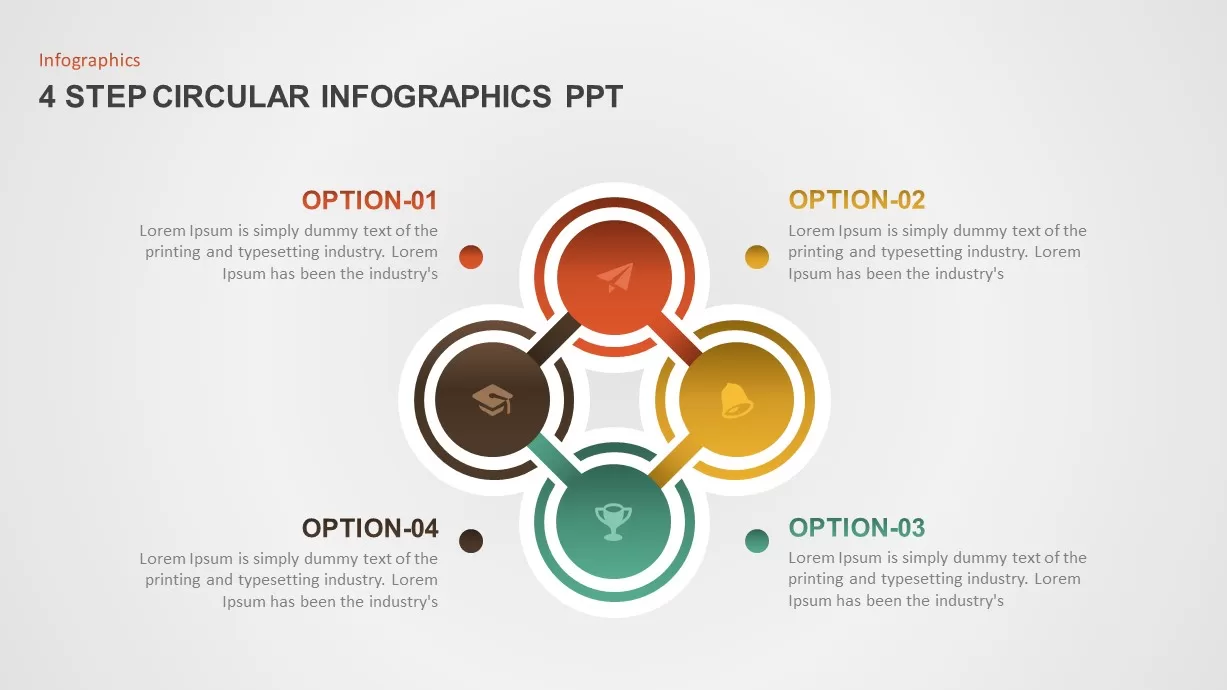
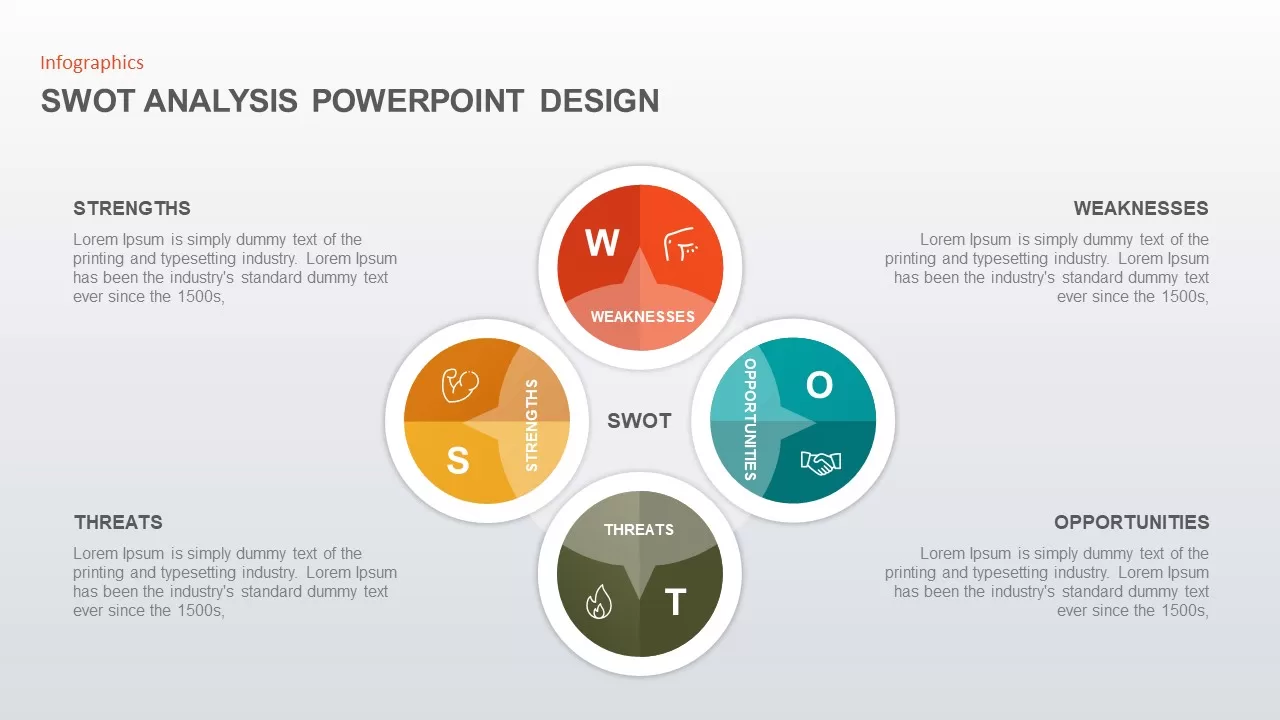
Visualize your SWOT analysis with this clean, four-quadrant circular infographic template for PowerPoint & Google Slides. Each quadrant highlights one element of SWOT—Strengths, Weaknesses, Opportunities, and Threats—in distinct, vibrant colors: golden yellow for Strengths, fiery red for Weaknesses, teal for Opportunities, and olive green for Threats. The central hub clearly displays “SWOT” to anchor your strategic overview. Surrounding each icon-labeled circle, ample text placeholders allow concise descriptions of key factors. The minimalist white background and subtle drop shadows ensure clarity and focus on your content. All shapes are fully editable and resizable, letting you adjust color themes, icon styles, and text with ease. With built-in master layouts, users can add or remove quadrants, change color schemes, and scale graphics without losing resolution. Optimized for collaboration, this slide works seamlessly in both PowerPoint and Google Slides, maintaining consistent formatting across platforms. Designed with built-in alignment guides and a cohesive icon library, this template ensures professional layout integrity and typographic consistency. Users can swap icons, tweak quadrant sizes, and apply alternate color themes to emphasize priority factors. The infographic preserves crisp legibility and quality for both virtual presentations and printed handouts.
Who is it for
Business leaders, marketing managers, consultants, startup founders, and strategists can leverage this template to communicate competitive analyses, market assessments, product positioning, and risk evaluations. It suits corporate presentations, boardroom briefings, and academic projects that require a structured strategic overview.
Other Uses
Beyond SWOT analysis, repurpose this circular infographic to showcase four-part processes, project phases, performance metrics, or departmental comparisons. Use the quadrant layout for risk assessments, vendor evaluations, priority matrices, or balanced scorecards. Duplicate and customize the slide to create consistent visuals across reports, training modules, and stakeholder communications.
Login to download this file

Item ID
SB01806
Related Templates

Circular SWOT Analysis Infographic Template for PowerPoint & Google Slides
SWOT
SWOT Analysis Infographic with Circular Icons Template for PowerPoint & Google Slides
SWOT
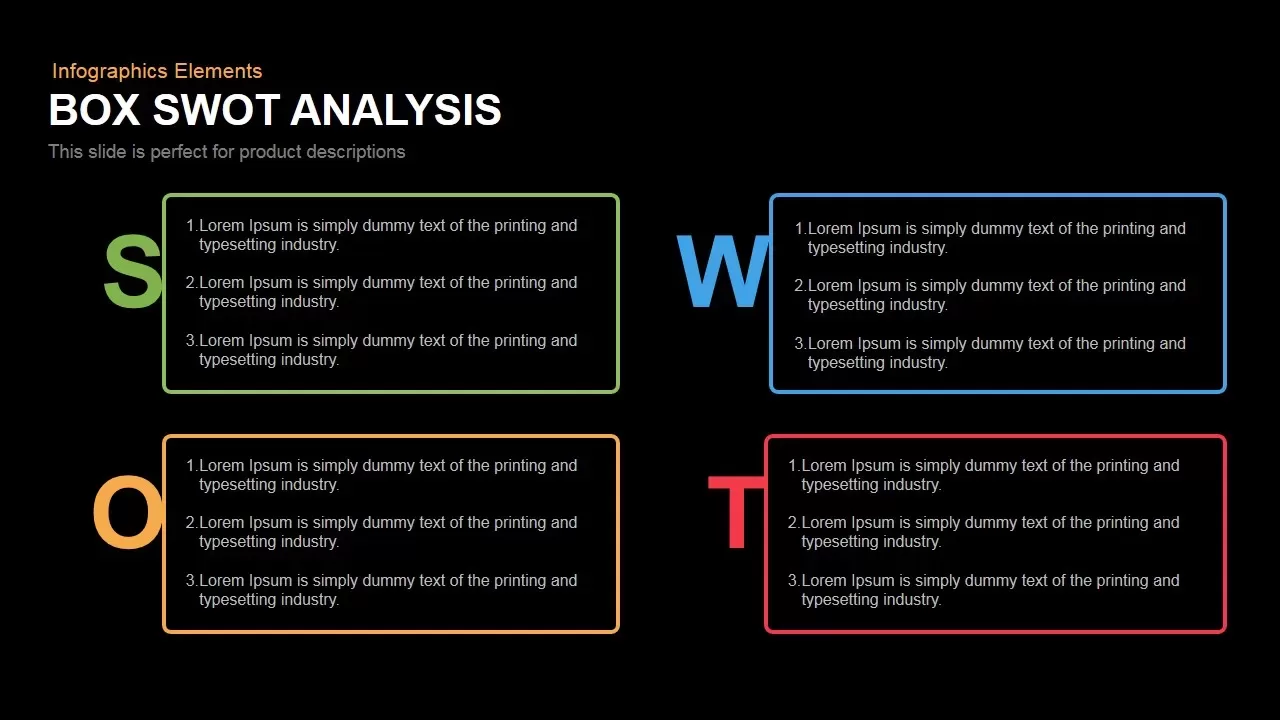
Box SWOT Analysis Infographic Template for PowerPoint & Google Slides
SWOT
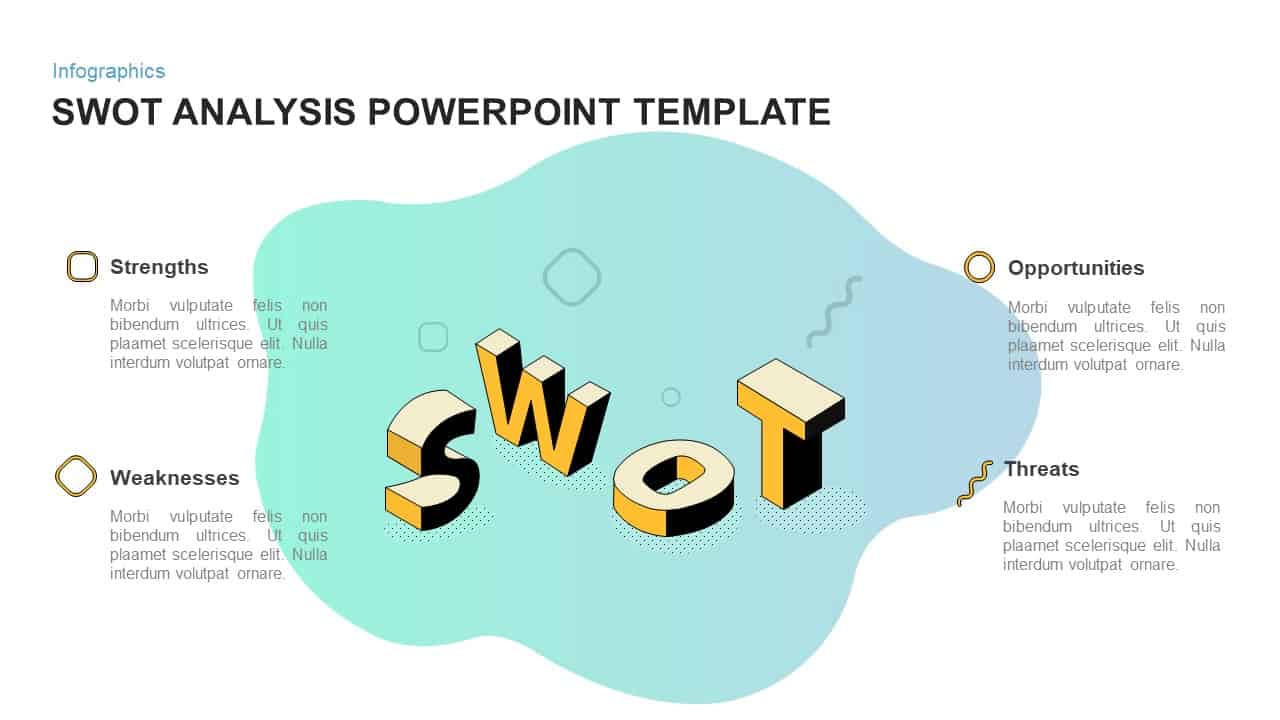
3D Blob SWOT Analysis Infographic Template for PowerPoint & Google Slides
SWOT
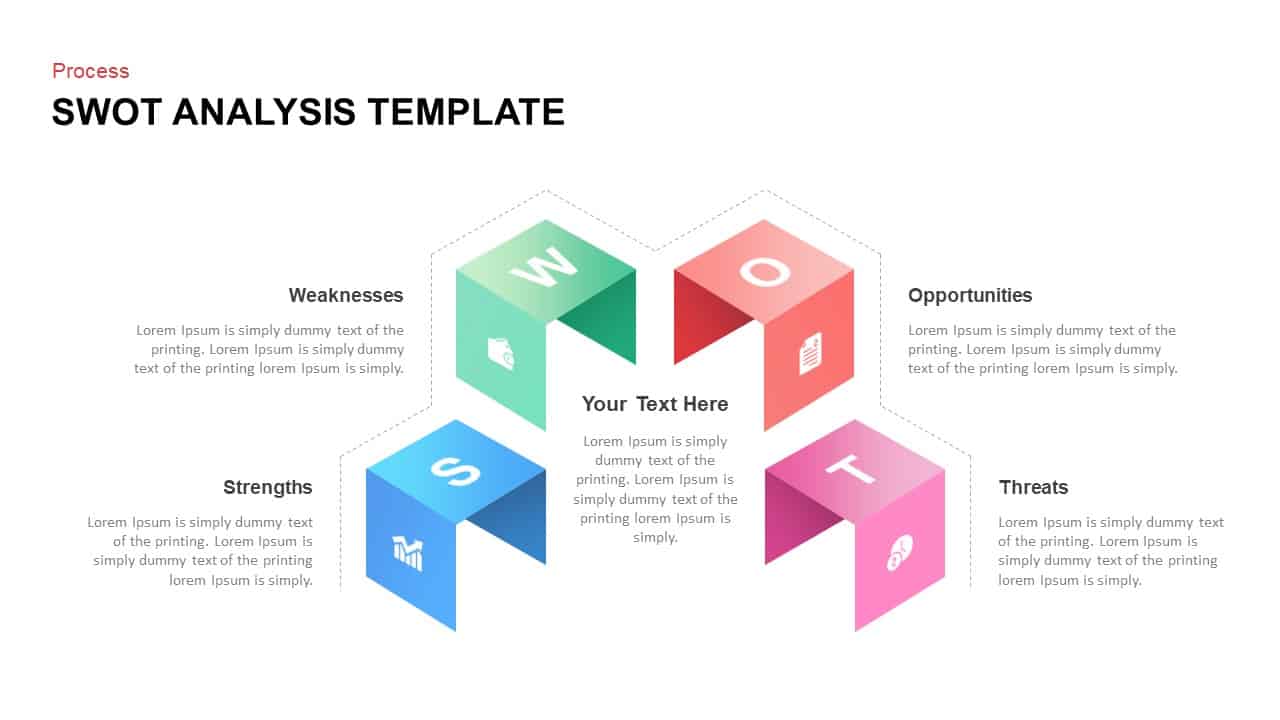
3D Cube SWOT Analysis Infographic Template for PowerPoint & Google Slides
SWOT

SWOT Analysis Infographic Diagram Template for PowerPoint & Google Slides
SWOT
SWOT Analysis Petal Infographic Template for PowerPoint & Google Slides
SWOT
SWOT Analysis Grid Infographic Template for PowerPoint & Google Slides
SWOT
Orange SWOT Analysis Infographic Template for PowerPoint & Google Slides
SWOT
SWOT Analysis Infographic Slide for PowerPoint & Google Slides
SWOT
SWOT Business Analysis template for PowerPoint & Google Slides
SWOT
Box Business SWOT Analysis Template for PowerPoint & Google Slides
SWOT
Modern Circle SWOT Analysis Diagram Template for PowerPoint & Google Slides
SWOT
SWOT Analysis template for PowerPoint & Google Slides
SWOT
Free SWOT Analysis template for PowerPoint & Google Slides
SWOT
Free
Puzzle-Style SWOT Analysis Table Diagram Template for PowerPoint & Google Slides
SWOT
SWOT Analysis Gear Diagram Slide Template for PowerPoint & Google Slides
SWOT
Four-Quadrant SWOT Analysis Diagram Template for PowerPoint & Google Slides
SWOT
Interactive 3D Puzzle SWOT Analysis Slide Template for PowerPoint & Google Slides
SWOT
Gradient Petal SWOT Analysis Quadrant Template for PowerPoint & Google Slides
SWOT
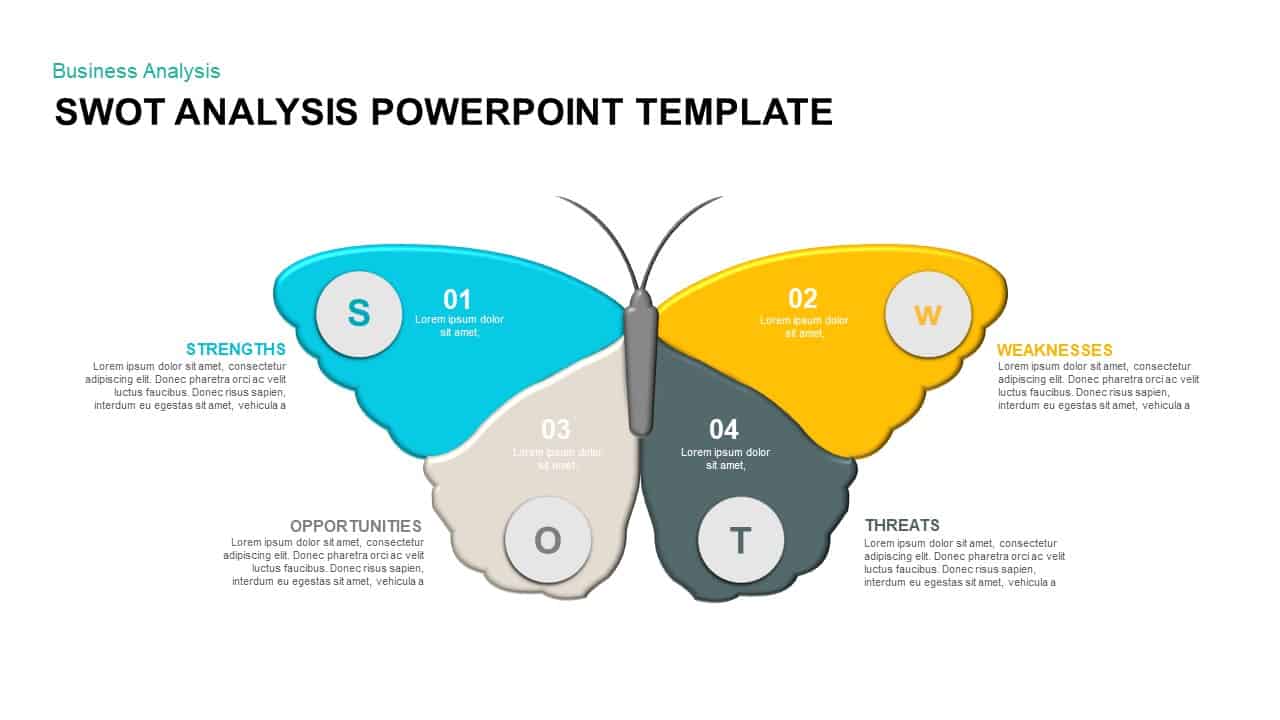
Butterfly SWOT Analysis Diagram Template for PowerPoint & Google Slides
SWOT
Four-Part SWOT Analysis Diagram Template for PowerPoint & Google Slides
SWOT
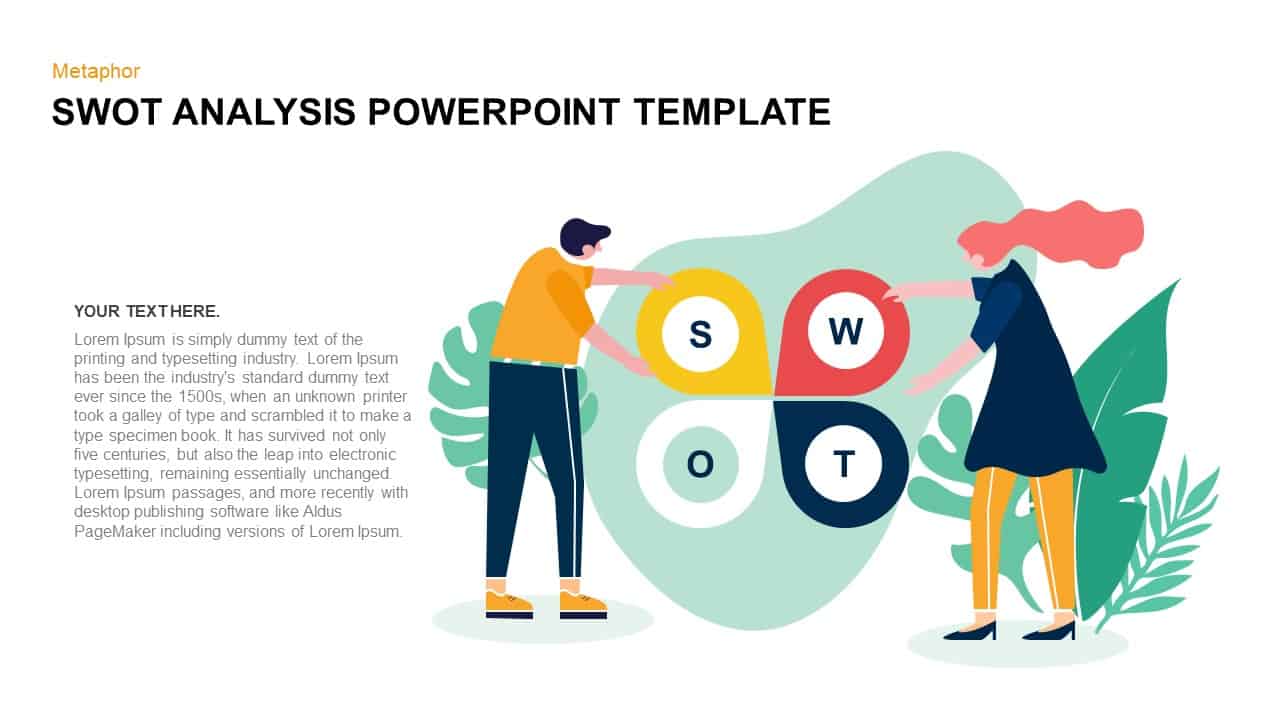
SWOT Analysis Metaphor Illustration Template for PowerPoint & Google Slides
SWOT
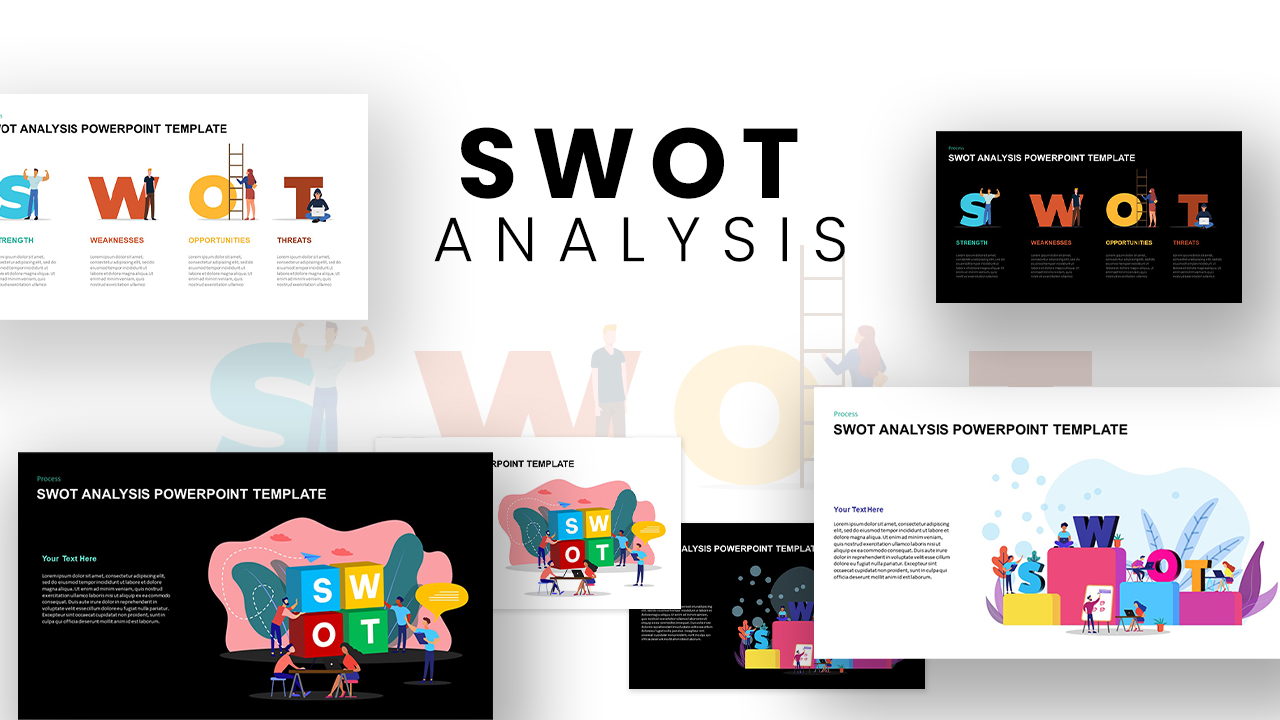
Versatile SWOT Analysis Slide Collection Template for PowerPoint & Google Slides
SWOT
Illustrated Business SWOT Analysis Template for PowerPoint & Google Slides
SWOT
Modern Colorful SWOT Quadrant Analysis Template for PowerPoint & Google Slides
SWOT
Colorful SWOT Analysis Quadrant Template for PowerPoint & Google Slides
SWOT
Colorful Vertical SWOT Analysis Layout Template for PowerPoint & Google Slides
SWOT
SWOT Analysis Framework template for PowerPoint & Google Slides
SWOT
SWOT Analysis Overview template for PowerPoint & Google Slides
Business
SWOT Analysis Visual Overview template for PowerPoint & Google Slides
Business Strategy
SWOT Analysis Quadrant template for PowerPoint & Google Slides
Business Strategy
SWOT Analysis Blocks template for PowerPoint & Google Slides
Business Strategy
SWOT Analysis Quadrant template for PowerPoint & Google Slides
Business Strategy
SWOT Analysis Template for PowerPoint & Google Slides
Business Strategy

Free SWOT Analysis Template for PowerPoint & Google Slides
SWOT
Free
Free SWOT Analysis Overview template for PowerPoint & Google Slides
SWOT
Free
SWOT Analysis template for PowerPoint & Google Slides
SWOT
SWOT Analysis template for PowerPoint & Google Slides
SWOT
Puzzle Piece SWOT Analysis Diagram Template for PowerPoint & Google Slides
Opportunities Challenges
Photo Personal SWOT Analysis Callouts Template for PowerPoint & Google Slides
SWOT
Colorful SWOT Analysis Diagram Template for PowerPoint & Google Slides
SWOT
Marketing SWOT Analysis Slide Template for PowerPoint & Google Slides
SWOT
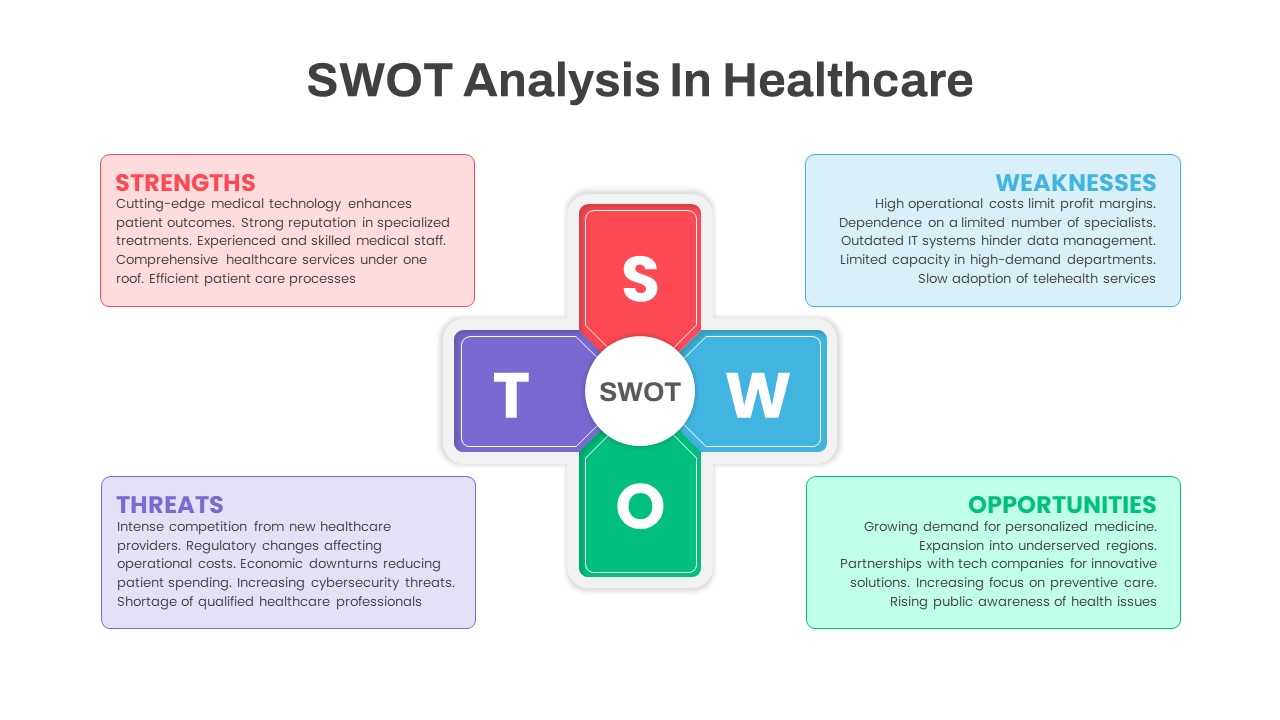
SWOT Analysis in Healthcare template for PowerPoint & Google Slides
SWOT
Student SWOT Analysis Framework Template for PowerPoint & Google Slides
SWOT
Colorful SWOT Analysis Quadrant Template for PowerPoint & Google Slides
SWOT
Trapezoid SWOT Analysis Template for PowerPoint & Google Slides
SWOT
Blue SWOT Analysis Presentation Template for PowerPoint & Google Slides
SWOT
Multi Color SWOT Analysis Quadrant Template for PowerPoint & Google Slides
SWOT
Linear SWOT Analysis Slide Template for PowerPoint & Google Slides
SWOT
3D SWOT Analysis Template for PowerPoint & Google Slides
SWOT
Personal SWOT Analysis Matrix Cards Template for PowerPoint & Google Slides
SWOT
Blank SWOT Analysis Template for PowerPoint & Google Slides
SWOT
3D Quadrant SWOT Analysis Template for PowerPoint & Google Slides
SWOT
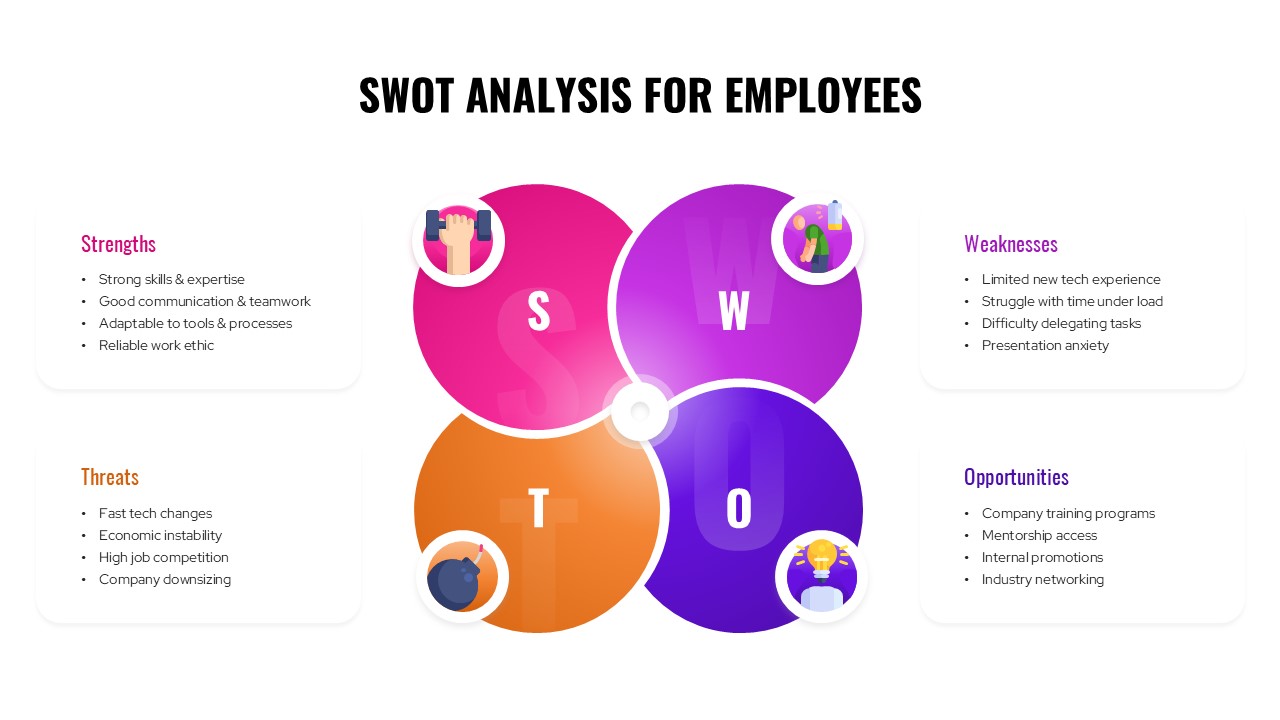
SWOT Analysis For Employees Template for PowerPoint & Google Slides
SWOT
Self SWOT Analysis Template for PowerPoint & Google Slides
SWOT
Free SWOT Analysis for Personal Development Template for PowerPoint & Google Slides
SWOT
Free
SWOT Analysis for PowerPoint & Google Slides
SWOT
PEST Analysis Circular Diagram Template for PowerPoint & Google Slides
PEST
Fundamental Analysis Circular Diagram Template for PowerPoint & Google Slides
Circular
Cultural Web Analysis Circular Diagram Template for PowerPoint & Google Slides
Circular
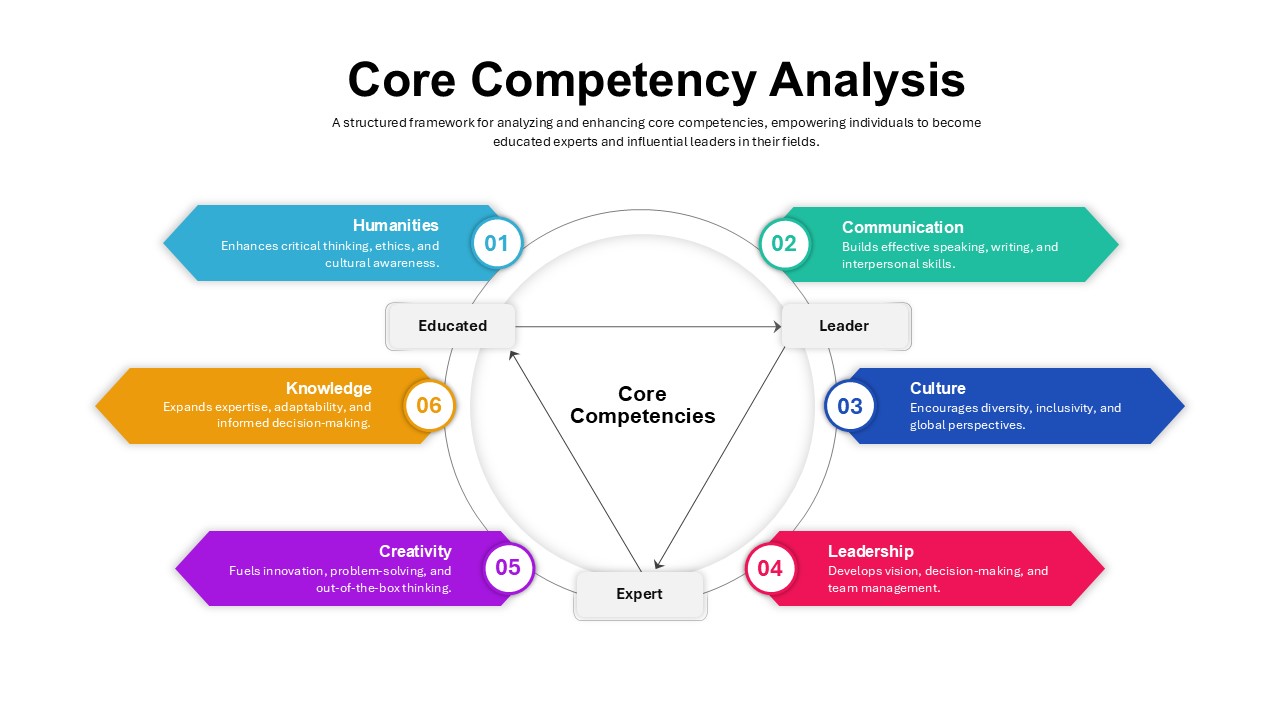
Core Competency Analysis Circular Template for PowerPoint & Google Slides
Circular
Six Section Circular Infographic Diagram Template for PowerPoint & Google Slides
Circular
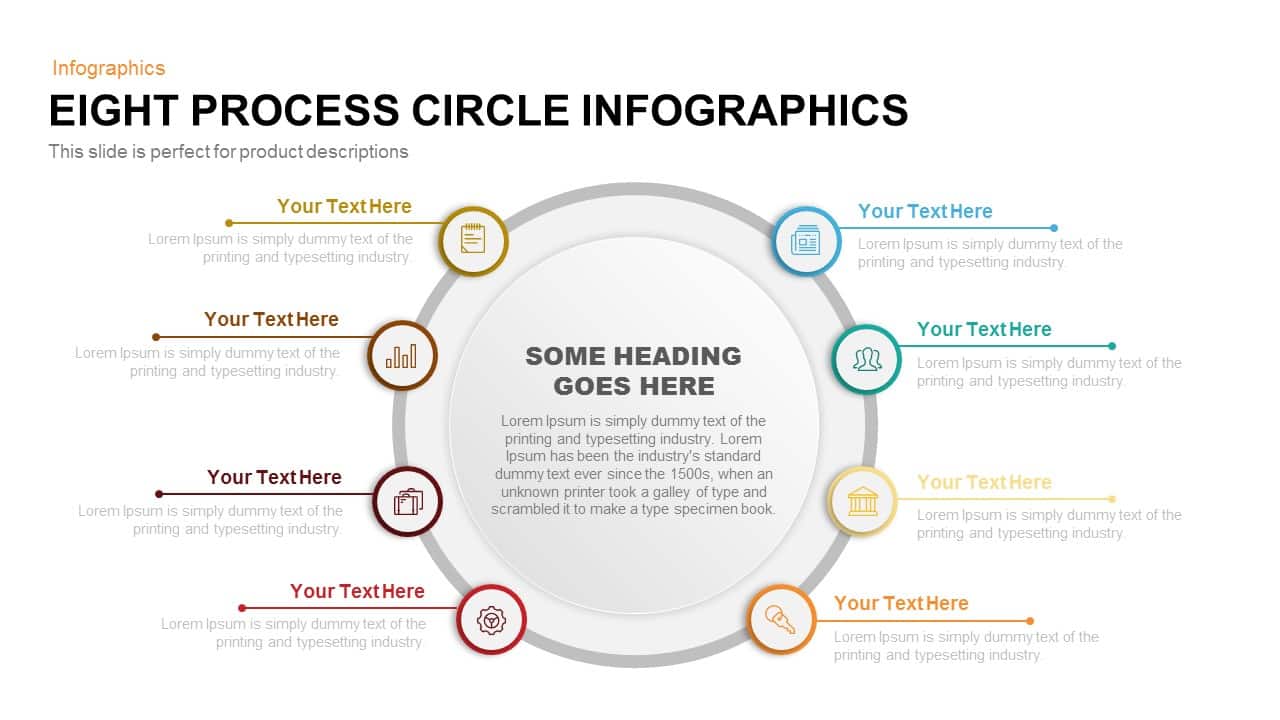
Eight-Stage Circular Process Infographic Template for PowerPoint & Google Slides
Circular
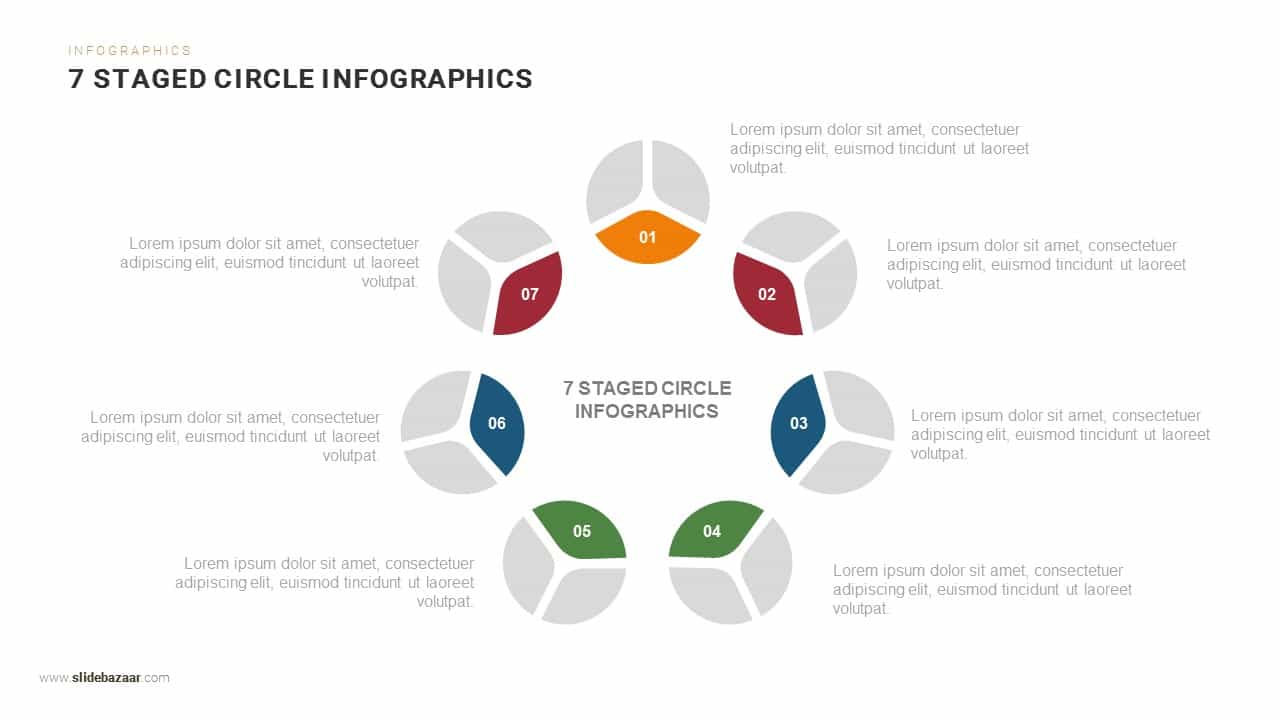
Seven-Stage Circular Infographic Template for PowerPoint & Google Slides
Circular
Six-Segment Circular Hub Infographic Template for PowerPoint & Google Slides
Circular
Eight-Step Circular Diagram Infographic Template for PowerPoint & Google Slides
Circular
Five-Stage Circular Infographic Diagram Template for PowerPoint & Google Slides
Process
Four-Stage Circular Diagram Infographic Template for PowerPoint & Google Slides
Circular
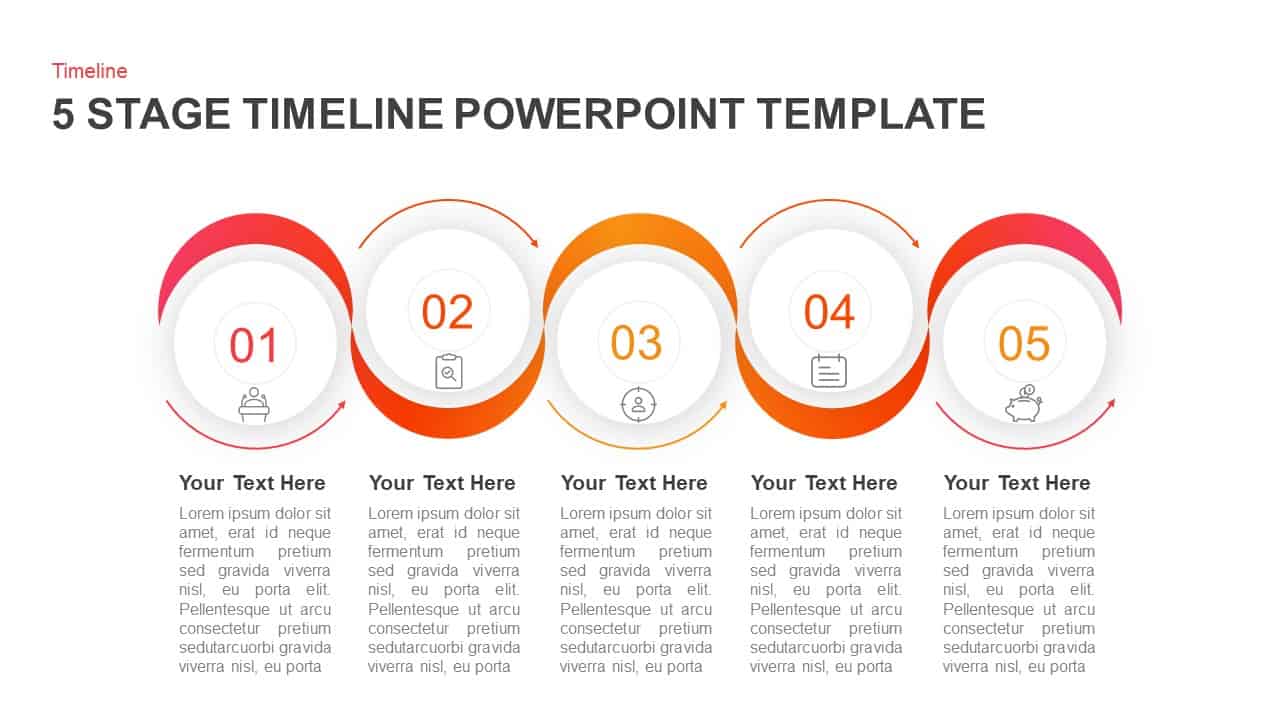
5 Stage Circular Timeline Infographic Template for PowerPoint & Google Slides
Timeline
4 Factors Circular Diagram Infographic Template for PowerPoint & Google Slides
Circular
Circular CRM Process Diagram Infographic Template for PowerPoint & Google Slides
Circular
Circular Three-Step Infographic Diagram Template for PowerPoint & Google Slides
Circular
Circular Market Drivers Infographic Template for PowerPoint & Google Slides
Circular
4-Step Circular Roadmap Infographic Template for PowerPoint & Google Slides
Roadmap
Circular Core Values Infographic List Template for PowerPoint & Google Slides
Circular
6-Step Circular Diagram Infographic Template for PowerPoint & Google Slides
Circular
8-Step Circular Gear Infographic Diagram Template for PowerPoint & Google Slides
Circular
6-Part Circular Gear Infographic Diagram Template for PowerPoint & Google Slides
Process
Circular CRM Process Infographic Diagram Template for PowerPoint & Google Slides
Circular
4-Step Circular Infographic Diagram Template for PowerPoint & Google Slides
Circular
3 & 4 Step Circular Process Infographic Template for PowerPoint & Google Slides
Process
Modern Circular OODA Loop Infographic Template for PowerPoint & Google Slides
Circular
Circular Balanced Scorecard Infographic Template for PowerPoint & Google Slides
Business Strategy
Free Five-Step Circular Timeline Infographic Template for PowerPoint & Google Slides
Timeline
Free
Five-Stage Circular Arrow Infographic Template for PowerPoint & Google Slides
Circular
Accomplishment Circular Infographic Template for PowerPoint & Google Slides
Accomplishment
Six-Segment Circular Arrow Infographic Template for PowerPoint & Google Slides
Circular
Healthcare Nursing Circular Infographic Template for PowerPoint & Google Slides
Nursing
Ten Step Circular Process Infographic Template for PowerPoint & Google Slides
Process
Ten-Step Circular Process Infographic Template for PowerPoint & Google Slides
Circular
Dynamic Circular Hub-and-Spoke Infographic Template for PowerPoint & Google Slides
Circular
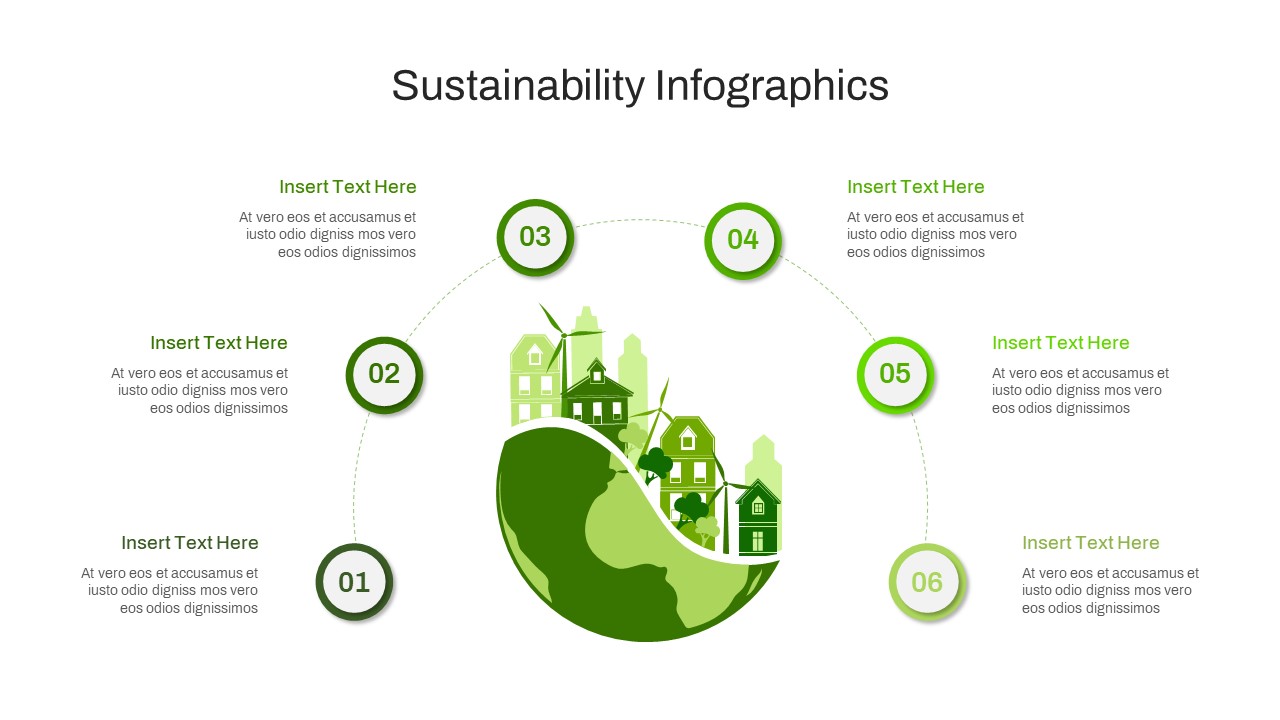
Circular Sustainability Infographic Template for PowerPoint & Google Slides
Process
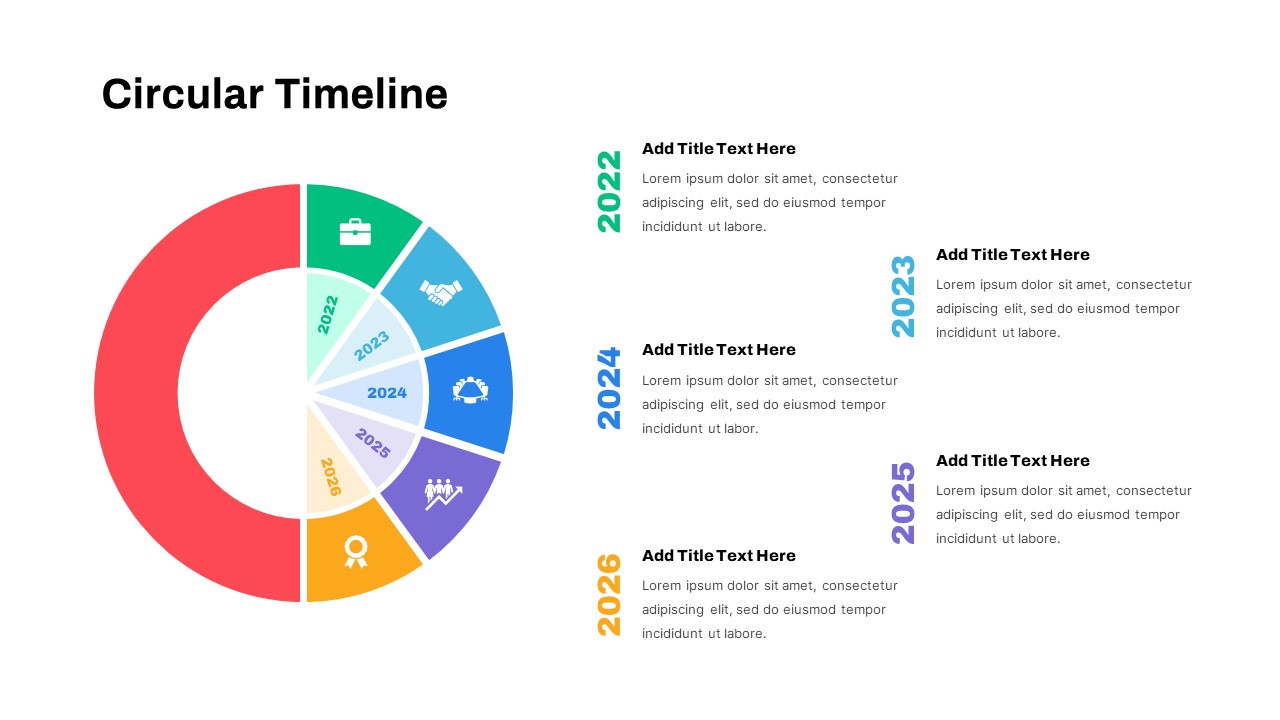
Circular Timeline Infographic Template for PowerPoint & Google Slides
Timeline
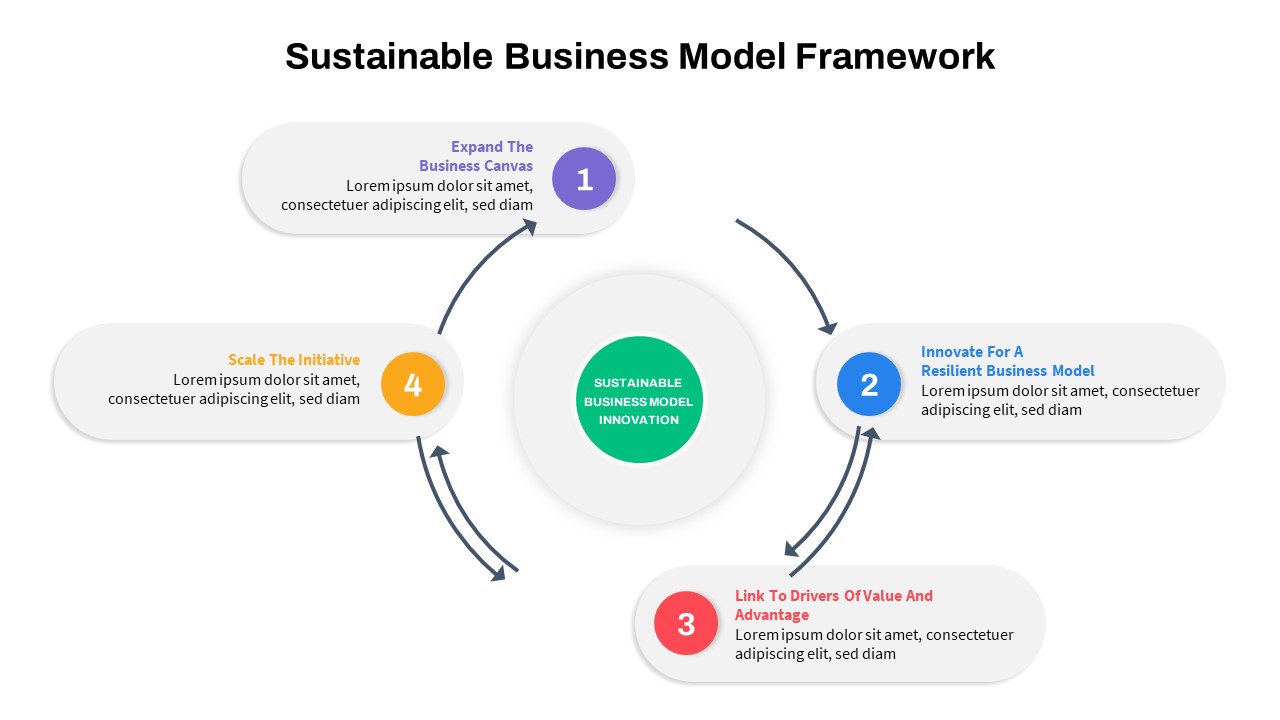
Sustainable Business Model Circular Infographic Template for PowerPoint & Google Slides
Business Strategy
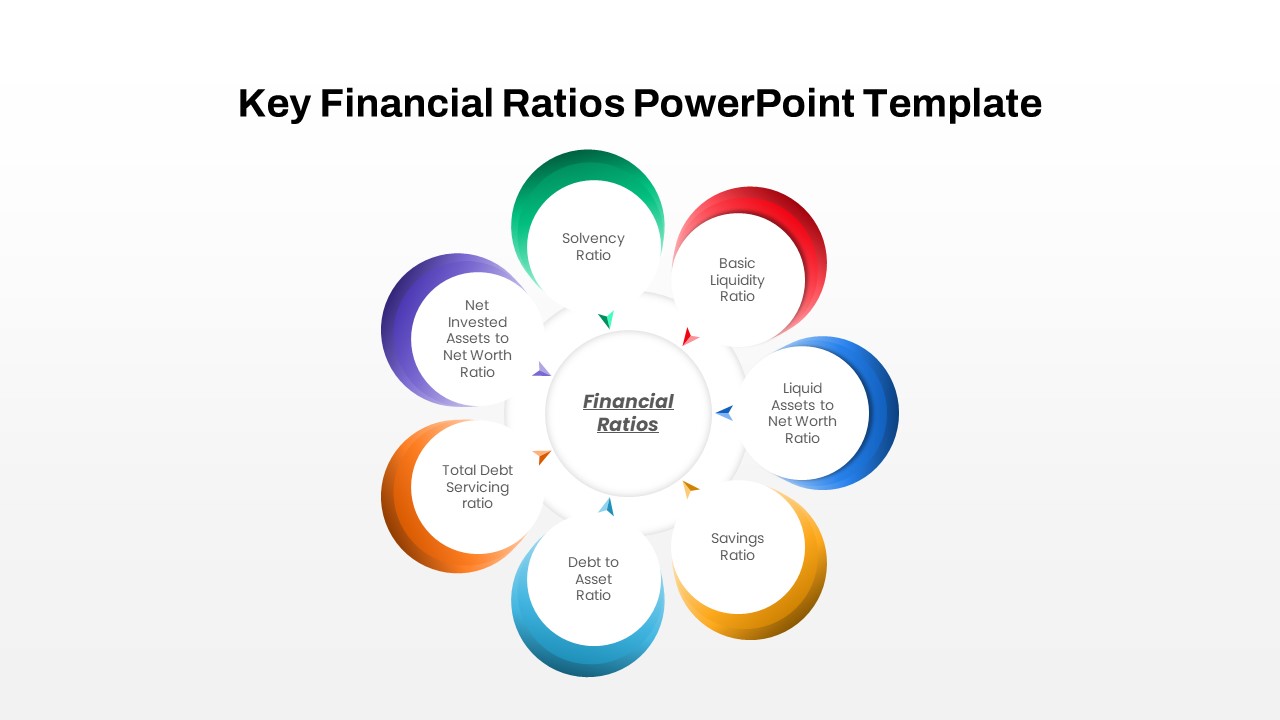
Circular Financial Ratios Infographic Template for PowerPoint & Google Slides
Finance
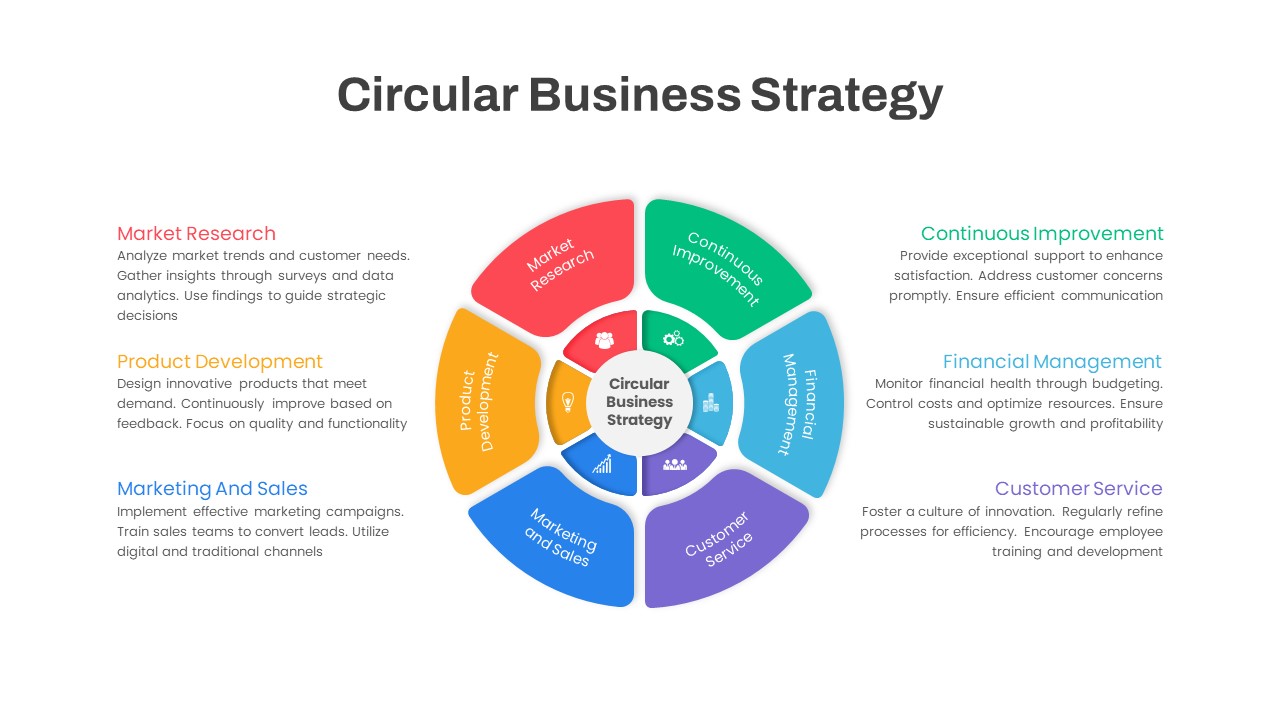
Circular Business Strategy Infographic Template for PowerPoint & Google Slides
Circular
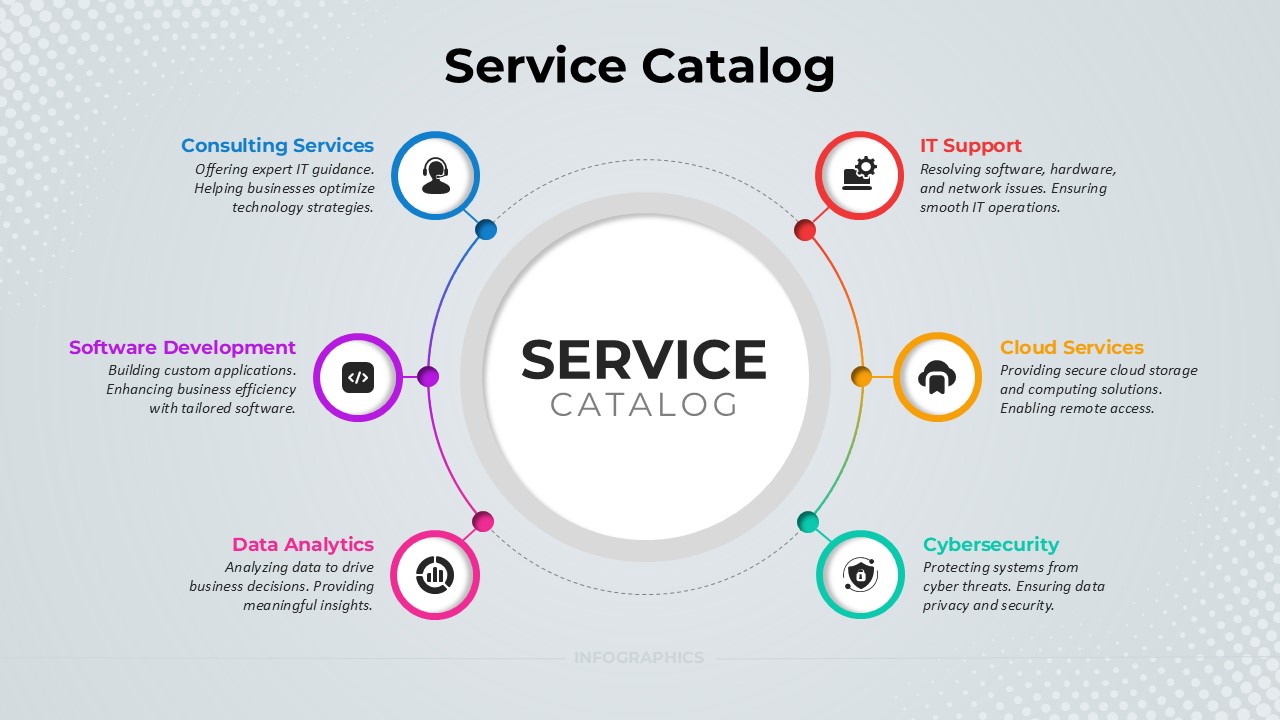
Service Catalog Circular Infographic Template for PowerPoint & Google Slides
Circular
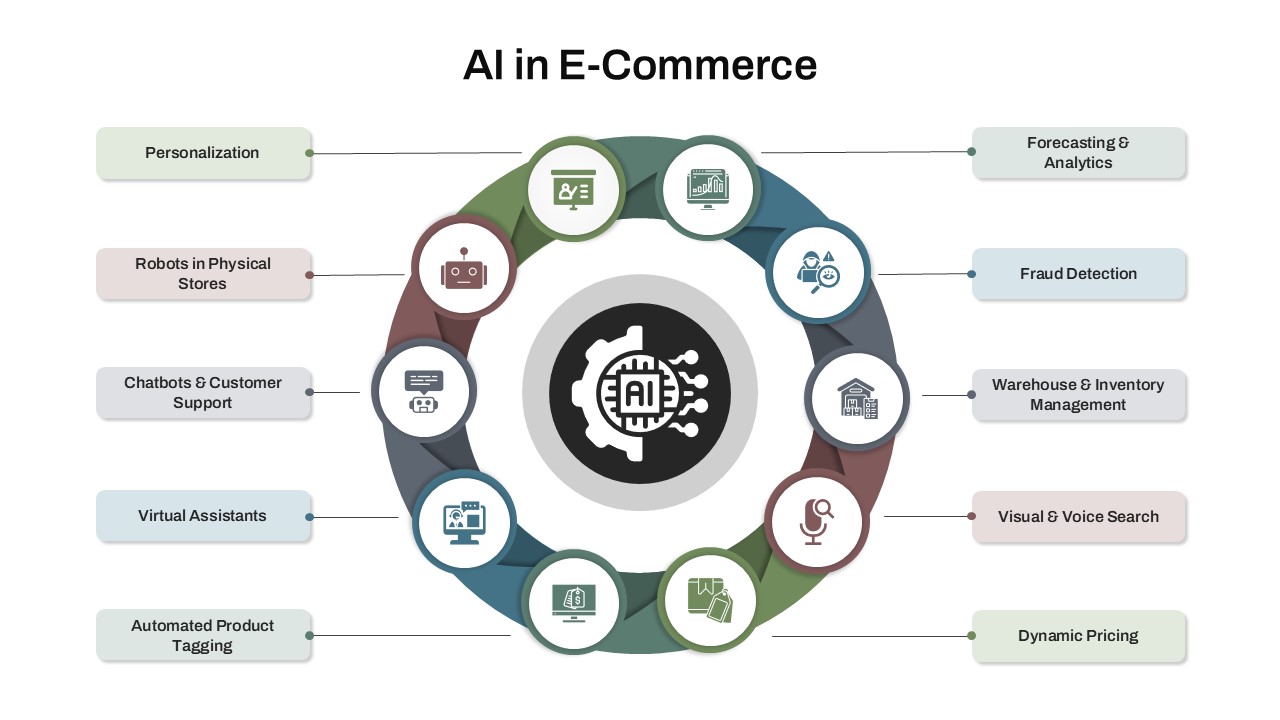
AI in E-Commerce Circular Infographic Template for PowerPoint & Google Slides
AI
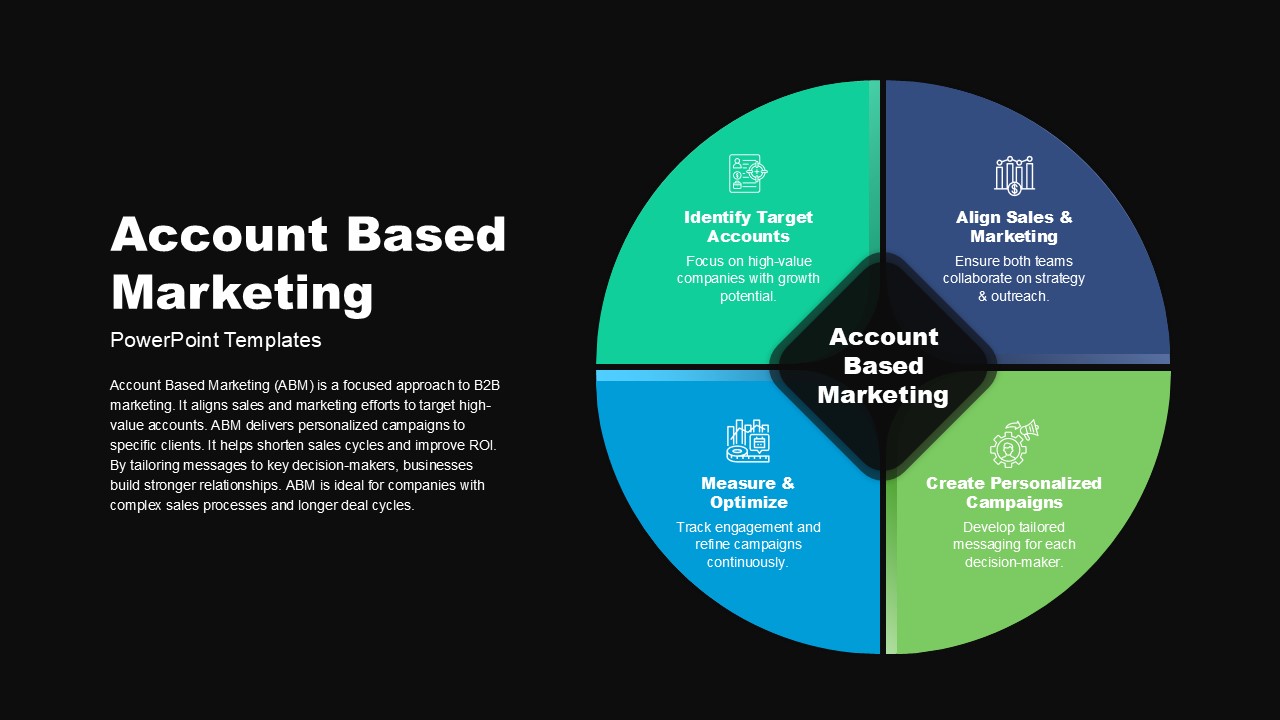
Account Based Marketing Circular Infographic Template for PowerPoint & Google Slides
Marketing