Circular Capital Allocation Diagram Template for PowerPoint & Google Slides


Description
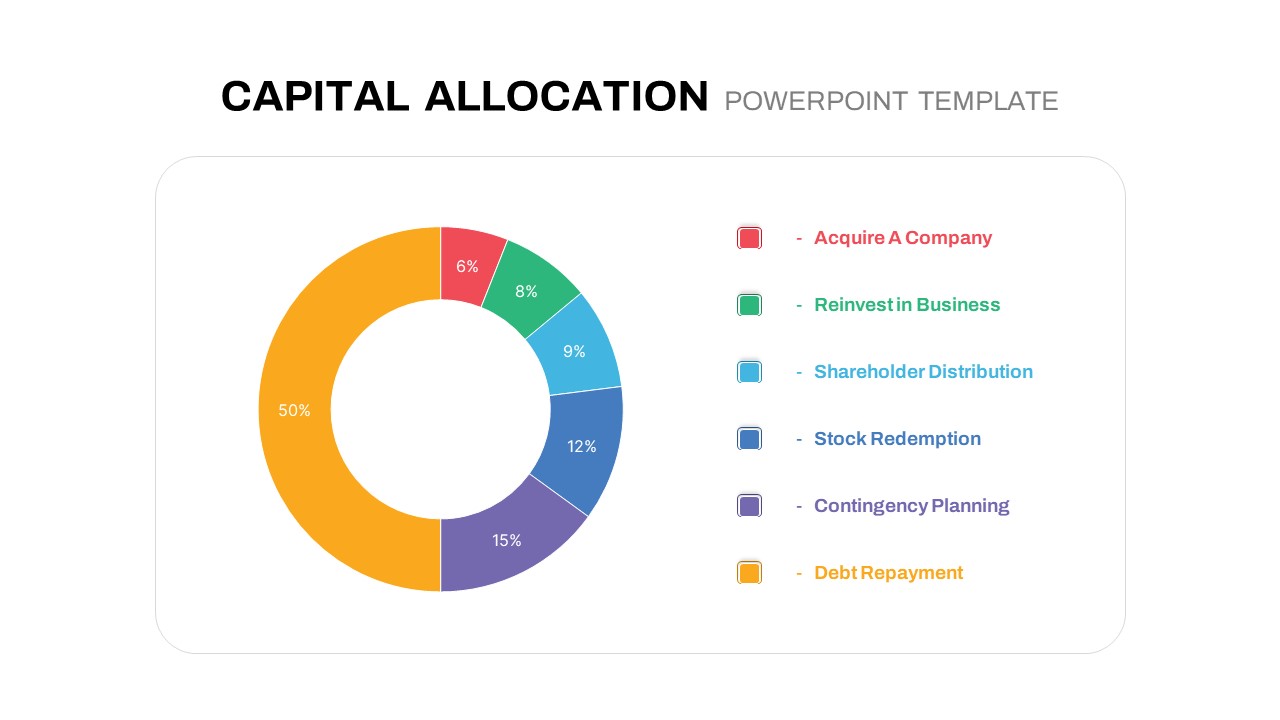
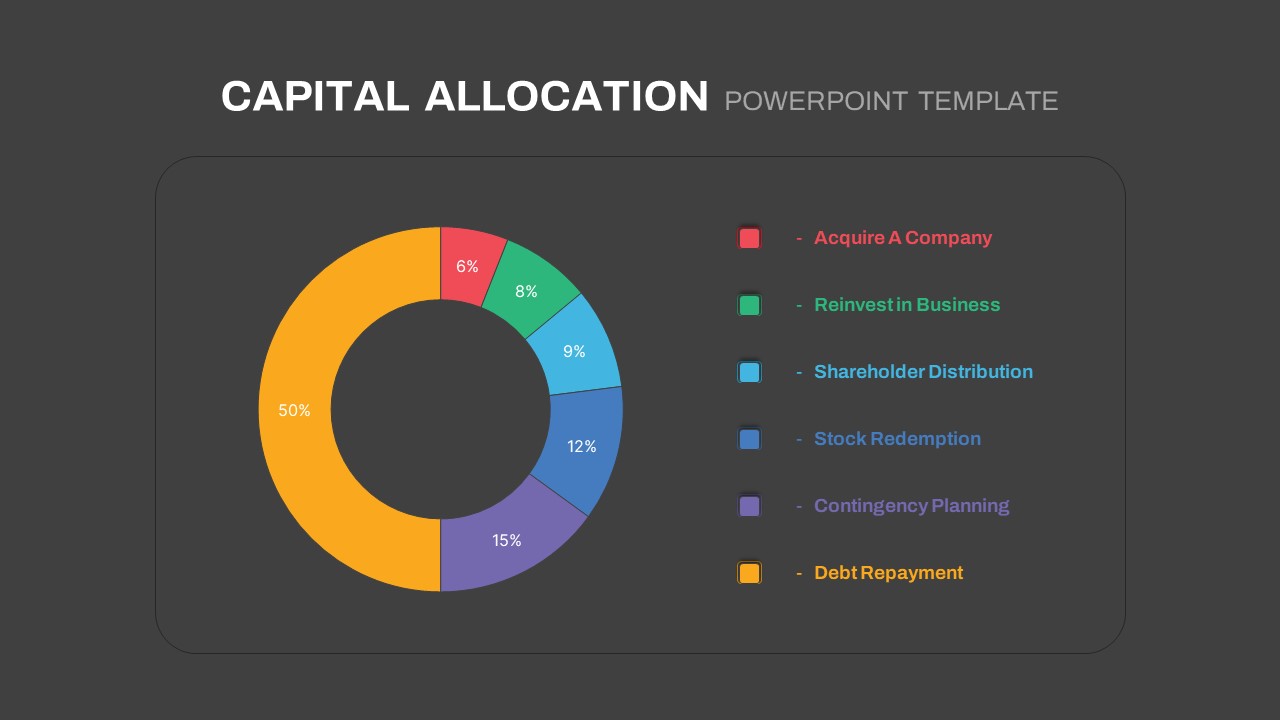
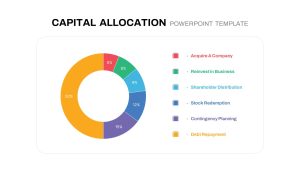
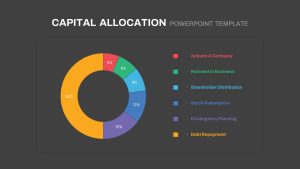
Leverage this Capital Allocation slide deck to present multi-faceted strategies for deploying excess cash across your organization using three distinct infographic layouts. The first slide features a donut chart segmented by six color-coded categories—Acquire a Company (6%), Reinvest in Business (8%), Shareholder Distribution (9%), Stock Redemption (12%), Contingency Planning (15%), and Debt Repayment (50%)—each accompanied by a matching legend for immediate insight into allocation priorities. The slide’s drag-and-drop placeholders and clear data labels make it simple to update percentages, category names, or color schemes without design expertise.
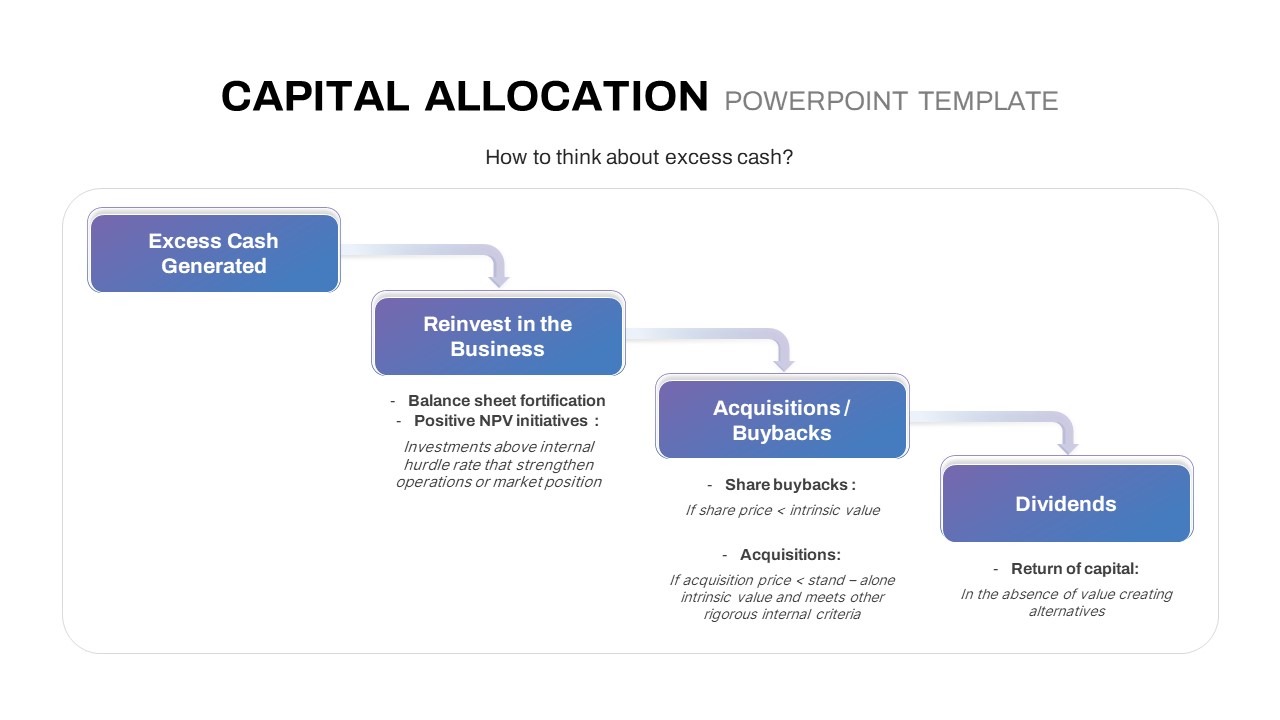
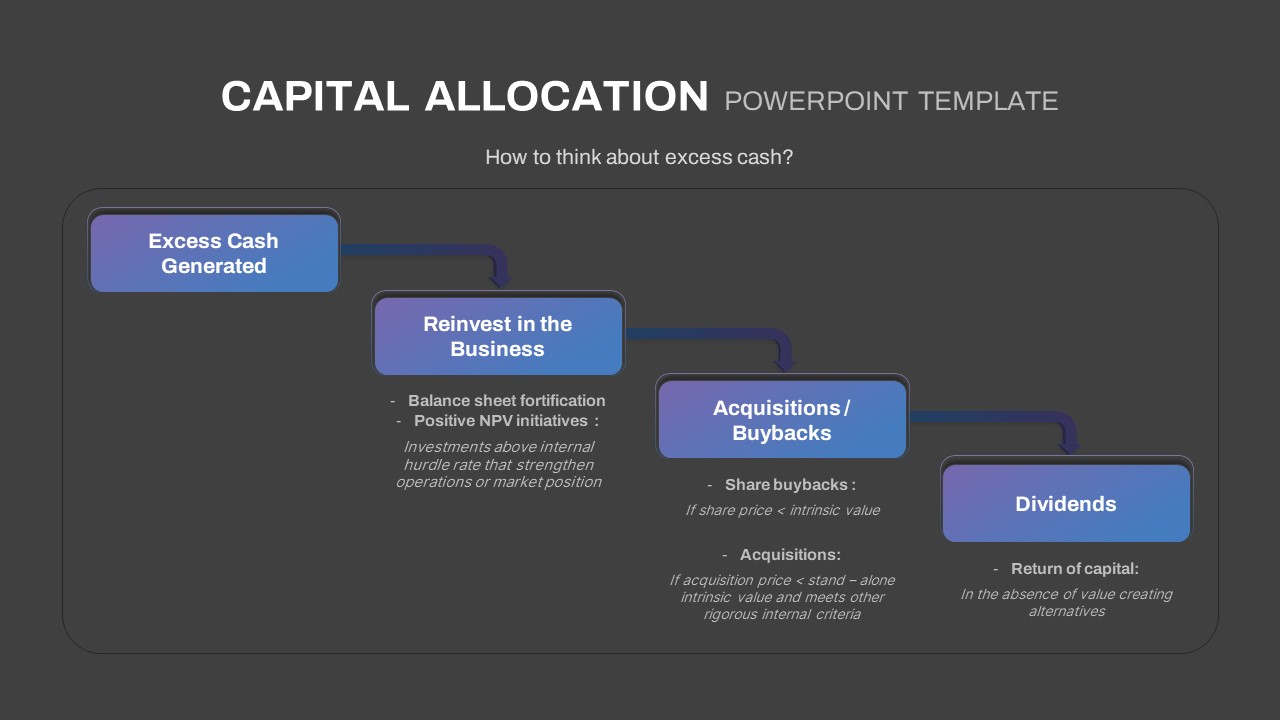
The second slide transitions into a process flow diagram that guides audiences through the excess cash decision-making journey: from “Excess Cash Generated” to “Reinvest in the Business,” onward to “Acquisitions/Buybacks,” and finally “Dividends.” Gradient callouts allow you to annotate NPV thresholds, acquisition criteria, dividend policy details, or risk considerations, ensuring stakeholders understand each decision point.
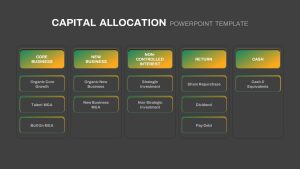
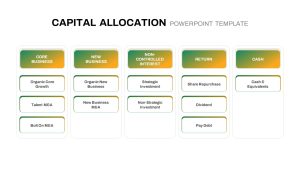
The third slide organizes allocation options into five vertical pillars—Core Business, New Business, Non-Controlled Interest, Return, and Cash—detailing subcomponents like organic growth, talent and bolt-on M&A, strategic investments, share repurchases, debt repayment, and cash equivalents within sleek gradient content boxes. This structured column layout is ideal for breaking down complex financial frameworks into digestible segments.
Designed with a modern flat aesthetic, crisp typography, and a cohesive gradient palette, this deck ensures professional visibility and brand alignment. Built on editable master slides, users can swap icons, adjust layouts, refine color guides, or modify headers in seconds. Optimized for both PowerPoint and Google Slides, the templates maintain resolution clarity, support real-time coauthoring, and eliminate formatting inconsistencies.
Perfect for CFO presentations, strategic finance reviews, board meetings, and investor pitches, this comprehensive deck simplifies complex allocation analyses. Additionally, repurpose individual layouts to visualize budget breakdowns, investment funnels, capital expenditure plans, or performance benchmarks across departments.
Who is it for
CFOs, financial analysts, treasury managers, corporate strategists, and board members will find this slide deck invaluable for aligning stakeholders on capital allocation priorities and return policies.
Other Uses
Use these layouts to illustrate budget allocations, funding roadmaps, CapEx planning, investment decision flows, or departmental performance dashboards by simply relabeling segments, updating metrics, or tweaking callouts.
Login to download this file

Item ID
SB04410
Related Templates

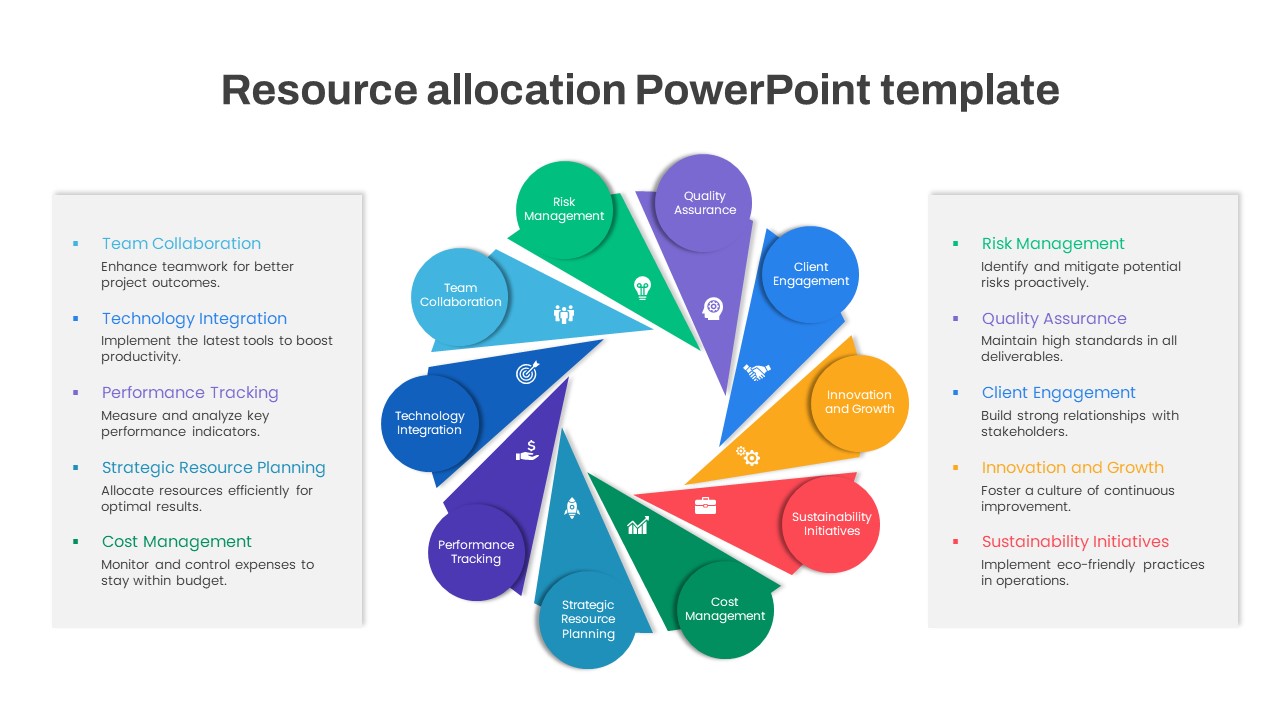
Resource Allocation Wheel Diagram Template for PowerPoint & Google Slides
Circular
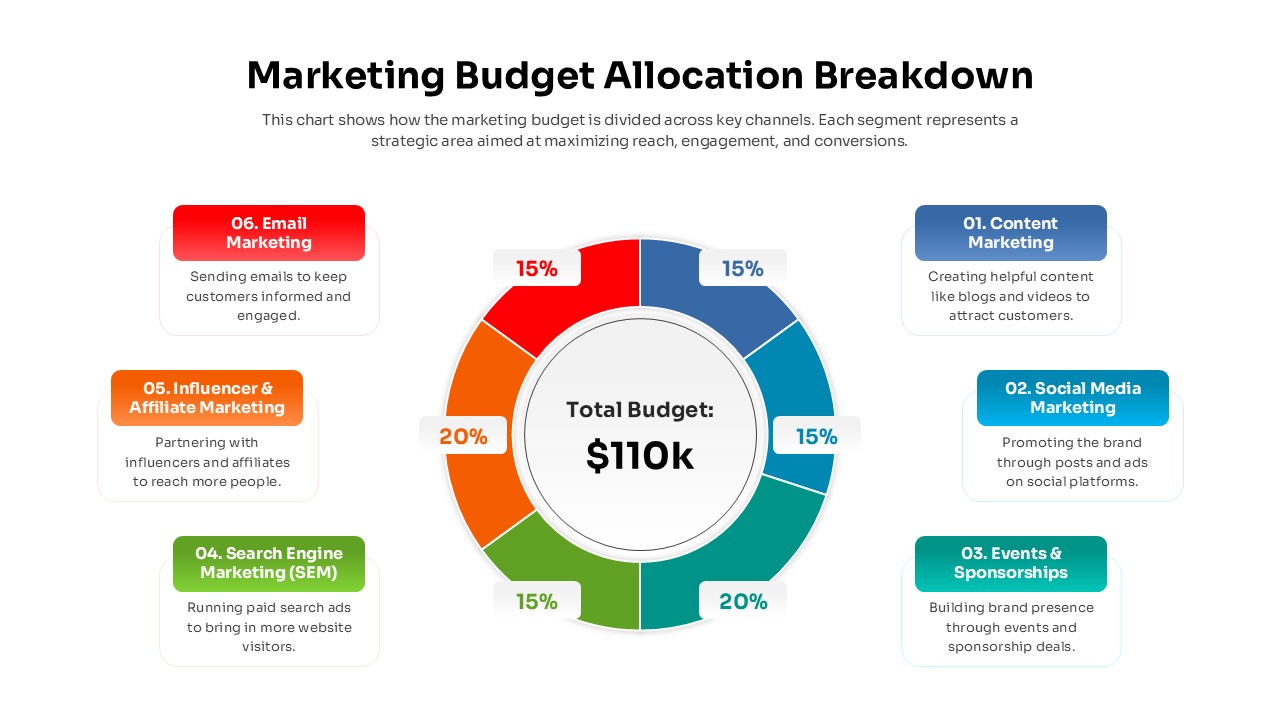
Marketing Budget Allocation Donut Chart Template for PowerPoint & Google Slides
Marketing
Marketing Budget Allocation Breakdown Template for PowerPoint & Google Slides
Finance
Capital Investments Process Flow Diagram Template for PowerPoint & Google Slides
Process
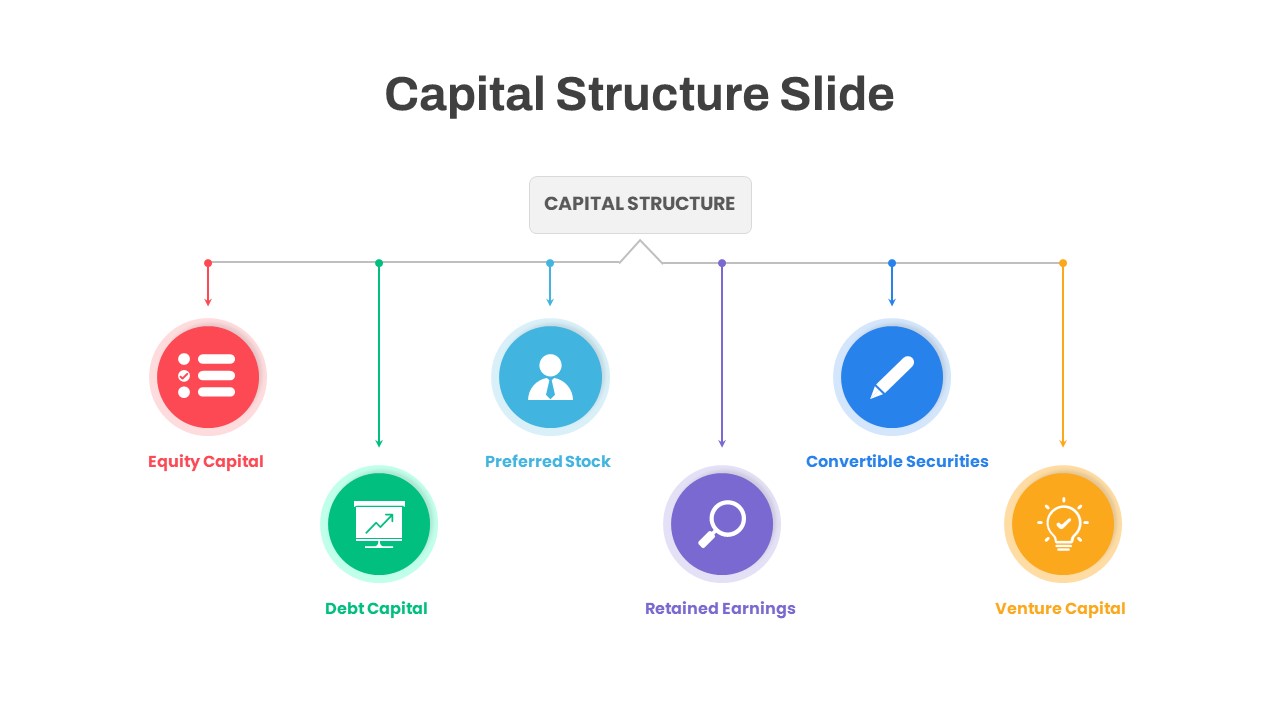
Capital Structure Hub & Spoke Diagram Template for PowerPoint & Google Slides
Process
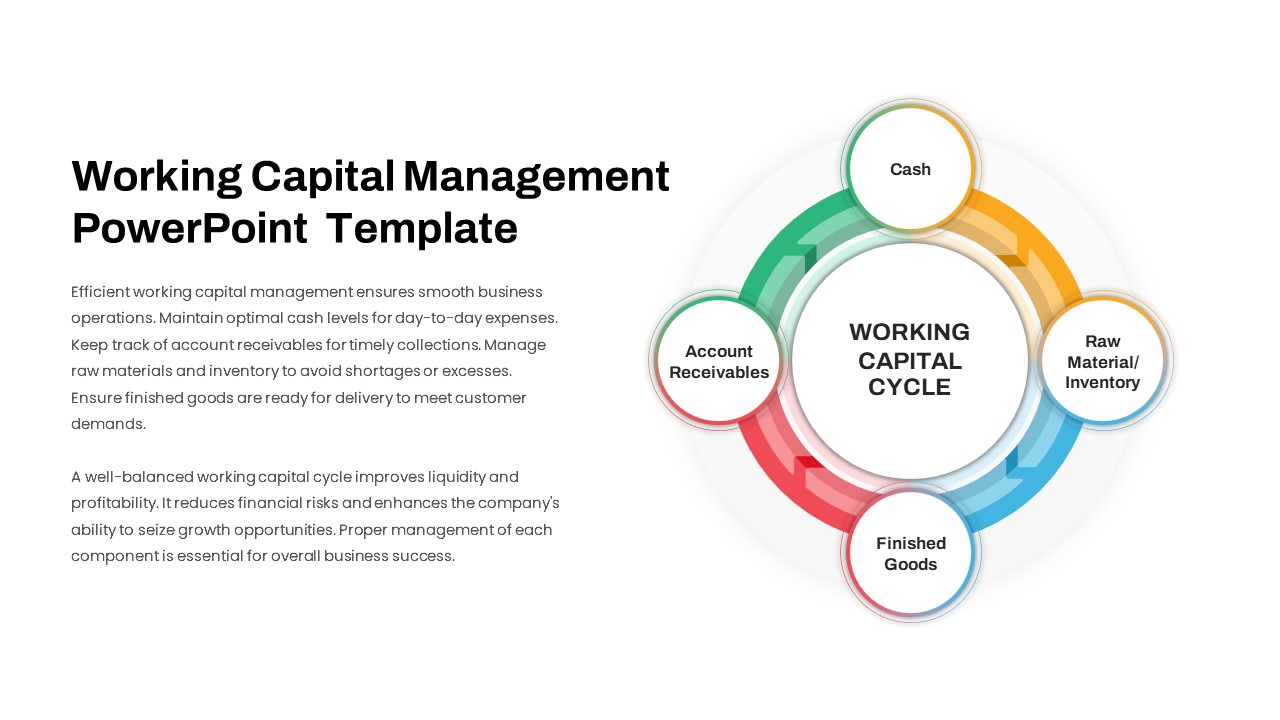
Working Capital Cycle Diagram Template for PowerPoint & Google Slides
Circular
Capital Structure Dynamic Split Chart Template for PowerPoint & Google Slides
Comparison Chart
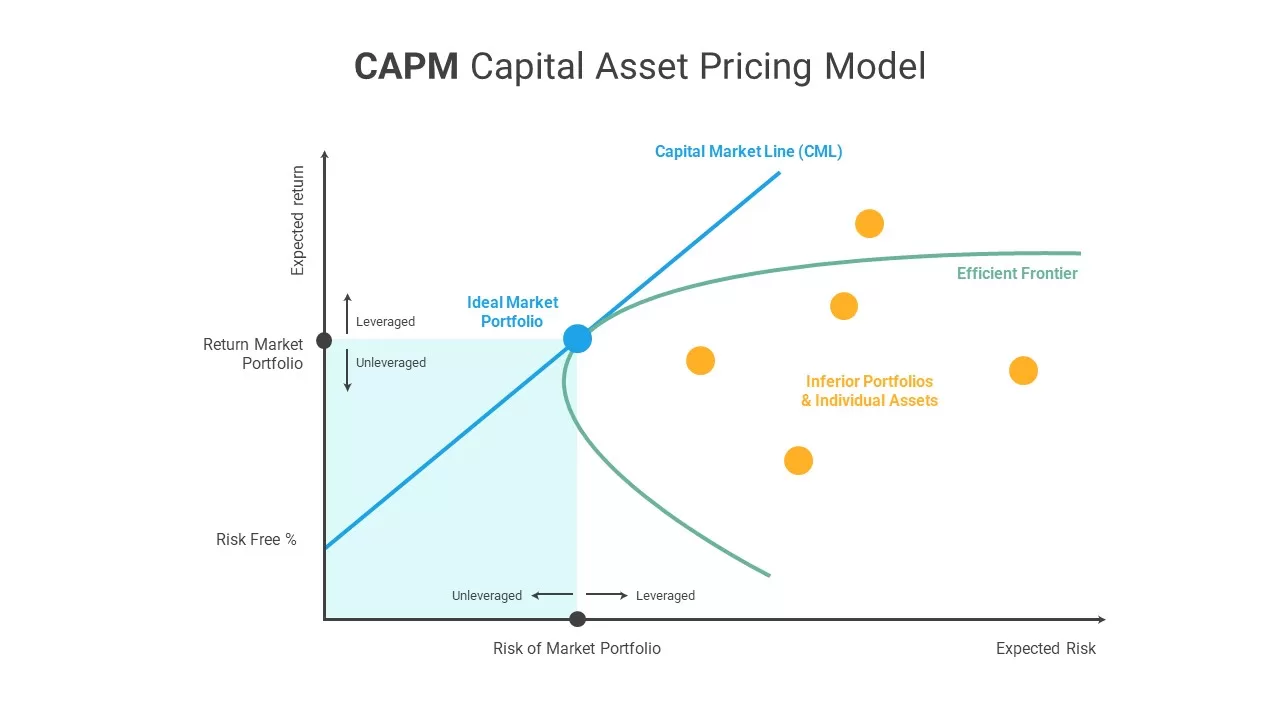
CAPM Capital Asset Pricing Model template for PowerPoint & Google Slides
Finance
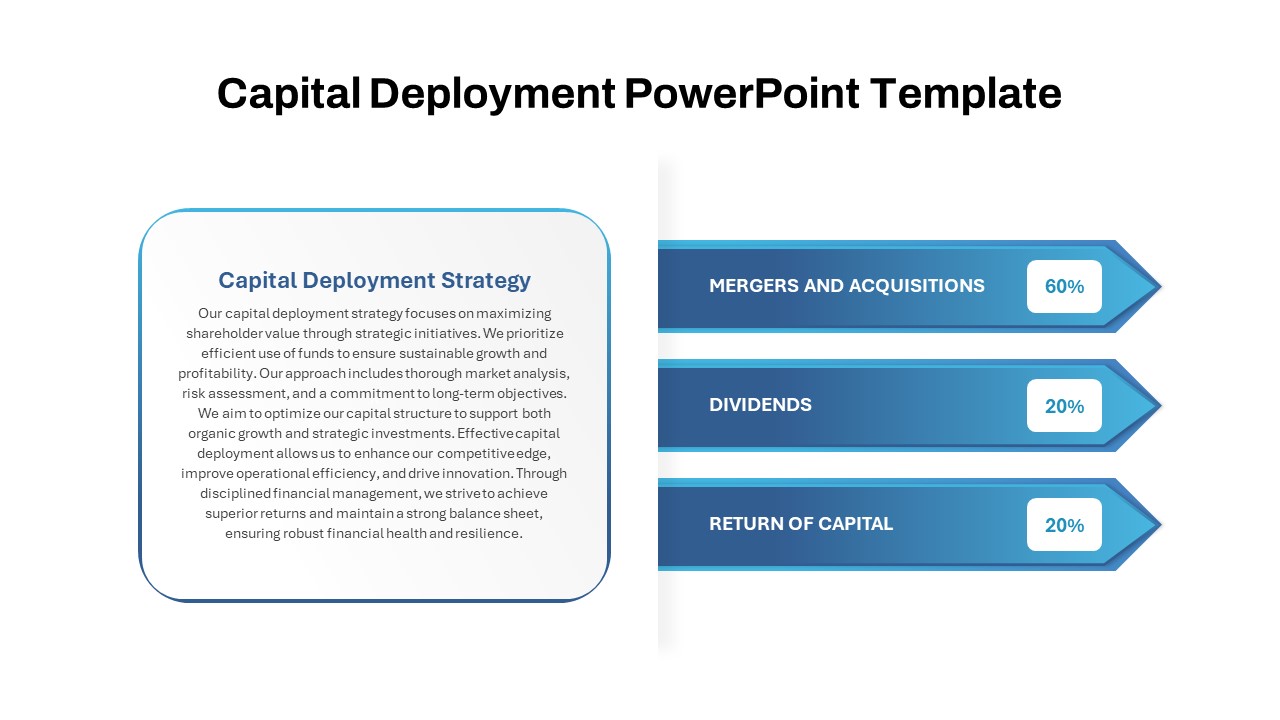
Capital Deployment Percentage Breakdown Template for PowerPoint & Google Slides
Pitch Deck
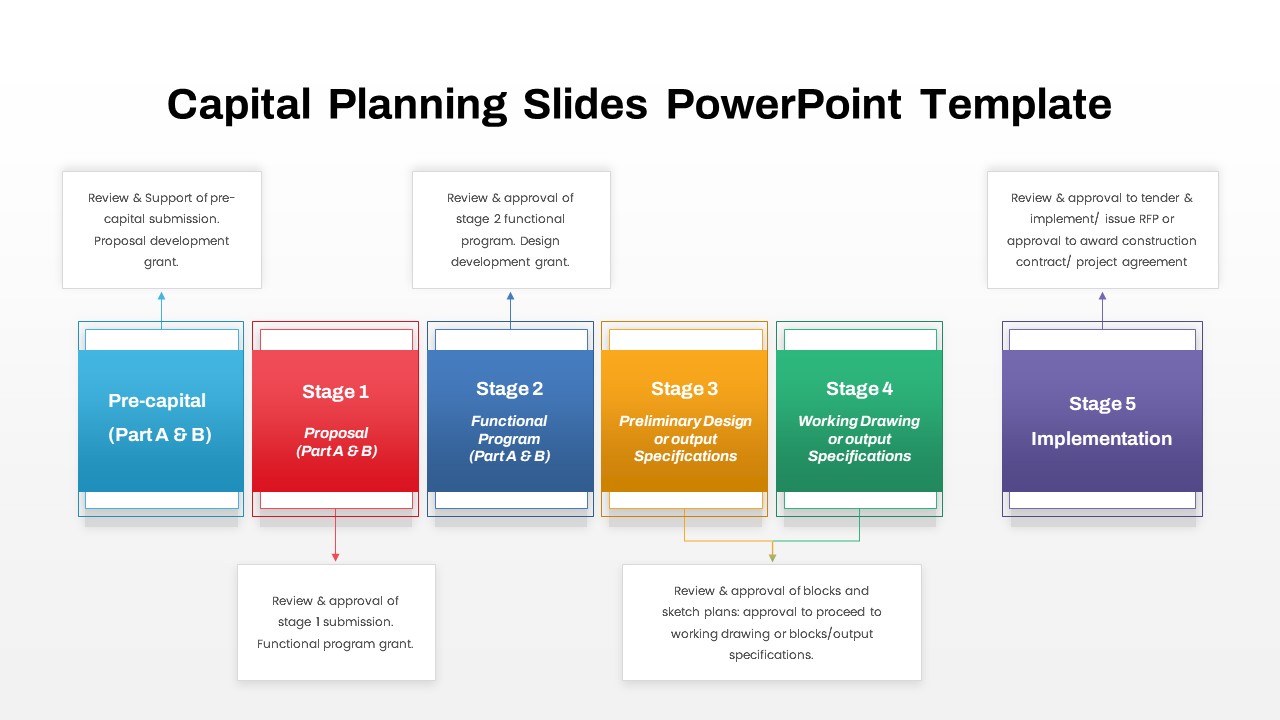
Capital Planning Five-Stage Process template for PowerPoint & Google Slides
Process
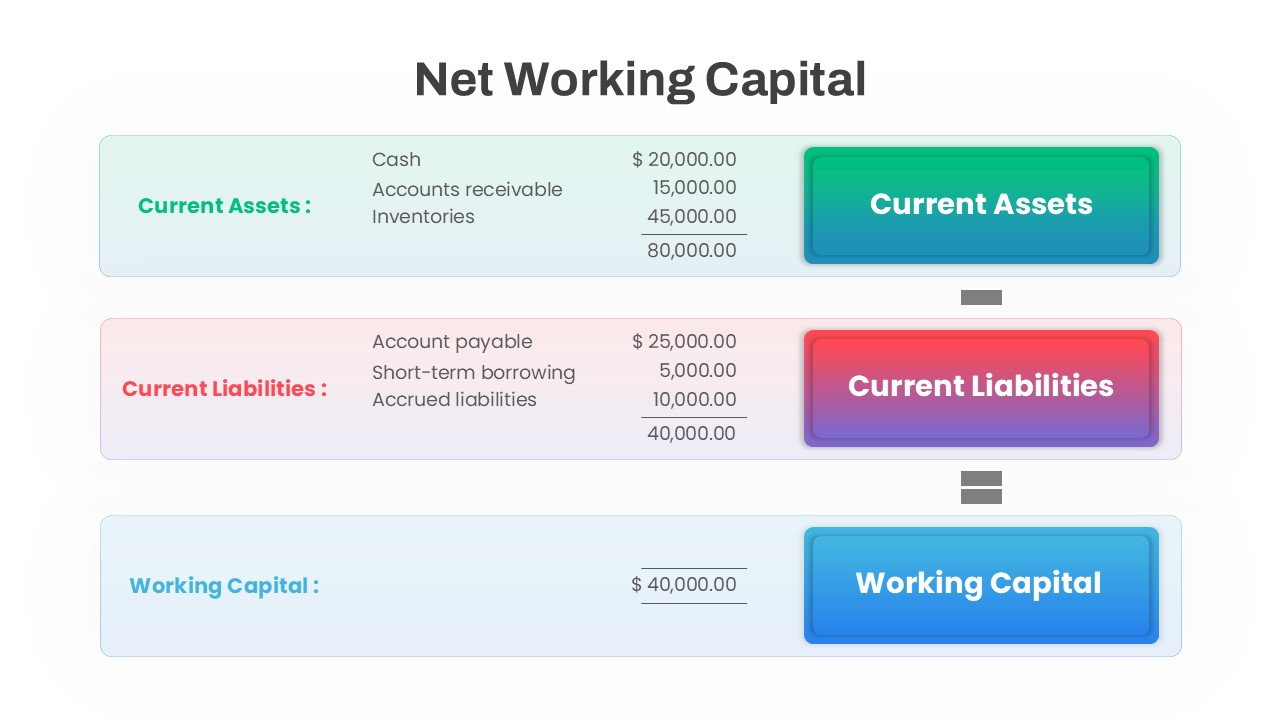
Net Working Capital Calculation Template for PowerPoint & Google Slides
Finance
Capital Budgeting Template for PowerPoint & Google Slides
Finance

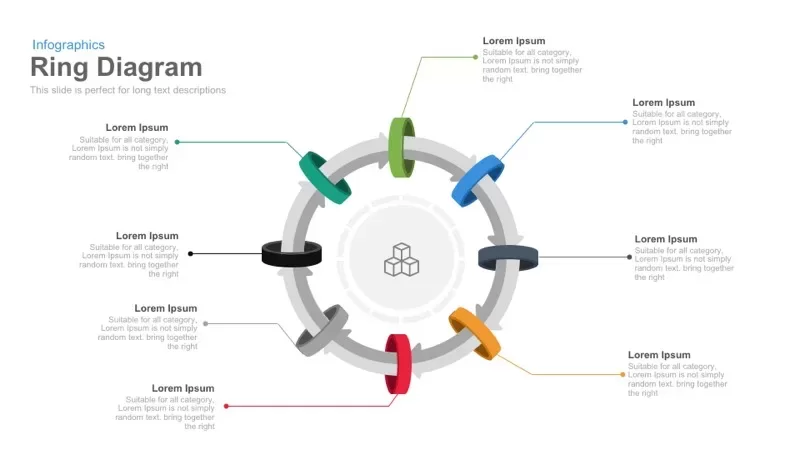
8 Circular Ring Diagram template for PowerPoint & Google Slides
Infographics
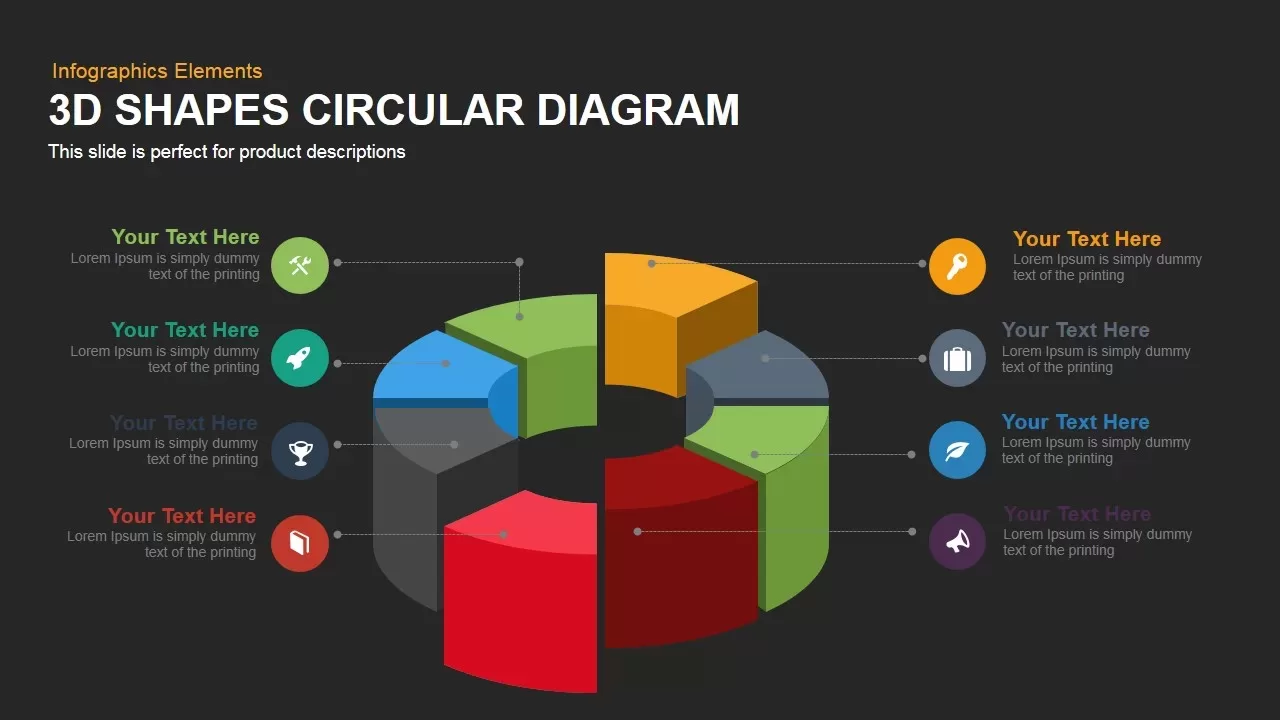
3D Circular Diagram template for PowerPoint & Google Slides
Circular
Circular Flow Diagram Template for PowerPoint & Google Slides
Infographics
Six Step Creative Circular Diagram Template for PowerPoint & Google Slides
Circular
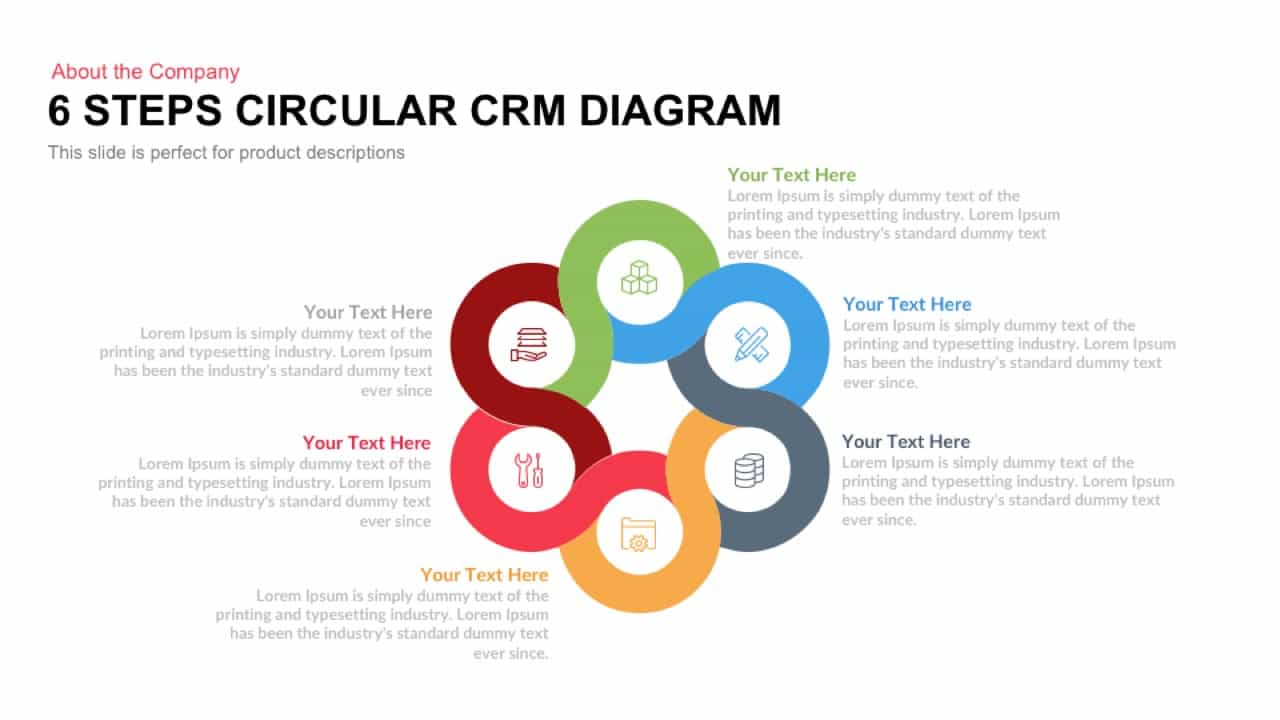
Six Steps Circular CRM Diagram Template for PowerPoint & Google Slides
Customer Journey
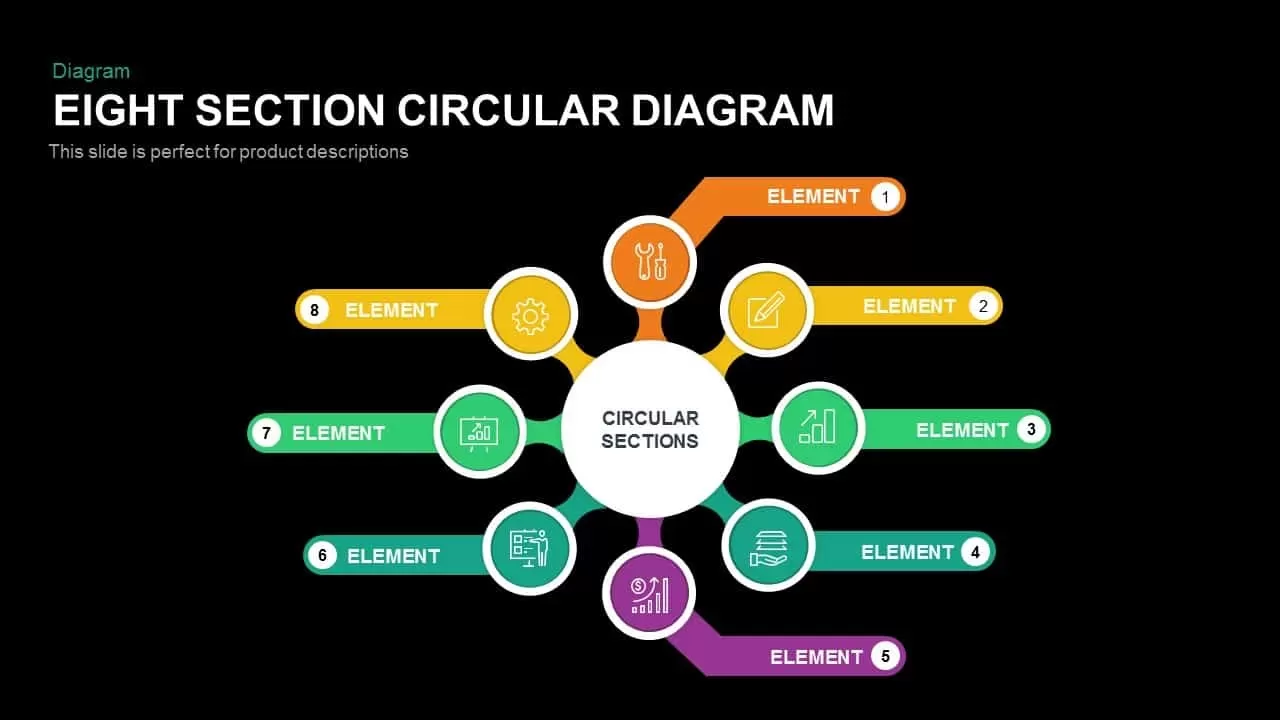
Eight Section Circular Diagram Template for PowerPoint & Google Slides
Circular
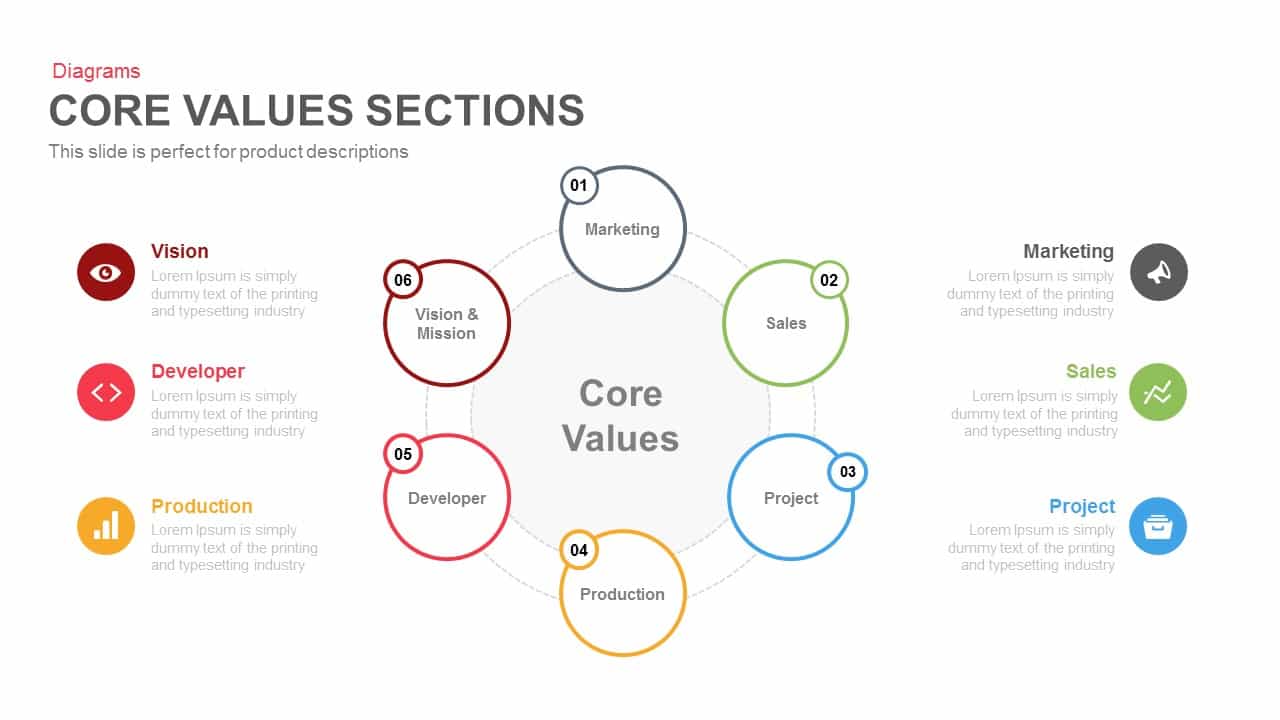
Six-Part Core Values Circular Diagram Template for PowerPoint & Google Slides
Circular

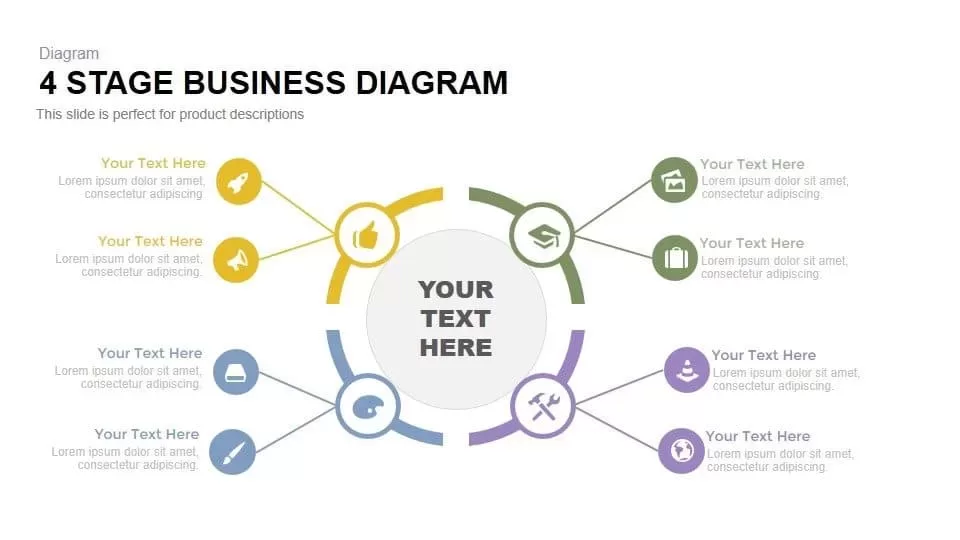
Four-Stage Business Circular Diagram Template for PowerPoint & Google Slides
Process
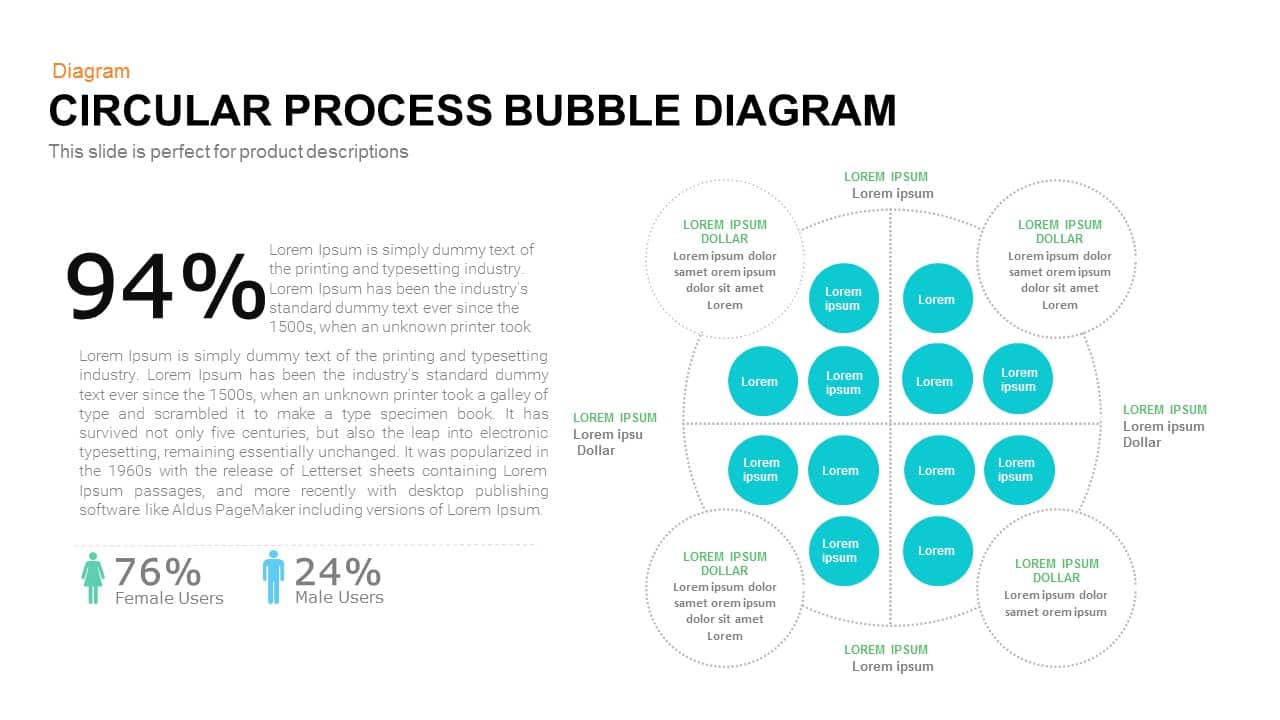
Bubble Circular Process Diagram Template for PowerPoint & Google Slides
Process
Five-Section Circular Arrow Diagram Template for PowerPoint & Google Slides
Circular
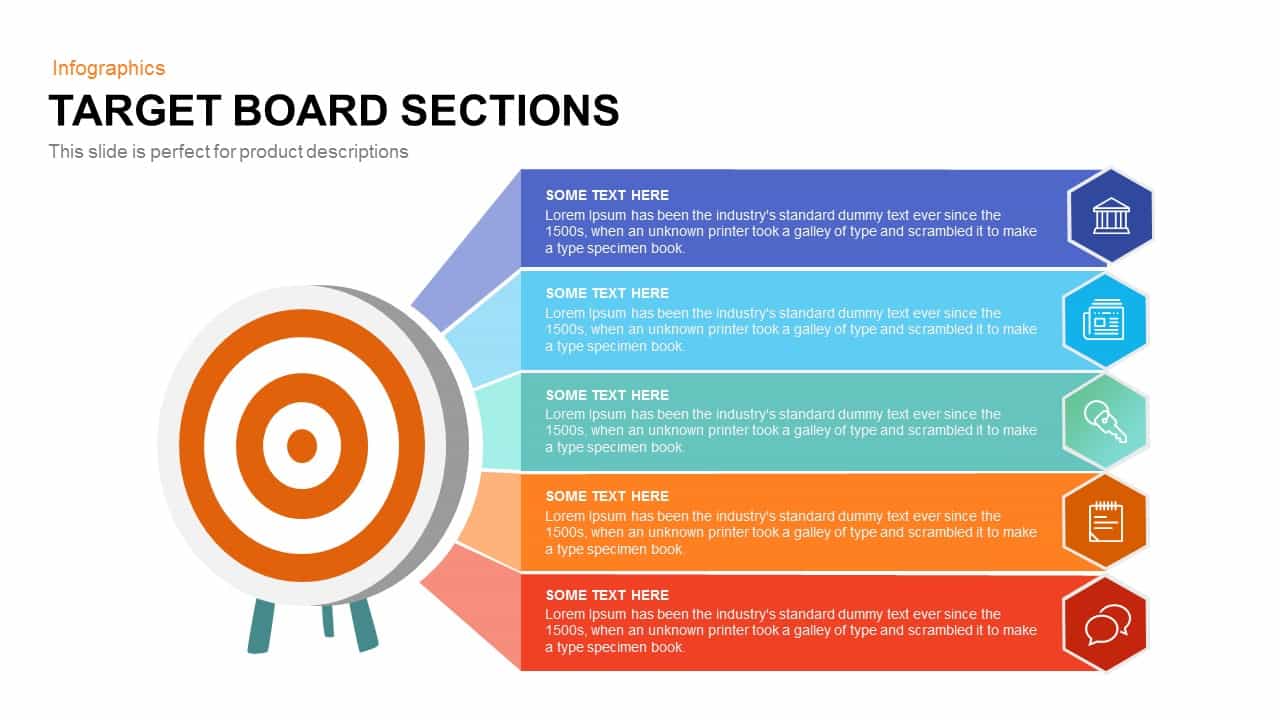
Target Board Sections Circular Diagram Template for PowerPoint & Google Slides
Circular
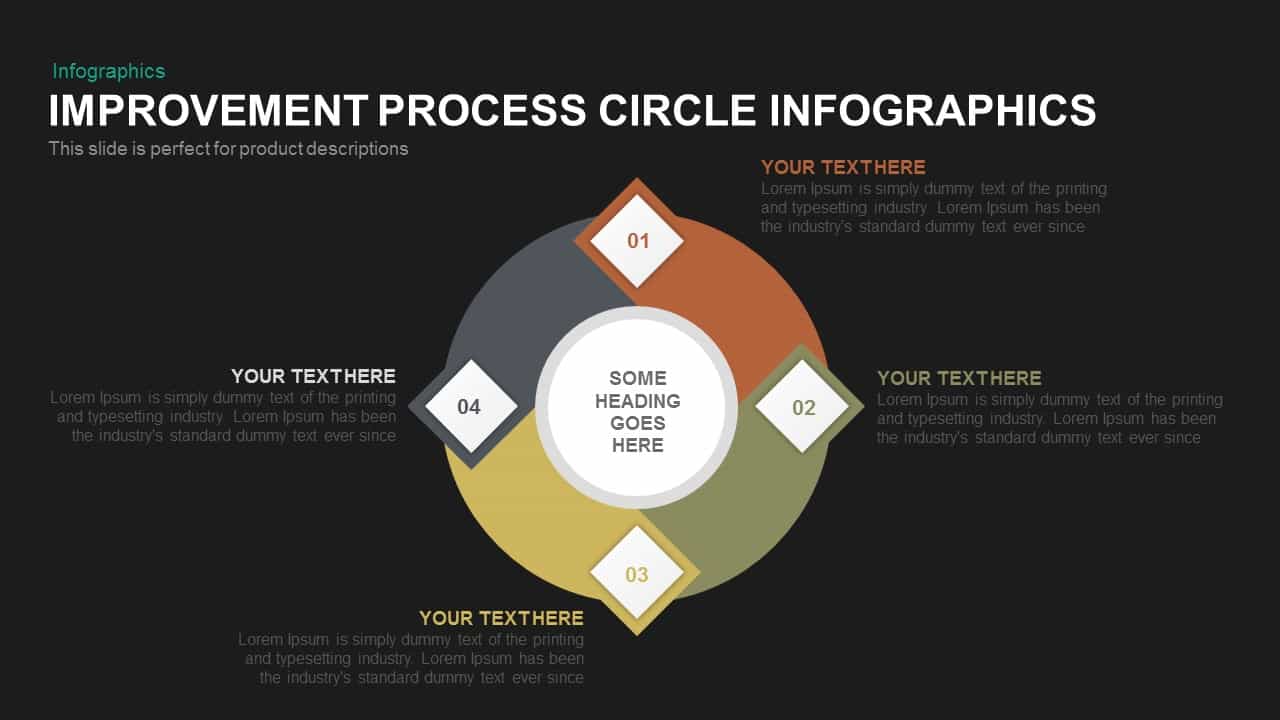
Circular Improvement Process Diagram Template for PowerPoint & Google Slides
Process
Six-Stage Circular Cycle Diagram Template for PowerPoint & Google Slides
Process
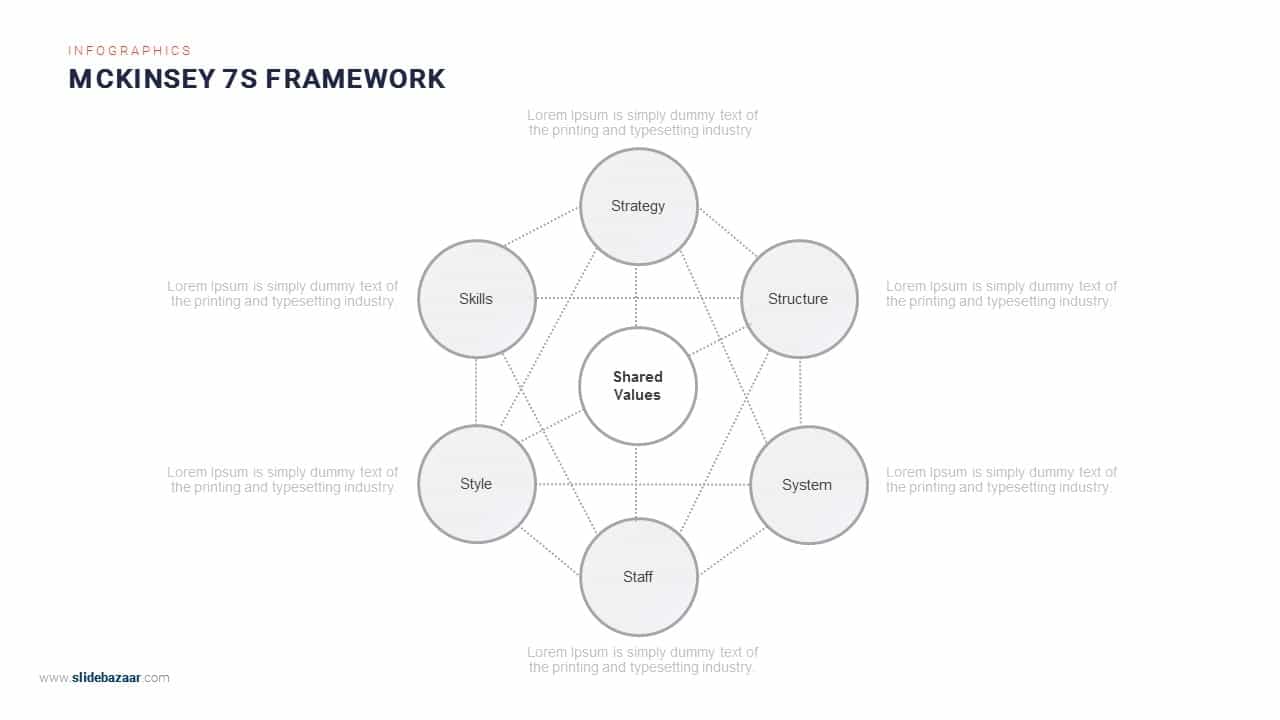
McKinsey 7S Framework Circular Diagram Template for PowerPoint & Google Slides
Circular
Seven-Segment Circular Arrow Diagram Template for PowerPoint & Google Slides
Arrow

Six-Process Circular Arrow Diagram Template for PowerPoint & Google Slides
Circular
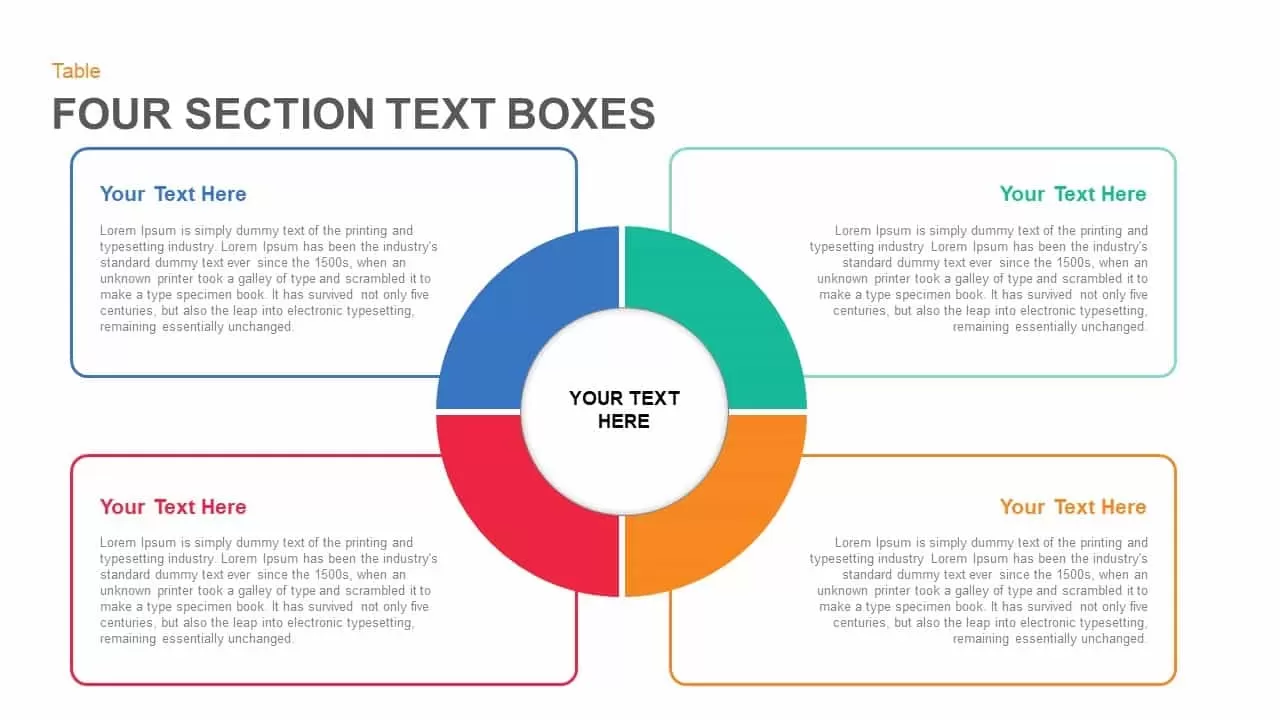
Four Section Circular Text Boxes Diagram Template for PowerPoint & Google Slides
Circular

Six-Stage Circular Process Diagram Template for PowerPoint & Google Slides
Process
Ten-Piece Circular Puzzle Diagram Template for PowerPoint & Google Slides
Circular
Eight-Step Circular Diagram Infographic Template for PowerPoint & Google Slides
Circular
PEST Analysis Circular Diagram Template for PowerPoint & Google Slides
PEST
Six Stage Circular Diagram with Icons Template for PowerPoint & Google Slides
Circular
Six Segment Hexagon Circular Diagram Template for PowerPoint & Google Slides
Circular
9-Step Circular Arrows Process Diagram Template for PowerPoint & Google Slides
Process
4 Staged Circular Business Process Diagram template for PowerPoint & Google Slides
Process
3, 4 & 5 Circular Stages Cycle Diagram Deck Template for PowerPoint & Google Slides
Circular
Three to Six Staged Circular Diagram Template for PowerPoint & Google Slides
Process
Five-Stage Circular Infographic Diagram Template for PowerPoint & Google Slides
Process
Six-Stage Circular Diagram Process Template for PowerPoint & Google Slides
Circular
Five-Stage Circular Process Diagram Template for PowerPoint & Google Slides
Circular
Five Layer Circular Ring Diagram Template for PowerPoint & Google Slides
Circular
Four-Stage Circular Diagram Infographic Template for PowerPoint & Google Slides
Circular
Five Stage Circular Arrow Diagram Template for PowerPoint & Google Slides
Process
Five-Step Circular Process Diagram Template for PowerPoint & Google Slides
Circular
Five-Stage Circular Flow Diagram Template for PowerPoint & Google Slides
Circular
4 Ps of Management Circular Diagram Template for PowerPoint & Google Slides
Circular
4 Factors Circular Diagram Infographic Template for PowerPoint & Google Slides
Circular
Four-Stage Circular Flow Diagram Template for PowerPoint & Google Slides
Circular
Circular CRM Process Diagram Infographic Template for PowerPoint & Google Slides
Circular
HR Evaluation Strategy Circular Diagram Template for PowerPoint & Google Slides
Circular
Value Chain Circular Process Diagram Template for PowerPoint & Google Slides
Business Models
8-Step Circular Accounting Cycle Diagram Template for PowerPoint & Google Slides
Accounting
Six-Stage Circular Flow Diagram Template for PowerPoint & Google Slides
Circular
Colorful Circular Puzzle Diagram Template for PowerPoint & Google Slides
Circular
Eight Step Circular Diagram Template for PowerPoint & Google Slides
Circular
6-Step Circular Diagram Infographic Template for PowerPoint & Google Slides
Circular
8-Step Circular Gear Infographic Diagram Template for PowerPoint & Google Slides
Circular

Agile Lifecycle Circular Diagram Template for PowerPoint & Google Slides
Circular
2-8 Step Circular Diagram Template for PowerPoint & Google Slides
Infographics
4-Step Circular Infographic Diagram Template for PowerPoint & Google Slides
Circular
5-Step Circular Puzzle Diagram Template for PowerPoint & Google Slides
Circular
4MAT Learning Cycle Circular Diagram Template for PowerPoint & Google Slides
Circular
4-Step Circular PDCA Cycle Diagram Template for PowerPoint & Google Slides
Process
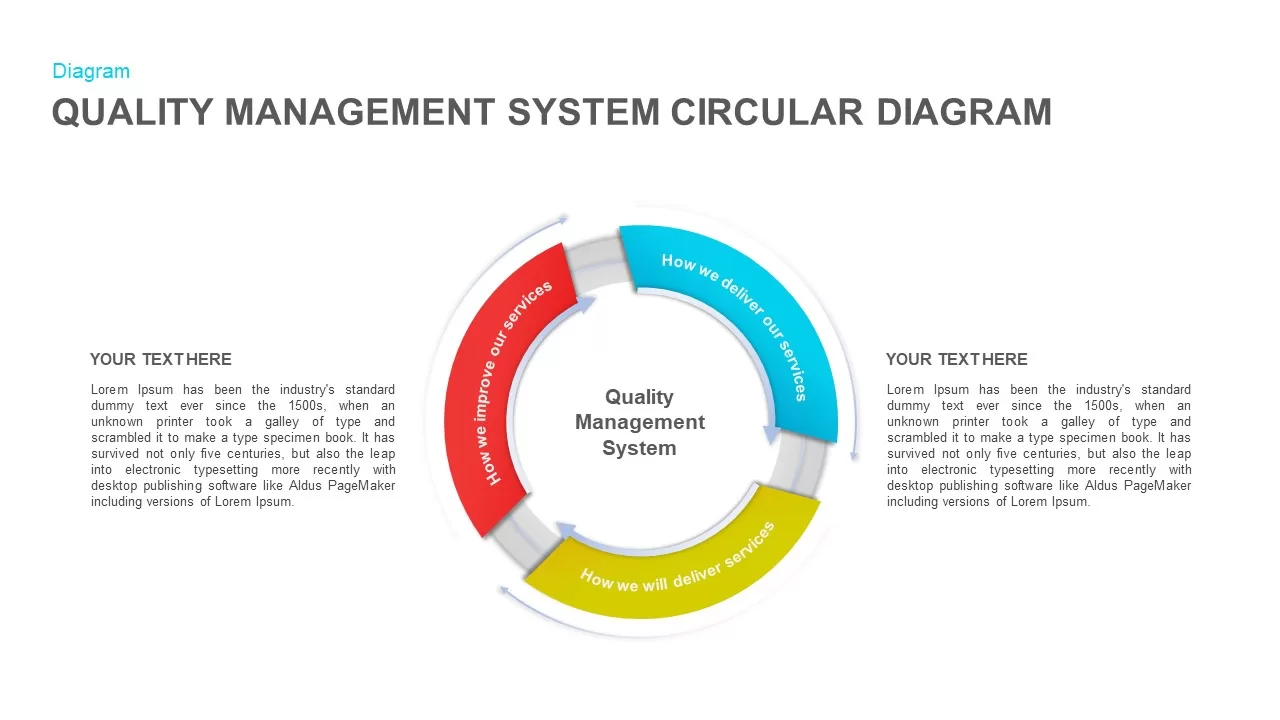
Quality Management System Circular Diagram template for PowerPoint & Google Slides
Process
Six-Step Circular Diagram Infographics Template for PowerPoint & Google Slides
Circular
Circular 3D Cube Six-Segment Diagram Template for PowerPoint & Google Slides
Infographics
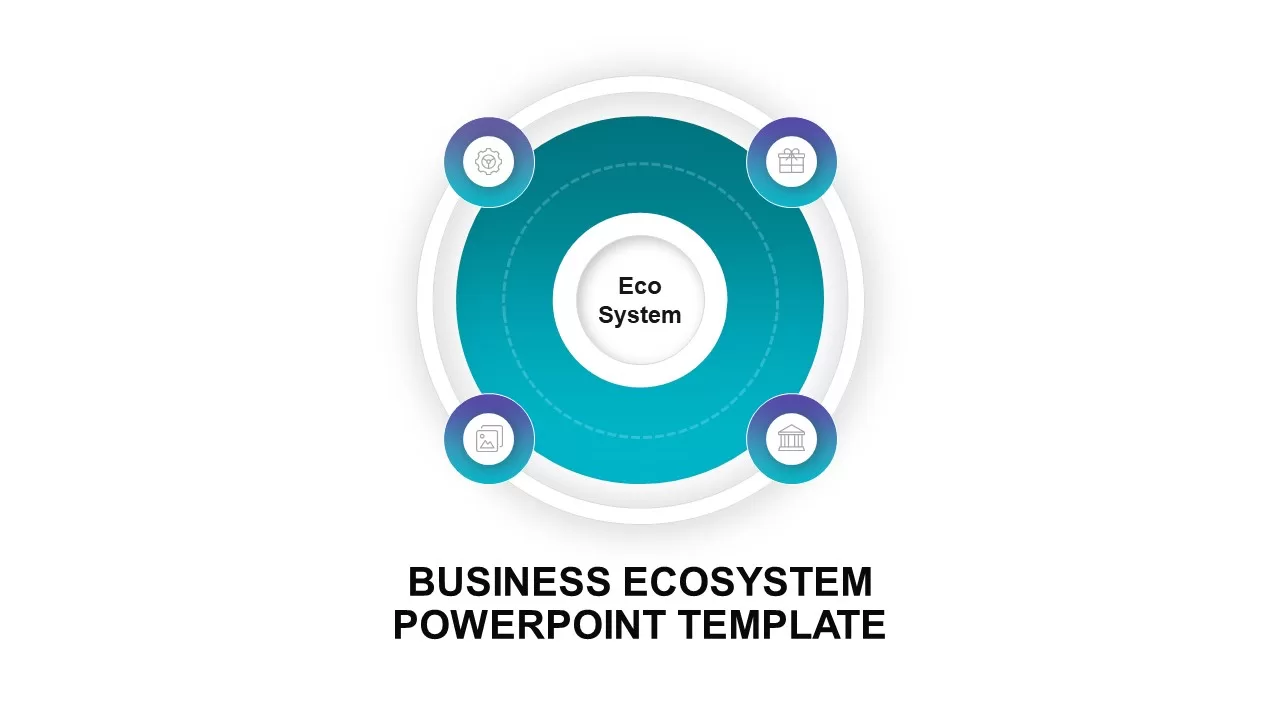
Circular Business Ecosystem Diagram Template for PowerPoint & Google Slides
Business Strategy
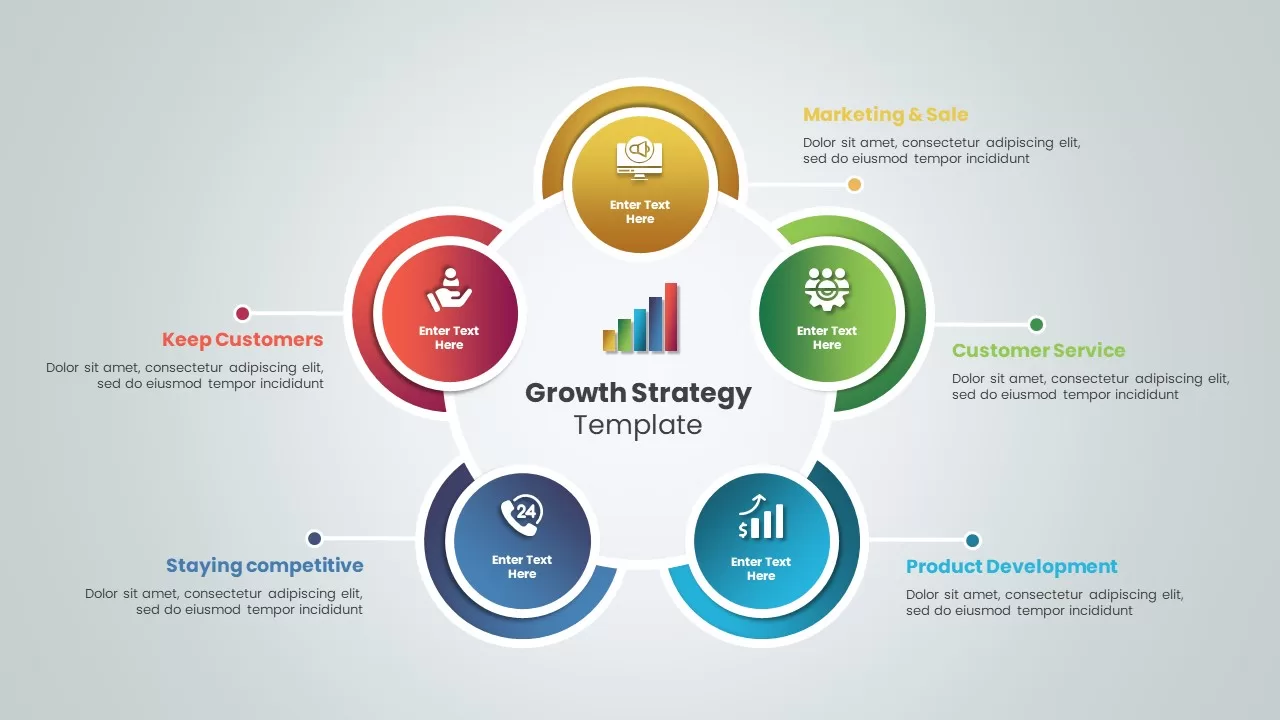
Growth Strategy Circular Diagram Template for PowerPoint & Google Slides
Circular
Free Circular Multi-Step Flow Chart Diagram Template for PowerPoint & Google Slides
Flow Charts
Free
Concentric Circular Arrow Cycle Diagram Template for PowerPoint & Google Slides
Process
Three-Step Circular Arrows Diagram Template for PowerPoint & Google Slides
Process
10-Step Colorful Circular Diagram Template for PowerPoint & Google Slides
Circular
10 Step Circular Process Diagram Template for PowerPoint & Google Slides
Circular
Negotiation Process Circular Diagram Template for PowerPoint & Google Slides
Circular
Multi-Variation Circular Chart Diagram Template for PowerPoint & Google Slides
Circular
Circular Key Growth Drivers Diagram Template for PowerPoint & Google Slides
Circular
AI Methods Circular Diagram Slide Template for PowerPoint & Google Slides
AI
HROps Hub and Spoke Circular Diagram Template for PowerPoint & Google Slides
Circular
Sustainable Growth Circular Diagram Template for PowerPoint & Google Slides
Circular
Entry Strategy Circular Diagram Template for PowerPoint & Google Slides
Circular
5Cs of Network Effect Circular Diagram Template for PowerPoint & Google Slides
Circular
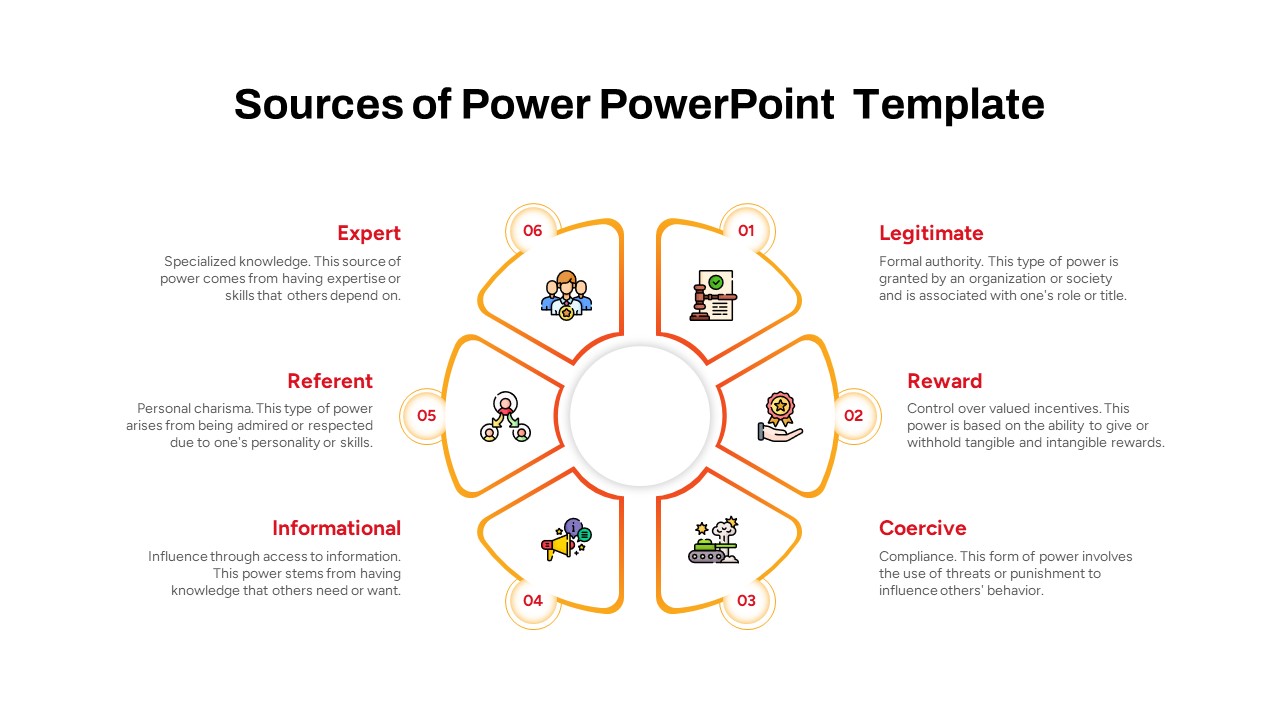
Sources of Power Circular Diagram Template for PowerPoint & Google Slides
Circular
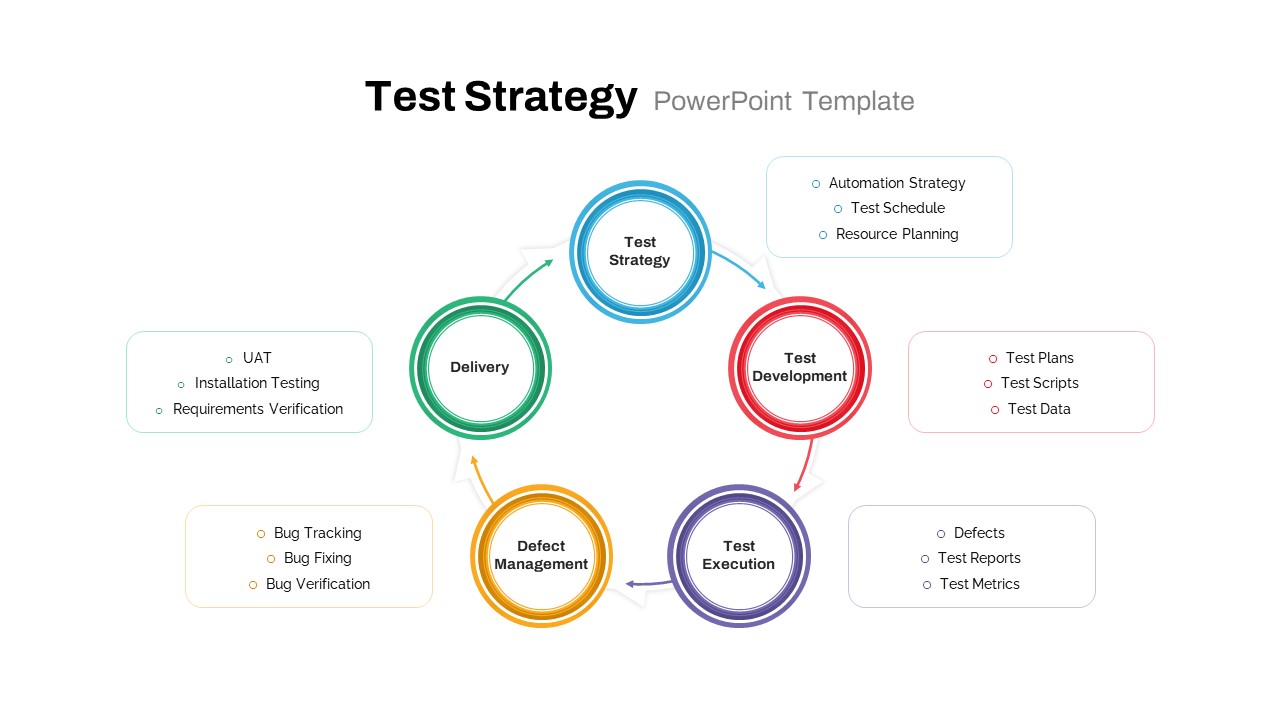
Test Strategy Circular Diagram Template for PowerPoint & Google Slides
Circular
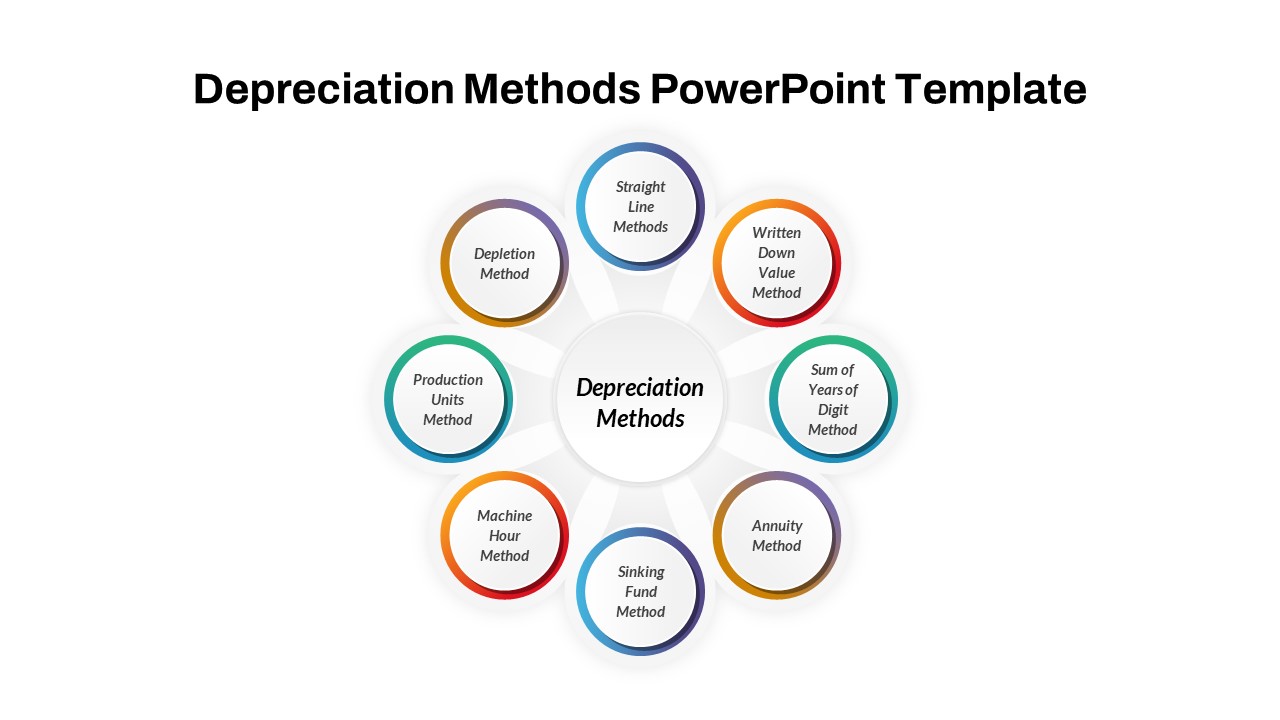
Depreciation Methods Circular Diagram Template for PowerPoint & Google Slides
Circular
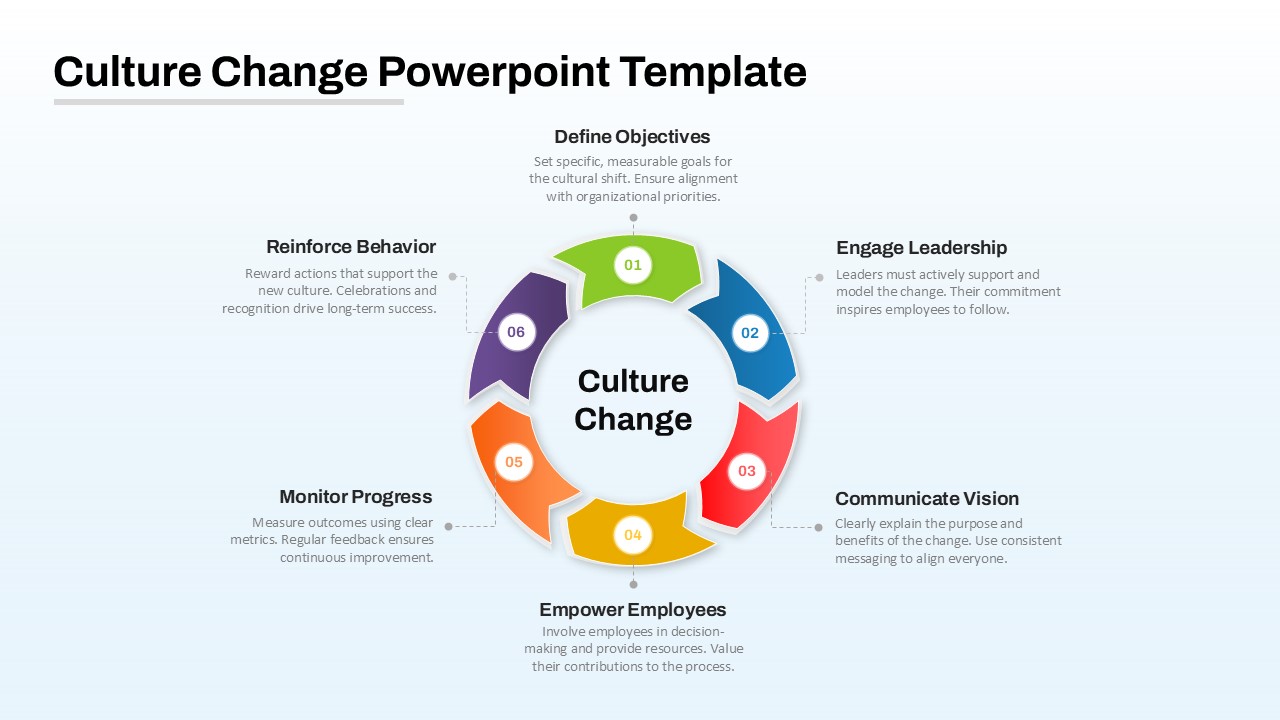
Culture Change Circular Process Diagram Template for PowerPoint & Google Slides
Process
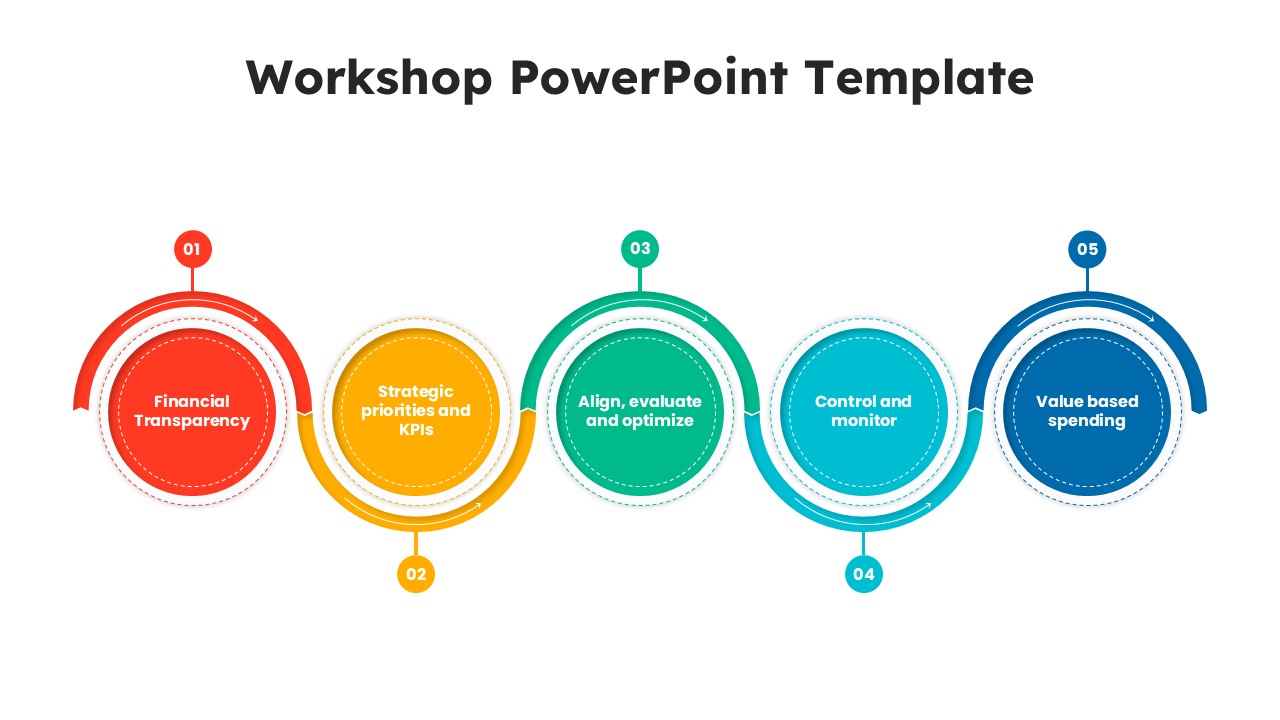
Workshop 5-Step Circular Process Diagram Template for PowerPoint & Google Slides
Circular
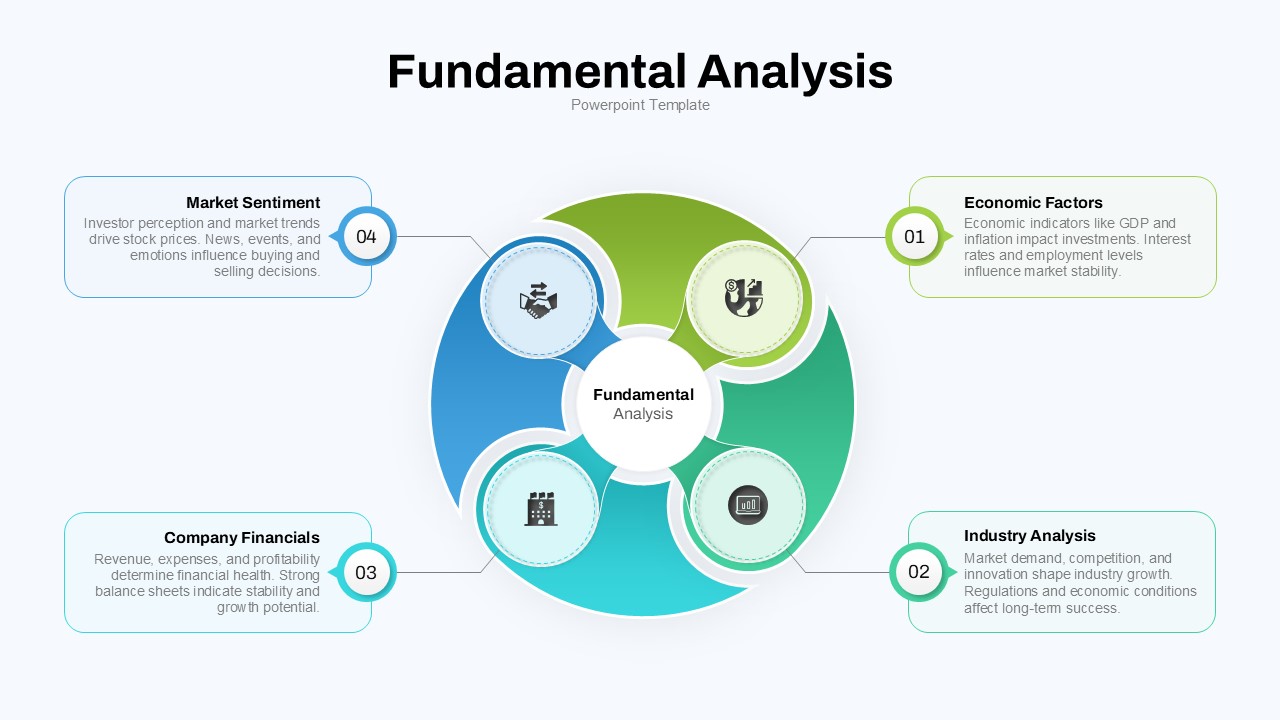
Fundamental Analysis Circular Diagram Template for PowerPoint & Google Slides
Circular
Cultural Web Analysis Circular Diagram Template for PowerPoint & Google Slides
Circular
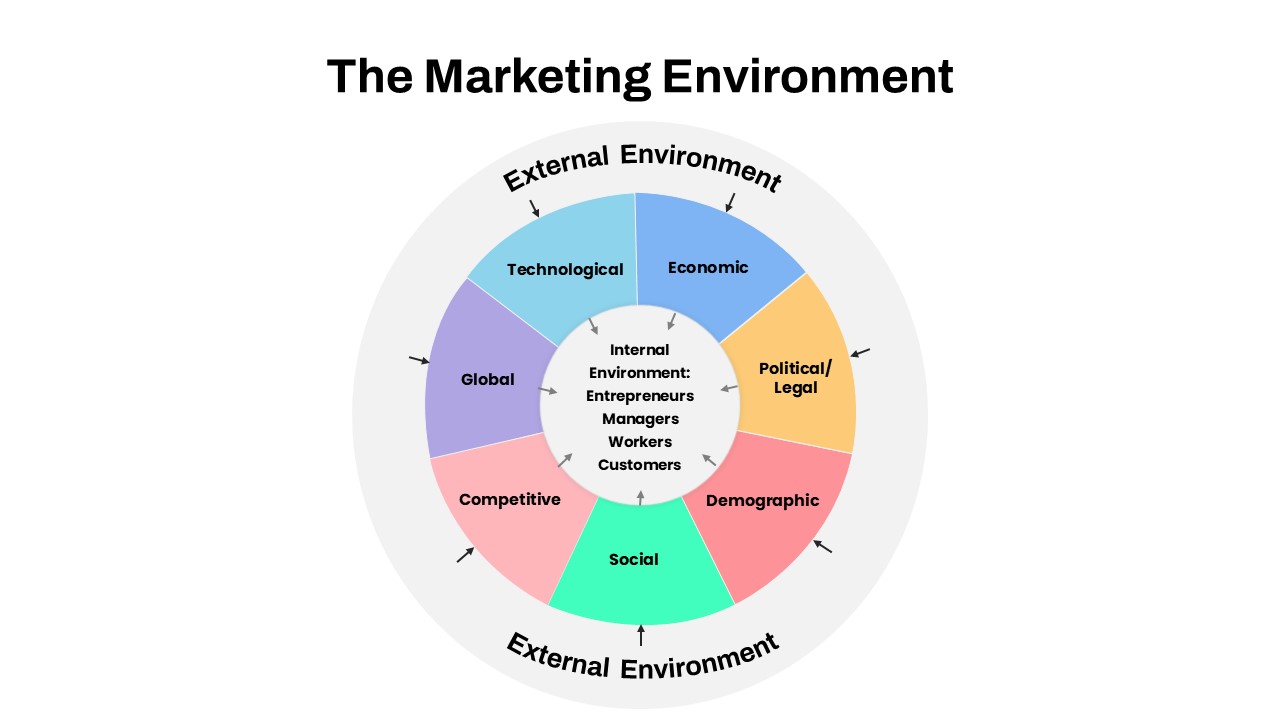
Marketing Environment Circular Diagram template for PowerPoint & Google Slides
Marketing
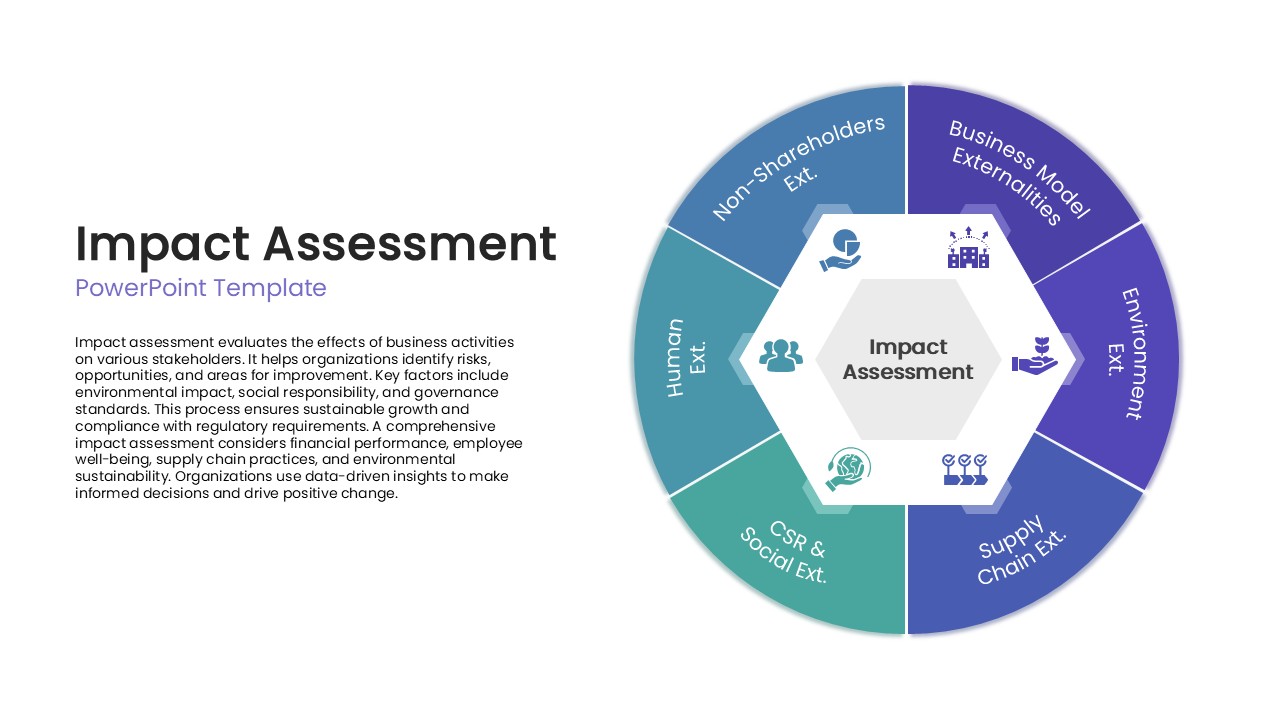
Impact Assessment Circular Diagram Template for PowerPoint & Google Slides
Circular
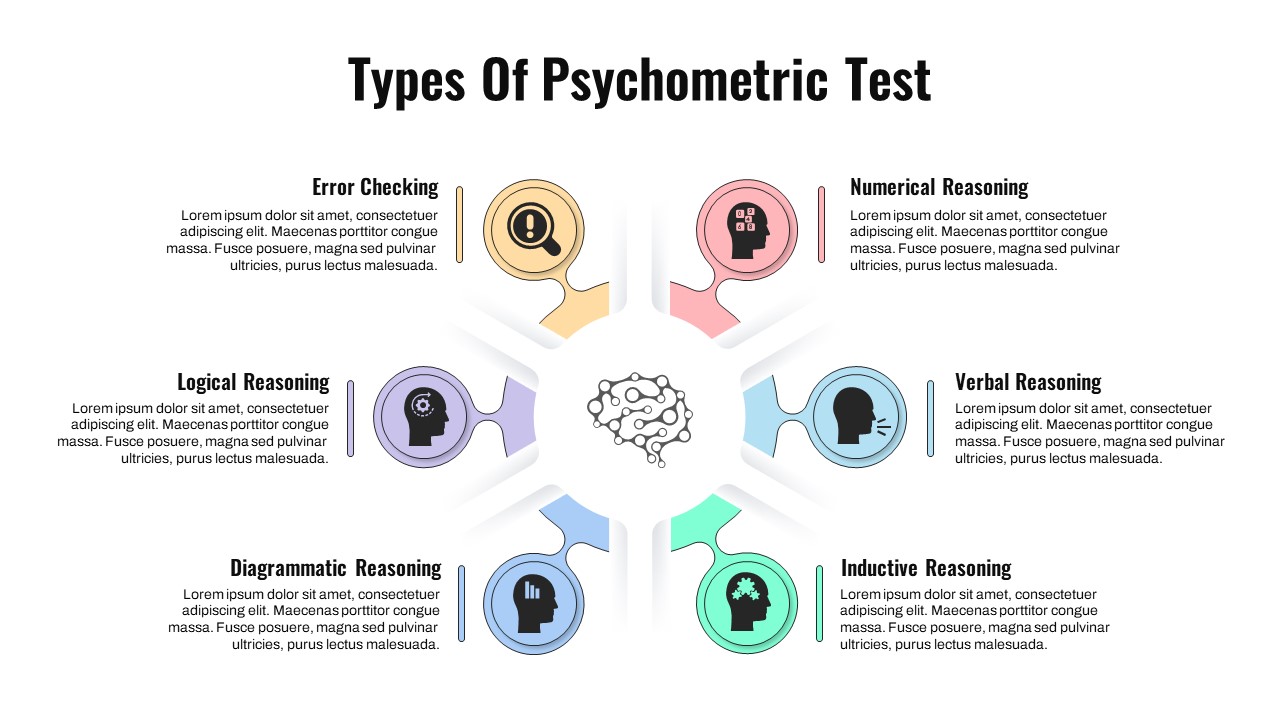
Psychometric Test Types Circular Diagram Template for PowerPoint & Google Slides
Circular
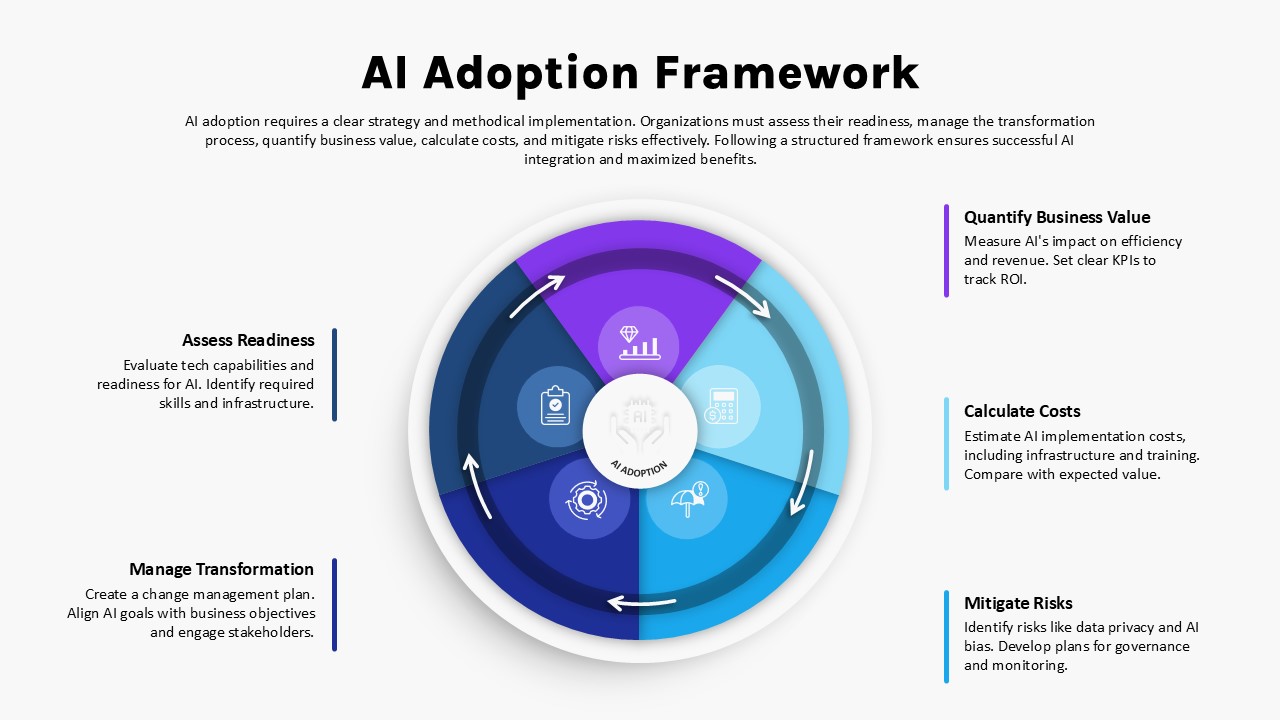
AI Adoption Framework Circular Diagram Template for PowerPoint & Google Slides
AI
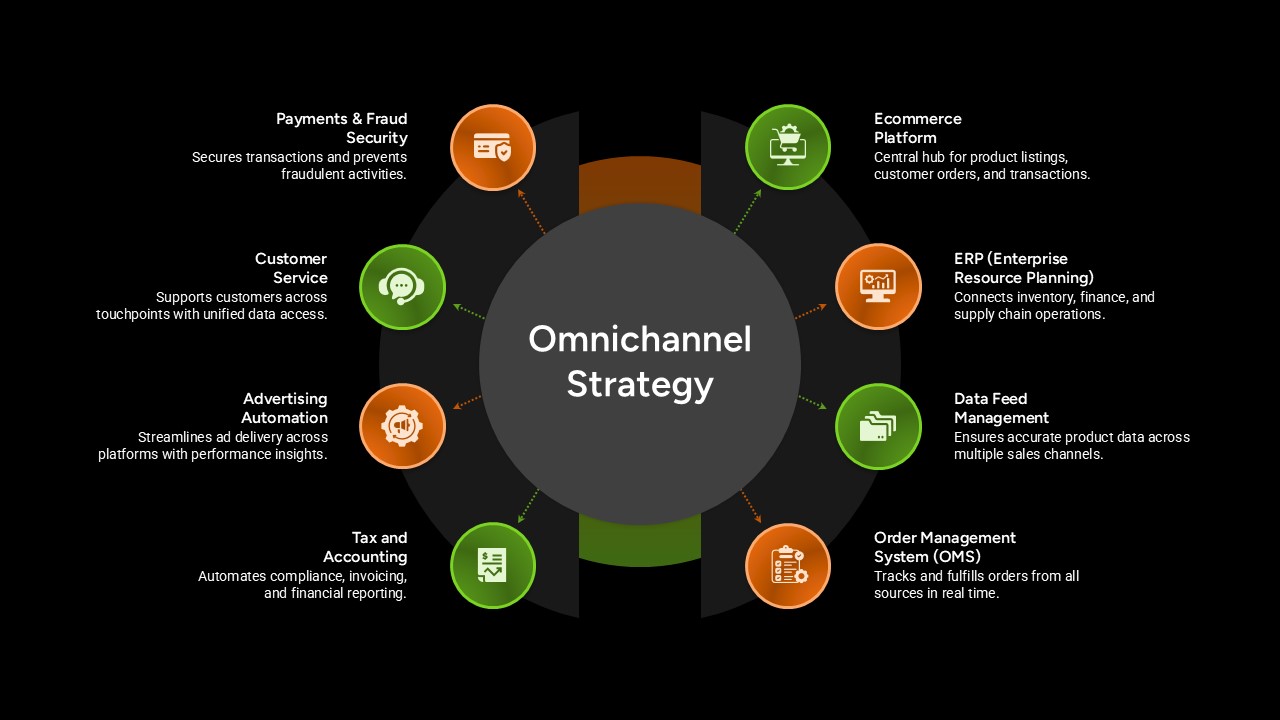
Omnichannel Strategy Circular Diagram Template for PowerPoint & Google Slides
Digital Marketing
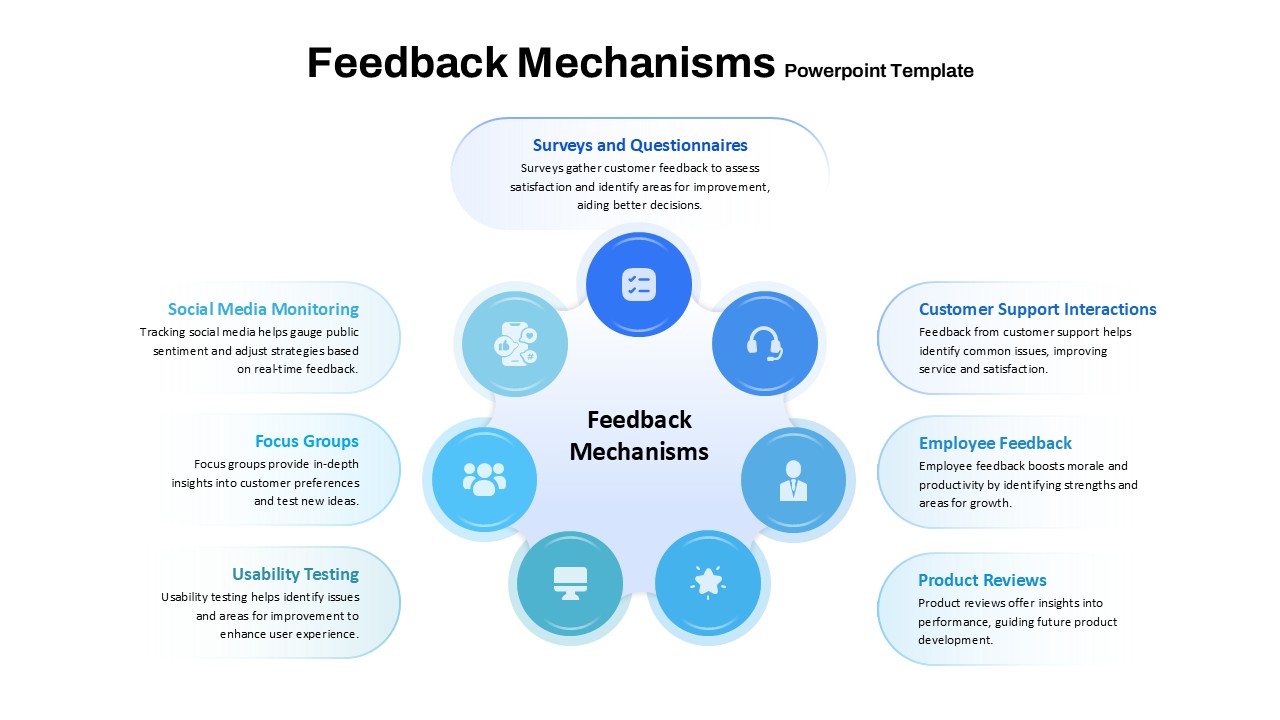
Feedback Mechanisms Circular Diagram Template for PowerPoint & Google Slides
Circular
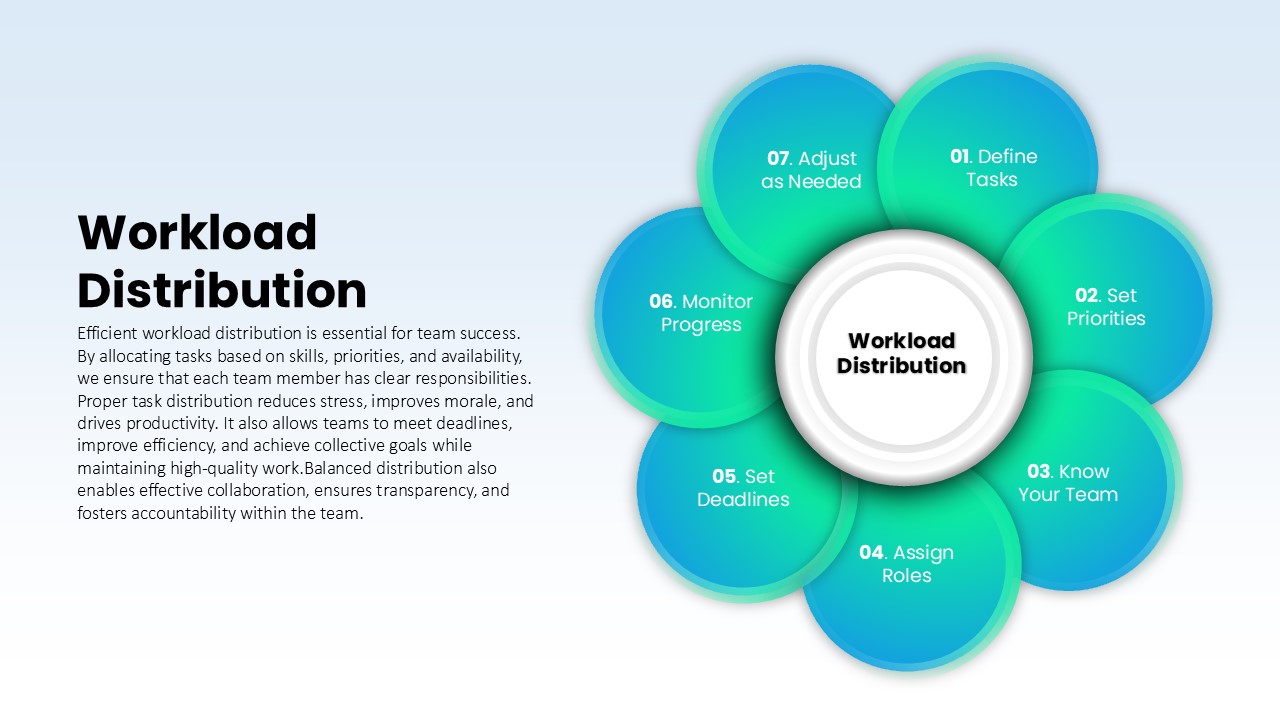
Workload Distribution Circular Diagram Template for PowerPoint & Google Slides
Circular
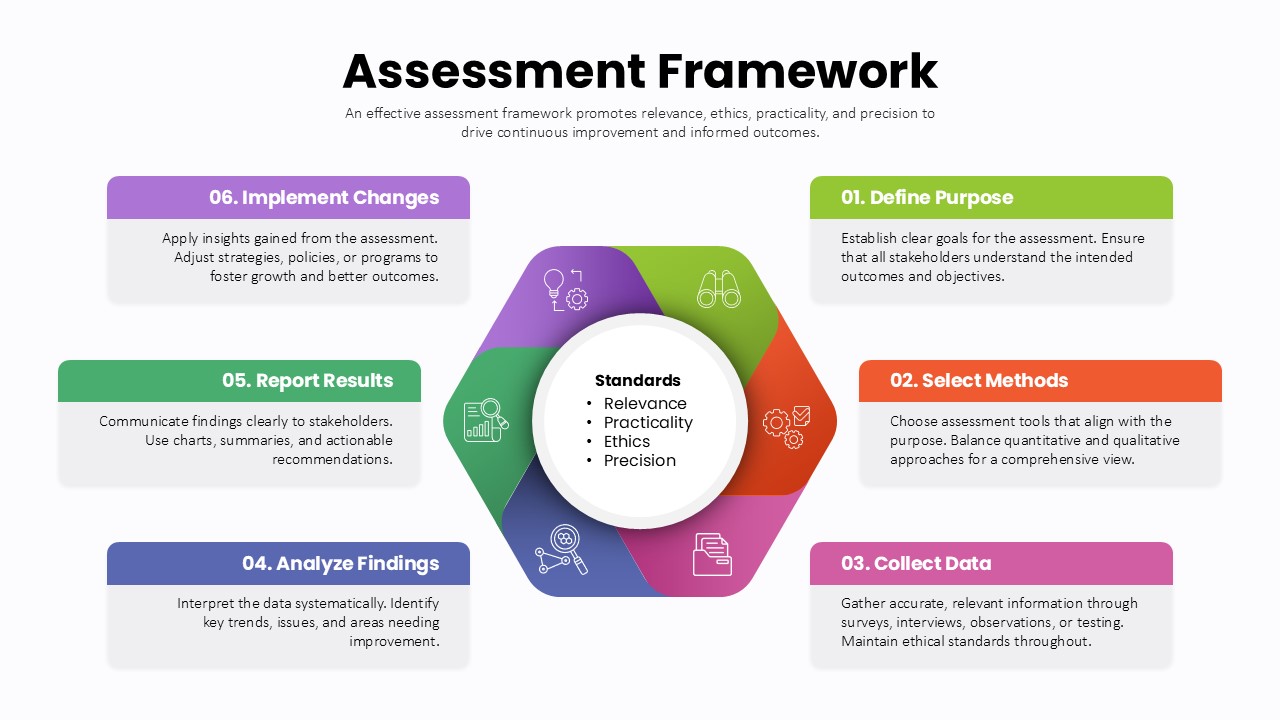
Assessment Framework Circular Diagram Template for PowerPoint & Google Slides
Circular
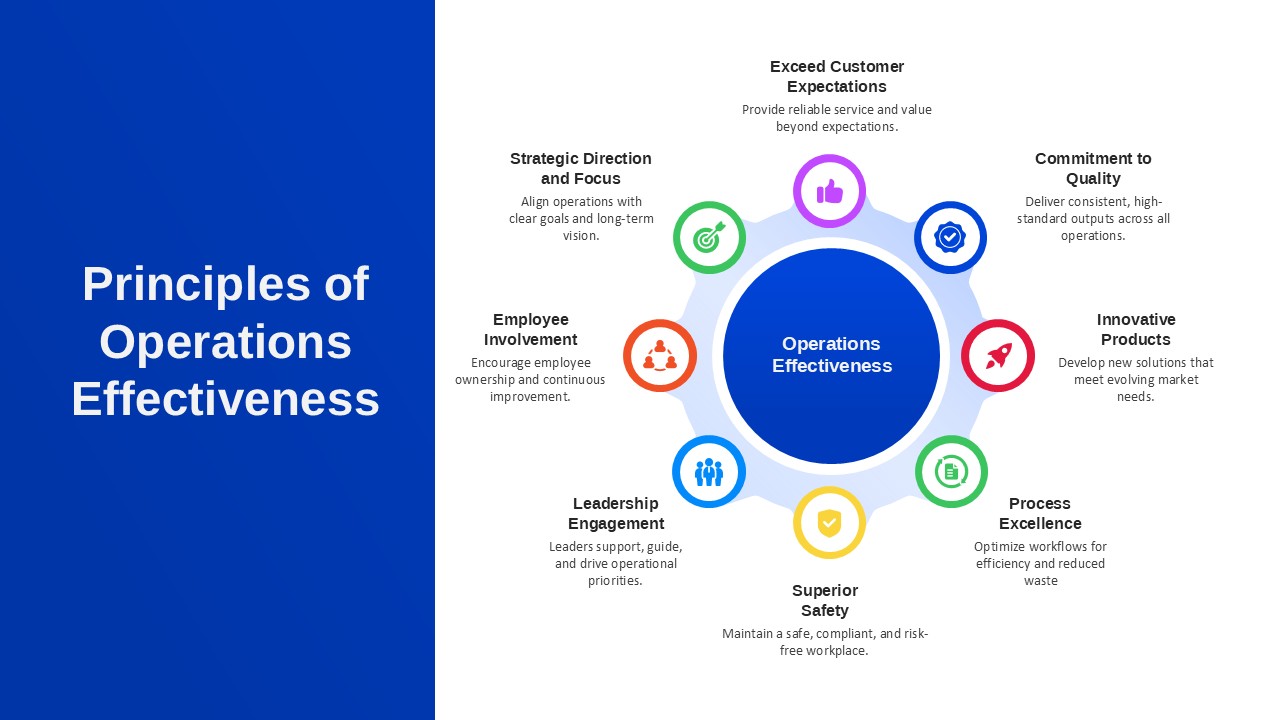
Principles of Operations Effectiveness Circular Diagram Template for PowerPoint & Google Slides
Leadership
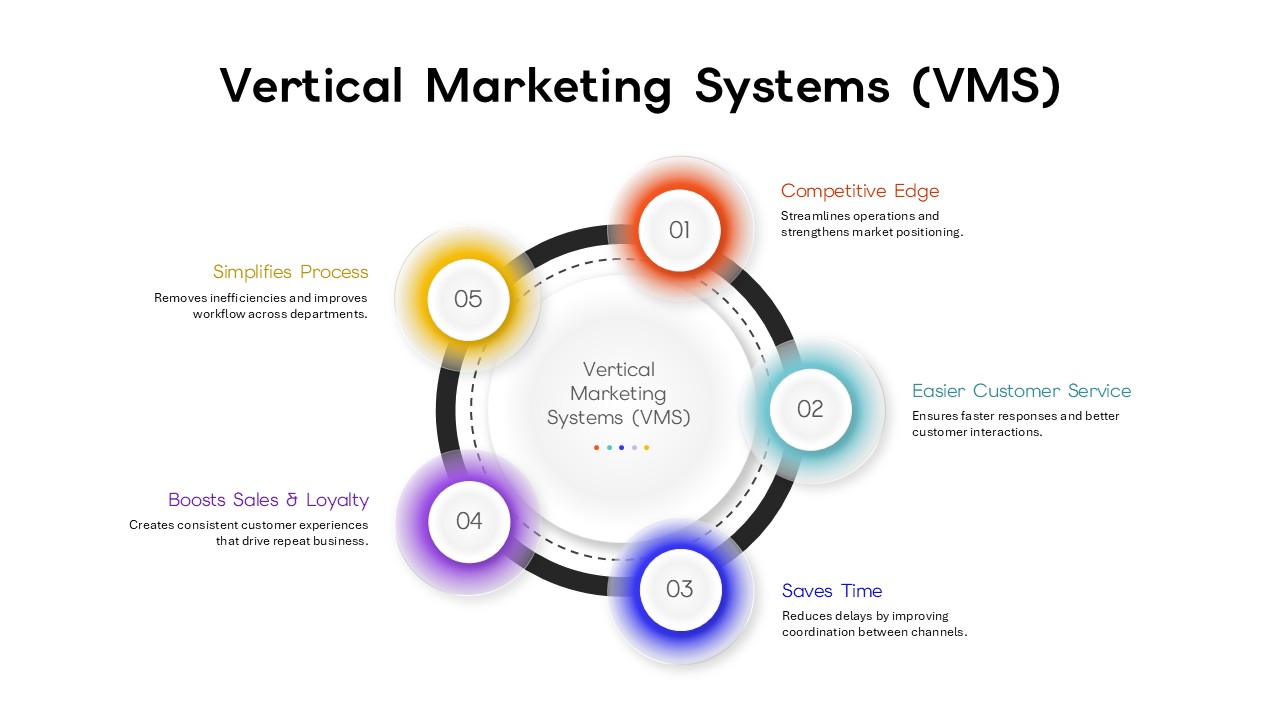
Vertical Marketing Systems (VMS) Circular Diagram Template for PowerPoint & Google Slides
Marketing