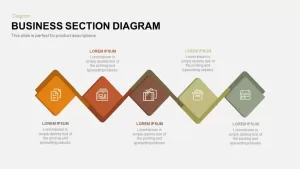
Business Section Diamond Process Diagram Template for PowerPoint & Google Slides


Description
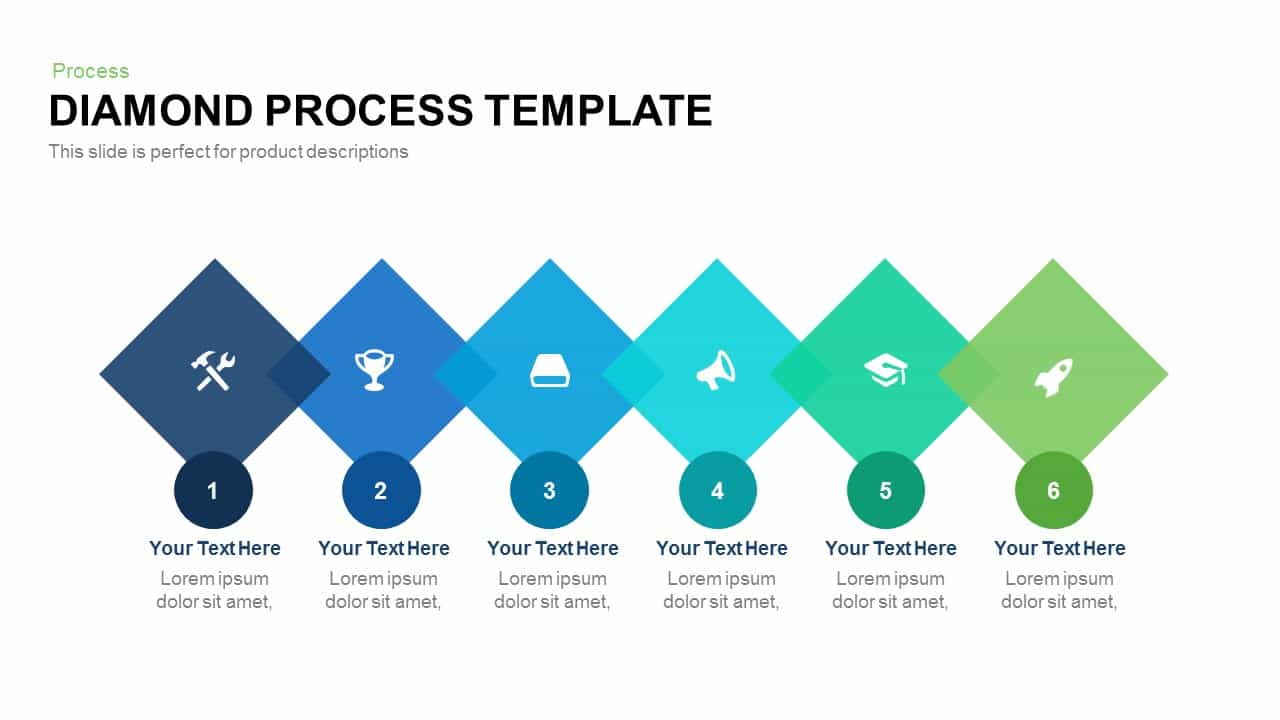
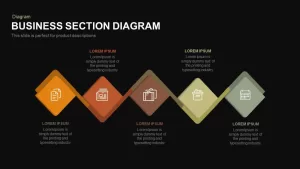
Leverage this dynamic business section diamond process diagram to showcase five strategic segments, product features, or workflow milestones with clarity and modern aesthetics. The slide arranges five interconnected diamond-shaped modules in a zigzag pattern, each containing a crisp icon placeholder, a headline textbox, and a descriptive text area. A subtle connecting line links each diamond, guiding viewer focus through a cohesive narrative. Distinct default color fills – from vibrant orange to muted gray – differentiate each segment, while precision snap-to-grid alignment and optional drop shadows maintain balance and depth without clutter.
Built entirely with vector shapes on master slide layouts, the template offers full control over every element. Swap embedded icons from the 50+ symbol library, adjust segment colors to match your brand palette, modify typography, or resize diamonds without any loss of quality. Intuitive placeholders and locked guides accelerate content updates and preserve alignment during collaborative editing in both PowerPoint and Google Slides. Duplicate, remove, or reorder diamonds to tailor the framework to any number of steps or categories.
Optimized for high-definition output across devices, this business section diagram slide ensures consistent visual impact in boardrooms, webinars, and virtual workshops. Whether you’re mapping product roadmaps, outlining process workflows, detailing service offerings, or presenting stakeholder insights, this modular infographic empowers you to communicate complex sequences in a structured, engaging, and visually appealing format.
The slide also supports optional data callouts and percentage markers adjacent to each diamond, enabling you to highlight key metrics or performance indicators within the context of each segment. With master slide integration and cloud-based collaboration, teams can quickly iterate on design, apply brand theme changes across the deck, and maintain version control effortlessly. This versatile diagram is ideal for product roadmap presentations, market segmentation analyses, departmental overviews, or competitive benchmarking reports.
Who is it for
Project managers, marketing teams, business analysts, operations leads, and consultants will benefit from this slide when mapping product roadmaps, process workflows, service feature breakdowns, or competitive benchmarking in executive presentations and stakeholder workshops.
Other Uses
Repurpose this diagram for product launch timelines, departmental KPI dashboards, market segmentation breakdowns, training module outlines, or project phase reviews, adapting the number of diamonds and content labels to fit diverse narrative needs.
Login to download this file

Item ID
SB00556
Related Templates

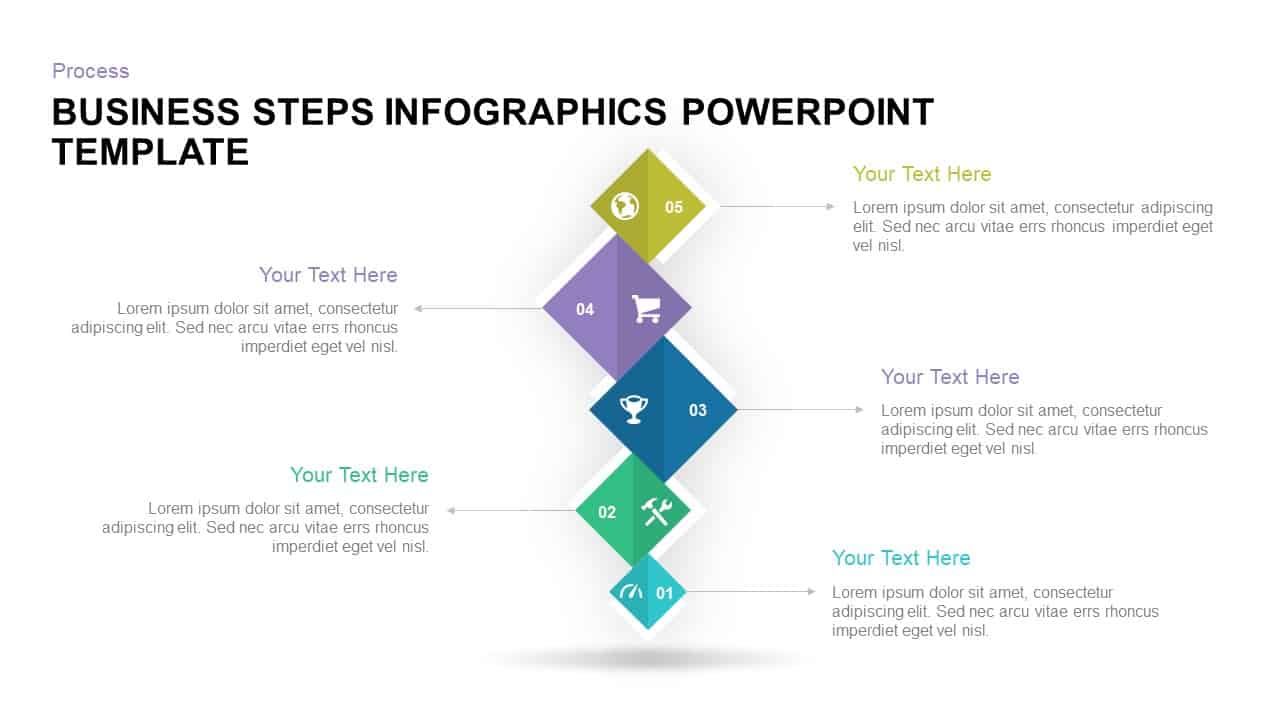
Five-Step Diamond Process Diagram Template for PowerPoint & Google Slides
Process
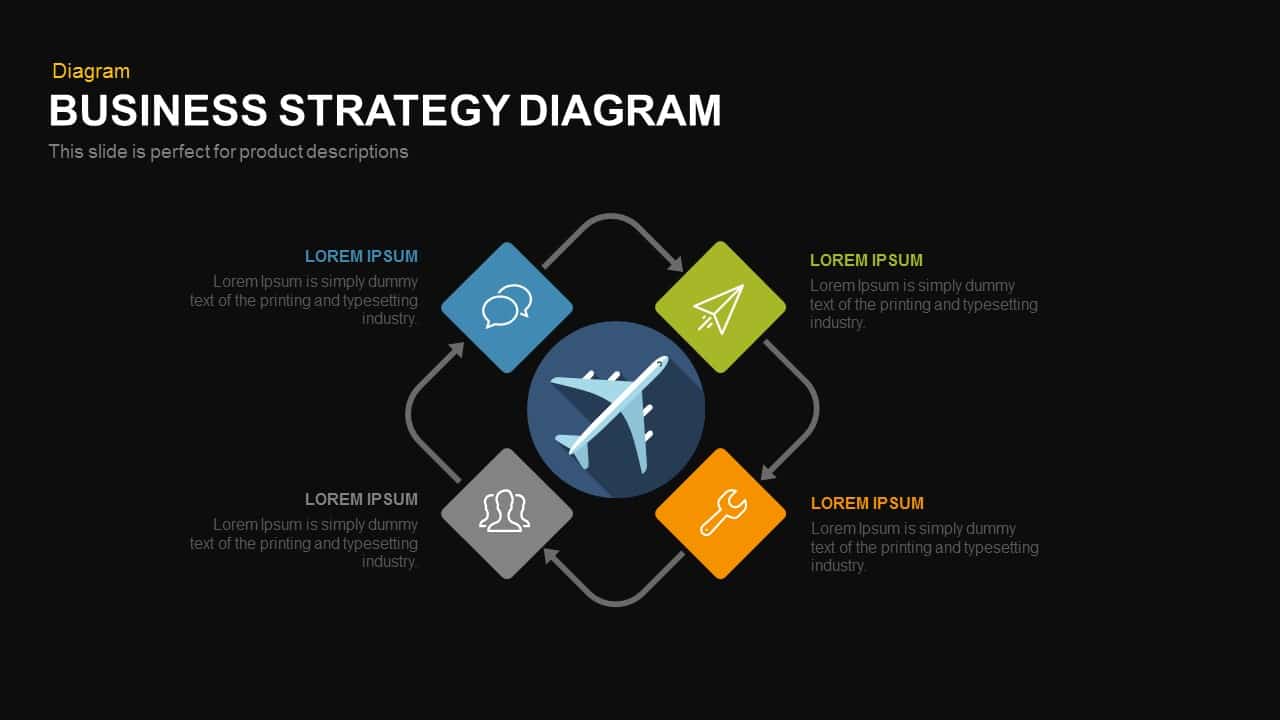
Strategic Business Diamond Diagram Template for PowerPoint & Google Slides
Business Strategy
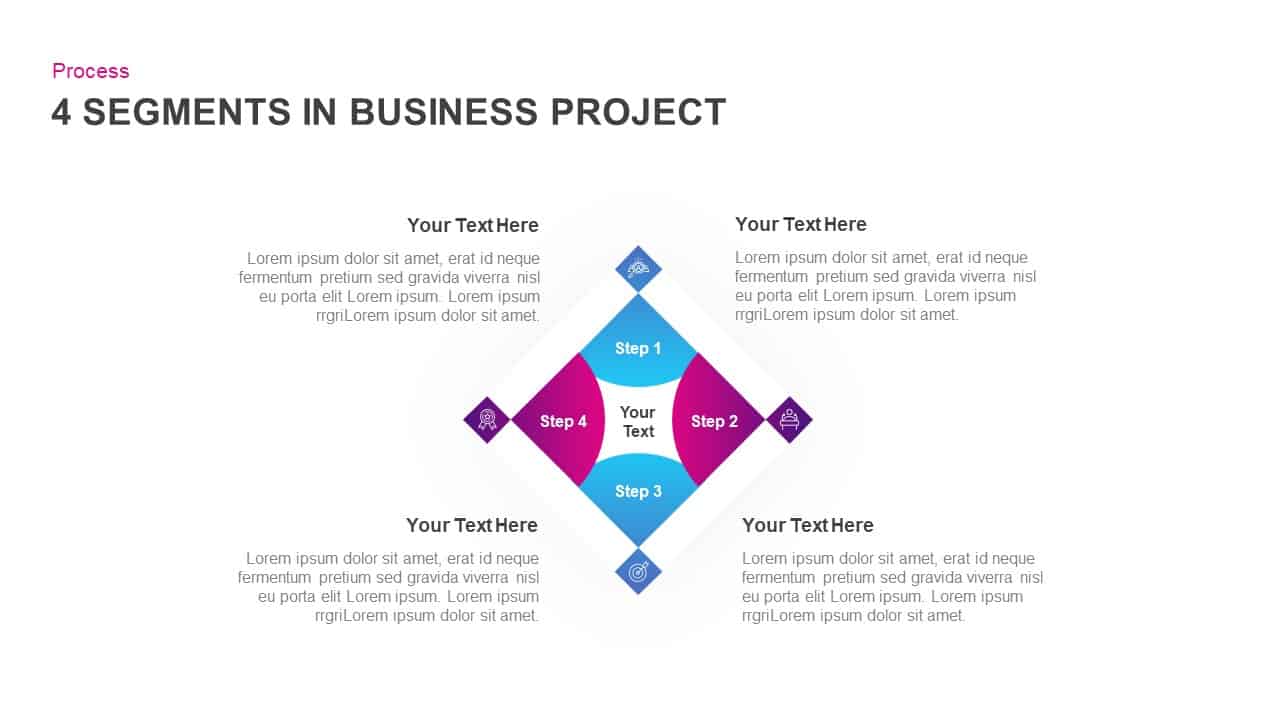
4-Segment Business Project Diamond Diagram Template for PowerPoint & Google Slides
Process
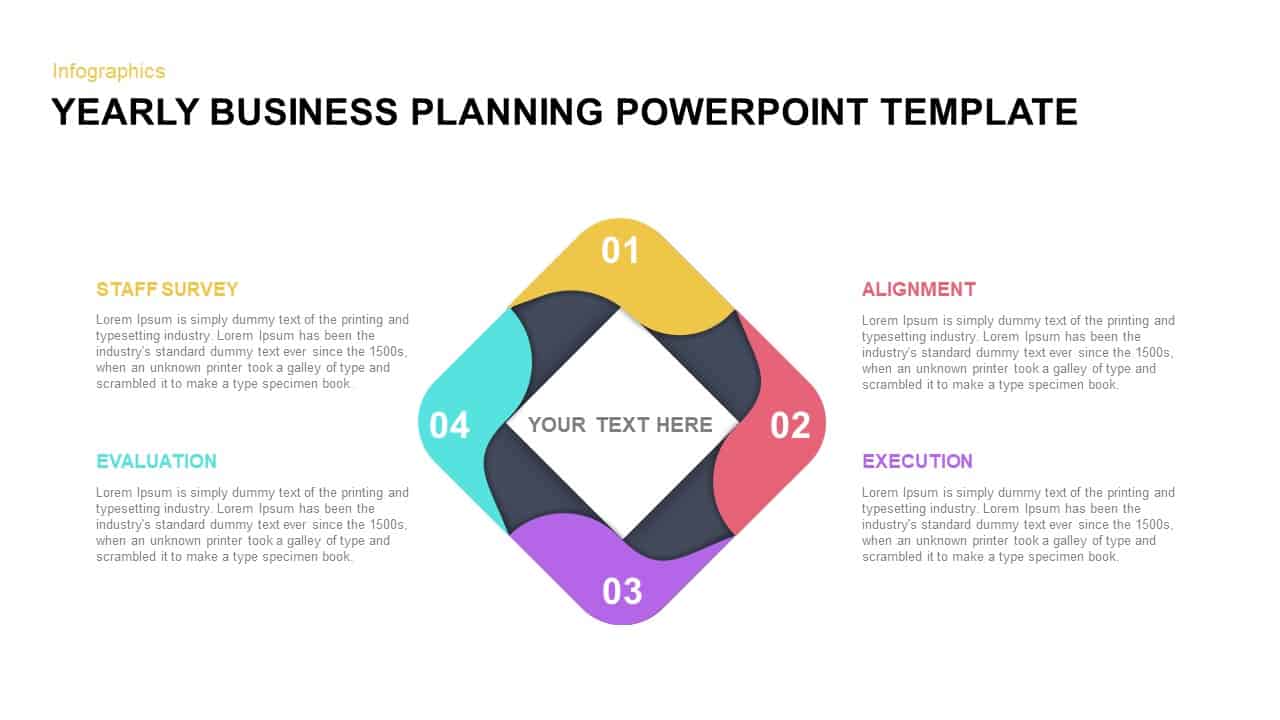
Yearly Business Planning Diamond Diagram Template for PowerPoint & Google Slides
Process
Diamond Process Template template for PowerPoint & Google Slides
Process
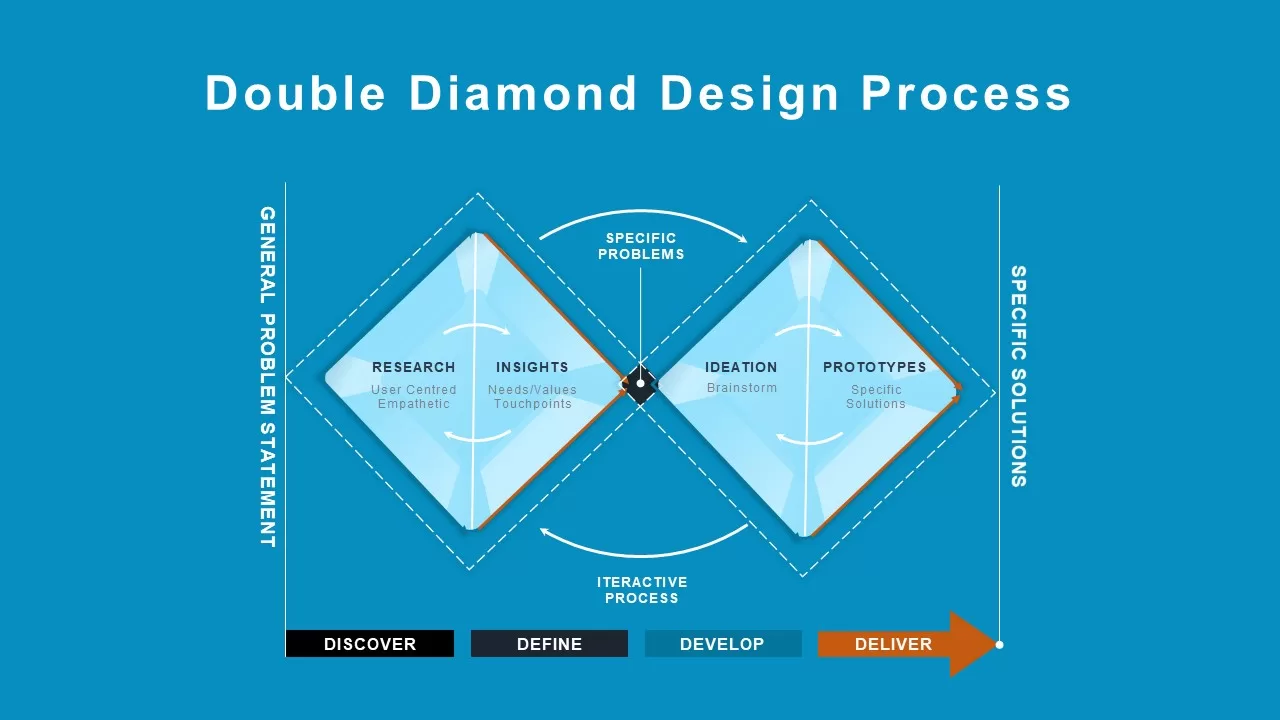
Double Diamond Design Process Overview Template for PowerPoint & Google Slides
Process
Diamond Mind Map Diagram Four Branches Template for PowerPoint & Google Slides
Mind Maps
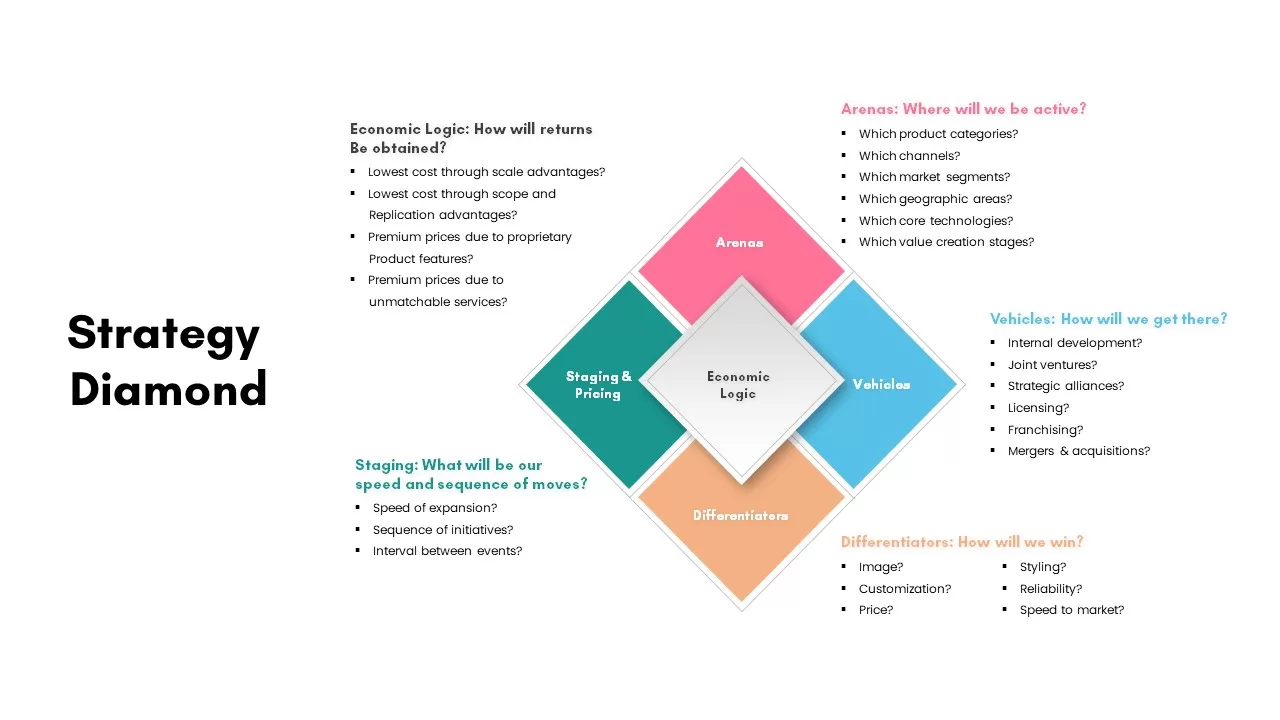
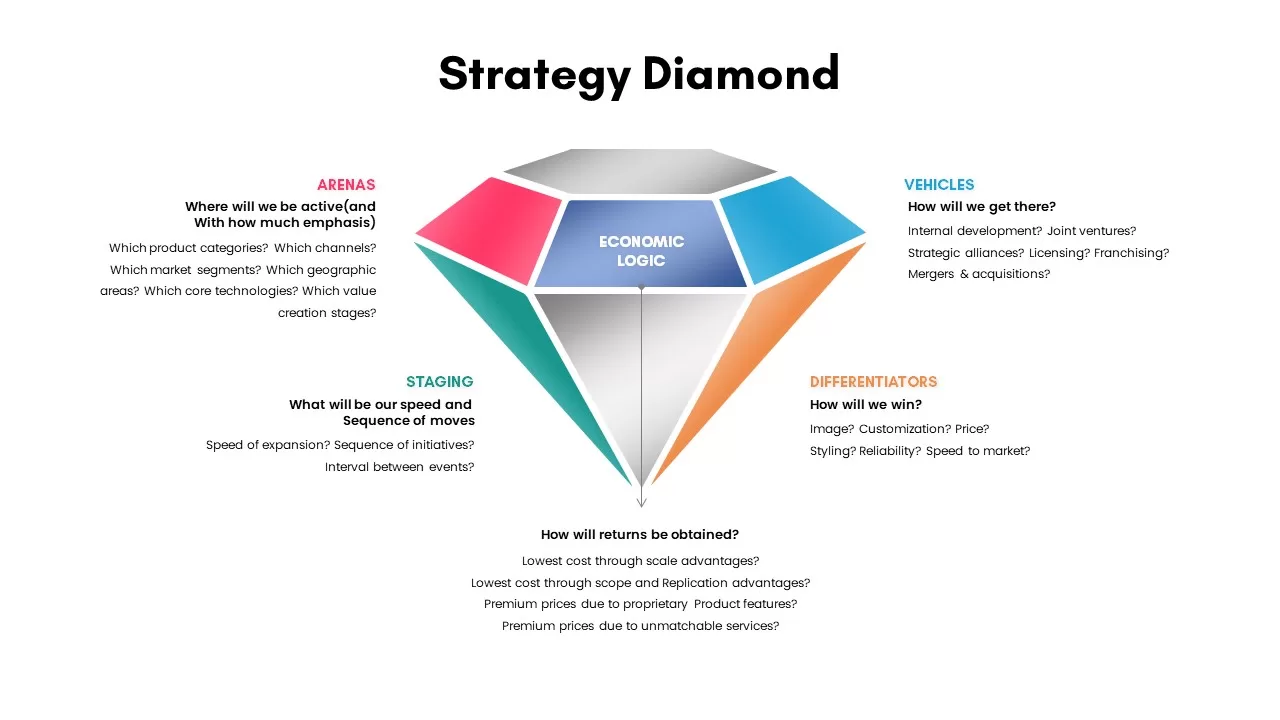
Strategy Diamond Diagram Template for PowerPoint & Google Slides
Competitor Analysis
Six Double Diamond Infographic Slides Template for PowerPoint & Google Slides
Process

Bold Diamond Risk Alert Visualization Template for PowerPoint & Google Slides
Risk Management
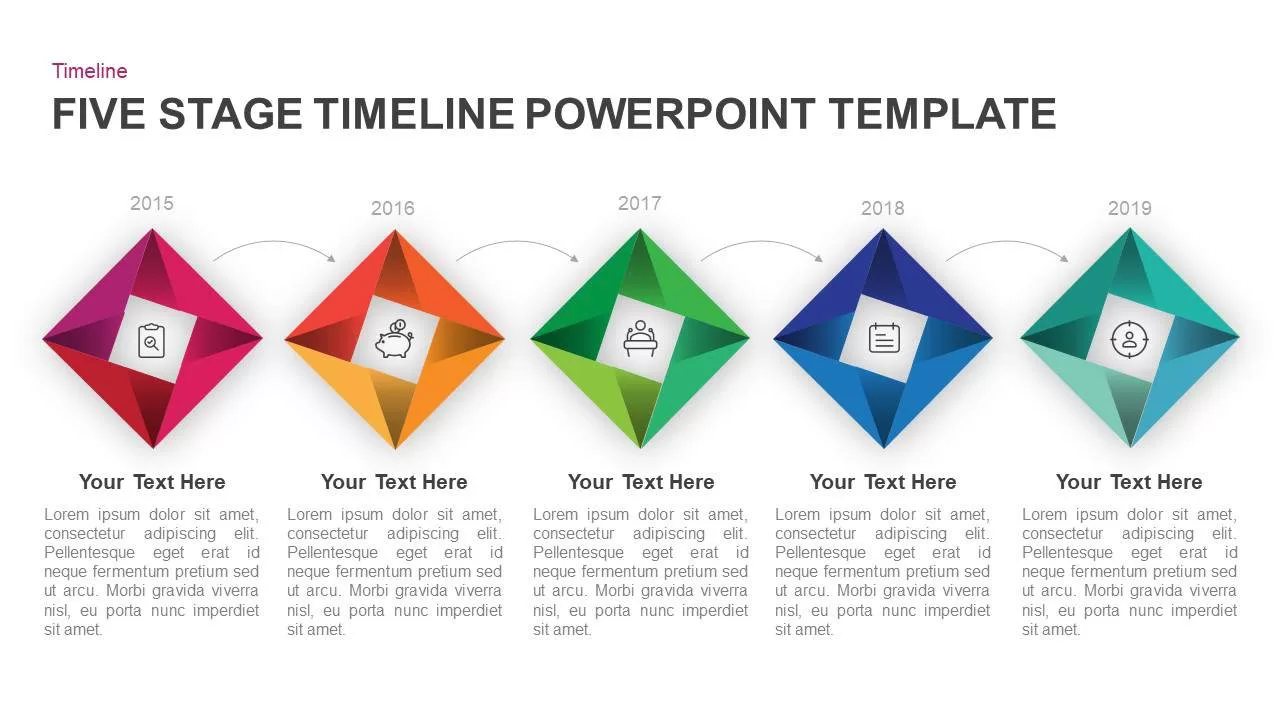
Five-Stage Diamond Timeline Chart Template for PowerPoint & Google Slides
Timeline
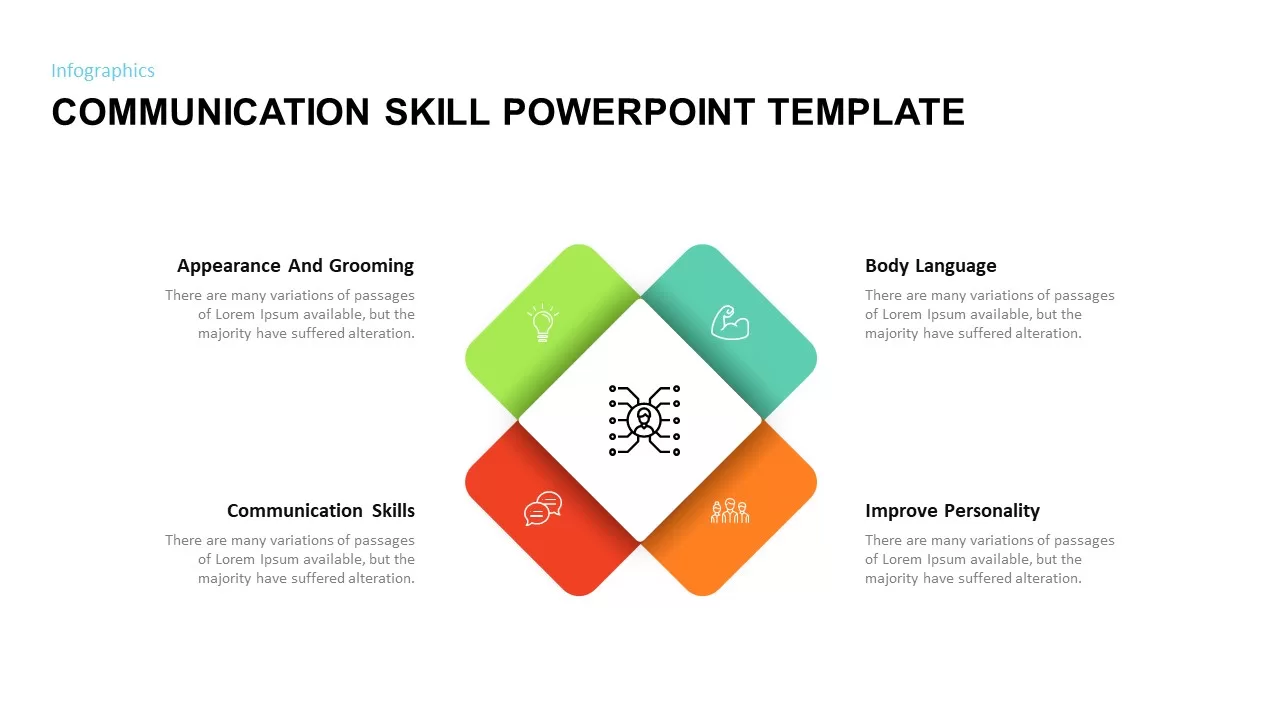
Four-Stage Communication Skills Diamond Template for PowerPoint & Google Slides
Circular
Strategy Diamond Framework Visual Template for PowerPoint & Google Slides
Competitor Analysis
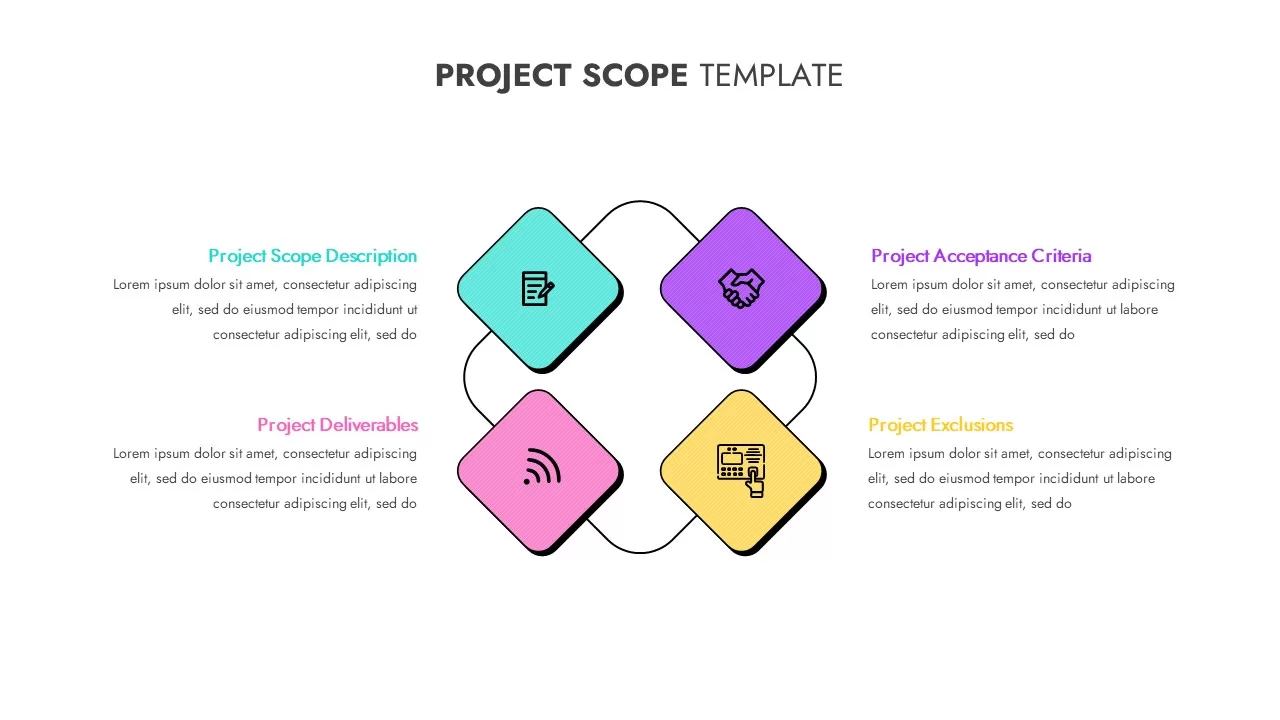
Project Scope Diamond Framework Template for PowerPoint & Google Slides
Project Status
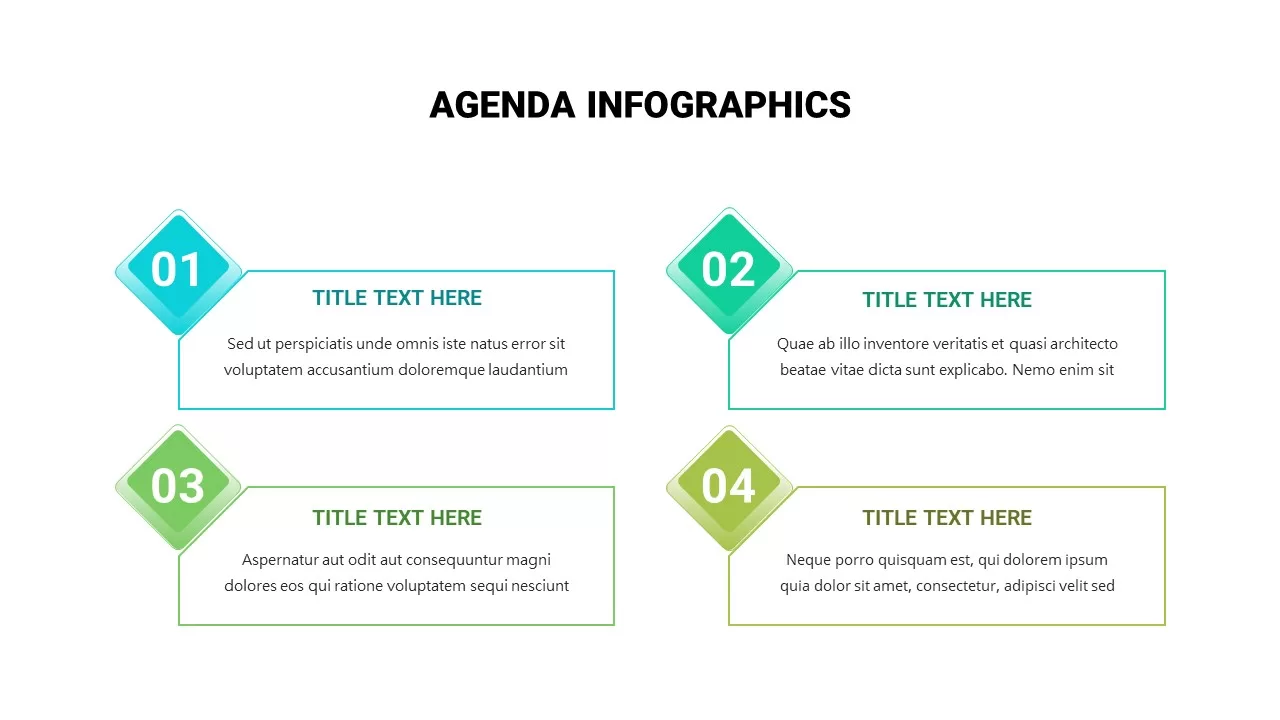
Agenda Infographics Diamond template for PowerPoint & Google Slides
Business Plan
Elegant Diamond Photo Grid Layout Template for PowerPoint & Google Slides
Graphics
Modern Diamond-Themed Cover Slide Template for PowerPoint & Google Slides
Company Profile
4 Section Pipe Diagram Process Flow Template for PowerPoint & Google Slides
Process
Three-Section Fishbone Process Diagram template for PowerPoint & Google Slides
Process
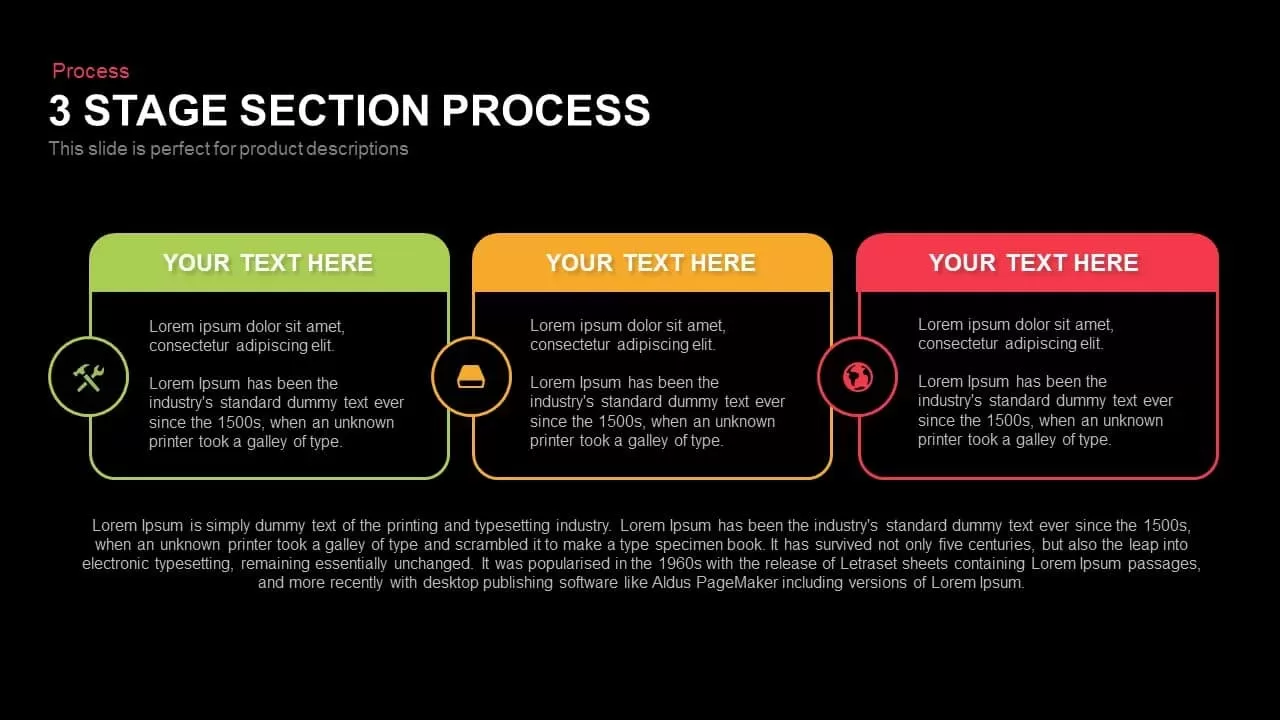
3 Stage Section Process Diagram Template for PowerPoint & Google Slides
Process
Modern 4 Section Process Diagram Template for PowerPoint & Google Slides
Process
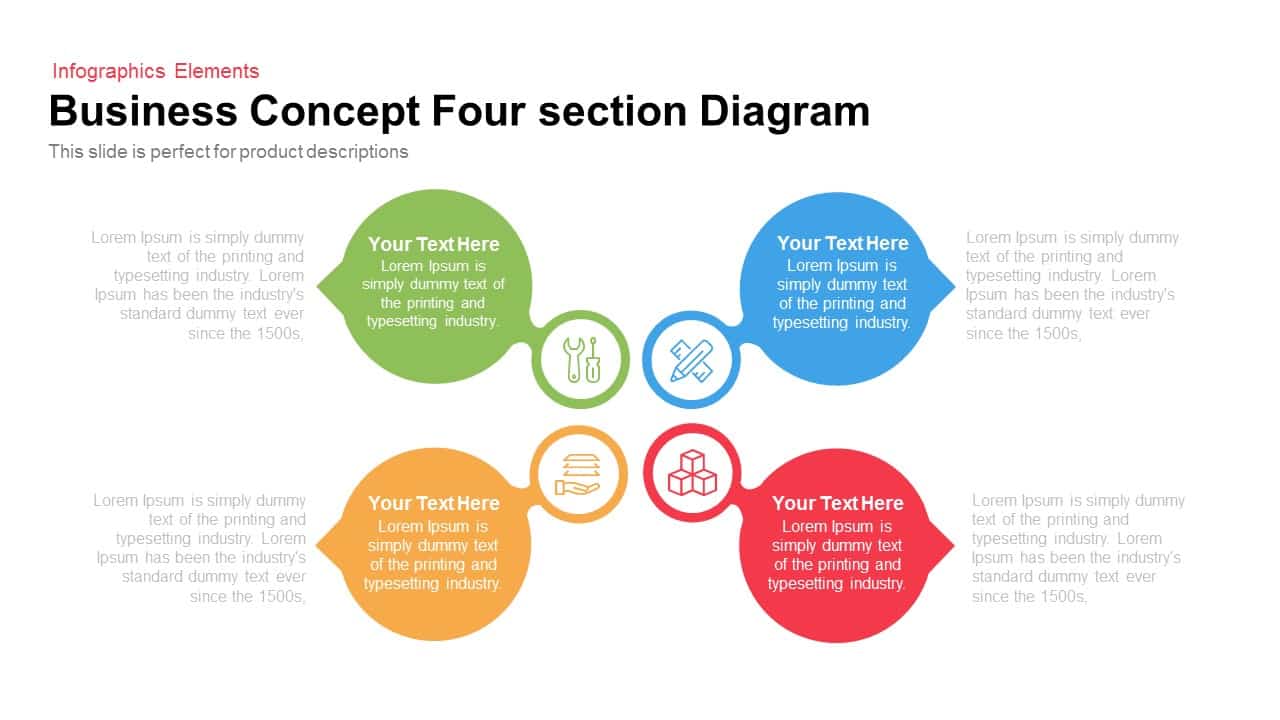
Business Concept 4 section Diagram template for PowerPoint & Google Slides
Infographics
Four Section Medical Process template for PowerPoint & Google Slides
Process
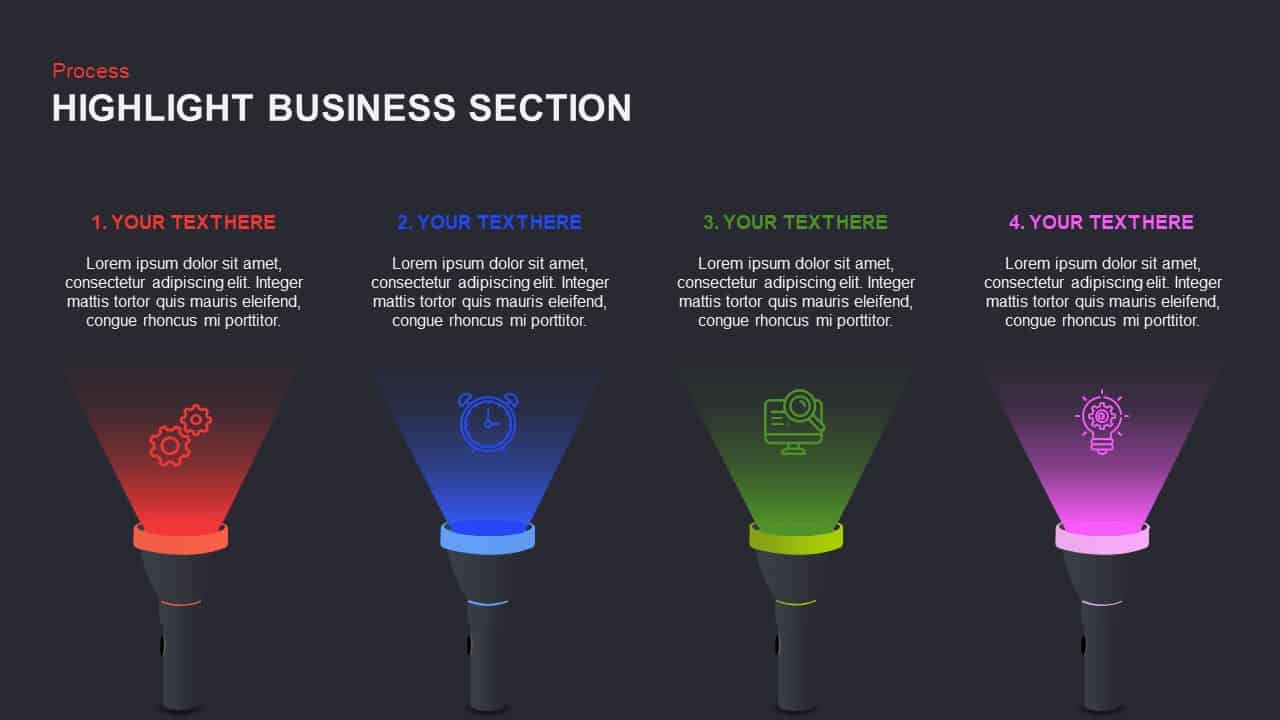
Highlight Business Section for PowerPoint & Google Slides
Process
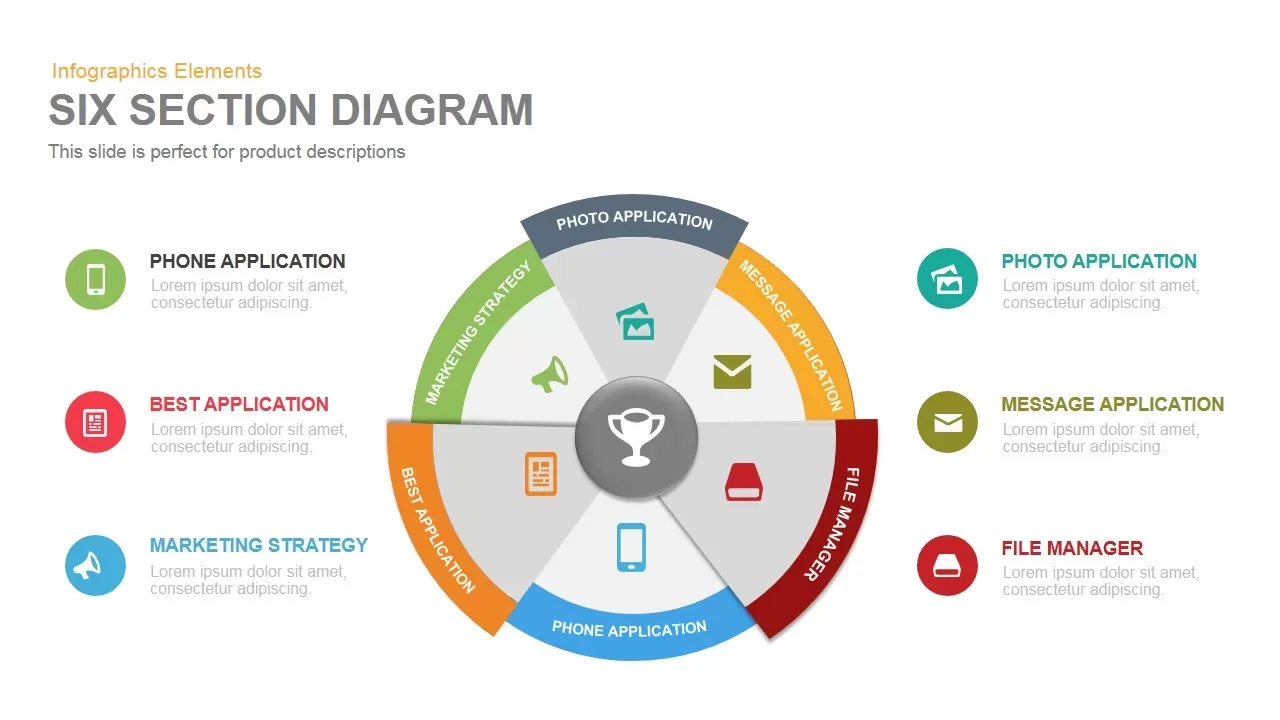
Six Section Diagram template for PowerPoint & Google Slides
Circular
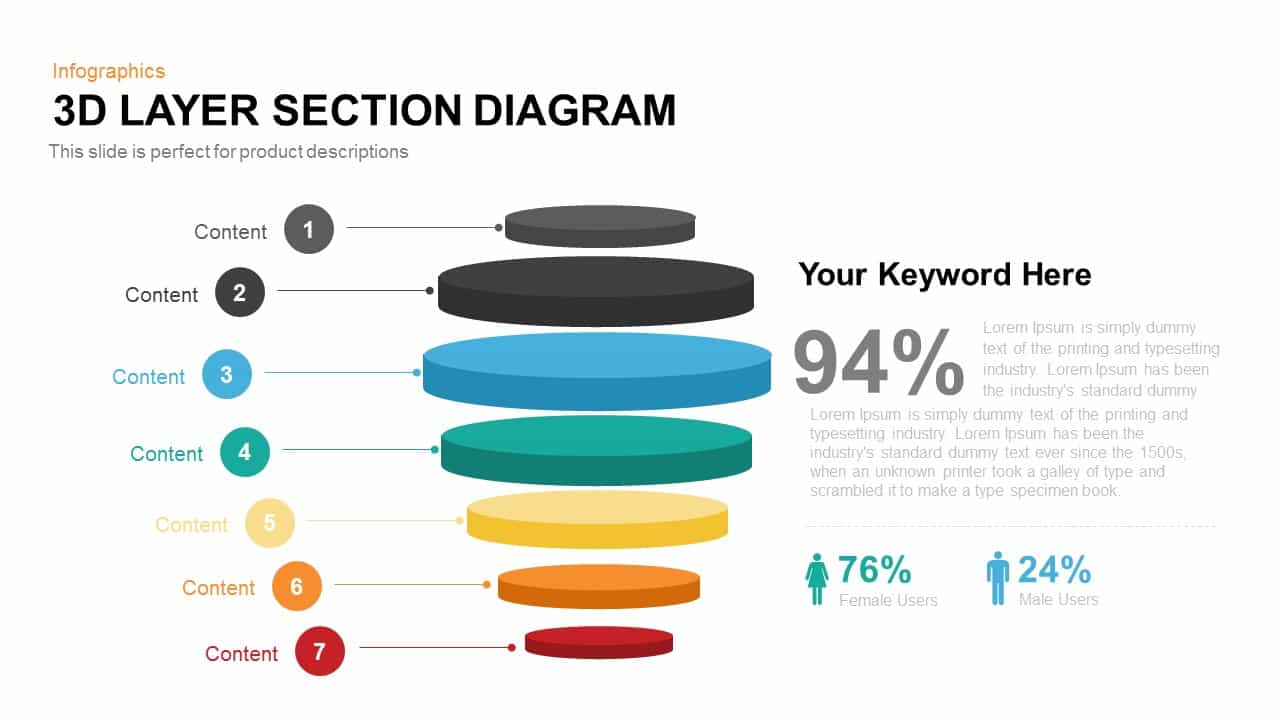
Modern 3D Layer Section Diagram Template for PowerPoint & Google Slides
Circular
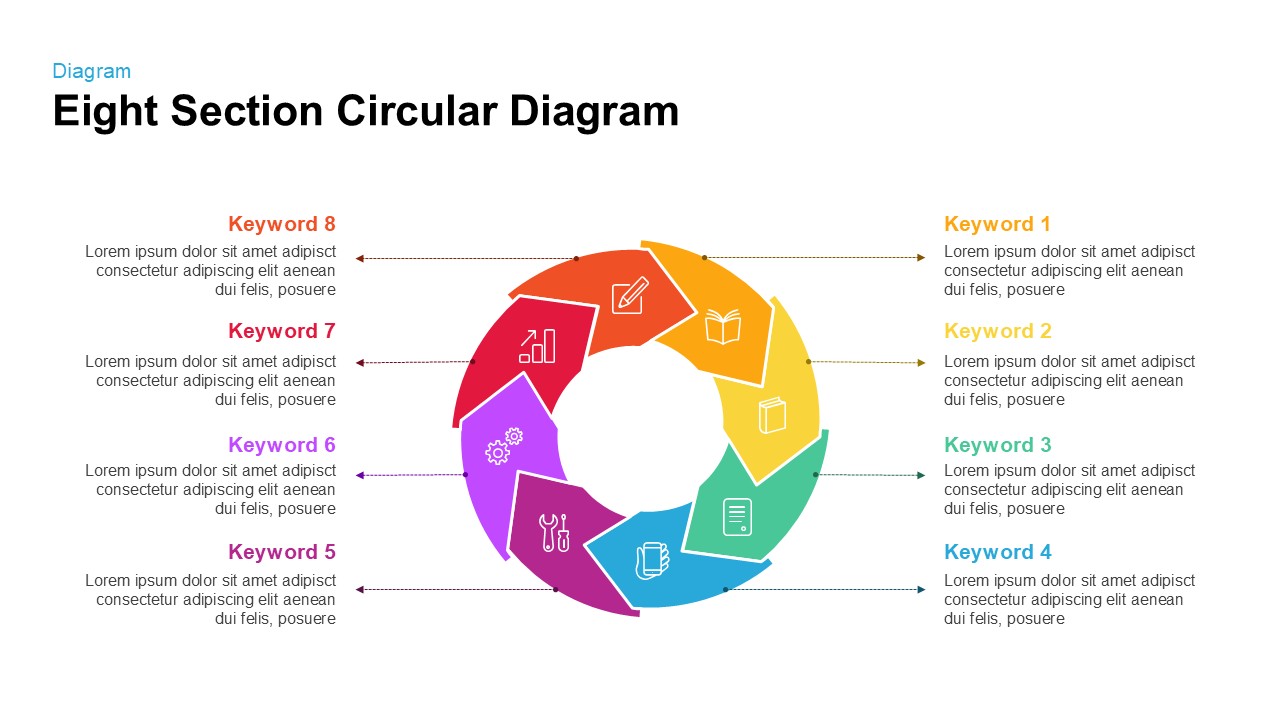
Eight Section Circular Diagram Template for PowerPoint & Google Slides
Circular
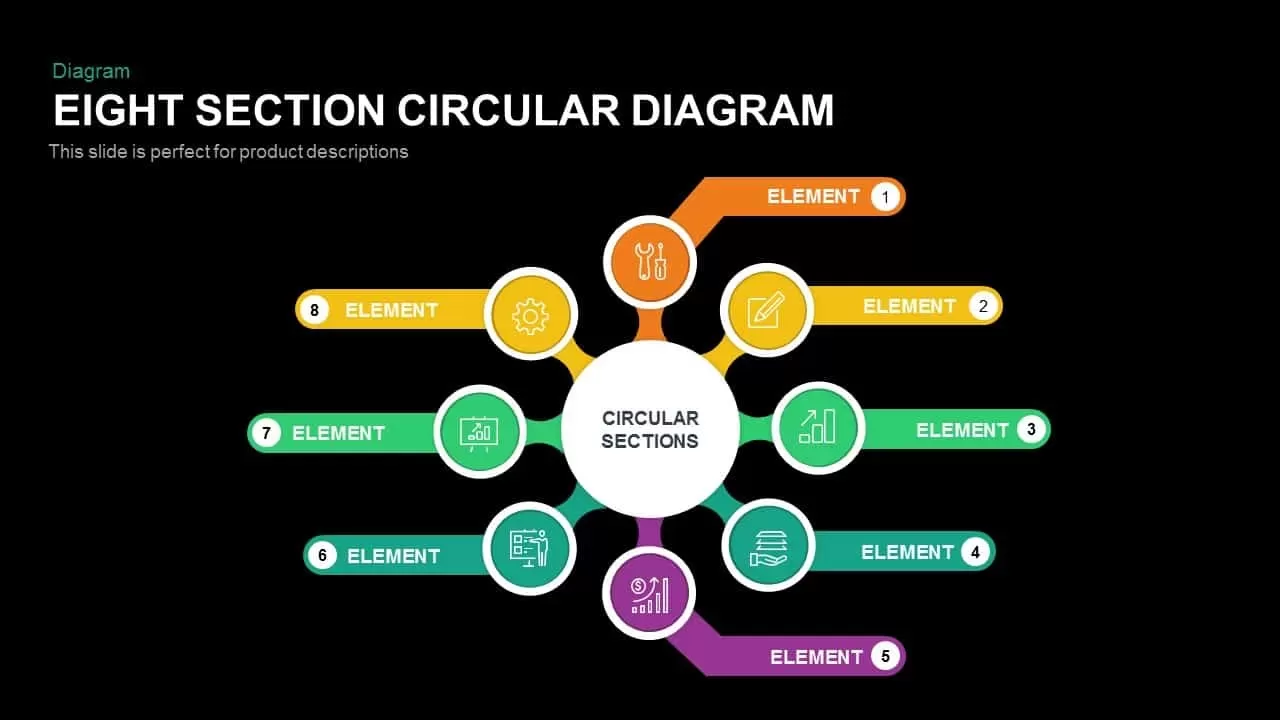
Eight Section Circular Diagram Template for PowerPoint & Google Slides
Circular
Six Section Circular Infographic Diagram Template for PowerPoint & Google Slides
Circular
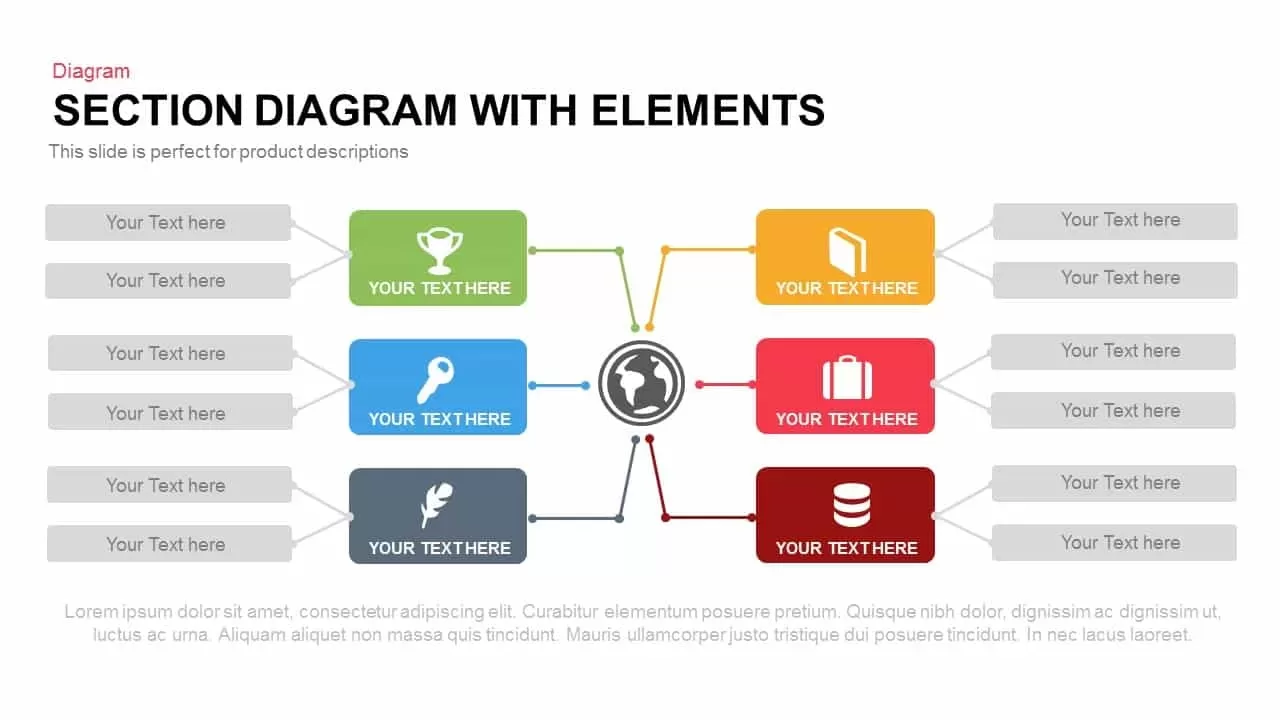
Section Diagram Elements Infographic Template for PowerPoint & Google Slides
Process
Four Section Comparison Chart Diagram Template for PowerPoint & Google Slides
Infographics
Section Diagram template for PowerPoint & Google Slides
Circular
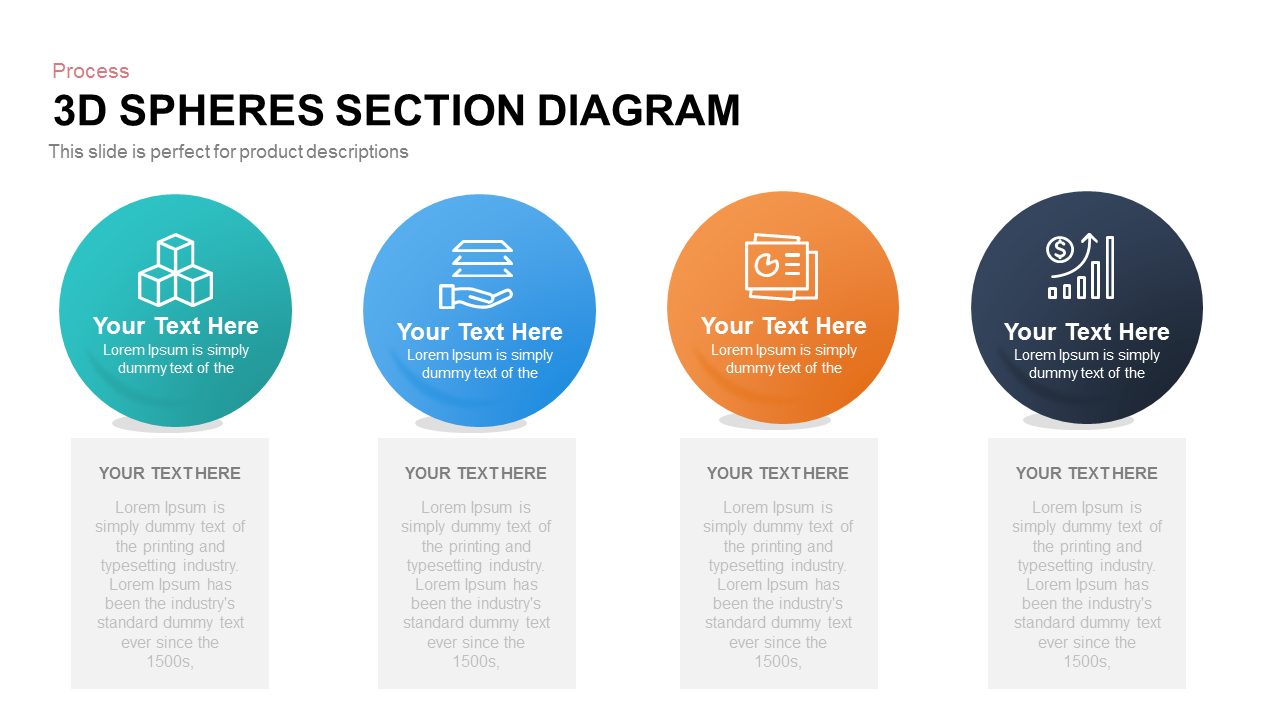
Four-Part 3D Spheres Section Diagram template for PowerPoint & Google Slides
Process
Eight-Section Circular Diagram template for PowerPoint & Google Slides
Circular

8-Section Split Diagram with Hub Icon template for PowerPoint & Google Slides
Circular
Four Gear Section Diagram Template for PowerPoint & Google Slides
Circular
3D Shaped Section Diagram template for PowerPoint & Google Slides
Infographics
Five-Section Circular Arrow Diagram Template for PowerPoint & Google Slides
Circular
Five-Section Arrow Signpost Diagram Template for PowerPoint & Google Slides
Arrow
Pencil Section Five-Part Diagram Template for PowerPoint & Google Slides
Process
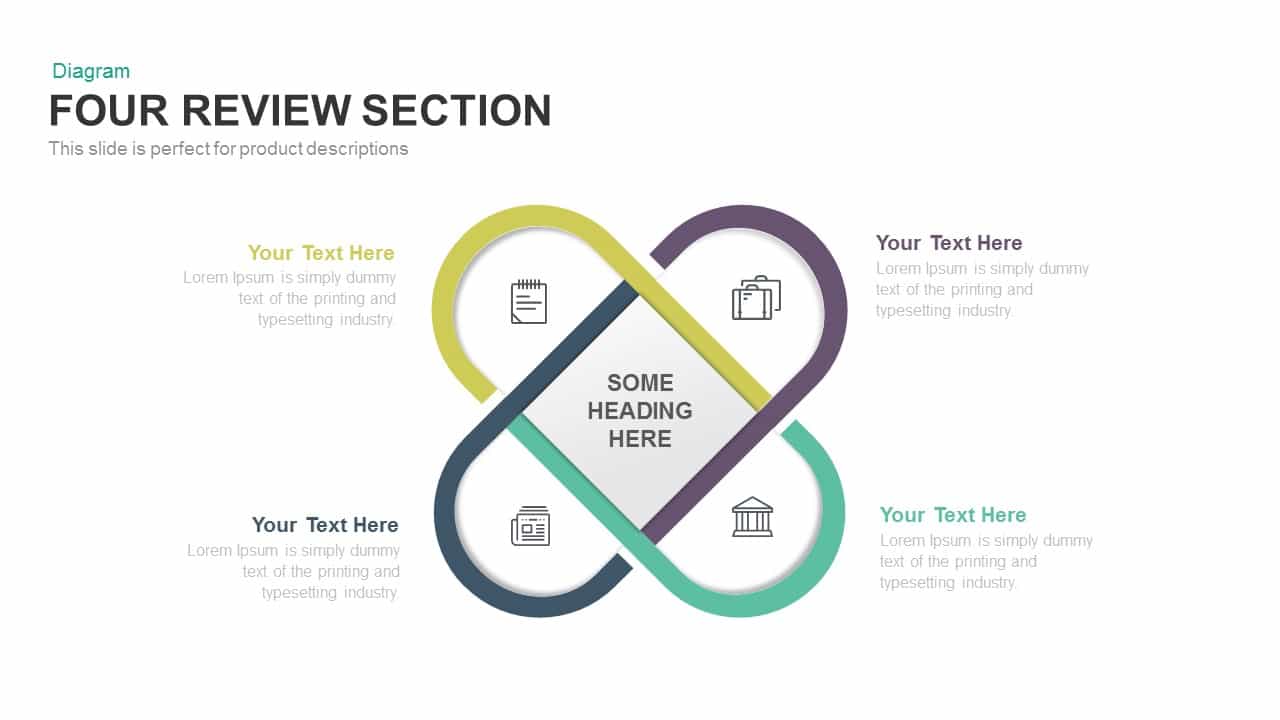
Clean Four-Section Review Diagram Template for PowerPoint & Google Slides
Agenda
Modern Multi-Section Circle Diagram Template for PowerPoint & Google Slides
Circular
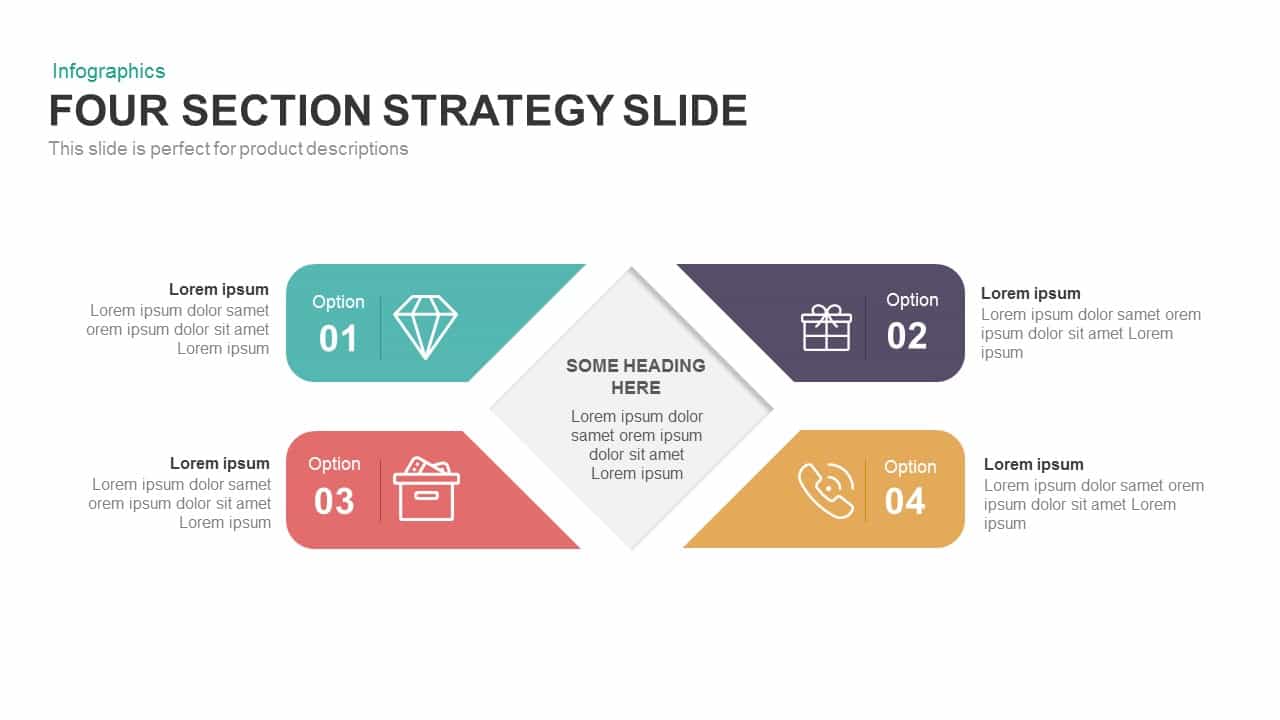
Four-Section Strategy Diagram Slide Template for PowerPoint & Google Slides
Business Strategy
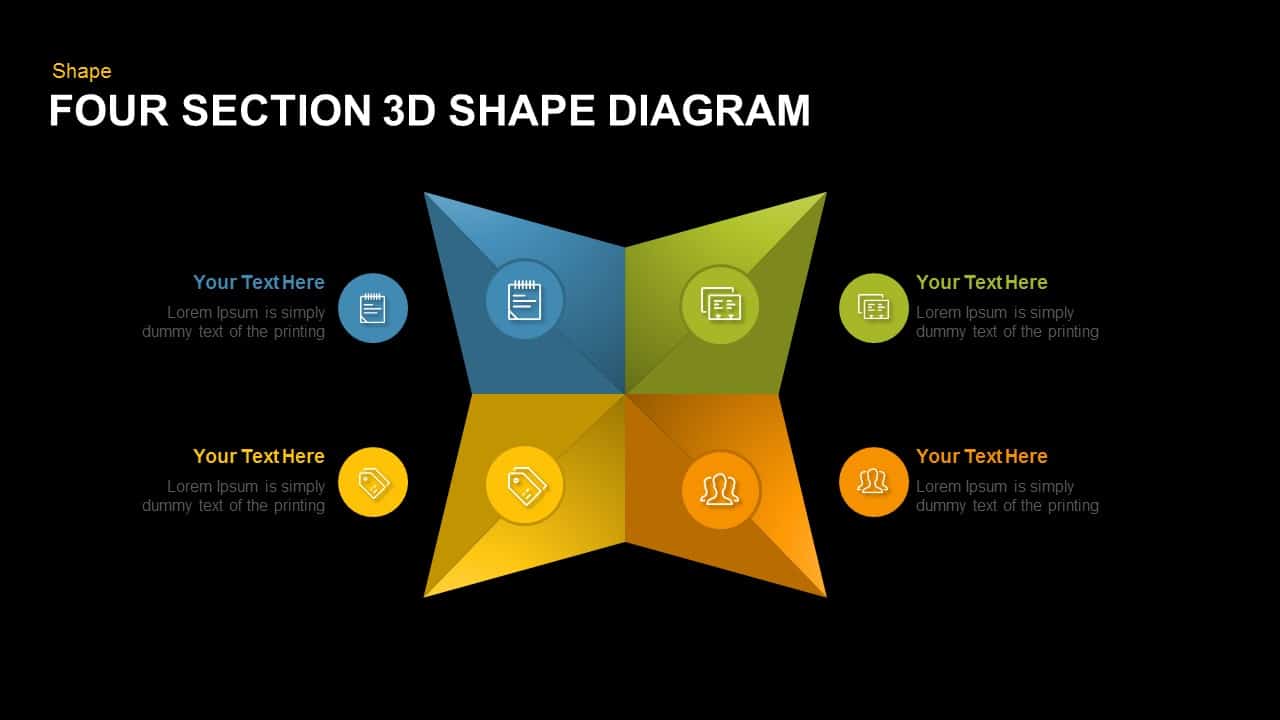
Editable Four-Section 3D Shape Diagram Template for PowerPoint & Google Slides
Comparison
Four-Section Arrow Infographic Diagram Template for PowerPoint & Google Slides
Arrow
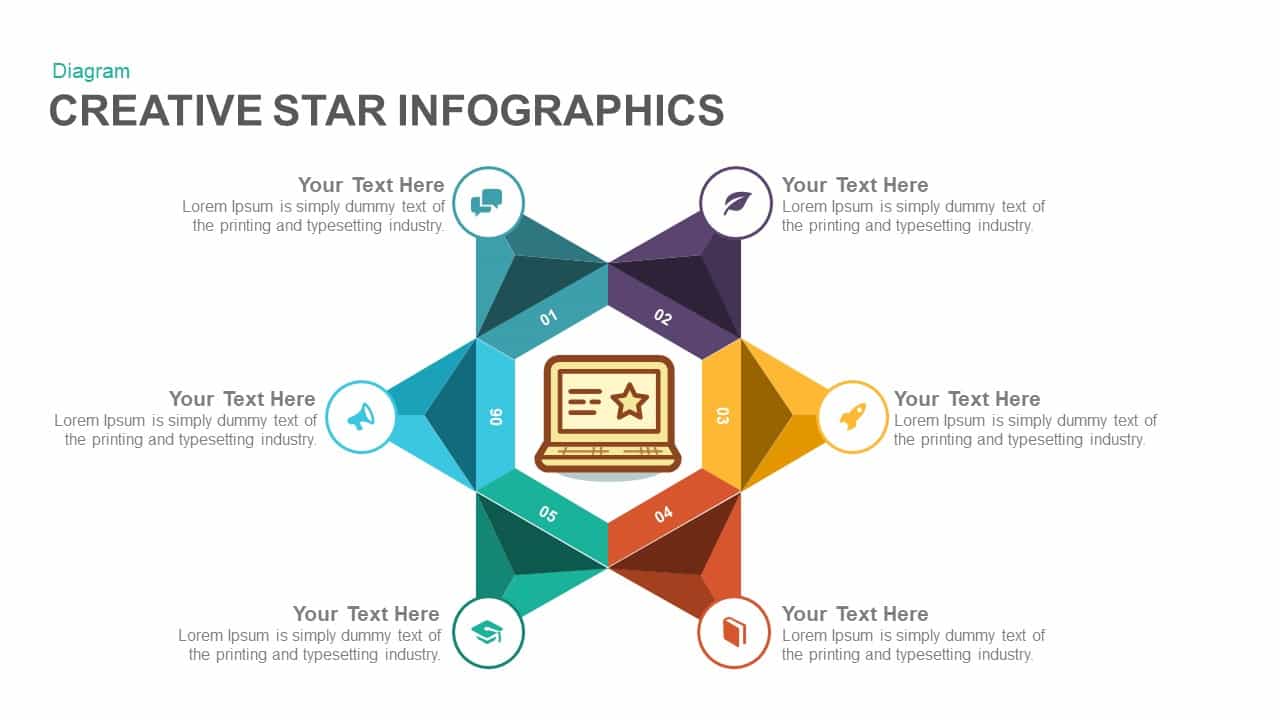
Six-Section Star Infographic Diagram Template for PowerPoint & Google Slides
Circular
Four Section Circular Text Boxes Diagram Template for PowerPoint & Google Slides
Circular

Professional Four-Section Layer Diagram Template for PowerPoint & Google Slides
Process
Ten-Section Project Steps Diagram Template for PowerPoint & Google Slides
Process
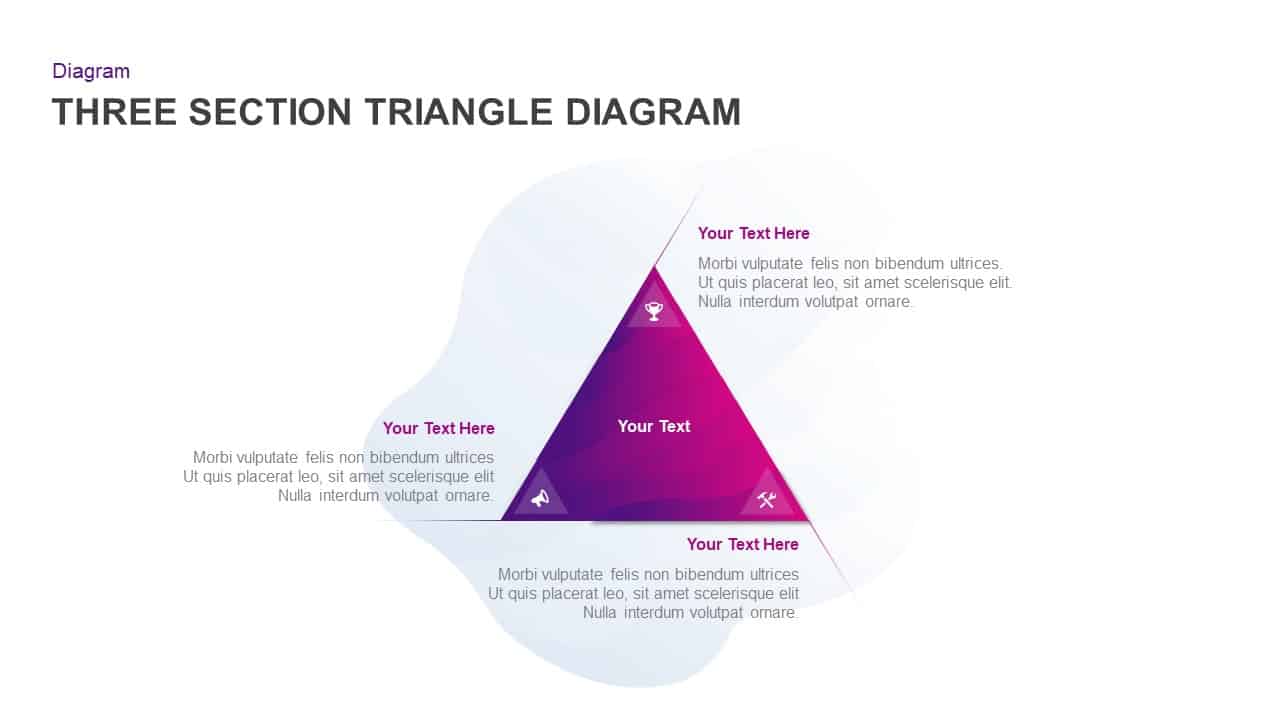
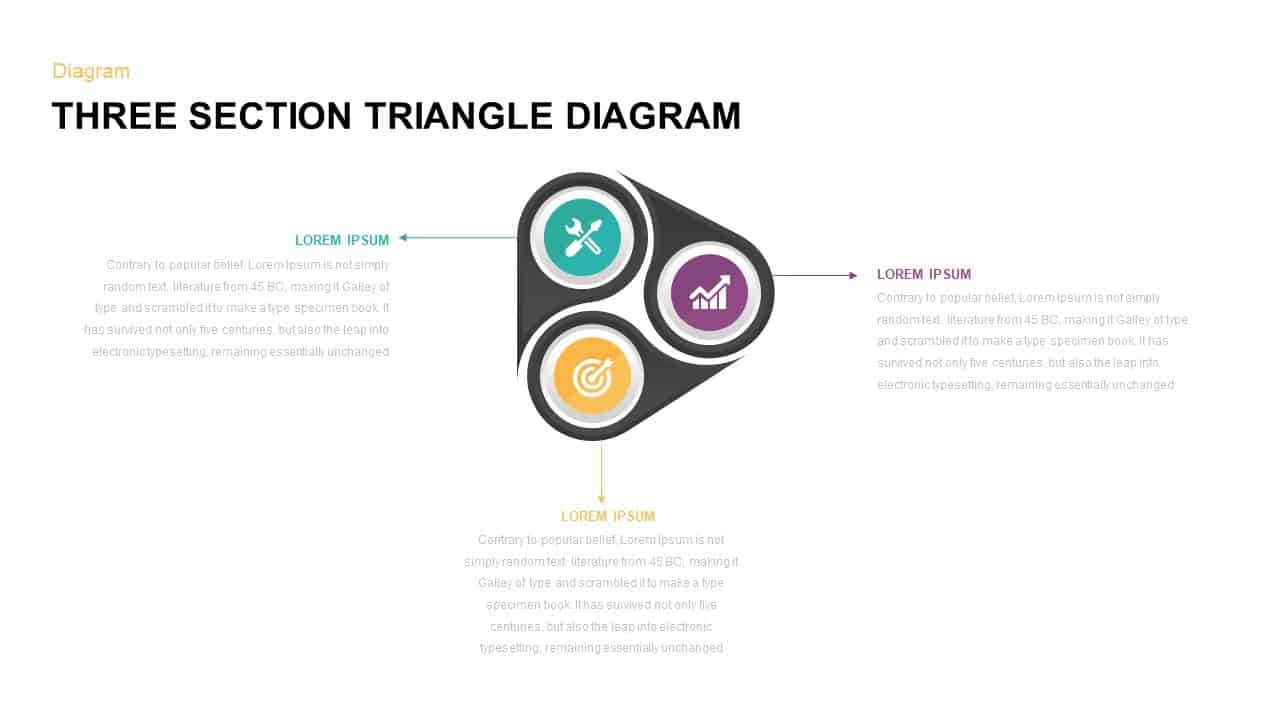
Three Section Triangle Diagram Template for PowerPoint & Google Slides
Process
Three-Section Triangle Diagram Template for PowerPoint & Google Slides
Pyramid
Three Section Triangle Diagram Template for PowerPoint & Google Slides
Process
Four Section Diagram Infographics template for PowerPoint & Google Slides
Process

Four Section Infographic Diagram Template for PowerPoint & Google Slides
Circular
3 Section Infographic Diagram Template for PowerPoint & Google Slides
Process
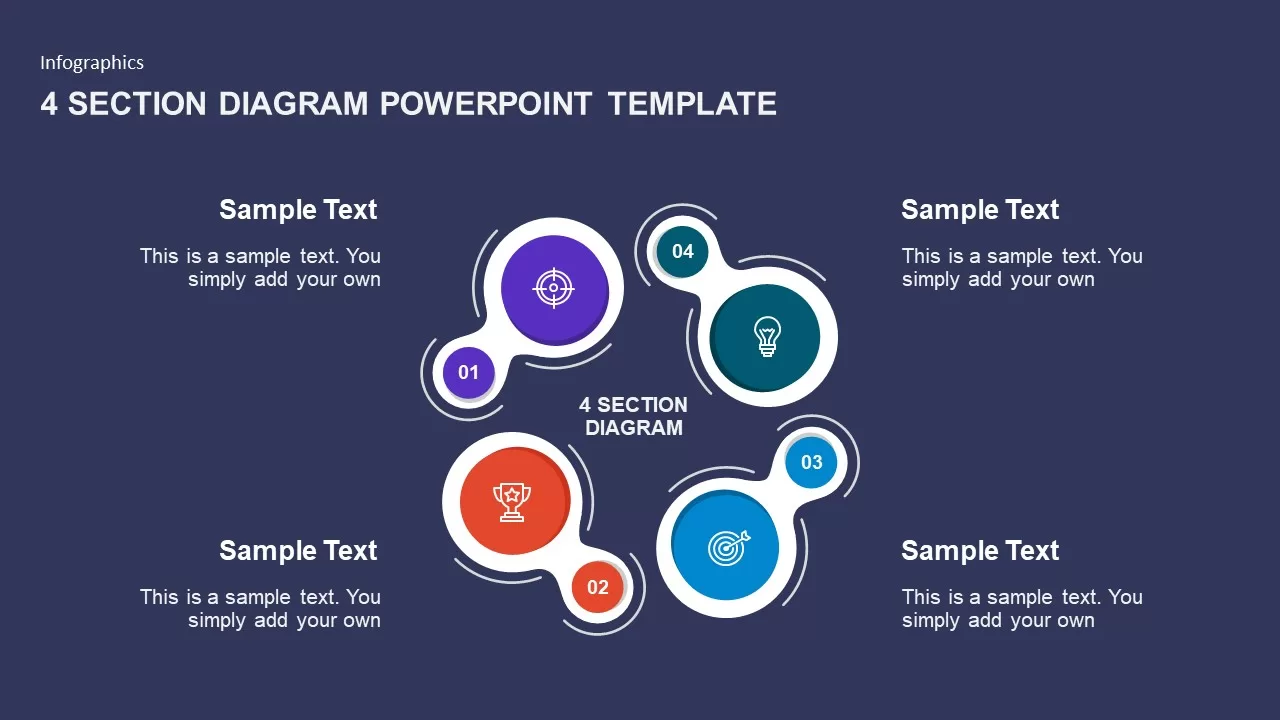
4 Section Diagram template for PowerPoint & Google Slides
Infographics
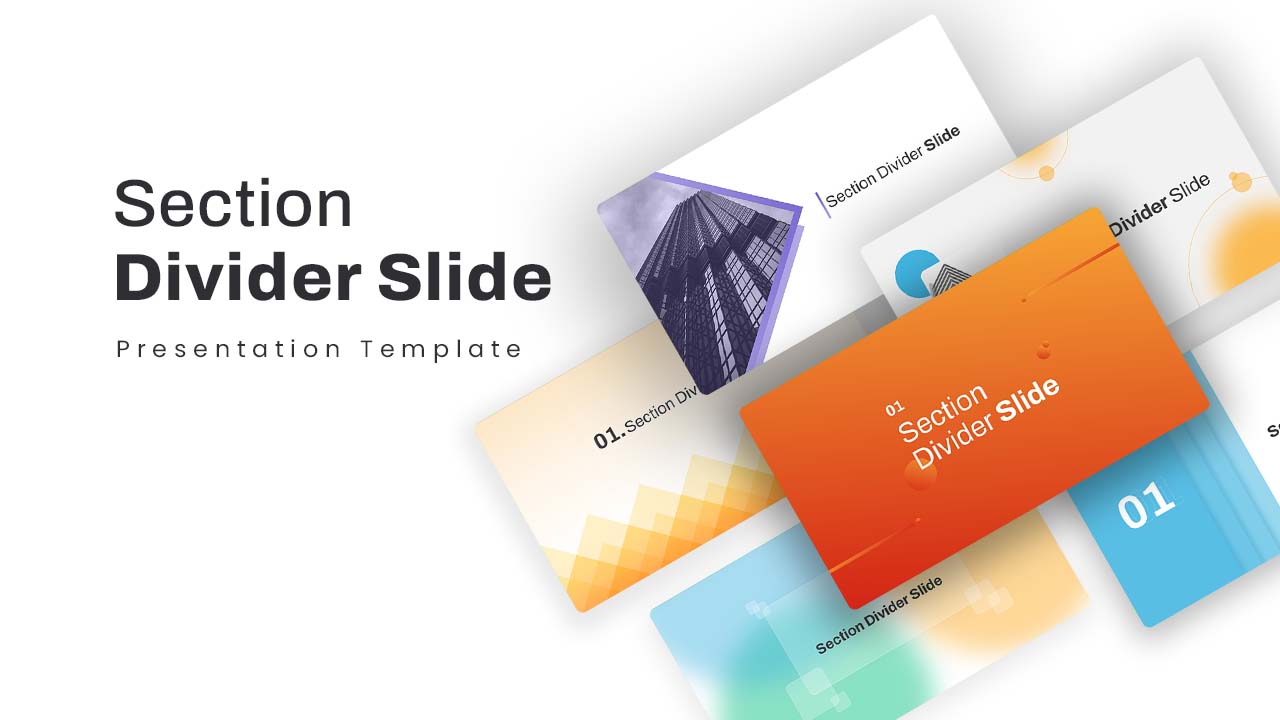
Creative Section Divider Slides Template for PowerPoint & Google Slides
Decks
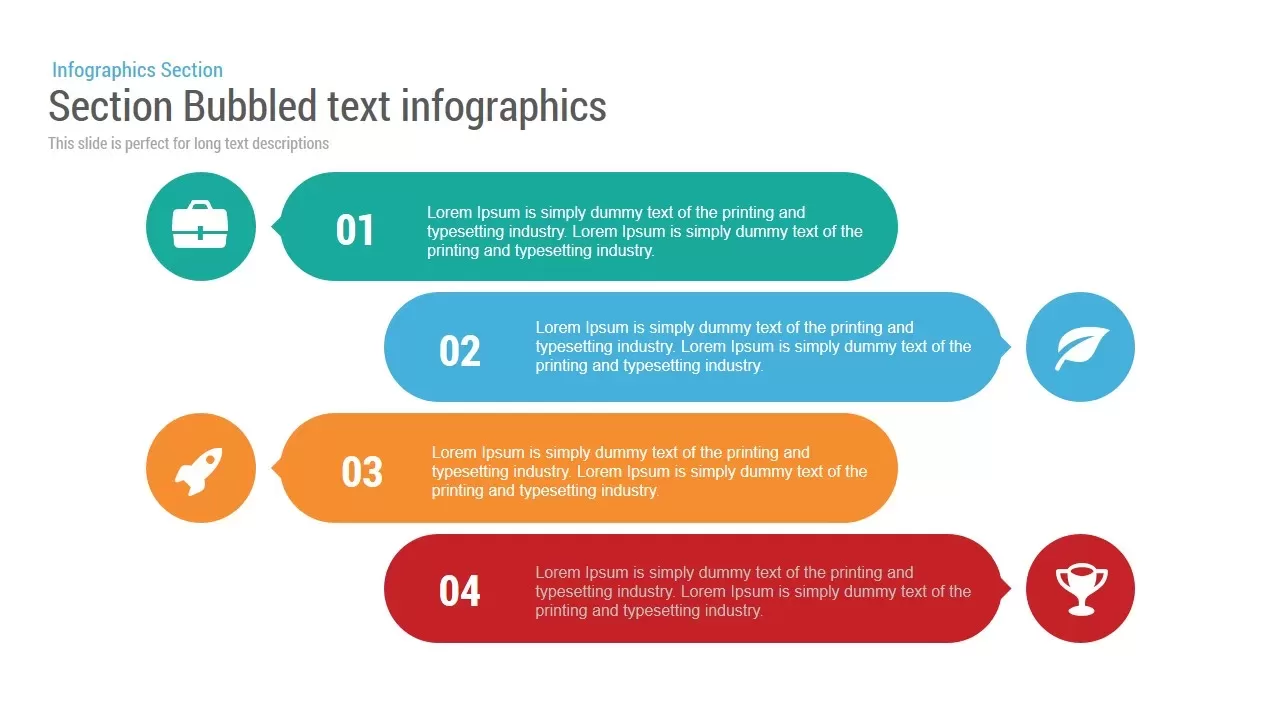
Section Bubbled Text template for PowerPoint & Google Slides
Infographics
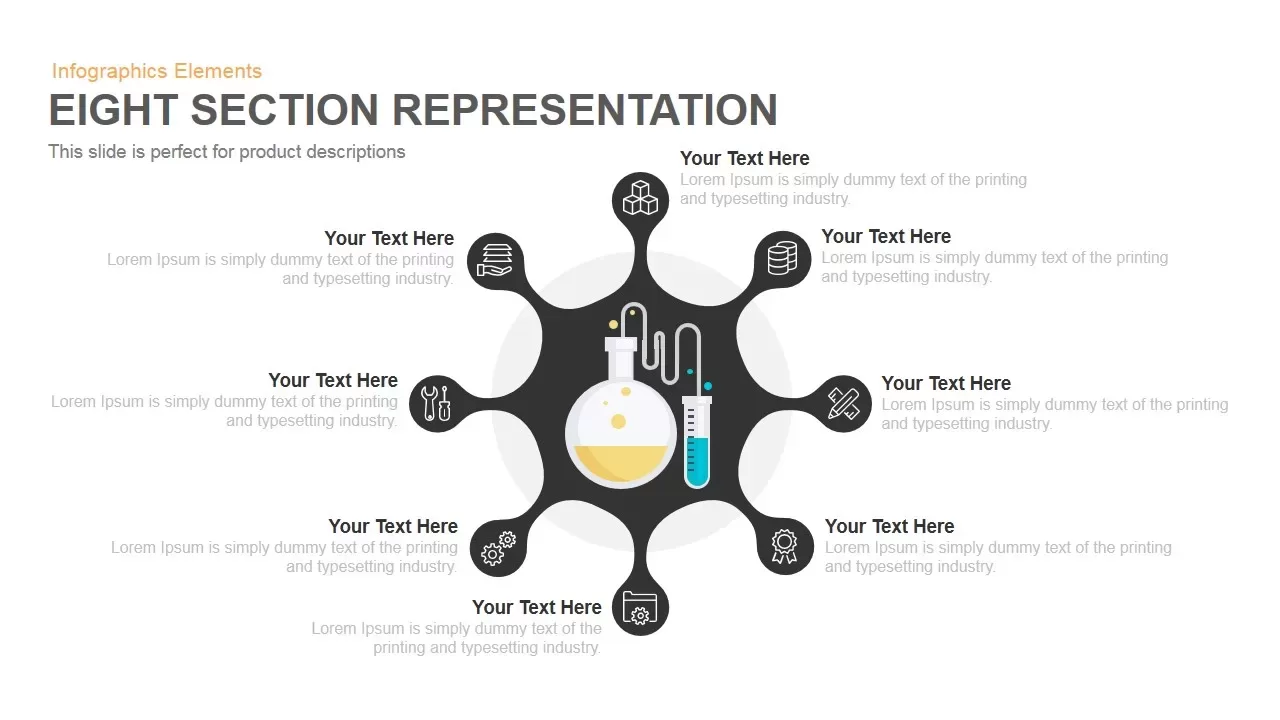
Eight Section Lab Infographic with Icons Template for PowerPoint & Google Slides
Circular
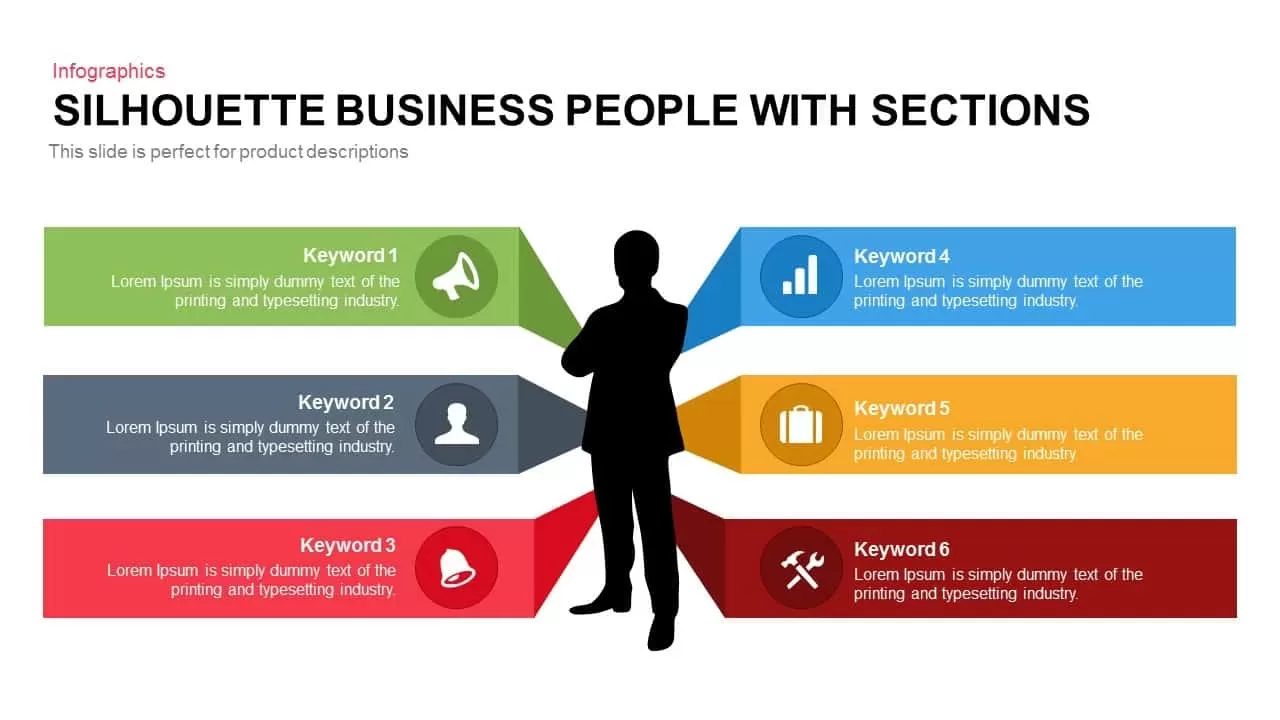
6-Section Silhouette template for PowerPoint & Google Slides
Arrow
Icon Section Flow template for PowerPoint & Google Slides
Process
Modern Ten-Block Section Title Chart template for PowerPoint & Google Slides
Comparison
Curved Five-Section Timeline Infographic template for PowerPoint & Google Slides
Timeline

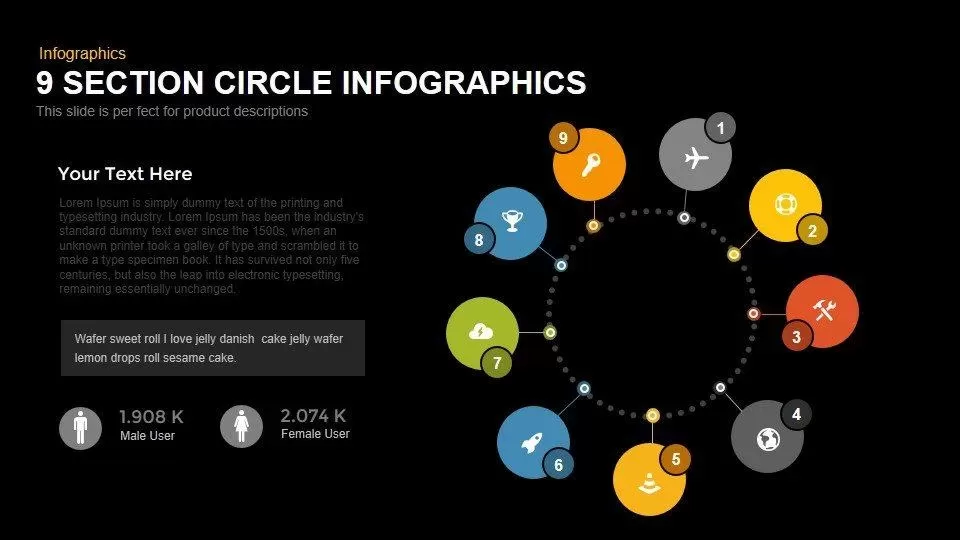
Modern 9-Section Circle Infographics Template for PowerPoint & Google Slides
Circular
Eight Section Donut Chart Infographic Template for PowerPoint & Google Slides
Pie/Donut
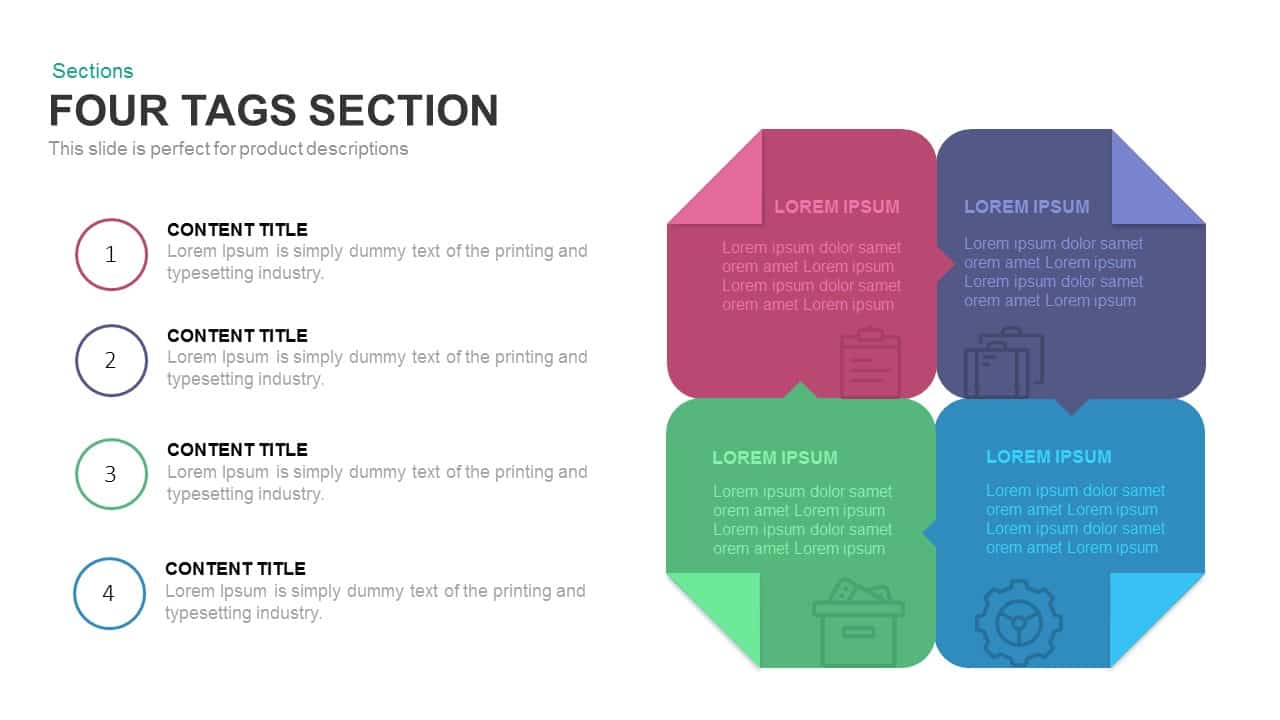
Four-Tag Section Ribbon Infographic Template for PowerPoint & Google Slides
Comparison
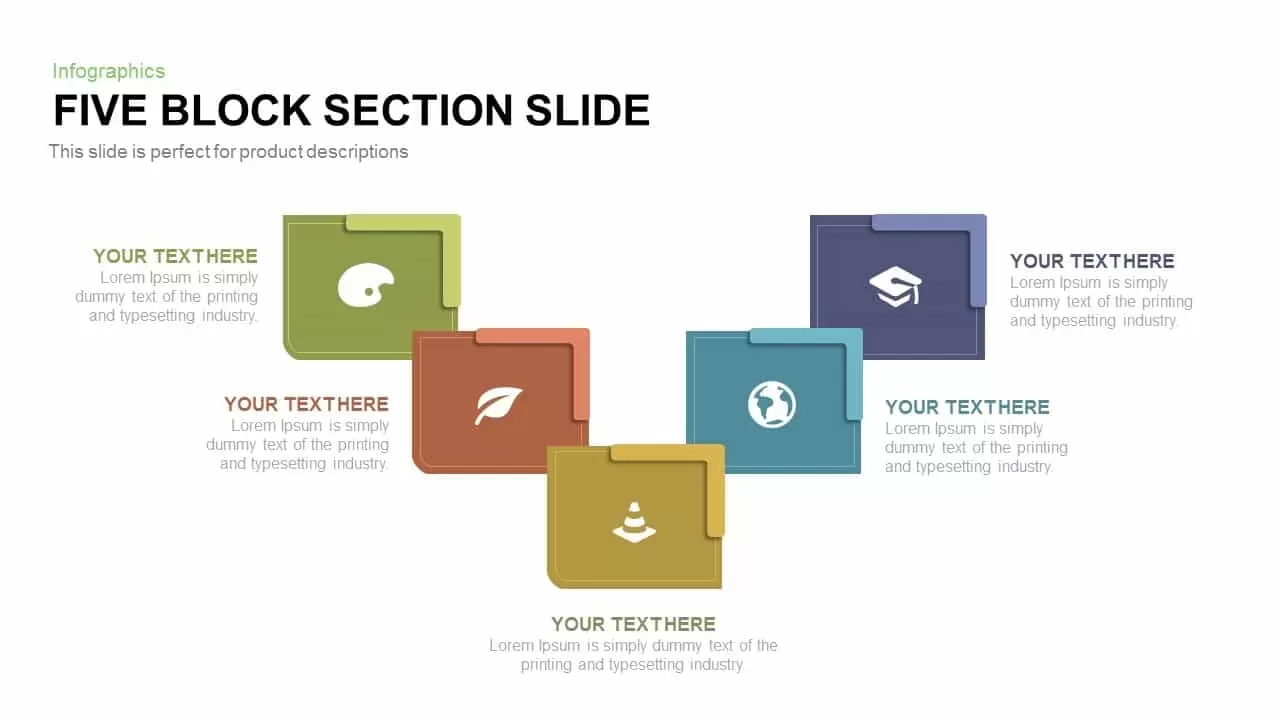
Five-Block Section Feature Highlights Template for PowerPoint & Google Slides
Comparison
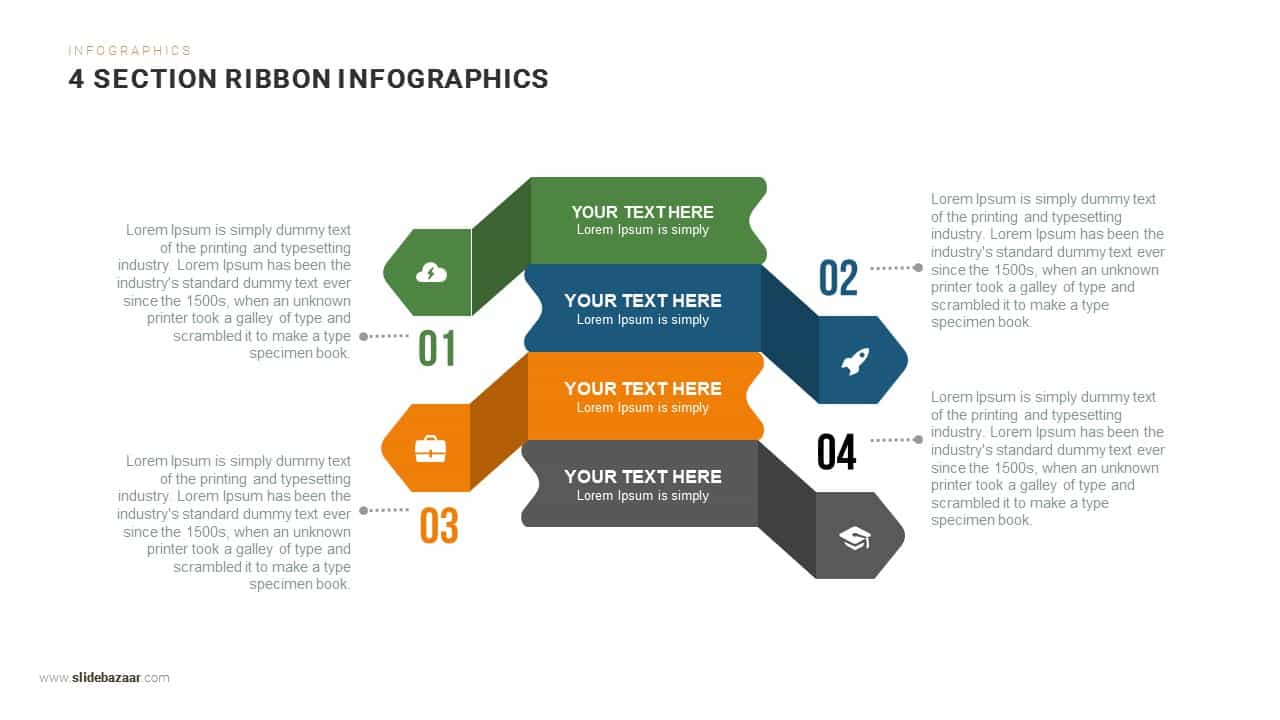
Four-Section Ribbon Infographics Template for PowerPoint & Google Slides
Process
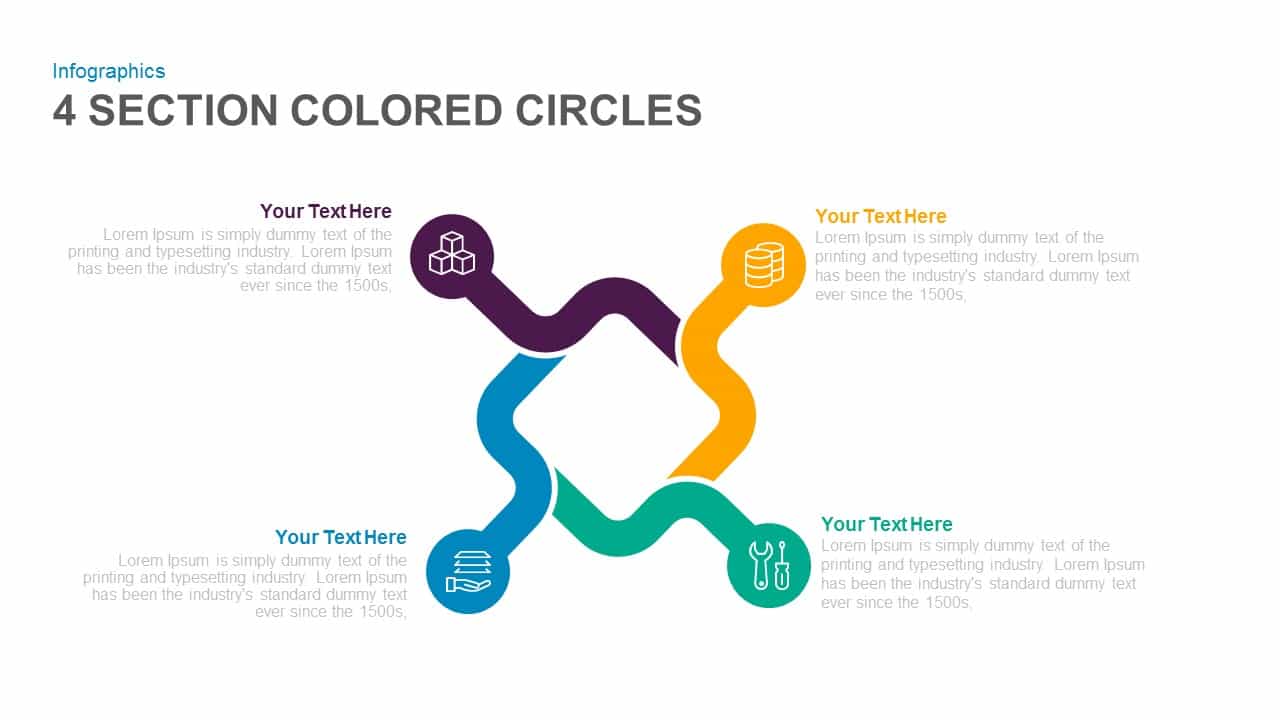
Four-Section Colored Circle Infographic Template for PowerPoint & Google Slides
Circular
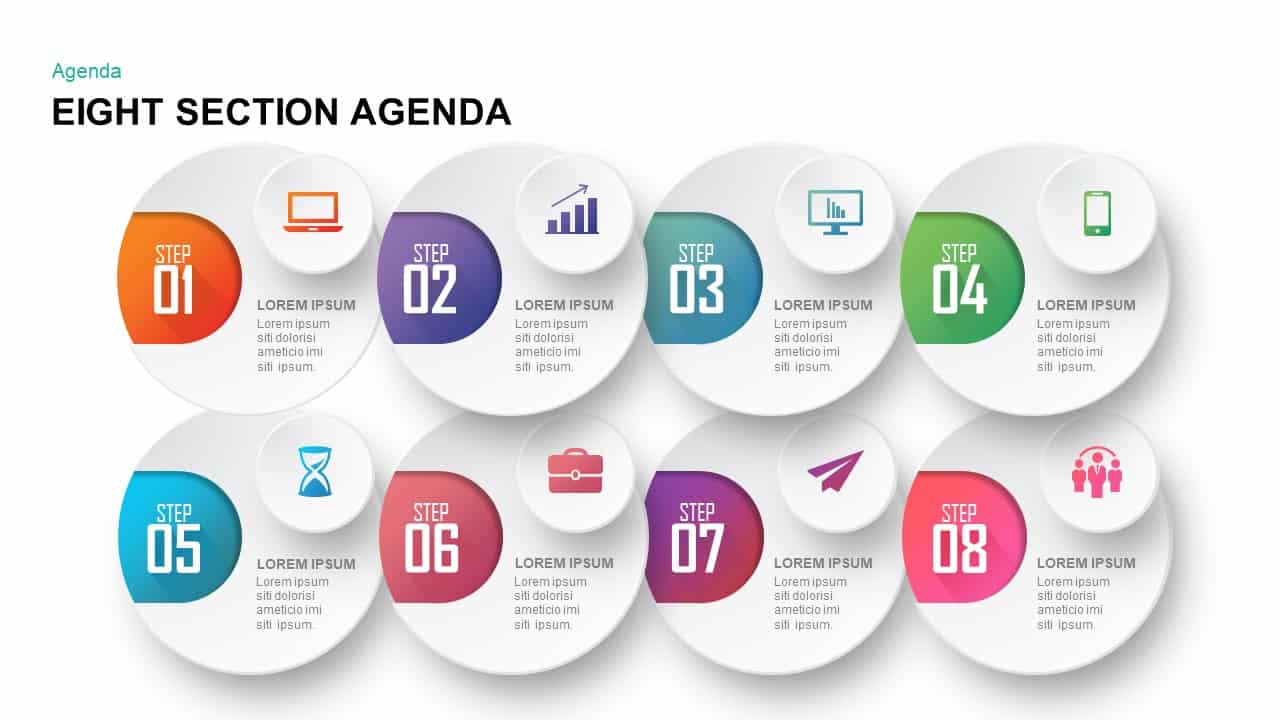
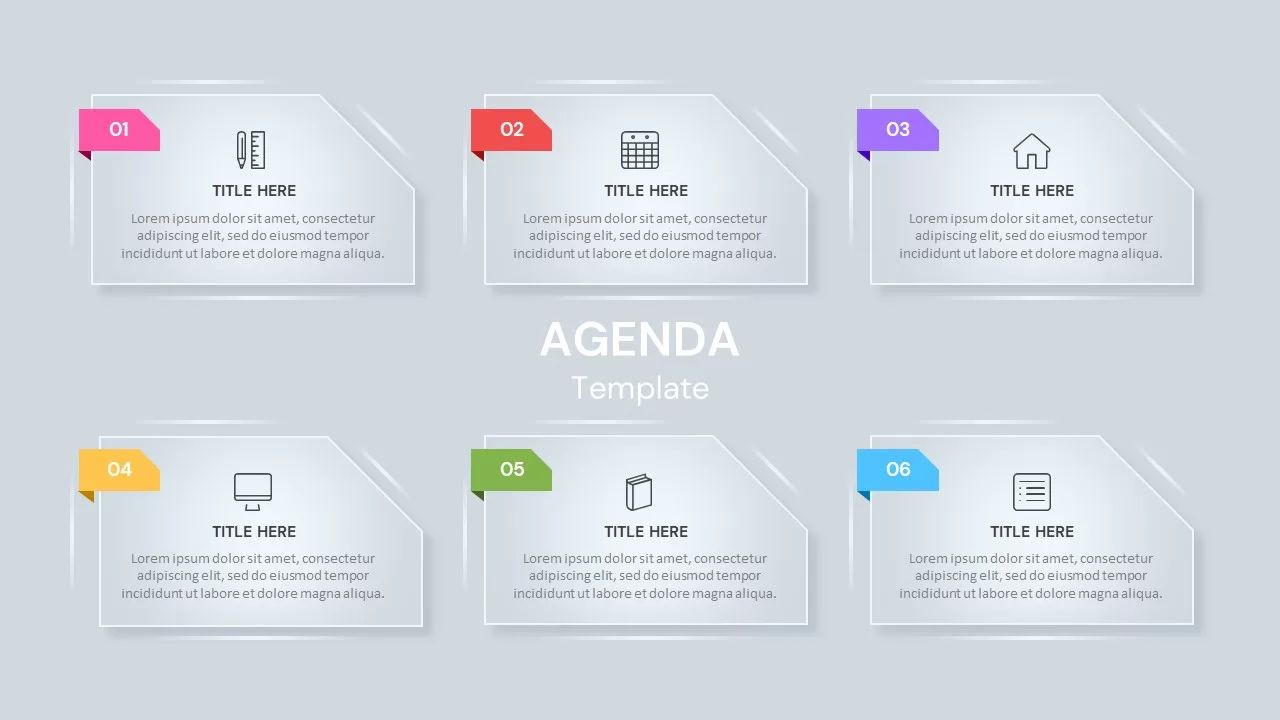
Eight Section Agenda Slide Layout Template for PowerPoint & Google Slides
Agenda
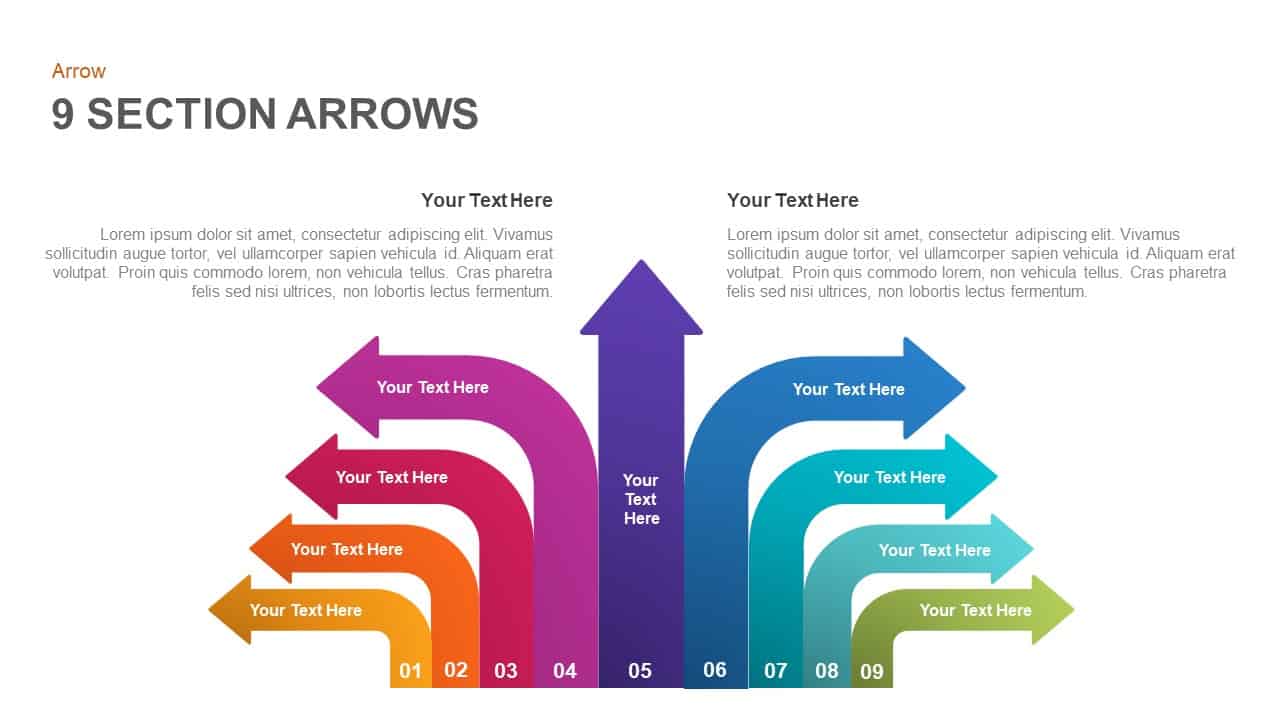
9-Section Diverging Arrows Infographic Template for PowerPoint & Google Slides
Arrow
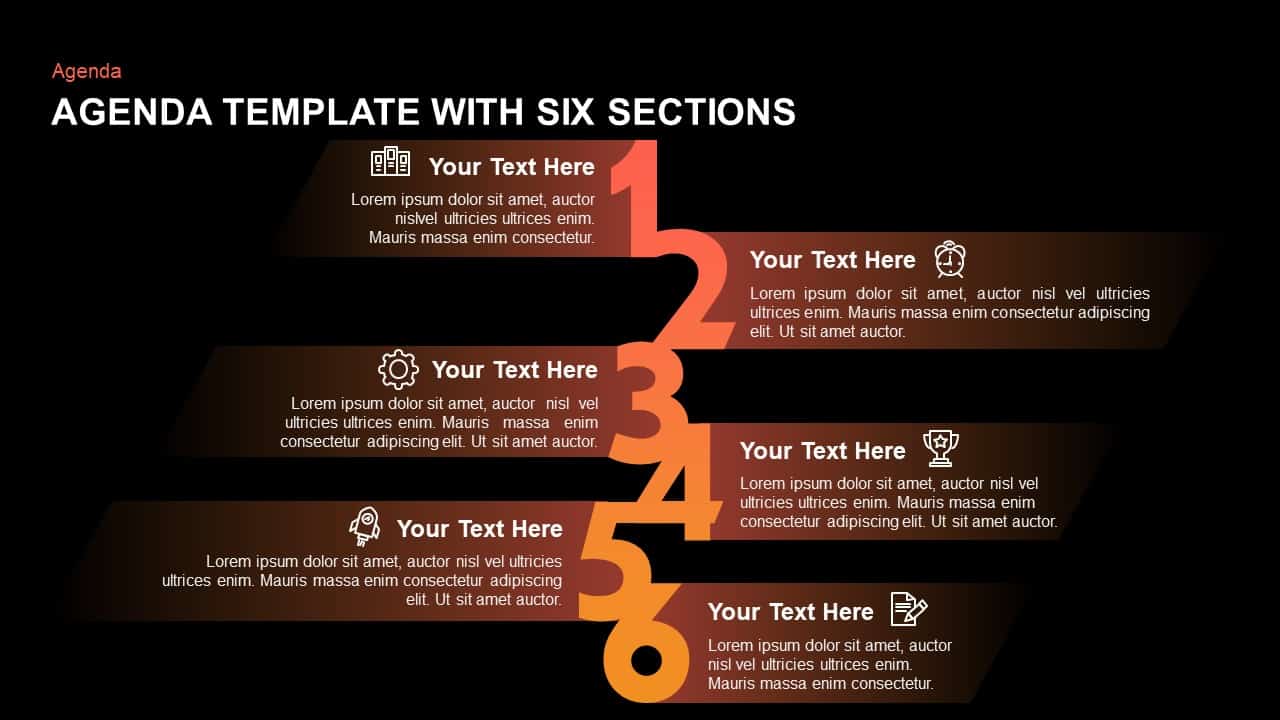
Six-Section Professional Agenda Template for PowerPoint & Google Slides
Agenda
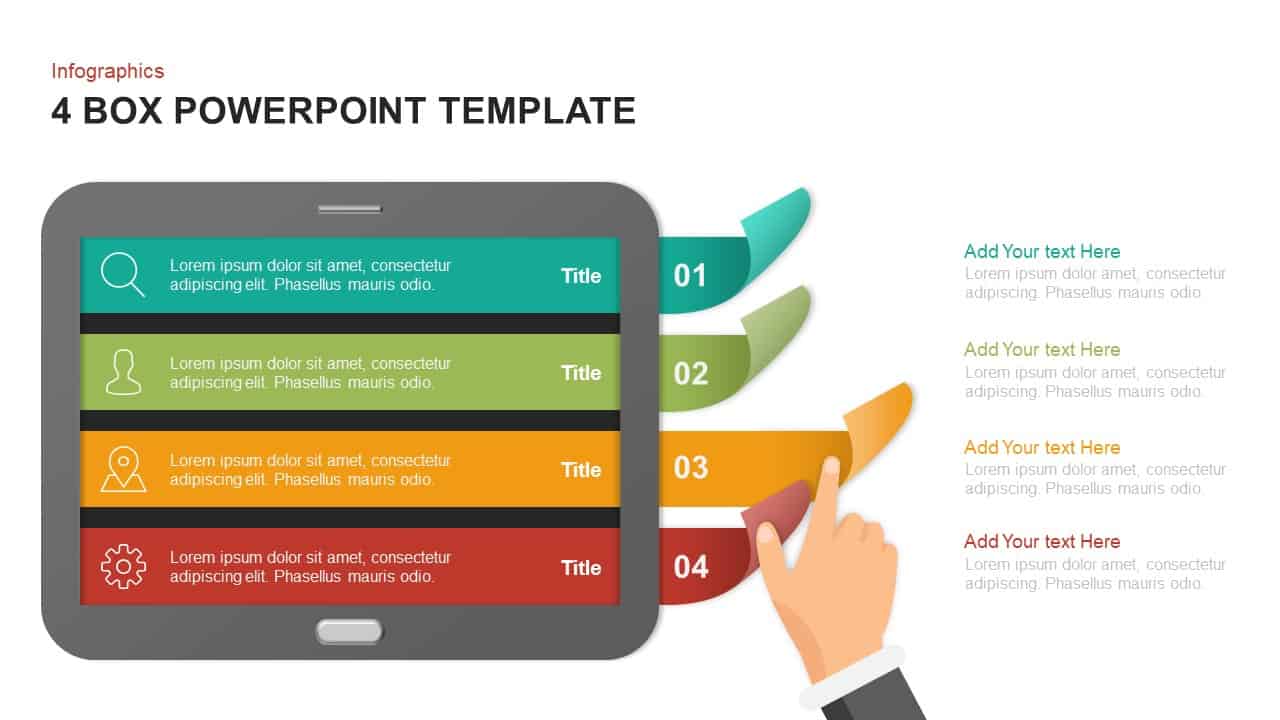
Tablet Four-Section Menu Interface Template for PowerPoint & Google Slides
Agenda
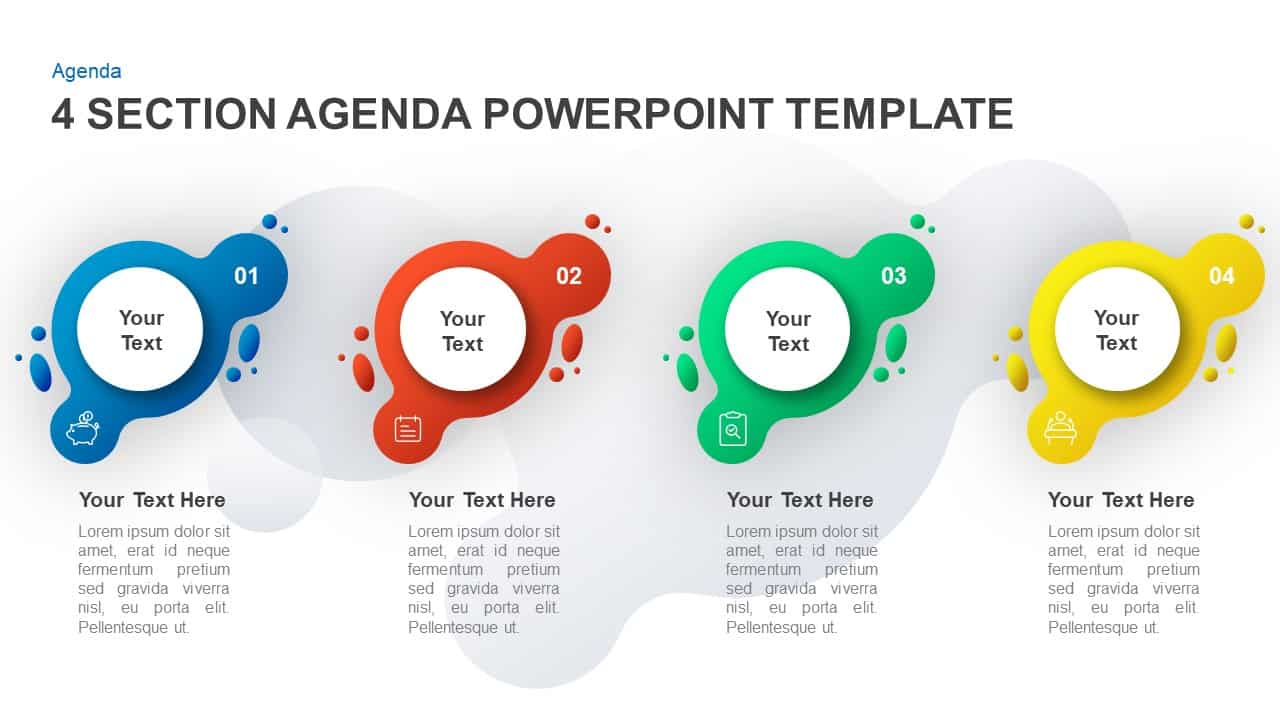
4-Section Agenda Blobs Infographic Template for PowerPoint & Google Slides
Agenda
Six-Section Color-Coded Agenda Template for PowerPoint & Google Slides
Agenda
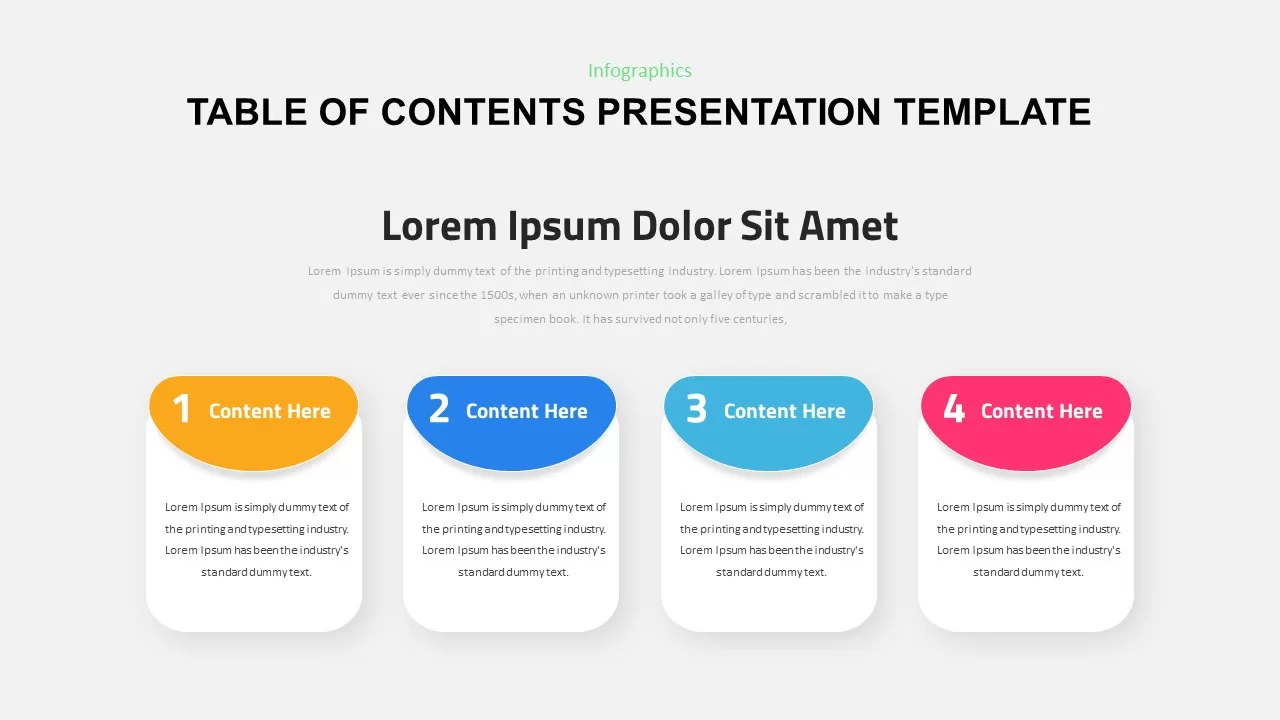
Four-Section Table of Contents Template for PowerPoint & Google Slides
Agenda
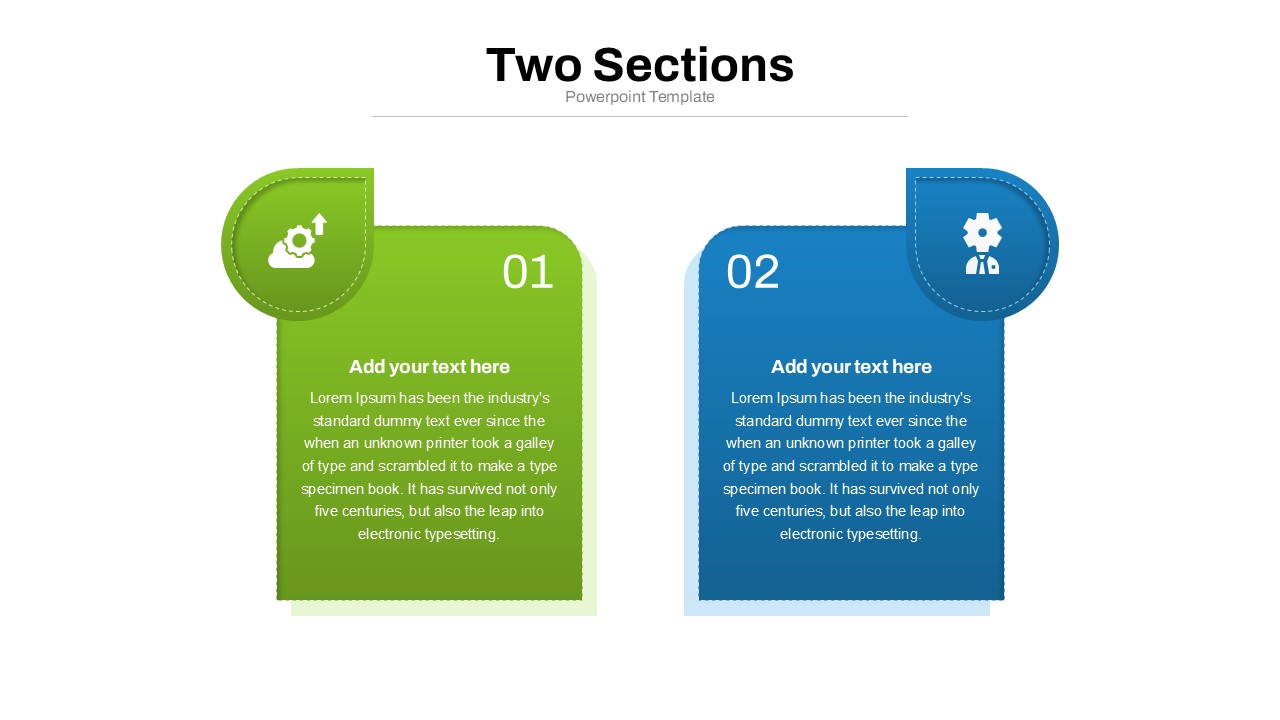
Two Section Comparison template for PowerPoint & Google Slides
Business Proposal
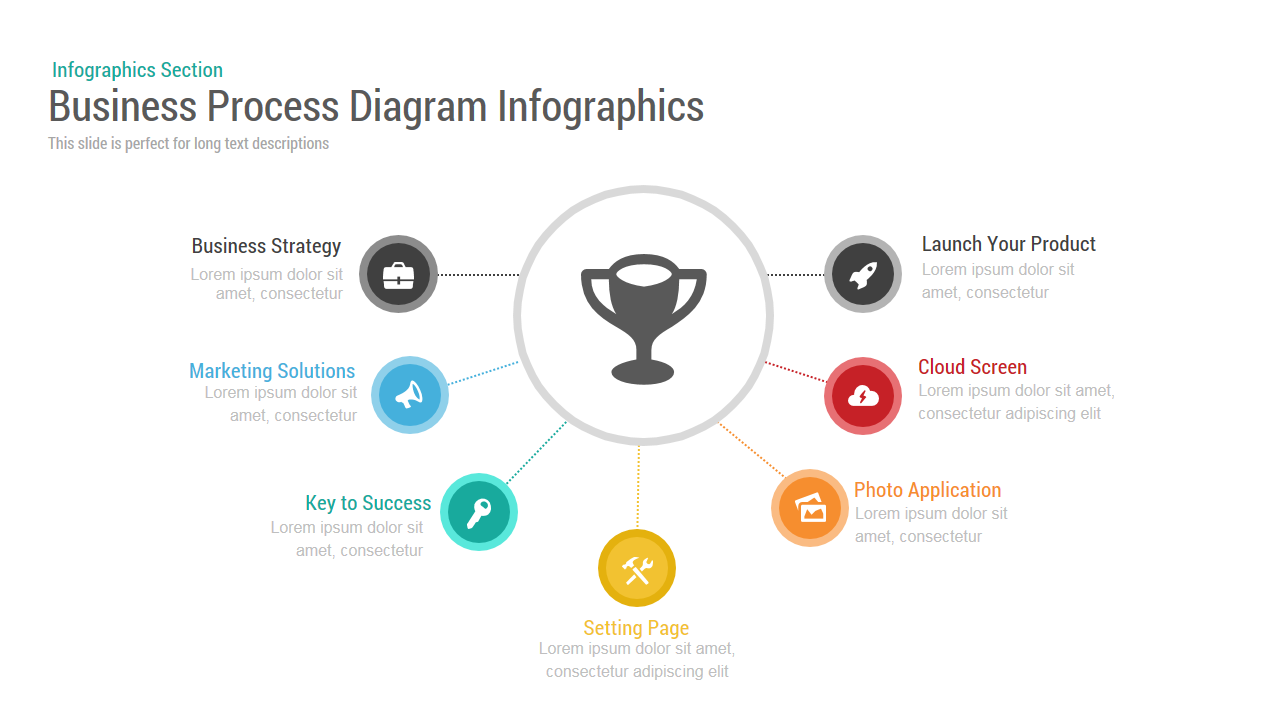
Business Process Diagram template for PowerPoint & Google Slides
Process
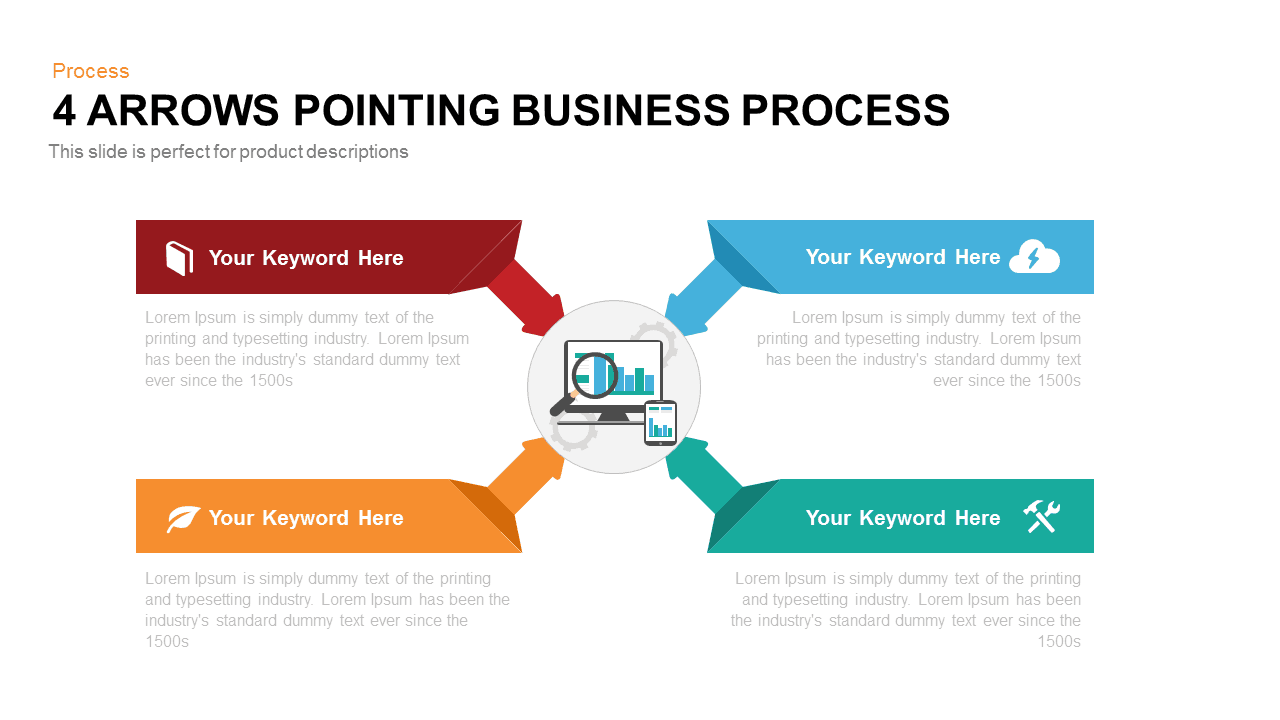
Four Arrows Business Process Diagram template for PowerPoint & Google Slides
Process
Vertical Business Process Flow Diagram Template for PowerPoint & Google Slides
Process
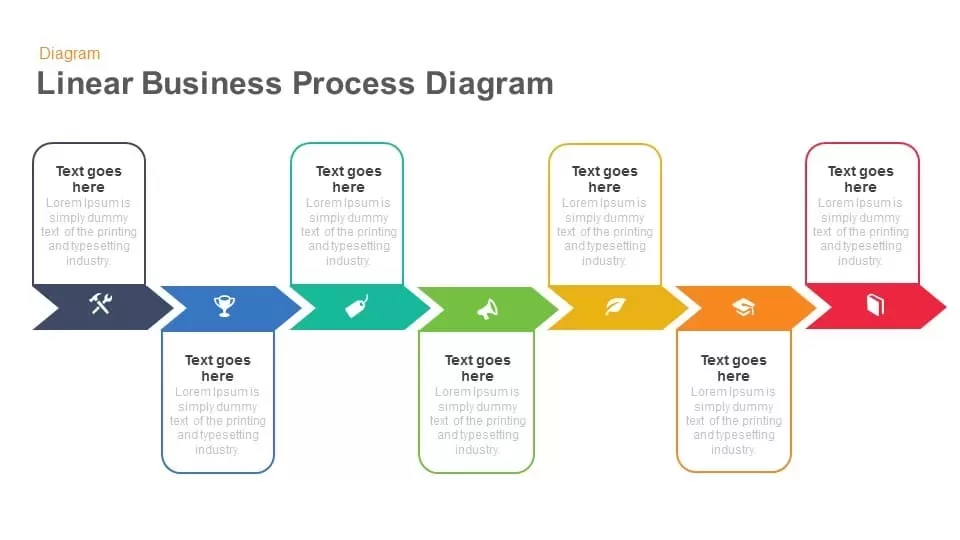
Linear Business Process Diagram template for PowerPoint & Google Slides
Process
10 Stages Business Flow Process Diagram template for PowerPoint & Google Slides
Business
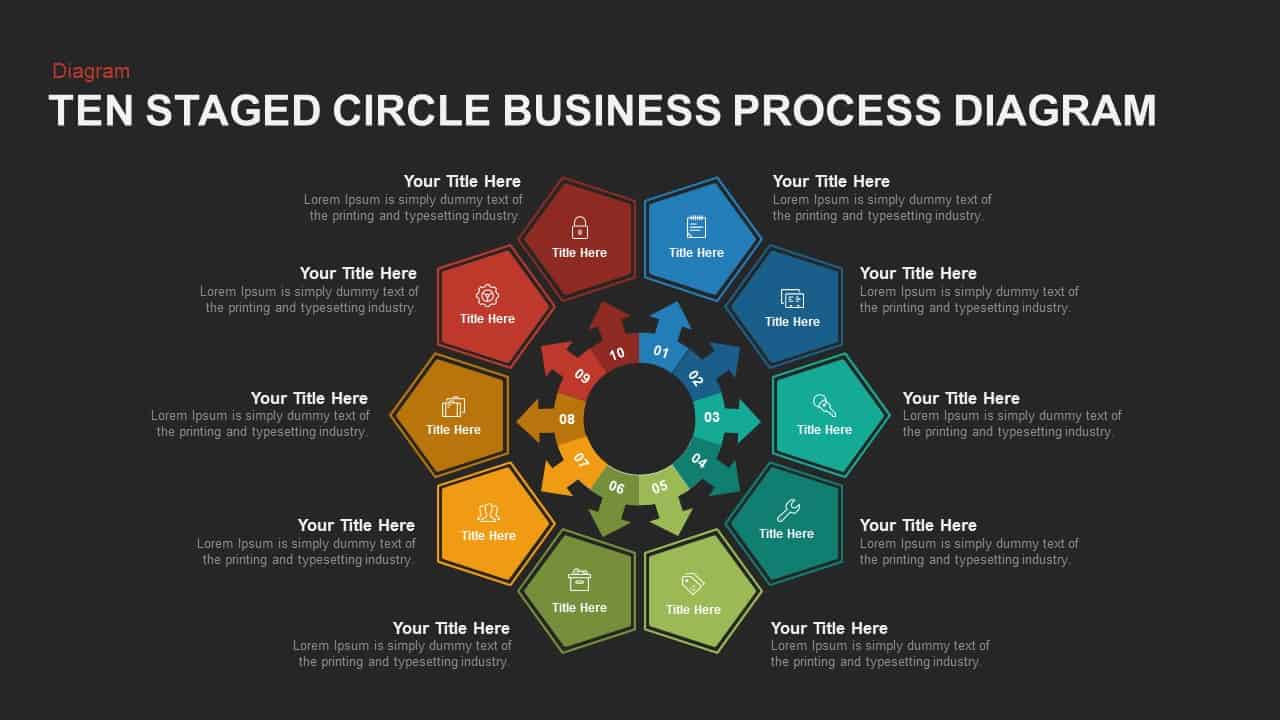
Ten-Stage Business Process Diagram Template for PowerPoint & Google Slides
Process
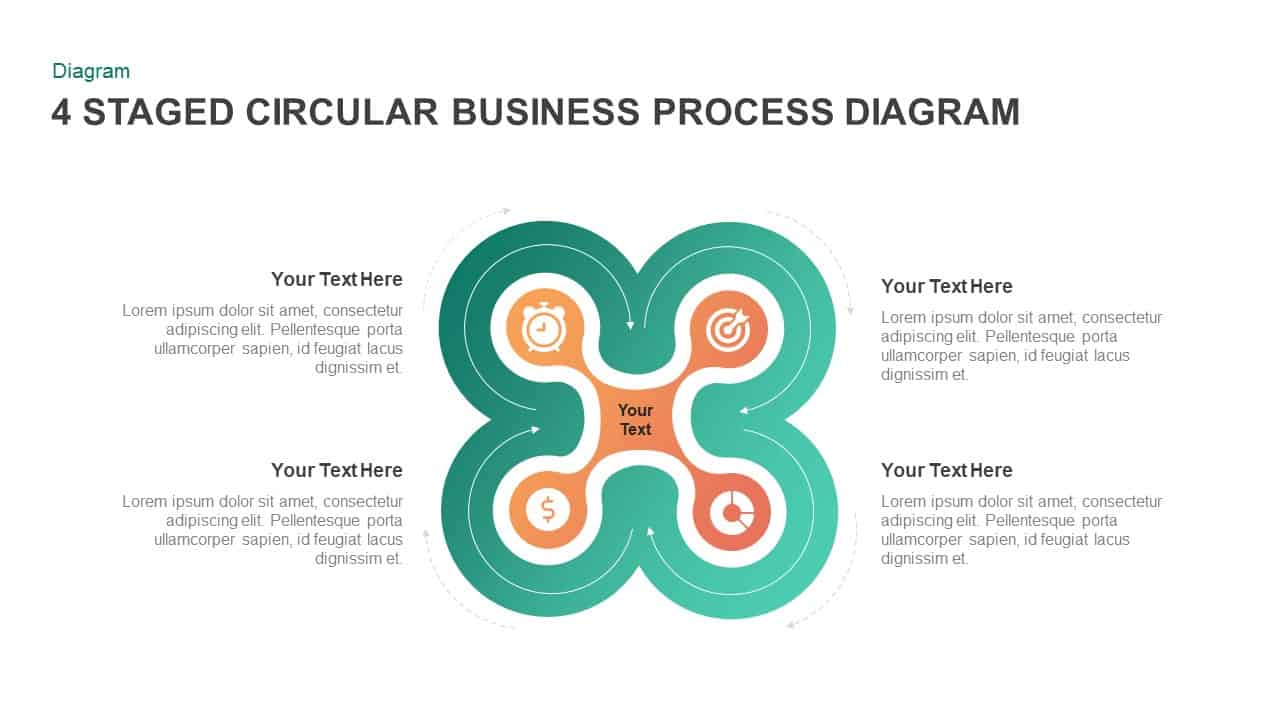
4 Staged Circular Business Process Diagram template for PowerPoint & Google Slides
Process

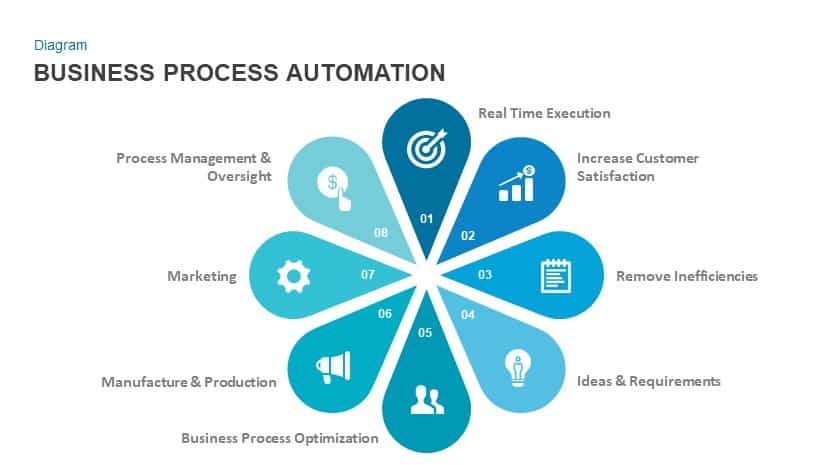
Business Process Automation Diagram Template for PowerPoint & Google Slides
Process
6-Step Business Process Flow Diagram Template for PowerPoint & Google Slides
Process
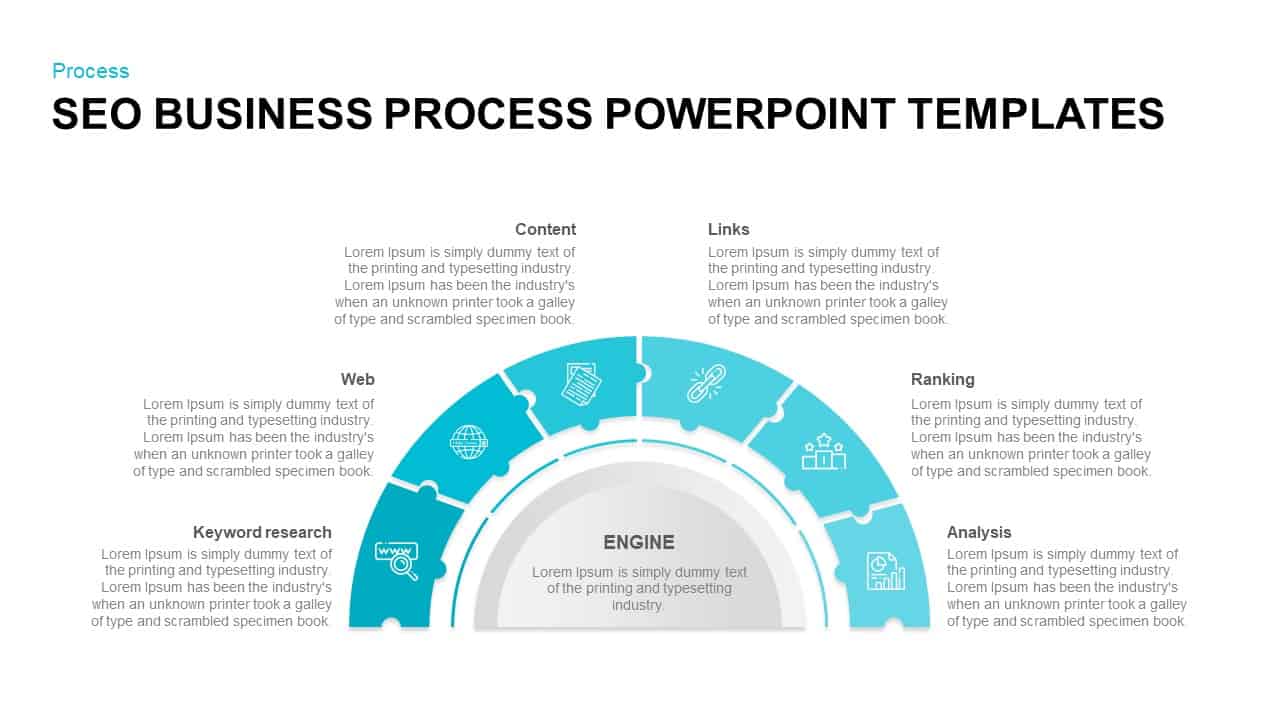
SEO Business Process Puzzle Diagram Template for PowerPoint & Google Slides
Process
Business Process Management Flow Diagram Template for PowerPoint & Google Slides
Process
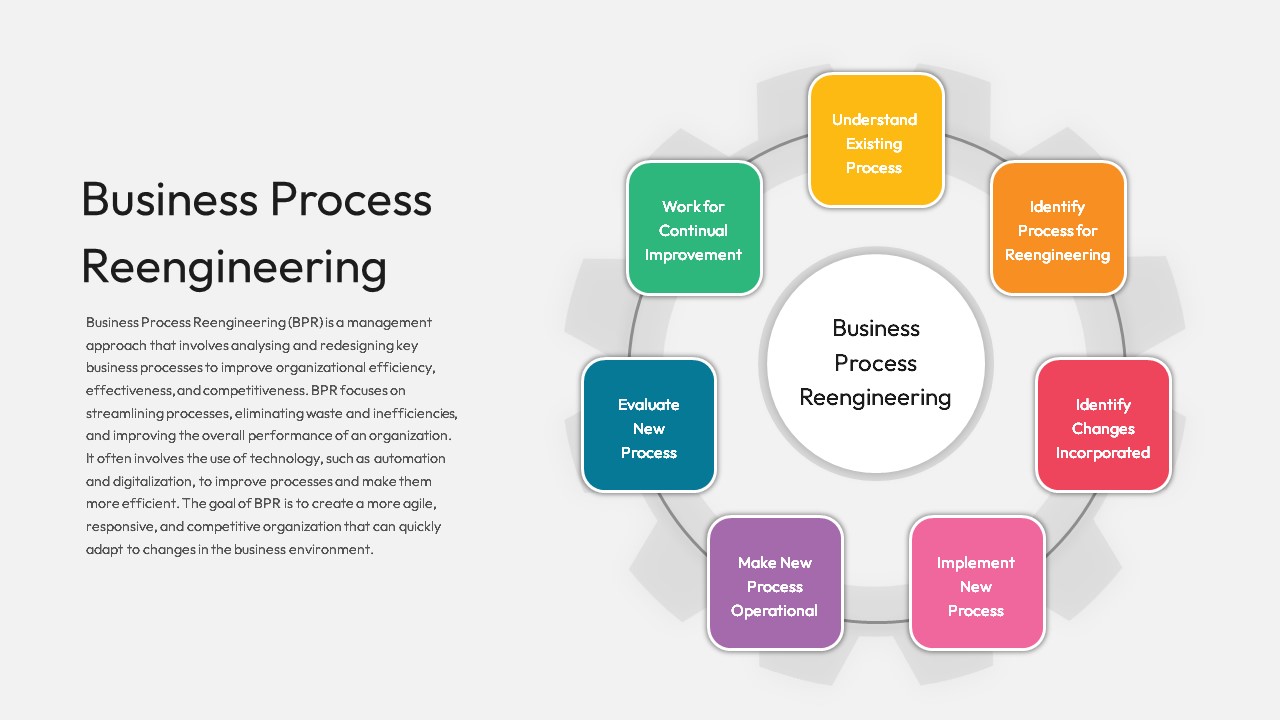
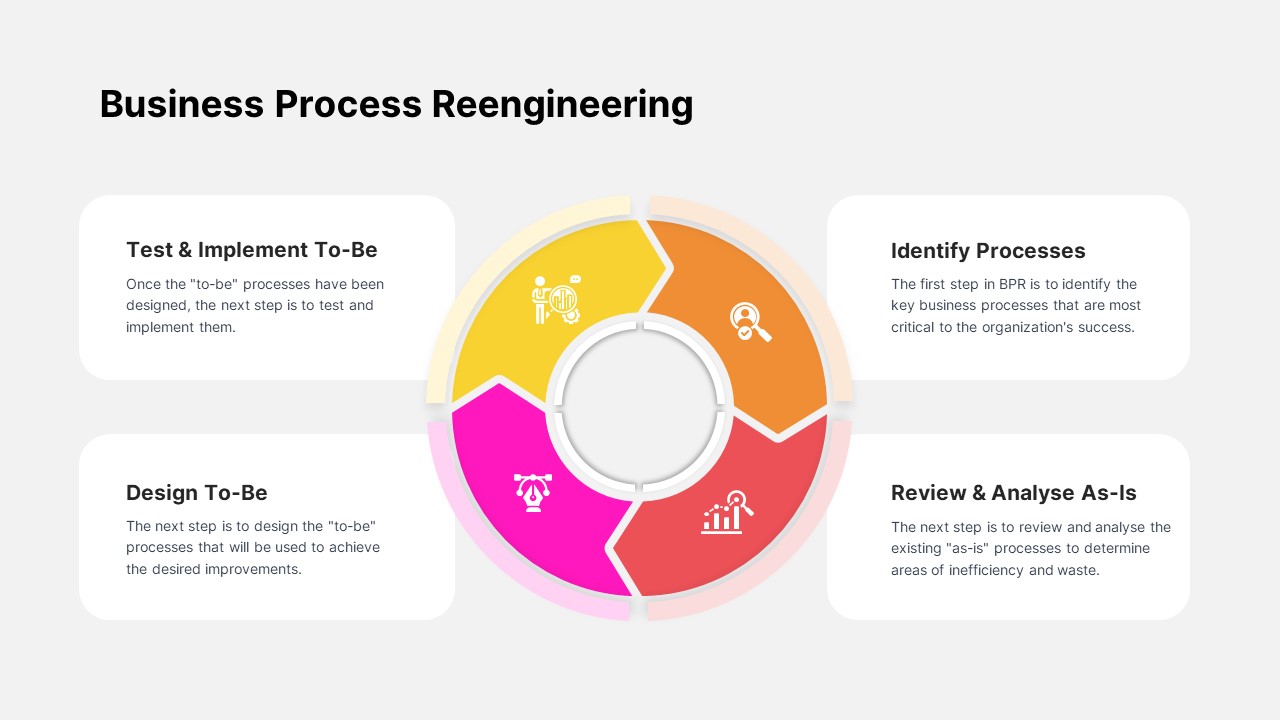
Business Process Reengineering Diagram Template for PowerPoint & Google Slides
Circular
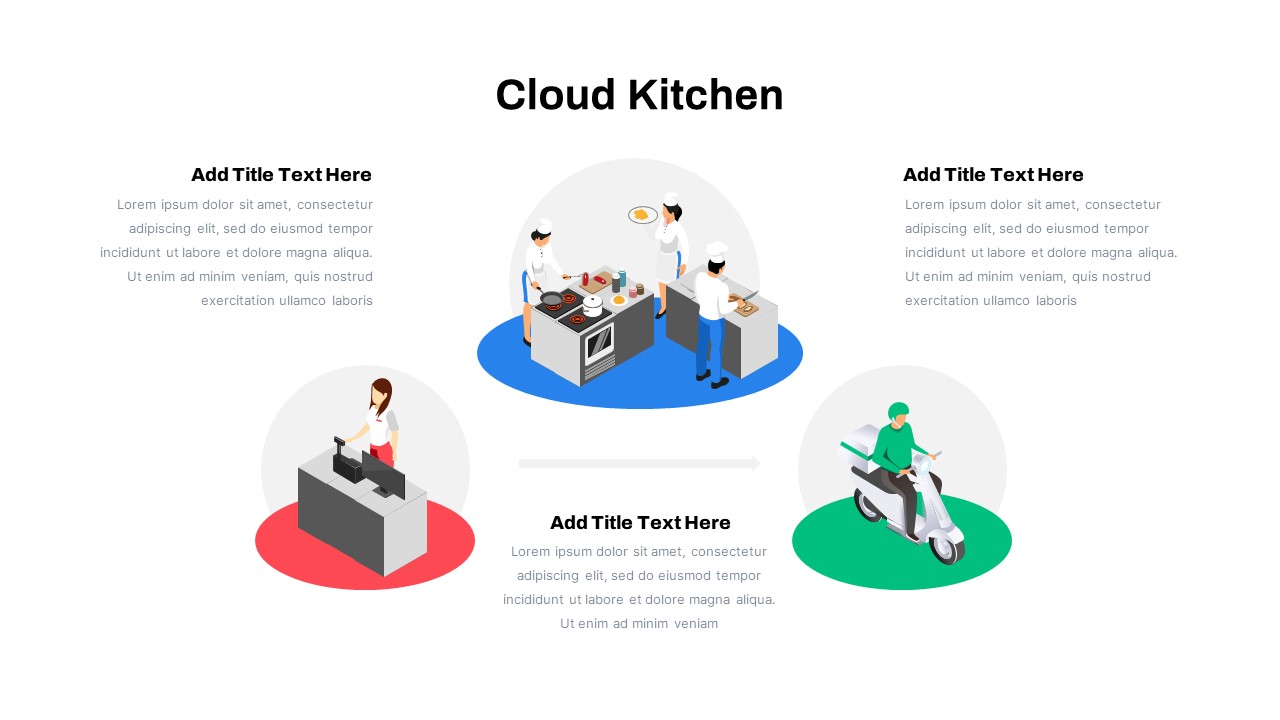
Cloud Kitchen Business Process Diagram Template for PowerPoint & Google Slides
Process
Business Process Analysis Cycle Diagram Template for PowerPoint & Google Slides
Business Strategy
4 Staged Circular Business Process Diagram for PowerPoint & Google Slides
Process
Business Services 4-Step Process Template for PowerPoint & Google Slides
Process
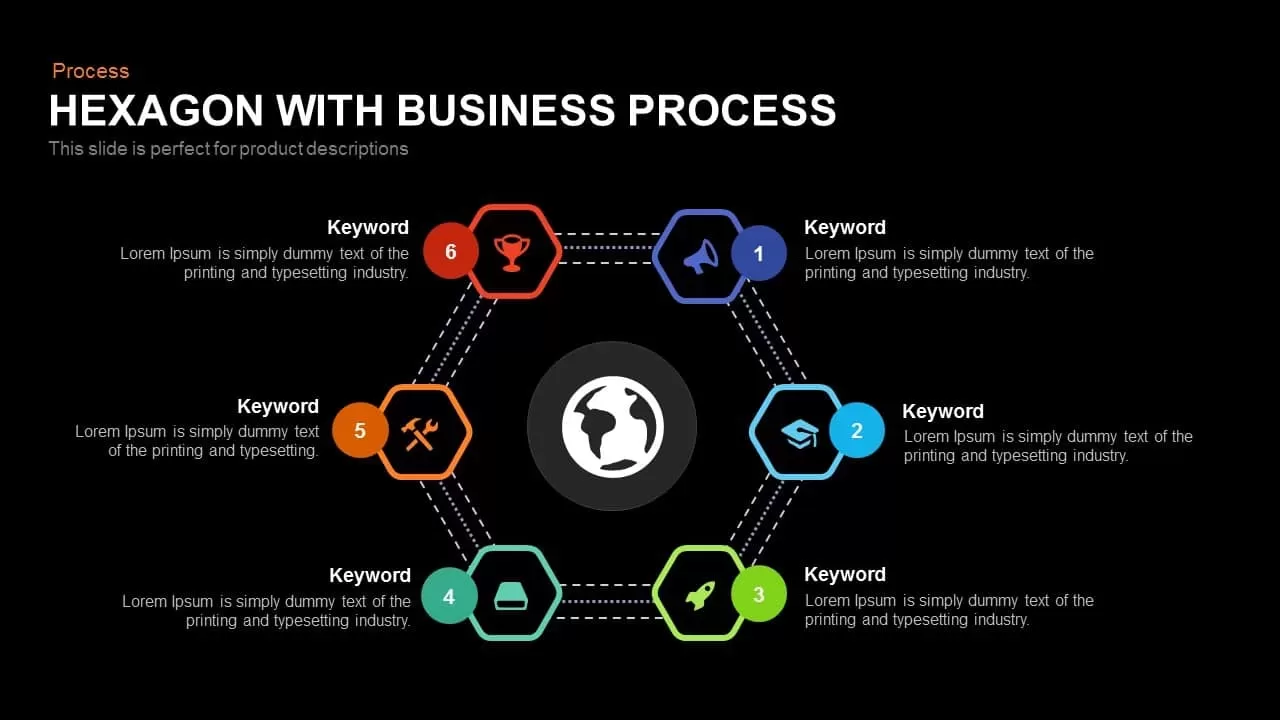
Global Hexagon Six-Step Business Process Template for PowerPoint & Google Slides
Process
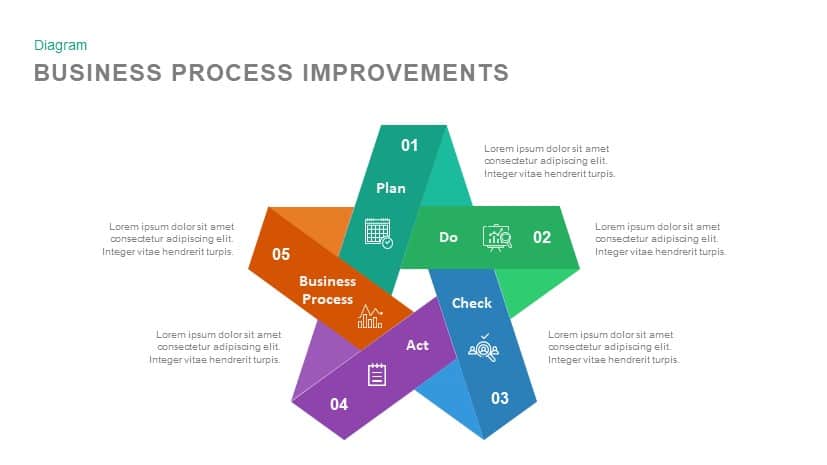
Business Process Improvements template for PowerPoint & Google Slides
Process
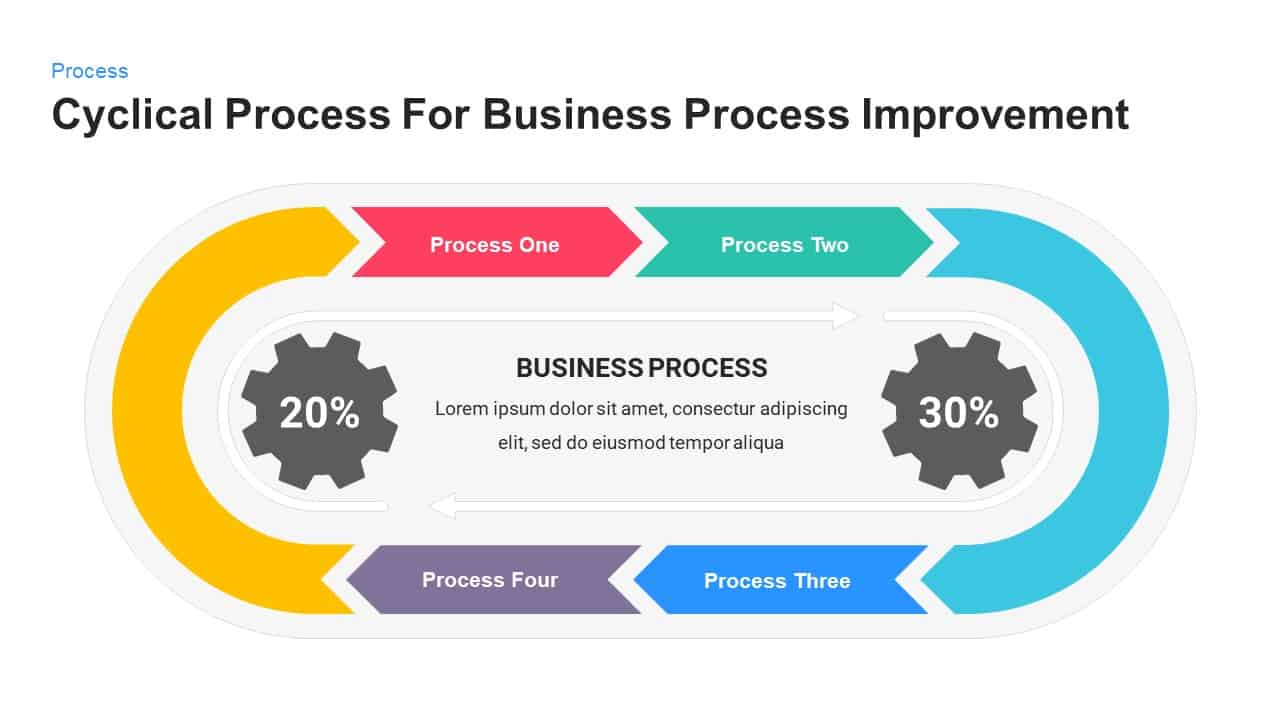
Business Process Improvement Cycle Template for PowerPoint & Google Slides
Process
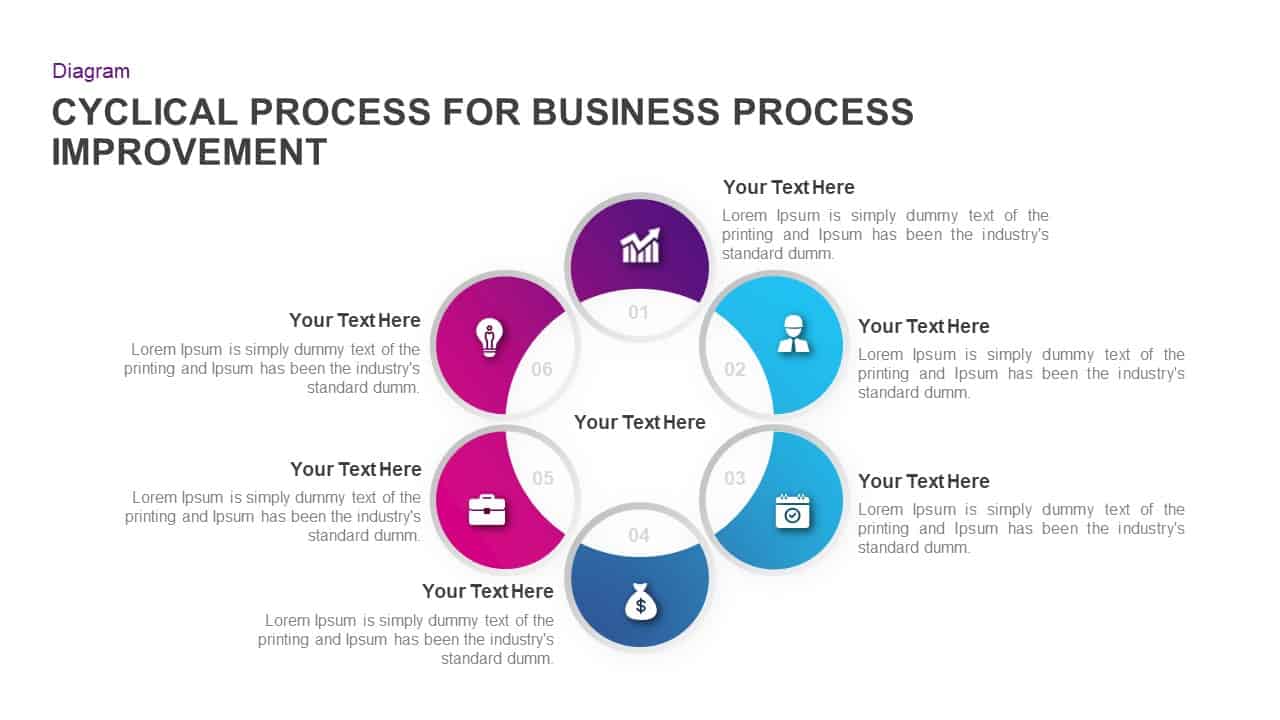
Business Process Improvement Cycle Template for PowerPoint & Google Slides
Circular
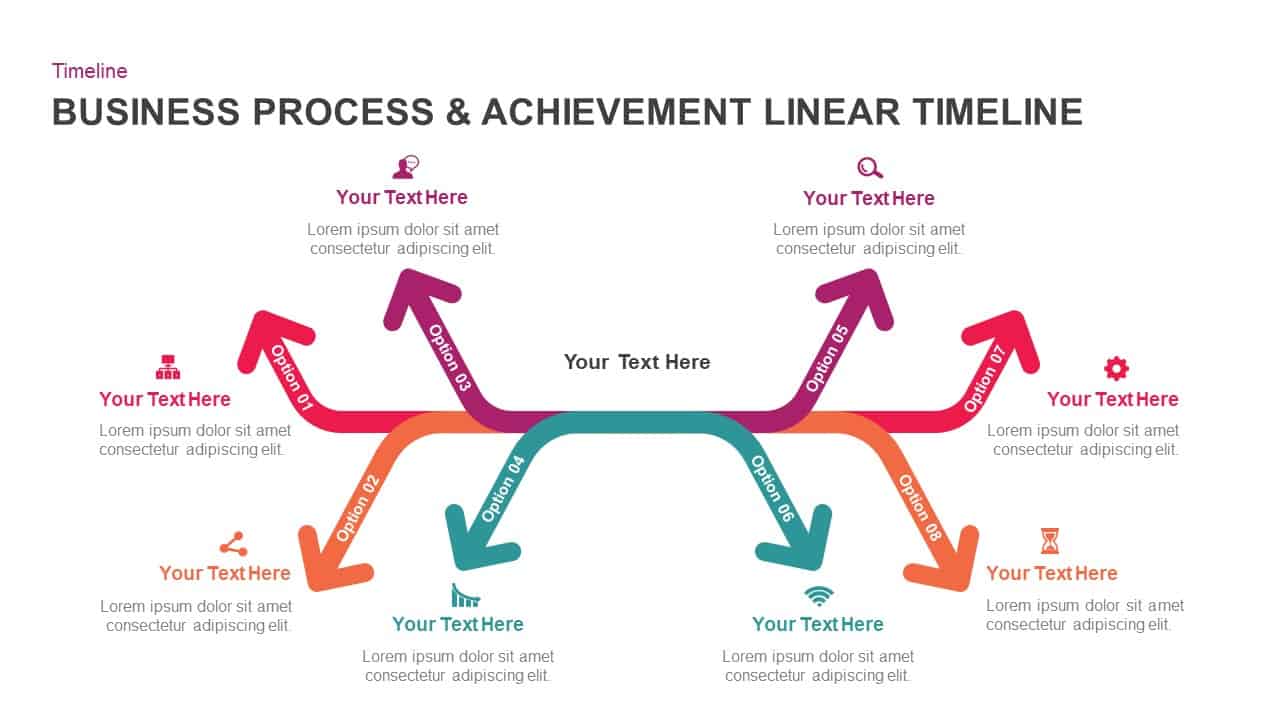
Business Process Achievement Timeline Template for PowerPoint & Google Slides
Timeline
Business Process Reengineering Cycle Template for PowerPoint & Google Slides
Circular
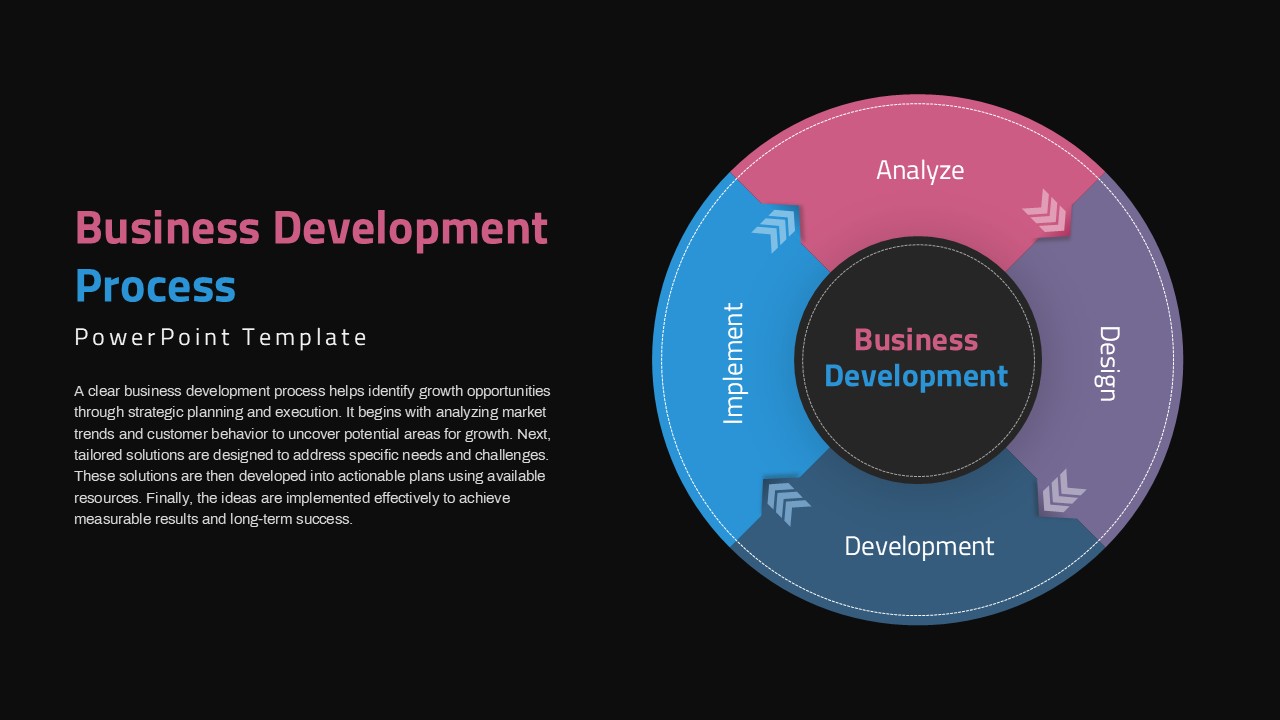
Circular Business Development Process Template for PowerPoint & Google Slides
Process