




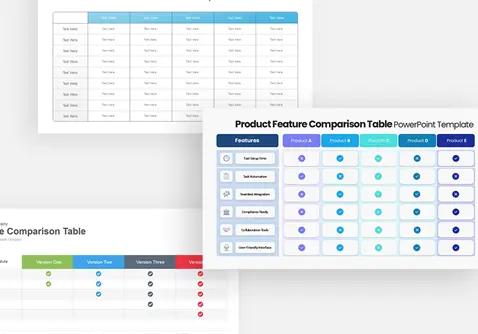
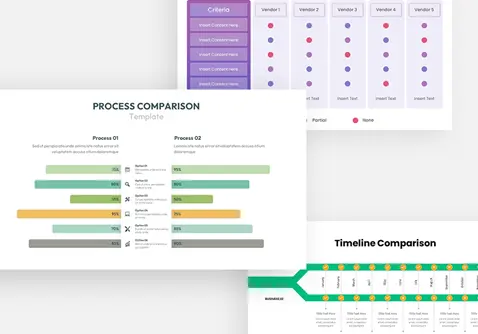

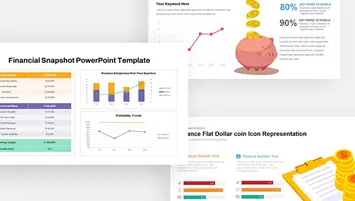





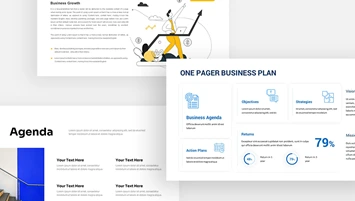







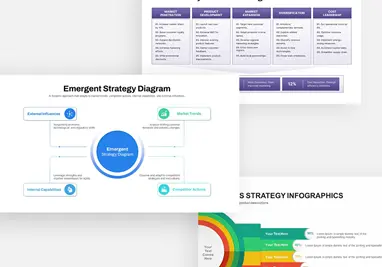

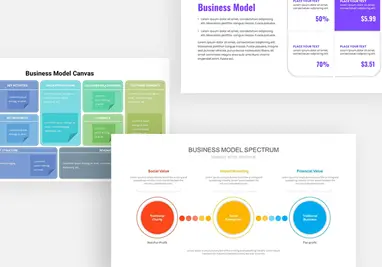





Business Data Table Template for PowerPoint & Google Slides
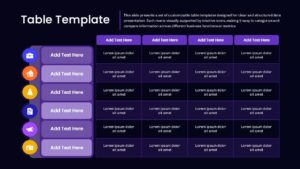
Present Business Information with Clarity and Structure
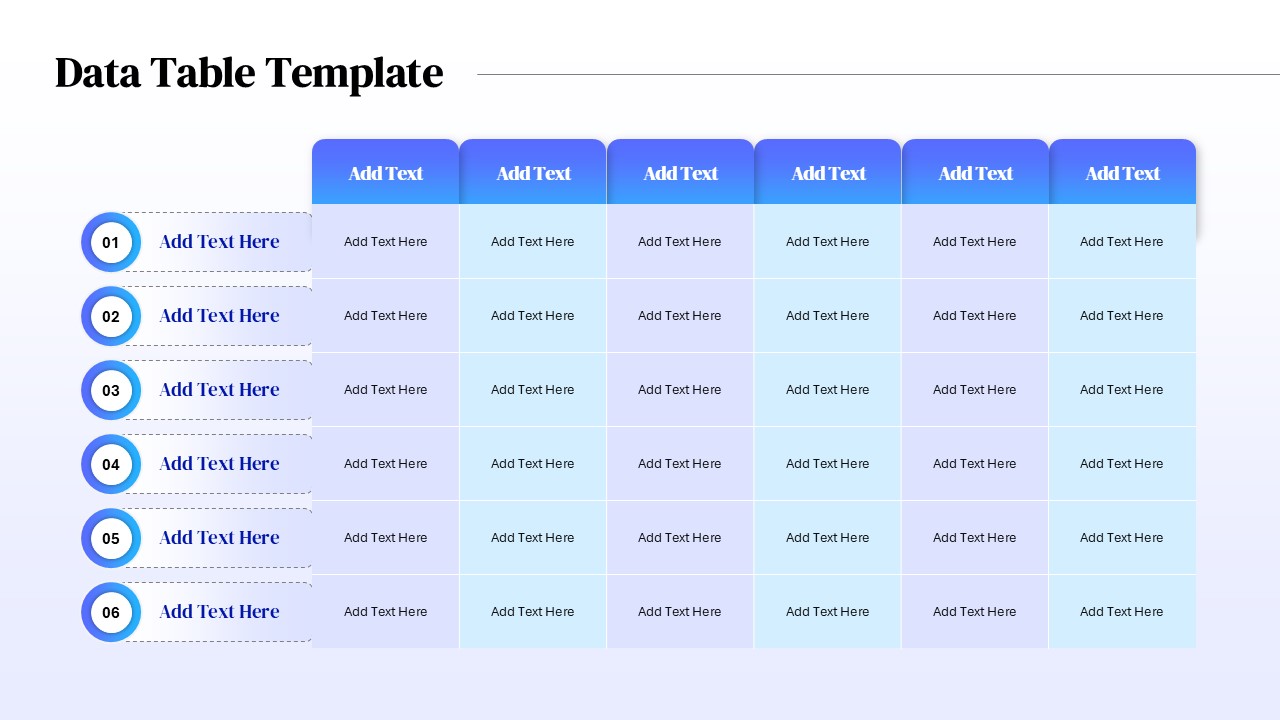
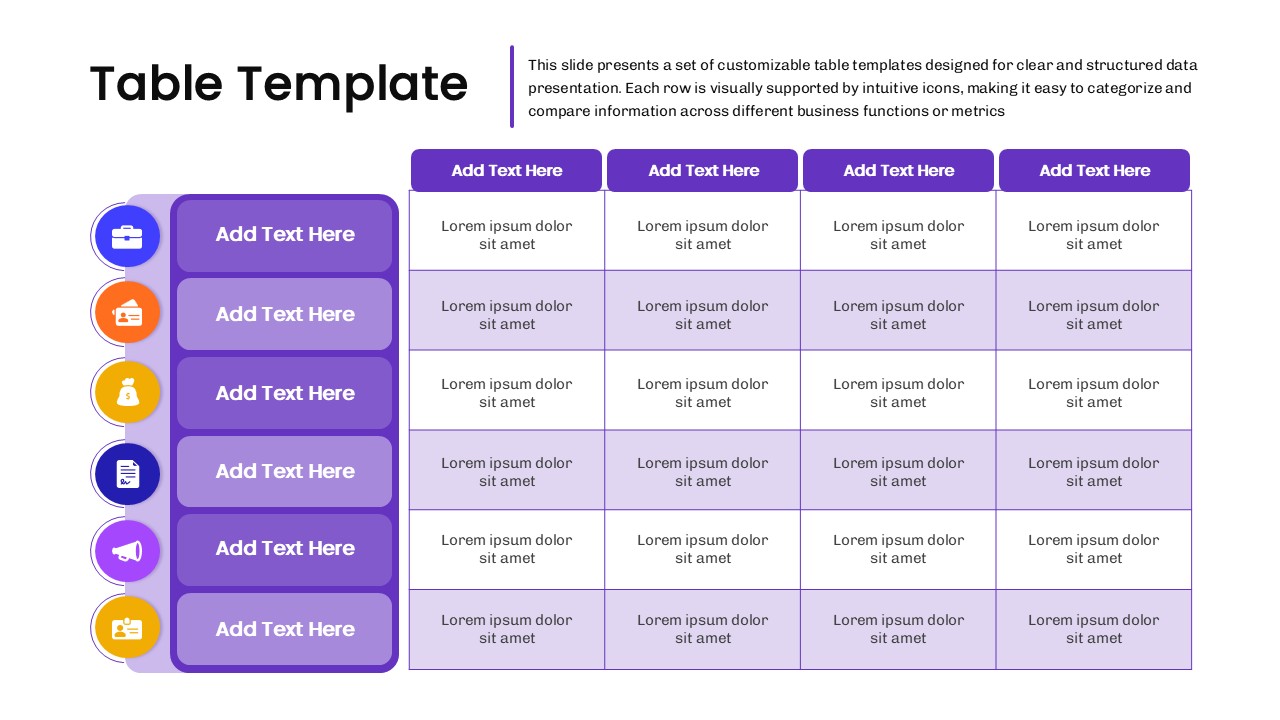
The Business Data Table Template is a professionally designed slide that helps organize and present information in a structured, easy-to-understand format. With categorized rows, multiple data columns, and intuitive visual elements, this template enables businesses to communicate complex information clearly. It is ideal for presenting performance metrics, financial reports, operational updates, project summaries, and comparative business data during meetings, reviews, and strategic presentations.
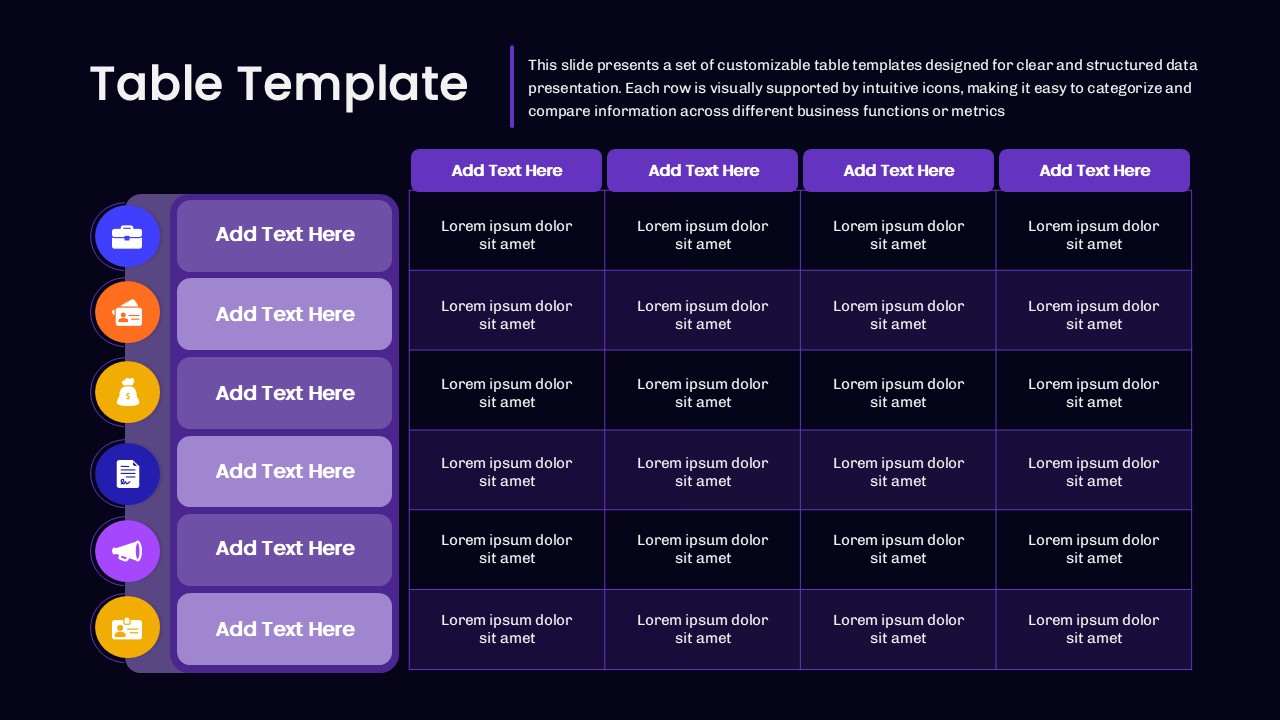
The business data table template features a well-organized table layout with highlighted row labels, colorful icons, and clearly defined data columns that improve visual navigation. The alternating color scheme and structured grid design make large amounts of information easier to scan and understand. Available in both light and dark themes, the slide adapts seamlessly to different presentation styles while maintaining a professional appearance. Its balanced design ensures that key figures and comparisons remain the focal point of the presentation.
You can use this data table to:
- Compare departmental performance and KPIs
- Present quarterly or annual business reports
- Display budget allocations and financial summaries
- Track project milestones and status updates
- Compare products, services, or strategic initiatives
- Organize operational data for executive decision-making
- Showcase sales figures, forecasts, and business metrics
- Present survey results or market research findings
Whether you need to summarize business performance, present analytical findings, or compare multiple datasets, this Business Data Table PowerPoint Template offers a clear and effective solution. Its fully editable design allows users to customize colors, icons, headings, and content to match specific branding and presentation requirements. By transforming detailed information into a visually structured format, the template helps audiences grasp key insights quickly and make more informed decisions.
Login to download this file

Item ID
SB05492Designed By
Naseeba


Related Templates

Six Column Data Table Template
Table
4-Column Data Table PowerPoint Template
Table
4 Section PowerPoint for Business Data Presentation
Process
4 Steps Business Plan Table Template for PowerPoint & Keynote
Business Plan
World Map Data template for PowerPoint & Google Slides
World Maps
Creative Data Analysis Bar Chart template for PowerPoint & Google Slides
Bar/Column
Immigration Data Dashboard Template for PowerPoint & Google Slides
Bar/Column
Data Management and Analytics Diagram Template for PowerPoint & Google Slides
Circular
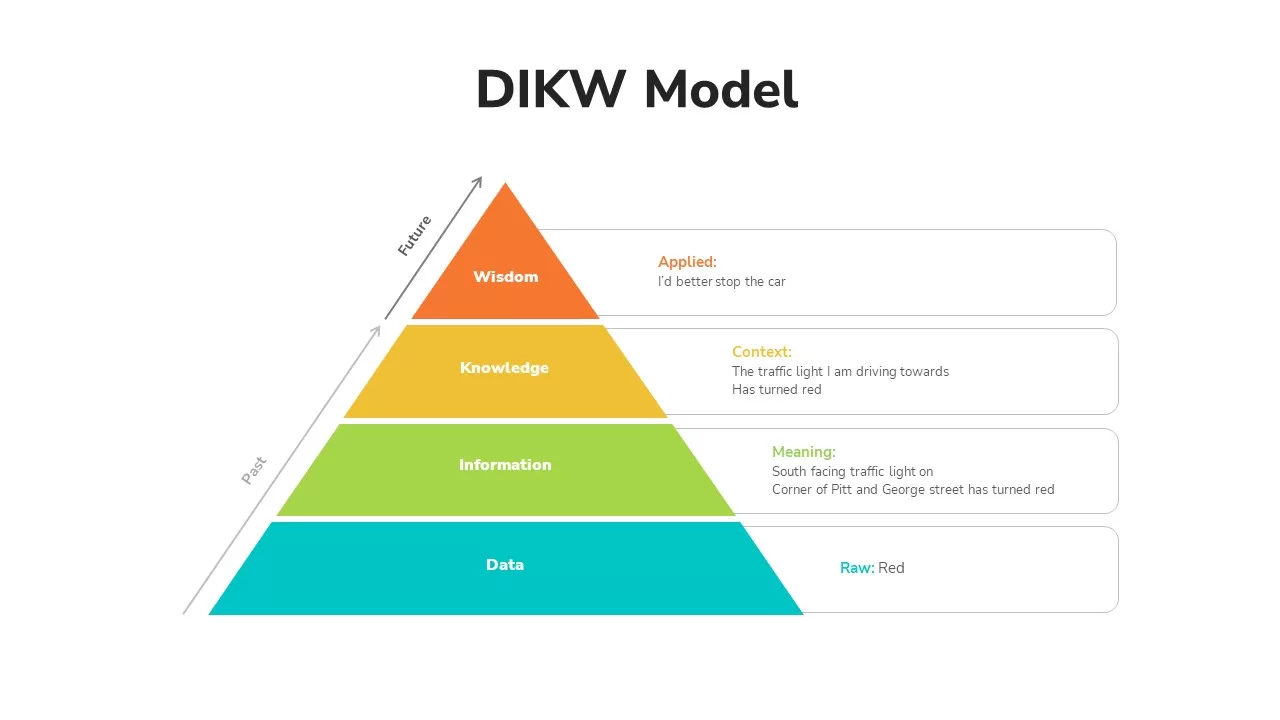
DIKW Data to Wisdom Pyramid Model Template for PowerPoint & Google Slides
Pyramid
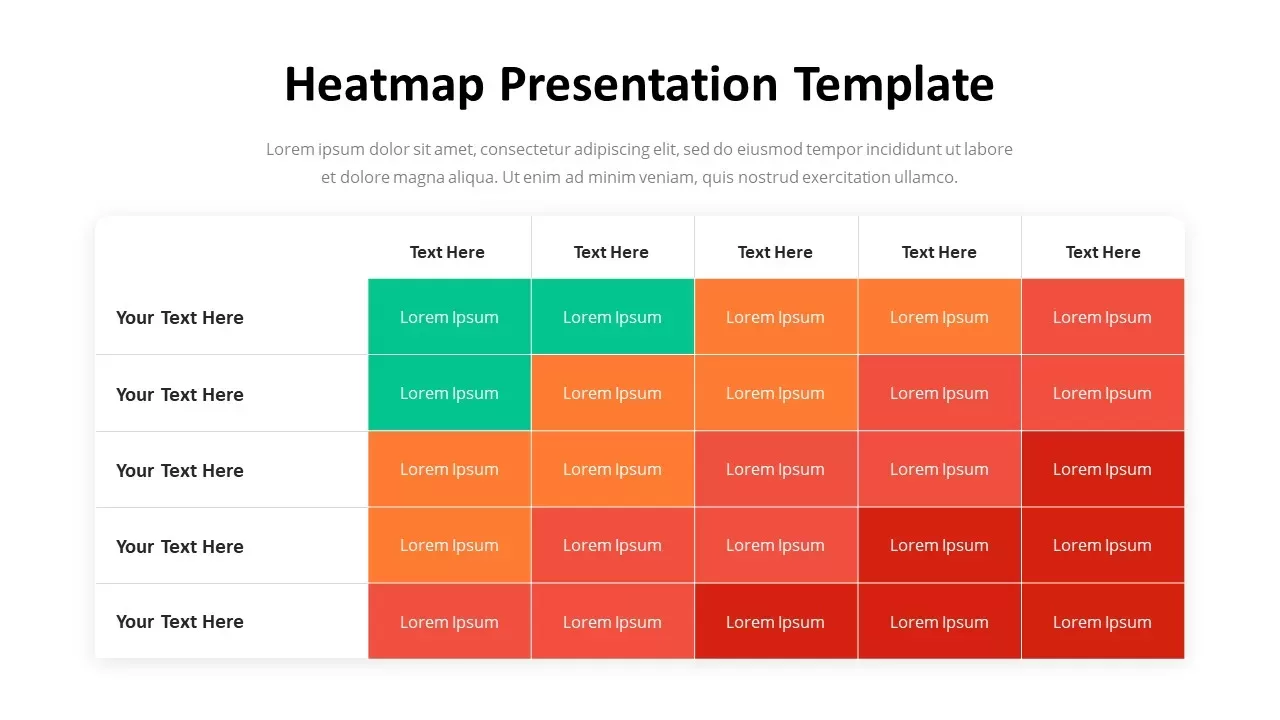
Professional Heatmap Data Visualization Template for PowerPoint & Google Slides
Infographics
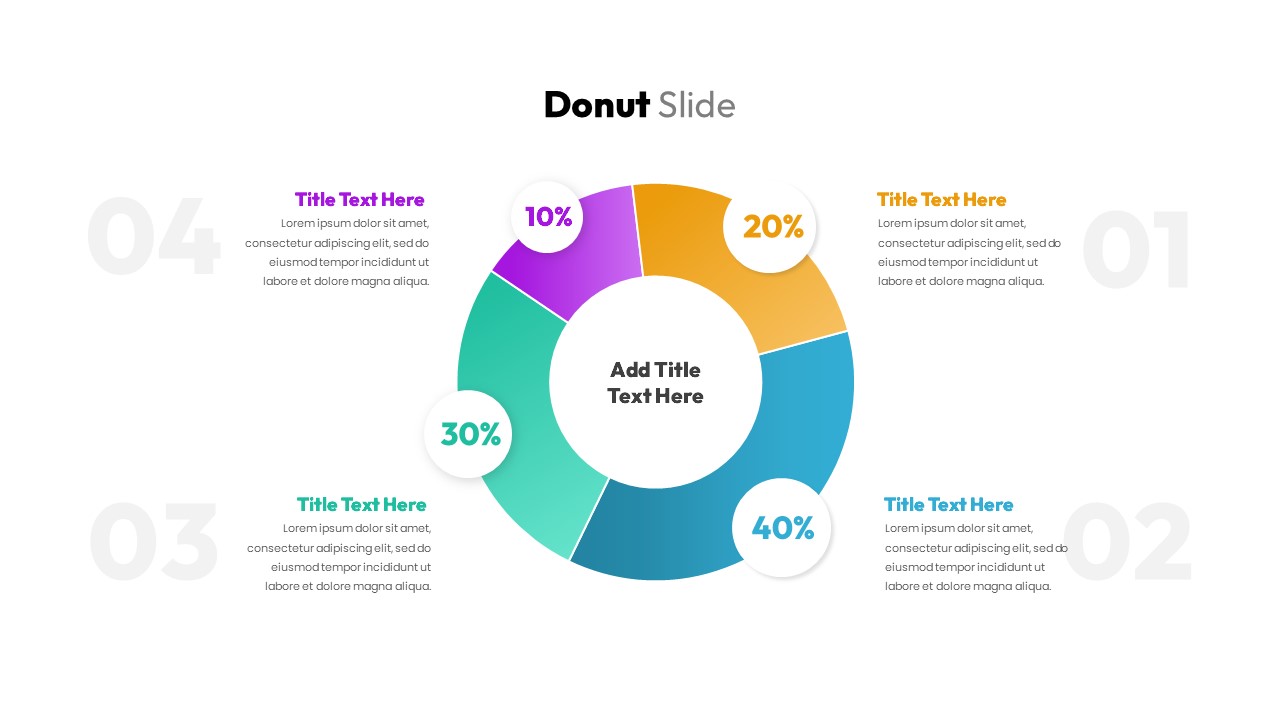
Donut Chart Data Breakdown template for PowerPoint & Google Slides
Pie/Donut
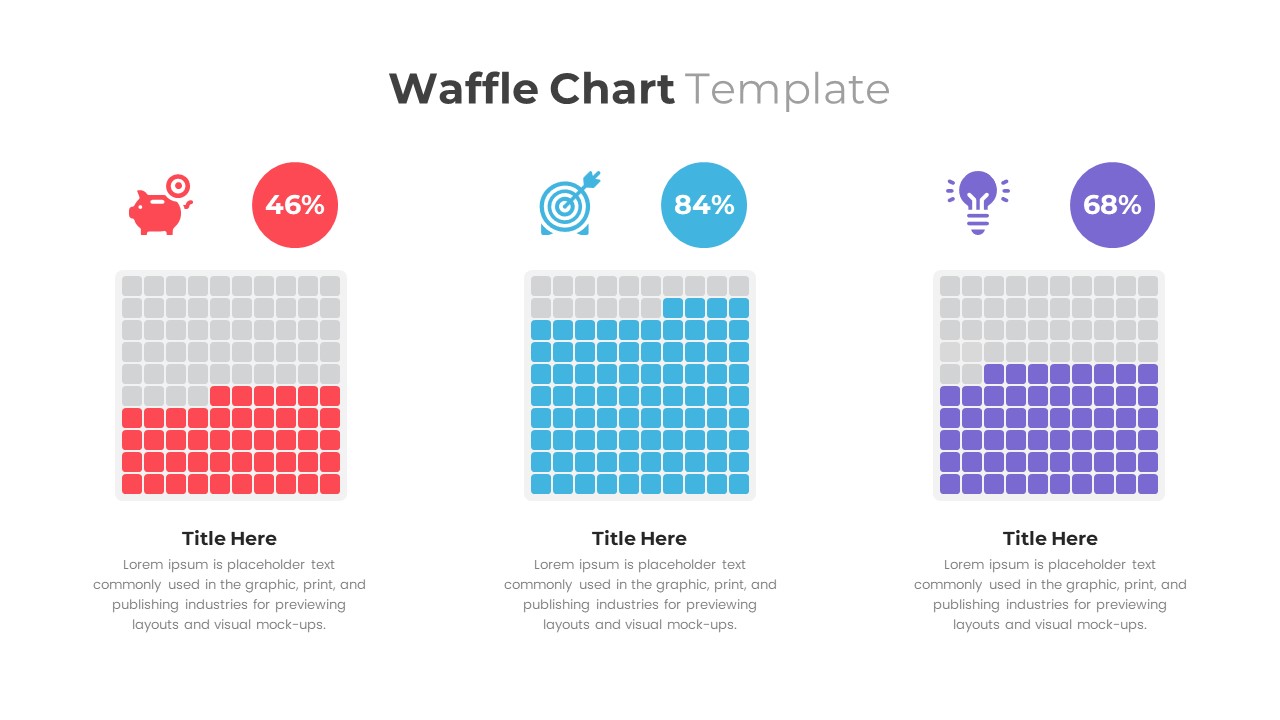
Waffle Chart Data Visualization Template for PowerPoint & Google Slides
Comparison Chart
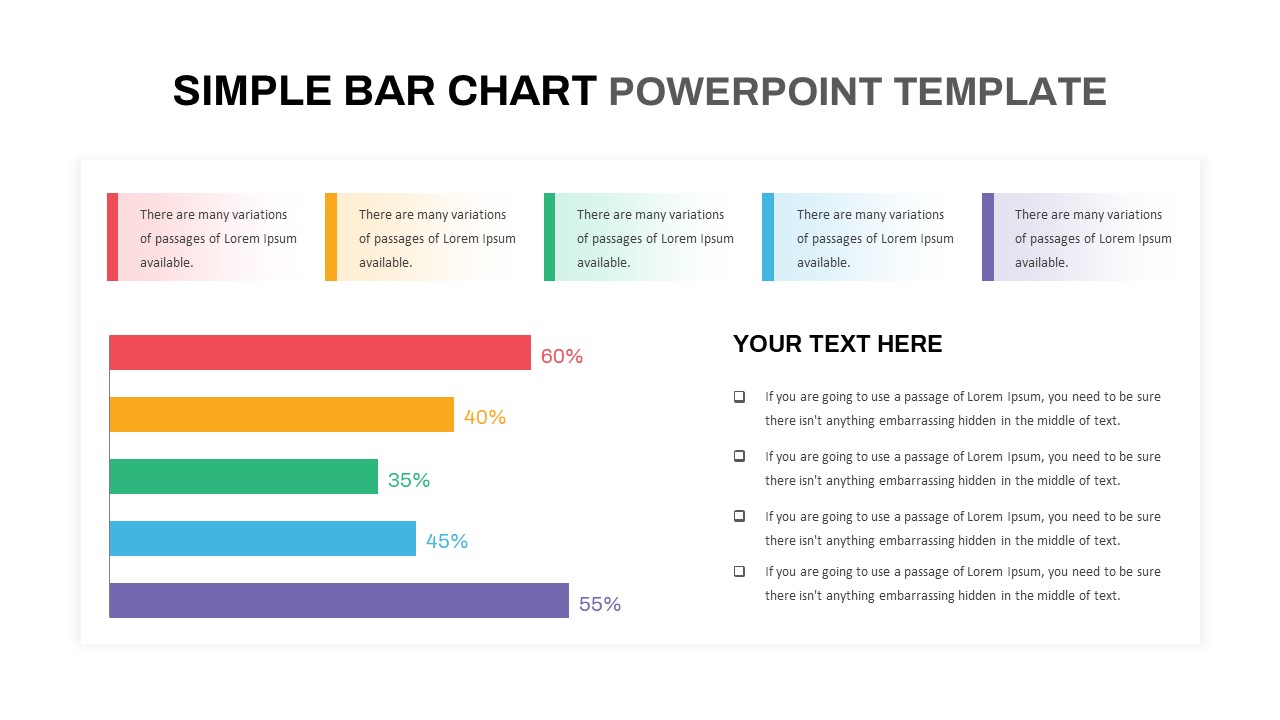
Simple Bar Chart Data Visualization Template for PowerPoint & Google Slides
Bar/Column
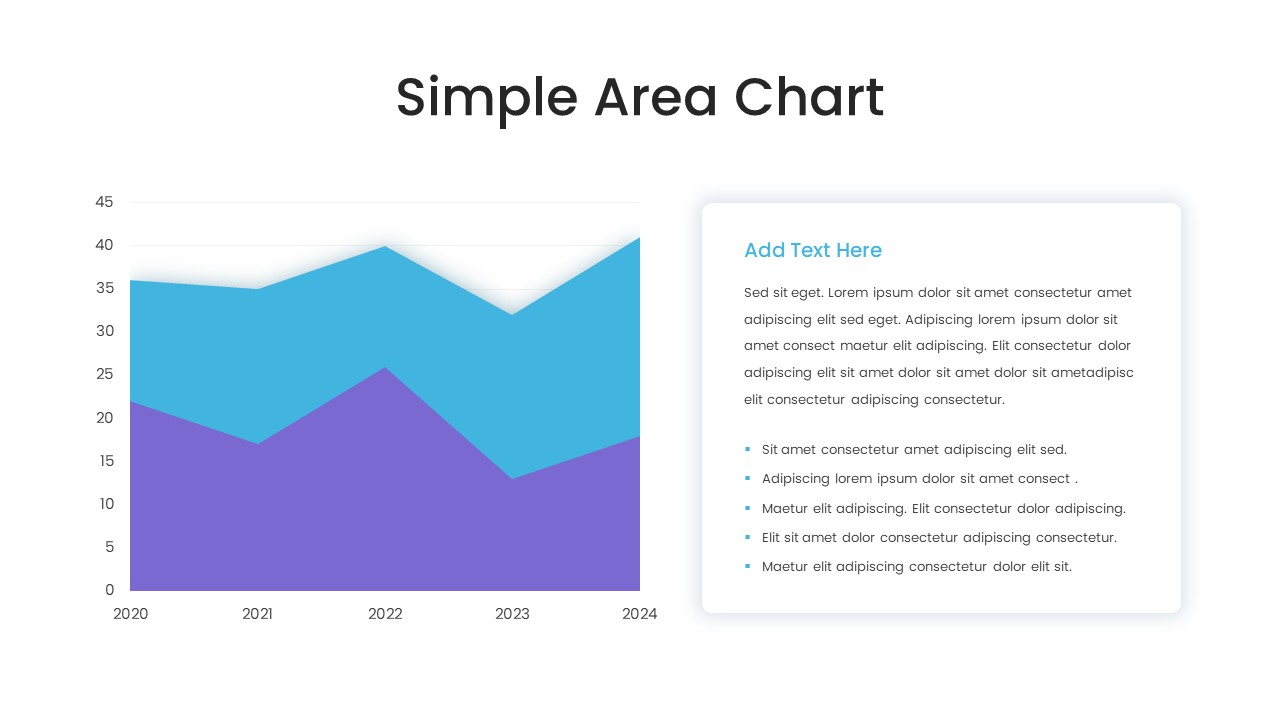
Simple Area Chart Data Trends Analysis Template for PowerPoint & Google Slides
Comparison Chart
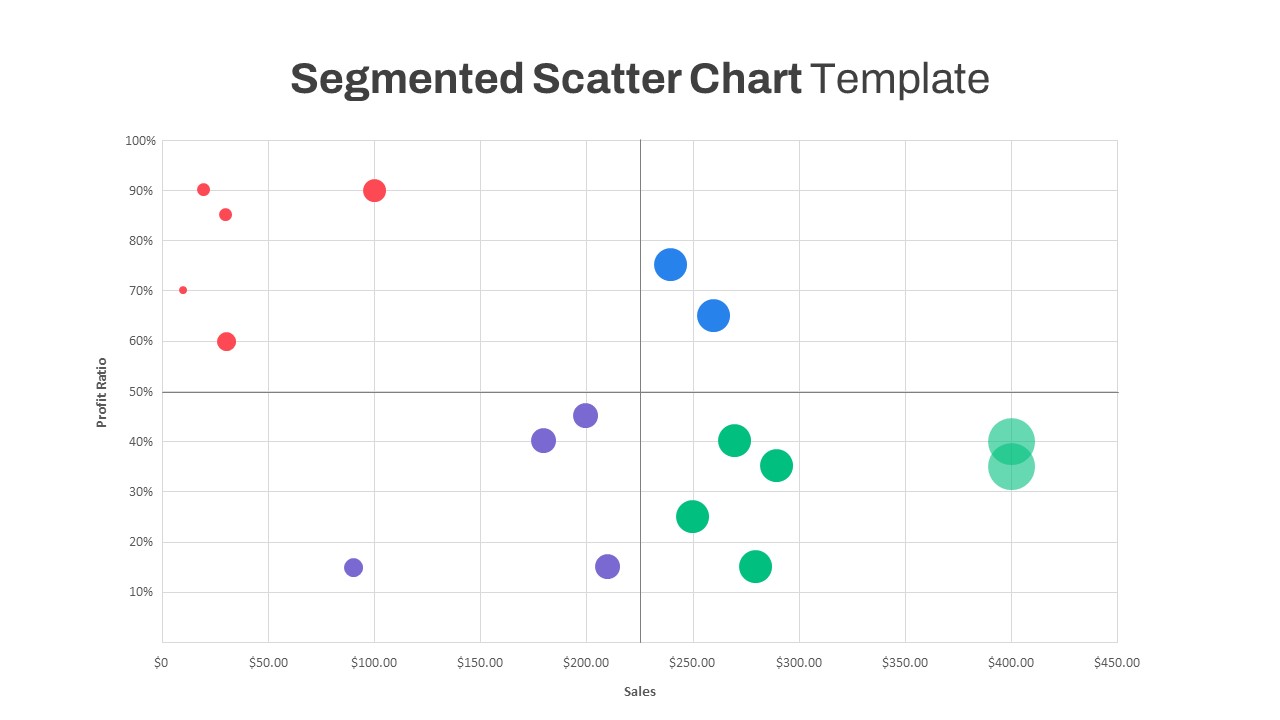
Segmented Scatter Chart Data Visualization Template for PowerPoint & Google Slides
Business Strategy
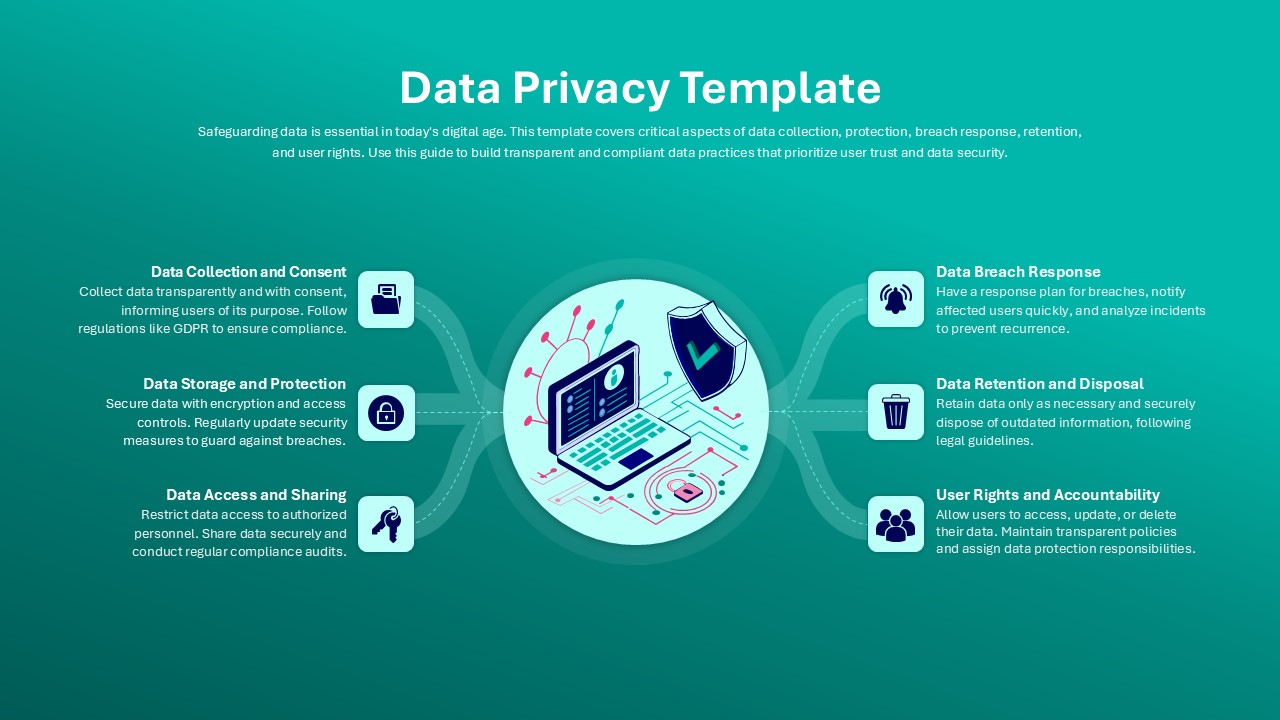
Data Privacy template for PowerPoint & Google Slides
Information Technology
Data & AI Capability Model PowerPoint Template & Google Slides
Google Slides
Data-Driven Decision Making Template for PowerPoint
Business
First Party Data Overview Template for PowerPoint & Google Slides
Business
Marketing Data Funnel Template for PowerPoint and Google Slides
Funnel