Annual Growth Trend Analysis Chart template for PowerPoint & Google Slides


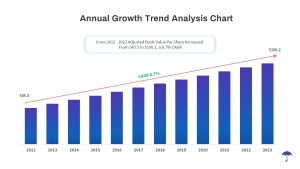
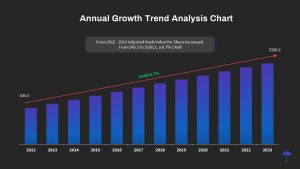
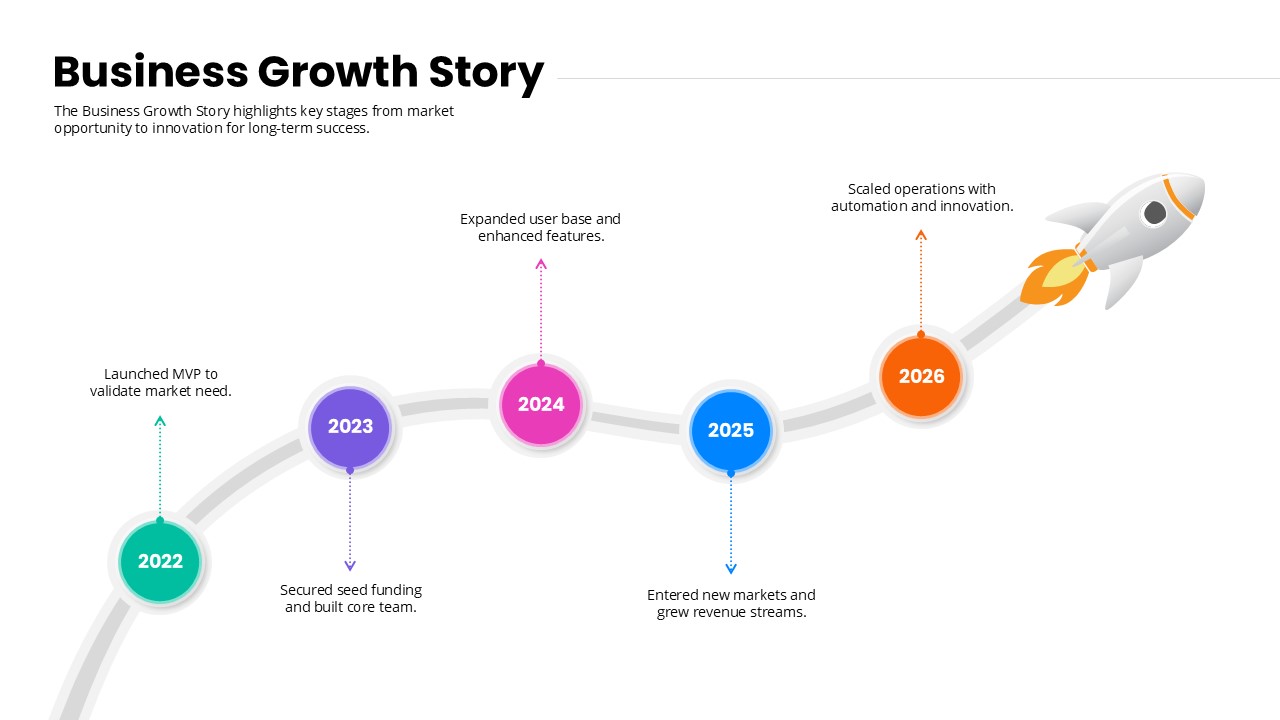
Optimize your financial and investor presentations with this Annual Growth Trend Analysis Chart template. The clean bar chart visualizes adjusted book value per share from 2012 to 2023, highlighting a consistent increase from $45.5 to $100.2 alongside a red trend line and 8.7% CAGR annotation. Bars feature a vibrant blue-to-purple gradient and precise data labels, while a subtle gray axis and title ensure readability on any device. A floating callout box emphasizes the key metric range, and a directional arrow reinforces the upward performance narrative.
Designed for both PowerPoint and Google Slides, this slide leverages editable master layouts and customizable placeholders. Adjust data points, swap color schemes, or relocate annotations effortlessly to align with corporate branding. The structured layout maintains a balanced visual hierarchy, guiding audiences’ focus from the headline through data insights to the trend annotation. Enhanced with resizable graphic elements and linkable icons, the slide supports hyperlink-based navigation for interactive reporting or sequential storyboarding.
Whether you are preparing an annual report, investor update, board presentation, or executive summary, this chart streamlines data-driven storytelling. Use it to showcase key performance indicators, project financial forecasts, or compare growth trends across business units. Beyond finance functions, repurpose the design for sales pipeline analysis, product adoption metrics, or market share tracking. Duplicate and tailor the slide to build cohesive slide decks that convey metrics with clarity and professional polish.
With fully editable color gradients, data labels, and axis formatting, you can adapt the slide to dark or light themes while preserving contrast and legibility. Each element is anchored to master slides, ensuring consistent style across your deck and simplified updates when brand guidelines evolve. Optional entrance animations and transition presets can be enabled to emphasize key data points during live or virtual presentations.
Who is it for
Finance professionals, investor relations teams, corporate executives, and board members will benefit from this growth trend analysis chart when presenting annual performance metrics, shareholder reports, or budget reviews. Consultants, analysts, and business development managers can leverage this slide to support data-driven decision-making and strategic discussions.
Other Uses
Use this chart to illustrate sales revenue growth, customer acquisition trends, project milestone progress, or market expansion metrics. Customize the gradient hues and annotations to adapt the design for product roadmaps, performance dashboards, or KPI tracking across departments.
Login to download this file

Item ID
SB04297
Related Templates

Profit Performance Trend Chart Template for PowerPoint & Google Slides
Finance
Multipurpose Spline Chart Data Trend Template for PowerPoint & Google Slides
Bar/Column

Growth Arrow for Progress & Growth template for PowerPoint & Google Slides
Arrow
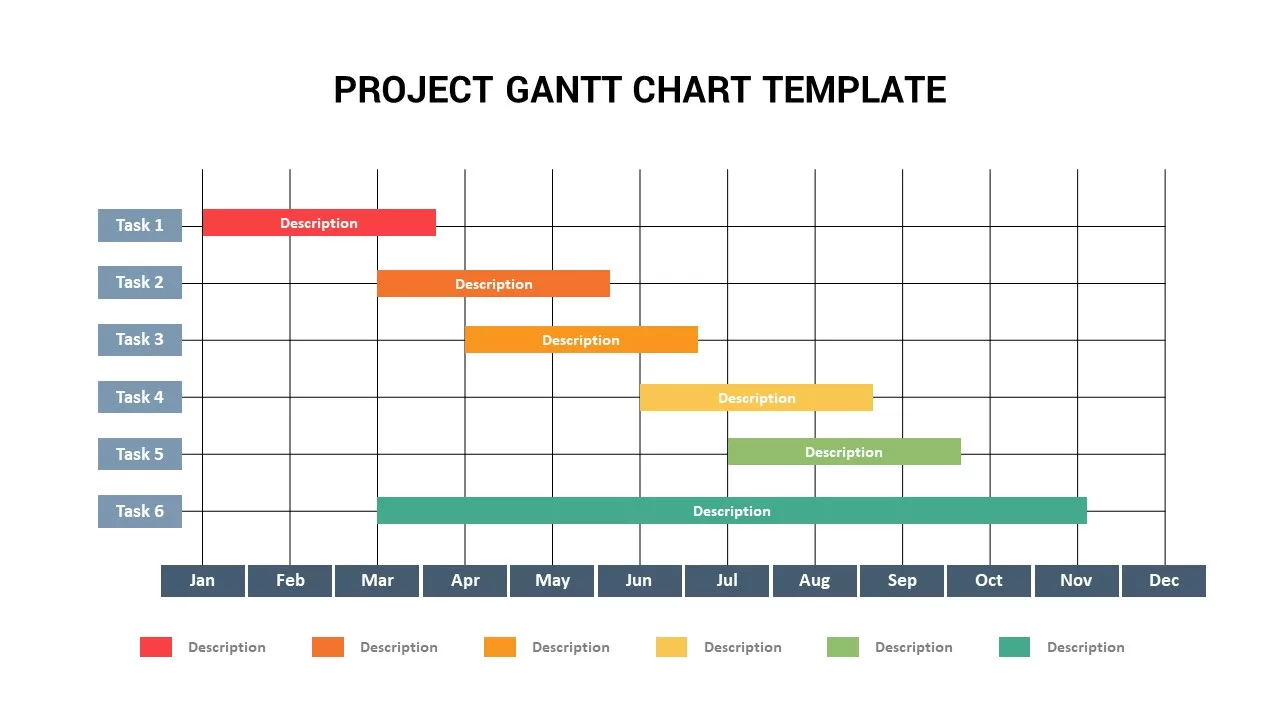
Annual Project Gantt Chart Timeline Template for PowerPoint & Google Slides
Gantt Chart
Colorful Annual Gantt Chart Project Planner Template for PowerPoint & Google Slides
Gantt Chart
Colorful Annual Gantt Chart Timeline Template for PowerPoint & Google Slides
Gantt Chart
Business Growth Metaphor Chart Template for PowerPoint & Google Slides
Business
Growth Curve Line Chart Visualization Template for PowerPoint & Google Slides
Charts
Sales Growth Comparison Chart & Table Template for PowerPoint & Google Slides
Bar/Column
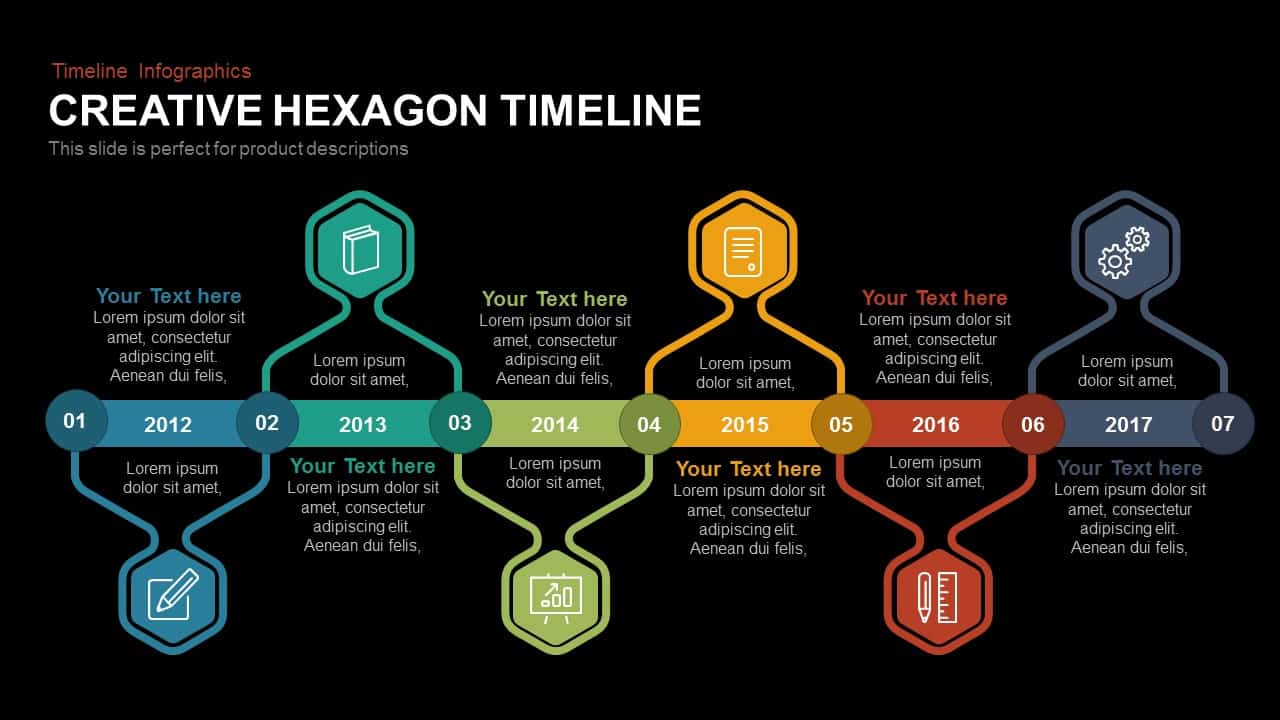
Annual Creative Hexagon Timeline Diagram Template for PowerPoint & Google Slides
Timeline
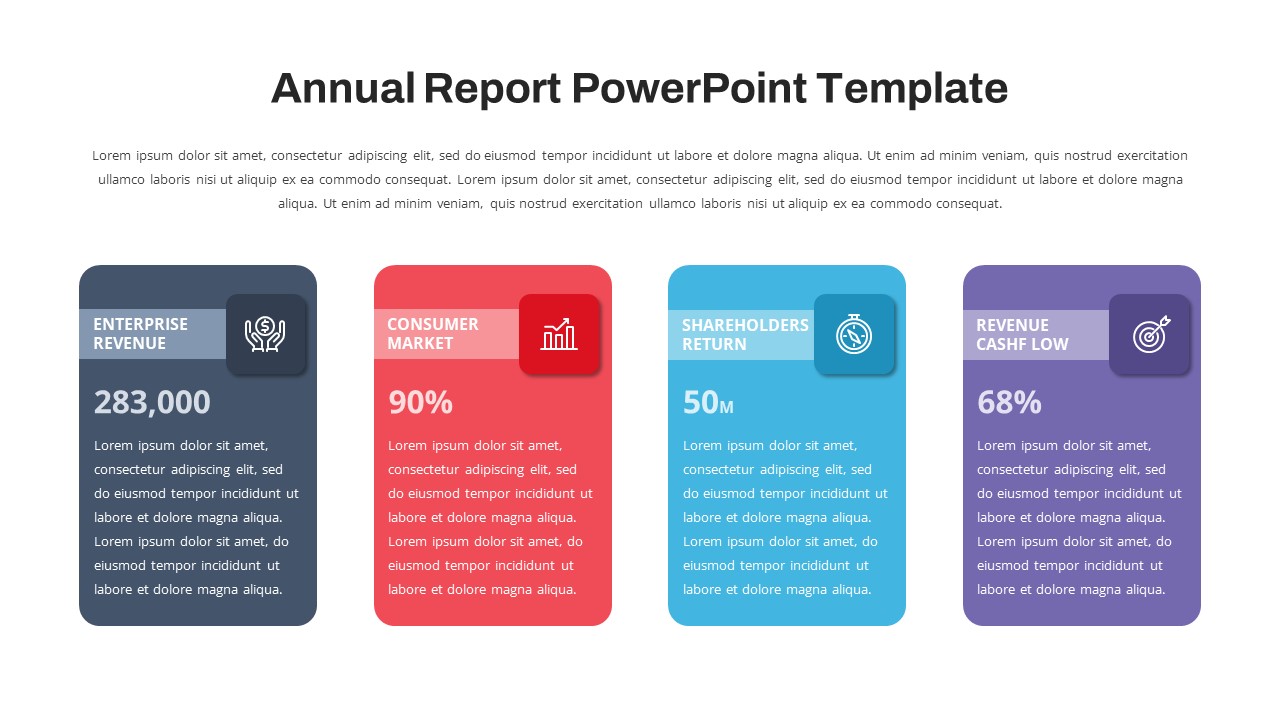
Annual Report Template for PowerPoint & Google Slides
Company Profile
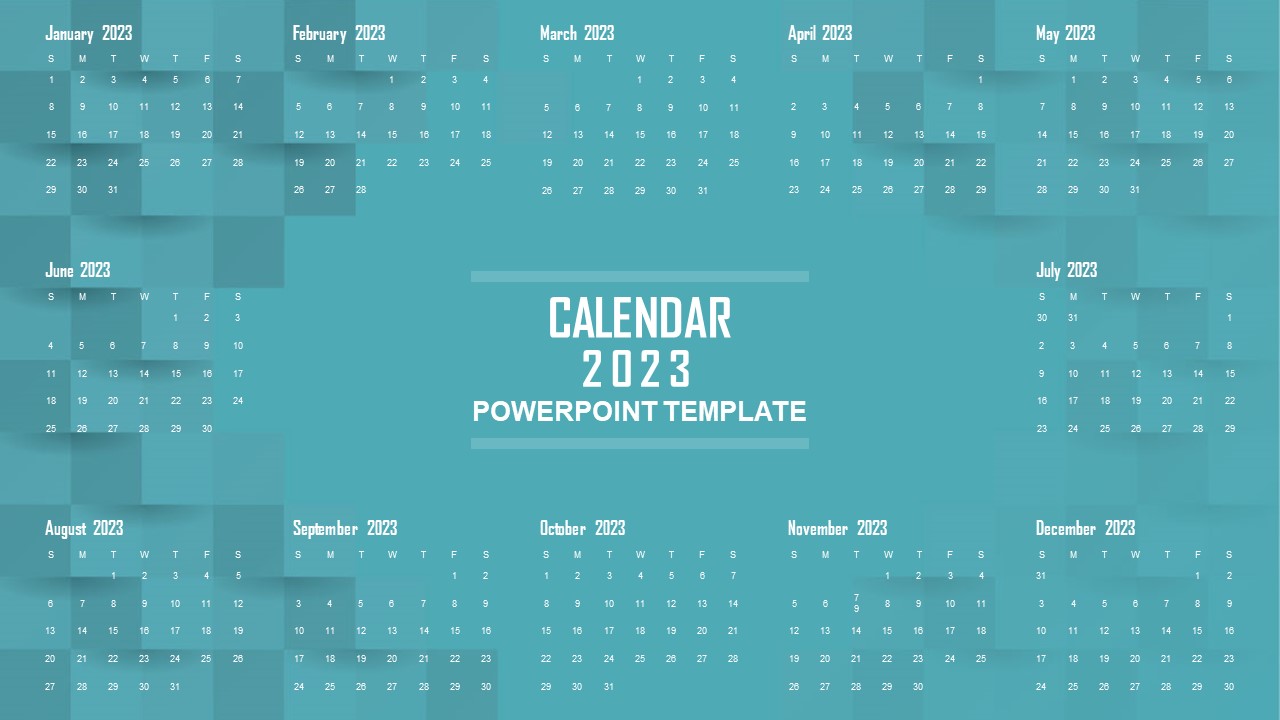
Elegant 2023 Annual Calendar Overview Template for PowerPoint & Google Slides
Timeline
Gradient Annual Plan & Strategy Deck Template for PowerPoint & Google Slides
Decks
Annual Report Overview Template for PowerPoint & Google Slides
Decks
One Pager Annual Report Dashboard Template for PowerPoint & Google Slides
Business Report
Annual Recurring Revenue Metrics Template for PowerPoint & Google Slides
Bar/Column
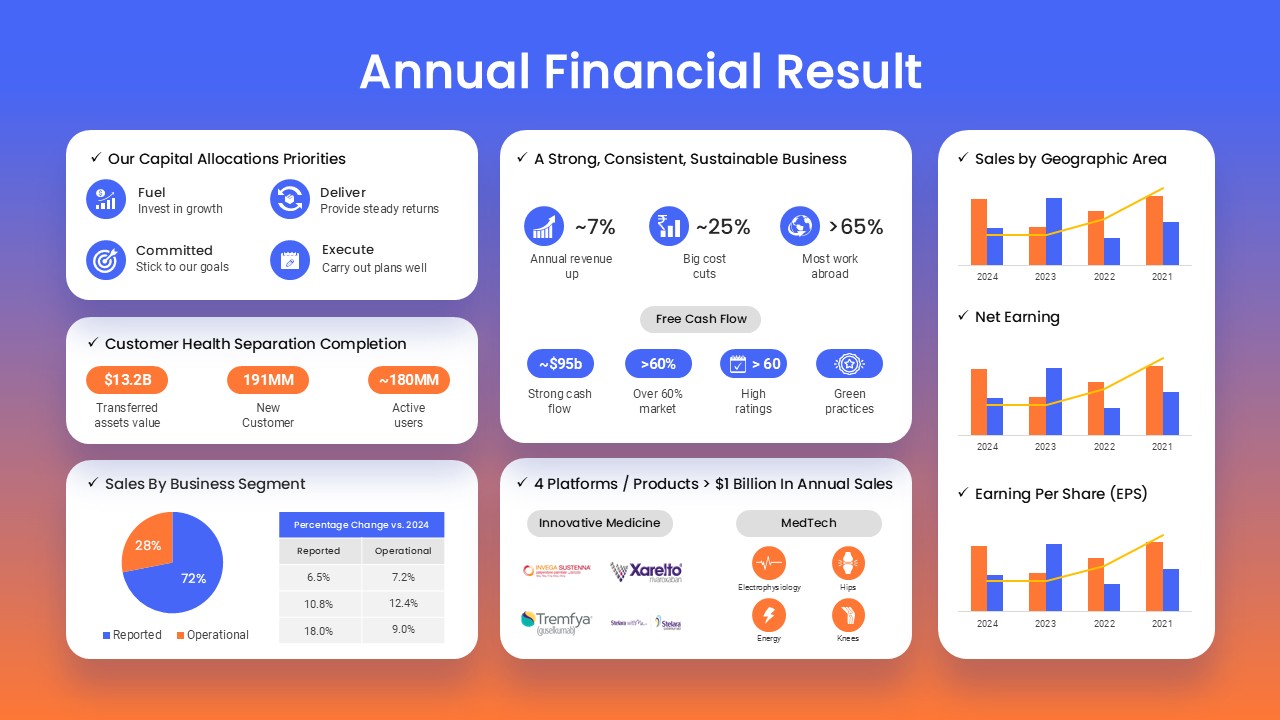
Annual Financial Results Slide Deck Template for PowerPoint & Google Slides
Finance
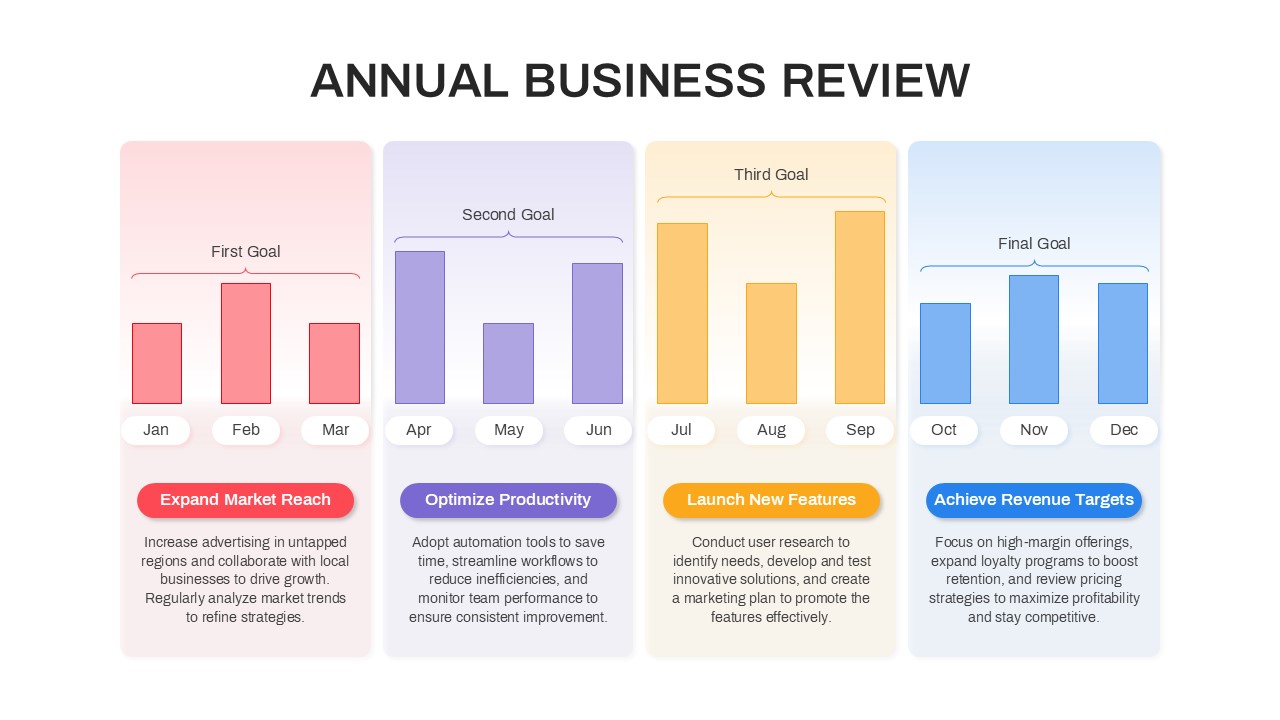
Annual Business Review Timeline Template for PowerPoint & Google Slides
Timeline
Free Annual Business Report Slide for PowerPoint & Google Slides
Finance
Free
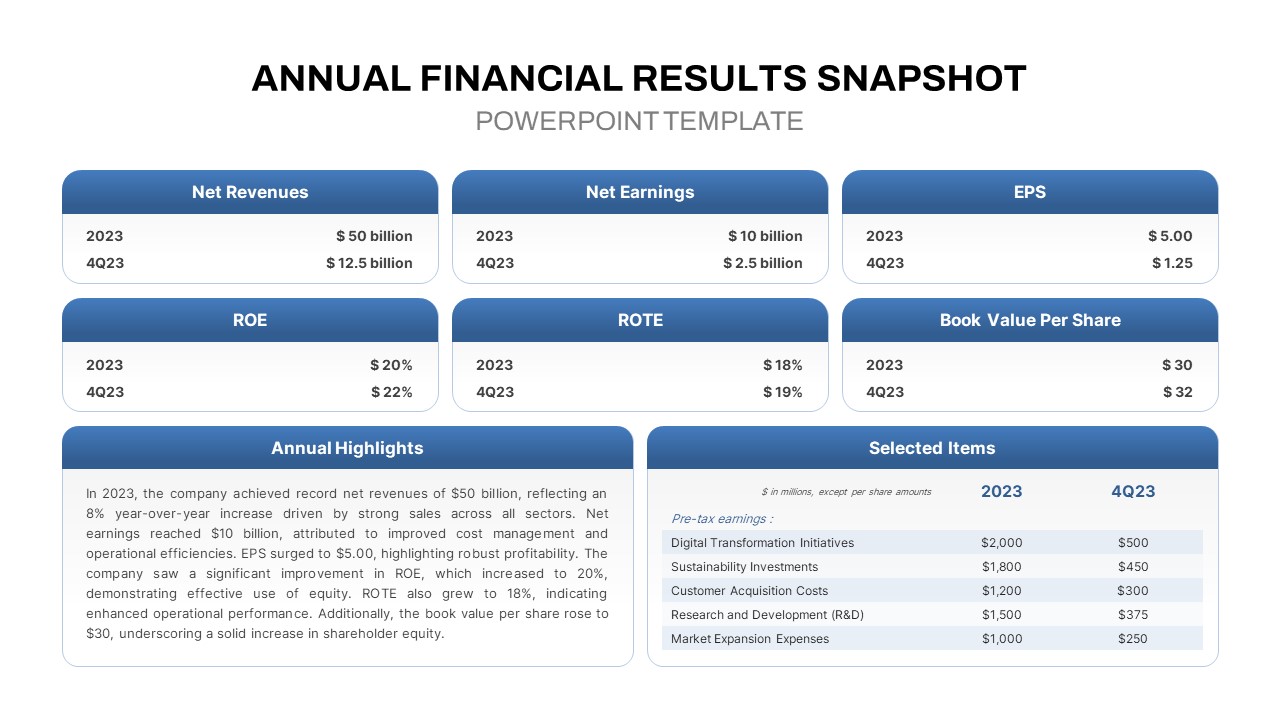
Annual Financial Results Snapshot Template for PowerPoint & Google Slide
Finance
Mobile Data Analysis Chart template for PowerPoint & Google Slides
Charts
Creative Data Analysis Bar Chart template for PowerPoint & Google Slides
Bar/Column
Pencil Bar Chart Data Analysis Template for PowerPoint & Google Slides
Bar/Column

Line Chart Analysis template for PowerPoint & Google Slides
Charts
Population Pyramid Chart Analysis Template for PowerPoint & Google Slides
Bar/Column
Waterfall Column Chart Analysis Template for PowerPoint & Google Slides
Bar/Column
Simple Scatter Chart Analysis Template for PowerPoint & Google Slides
Comparison Chart
Simple Area Chart Data Trends Analysis Template for PowerPoint & Google Slides
Comparison Chart
Waterfall Bar Chart Analysis Template for PowerPoint & Google Slides
Bar/Column
Four Quadrant Scatter Chart Analysis Template for PowerPoint & Google Slides
Comparison Chart
Proportional Area Chart Analysis Template for PowerPoint & Google Slides
Comparison Chart
Expanding Margins Analysis Bar Chart Template for PowerPoint & Google Slides
Charts
Dynamic Financial Analysis Line Chart Template for PowerPoint & Google Slides
Finance
Data Analysis Bar Chart with Insights Template for PowerPoint & Google Slides
Bar/Column
Free
Skills Gap Analysis Comparison Chart Template for PowerPoint & Google Slides
Gap
Growth Timeline template for PowerPoint & Google Slides
Timeline
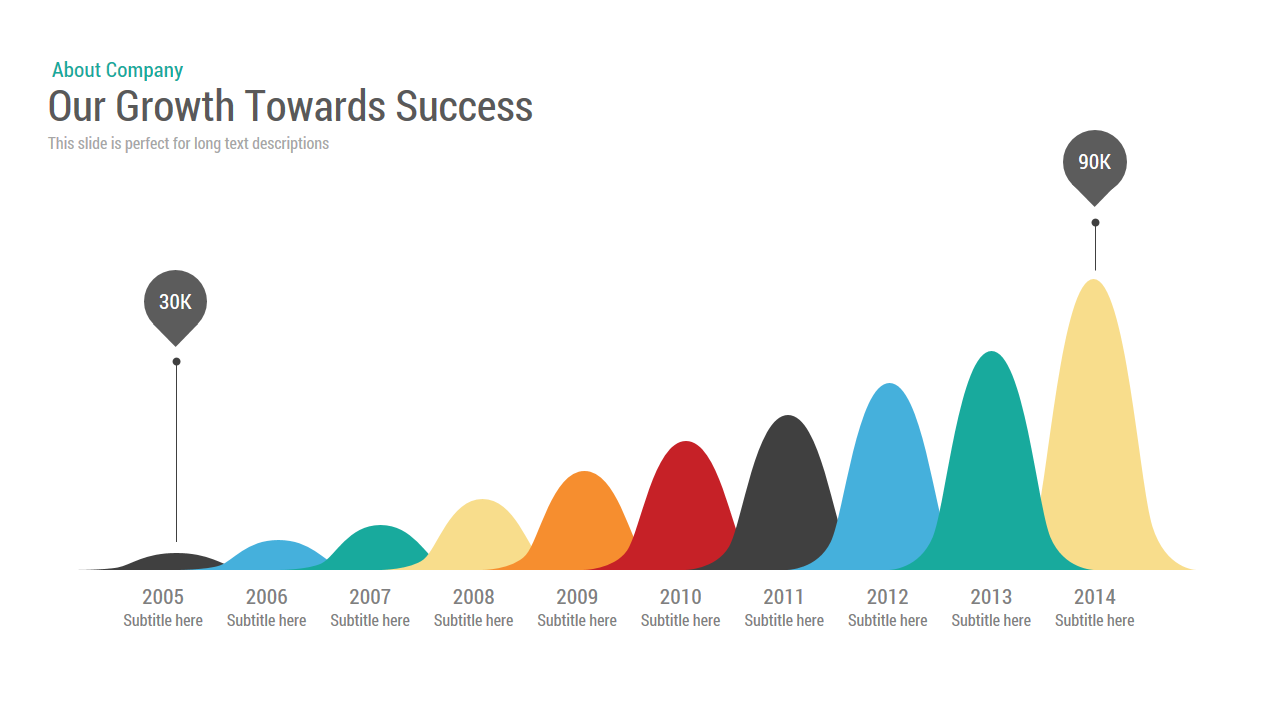
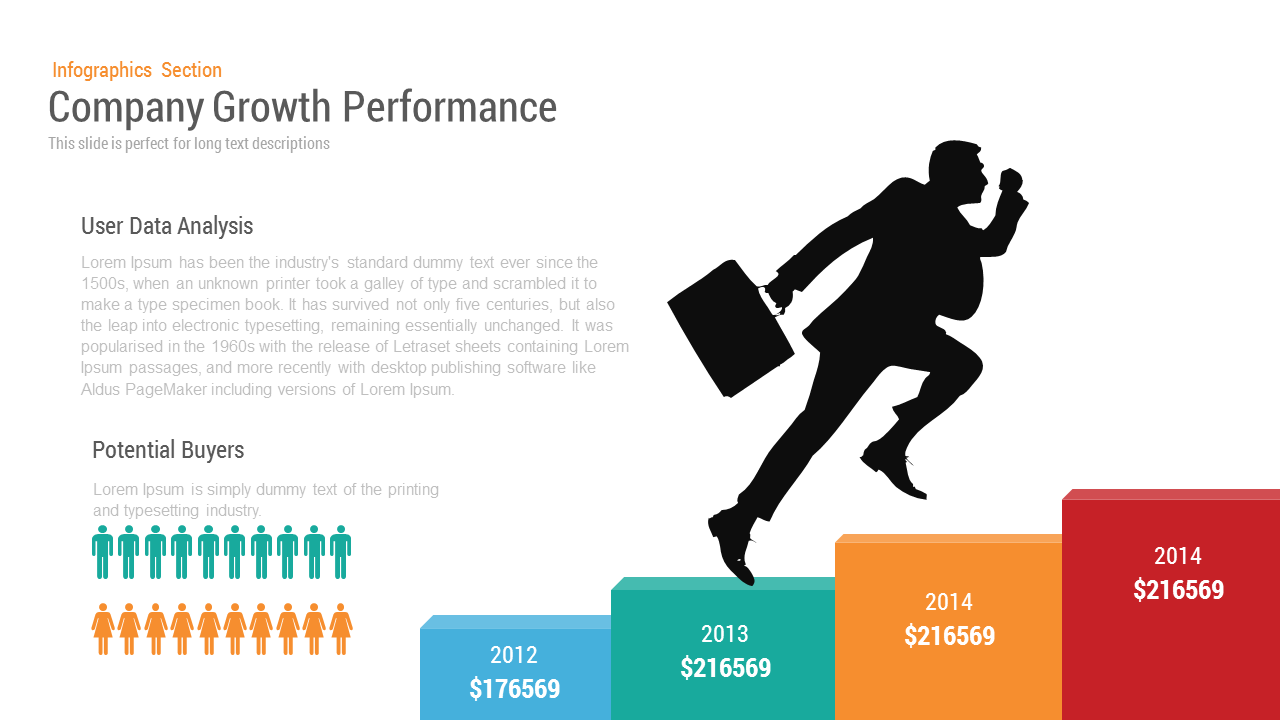
Company Growth template for PowerPoint & Google Slides
Charts
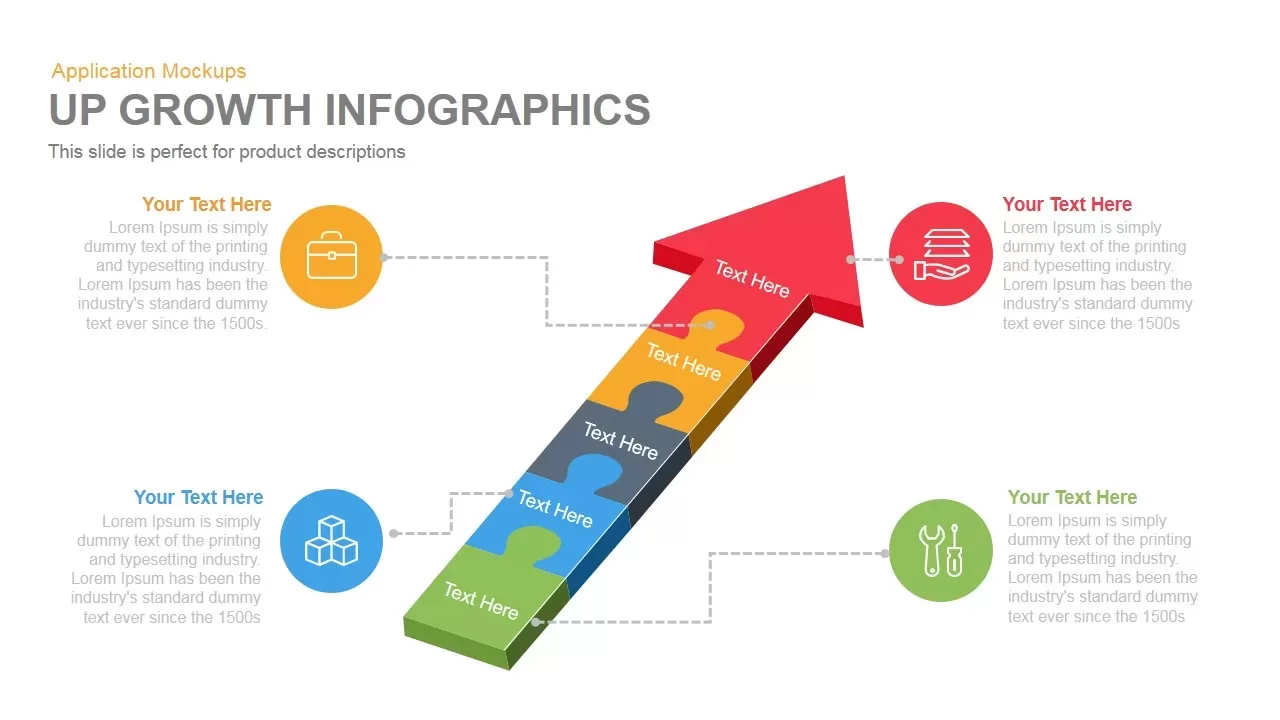
Growth Infographics template for PowerPoint & Google Slides
Arrow
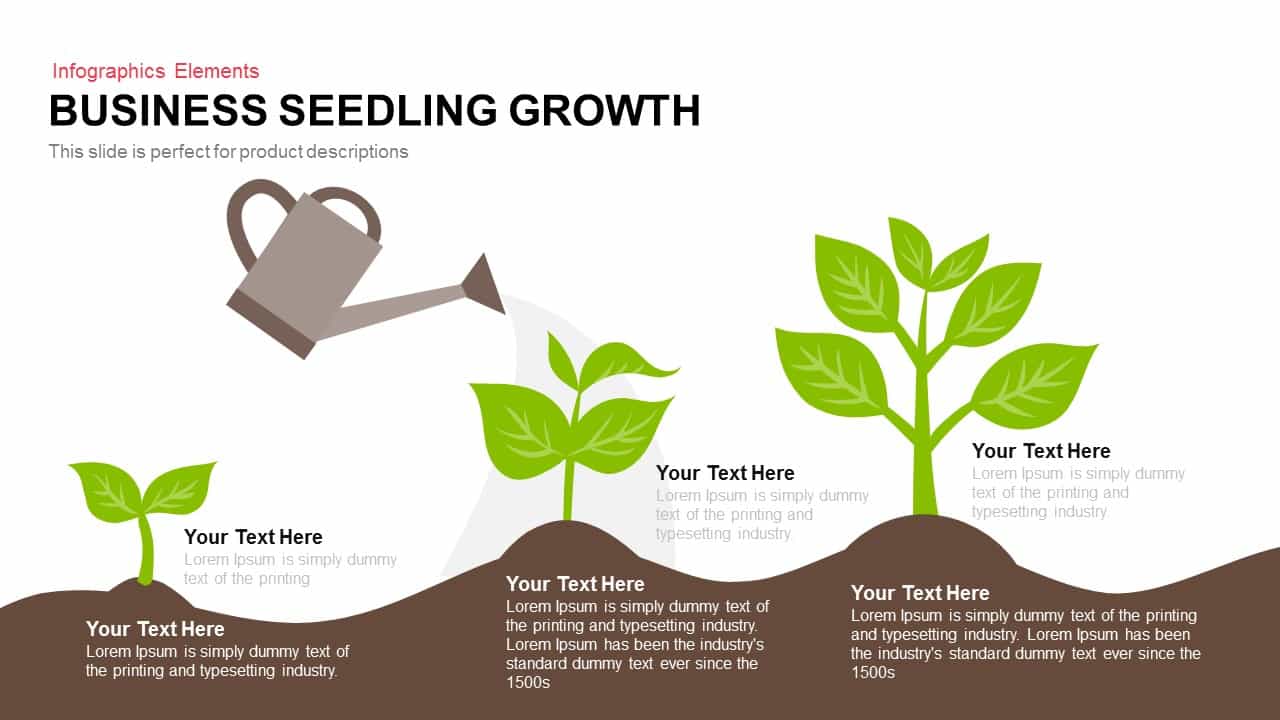
Business Seedling Growth Template for PowerPoint & Google Slides
Infographics
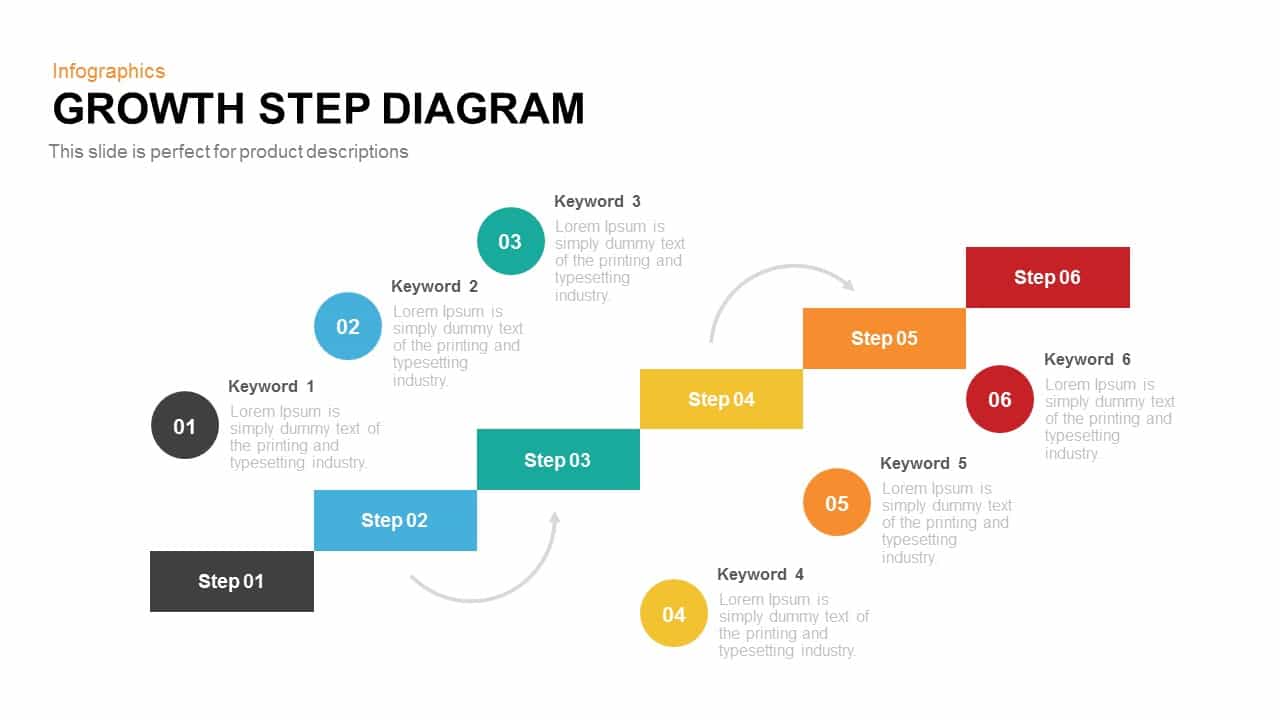
Growth Step Diagram template for PowerPoint & Google Slides
Infographics
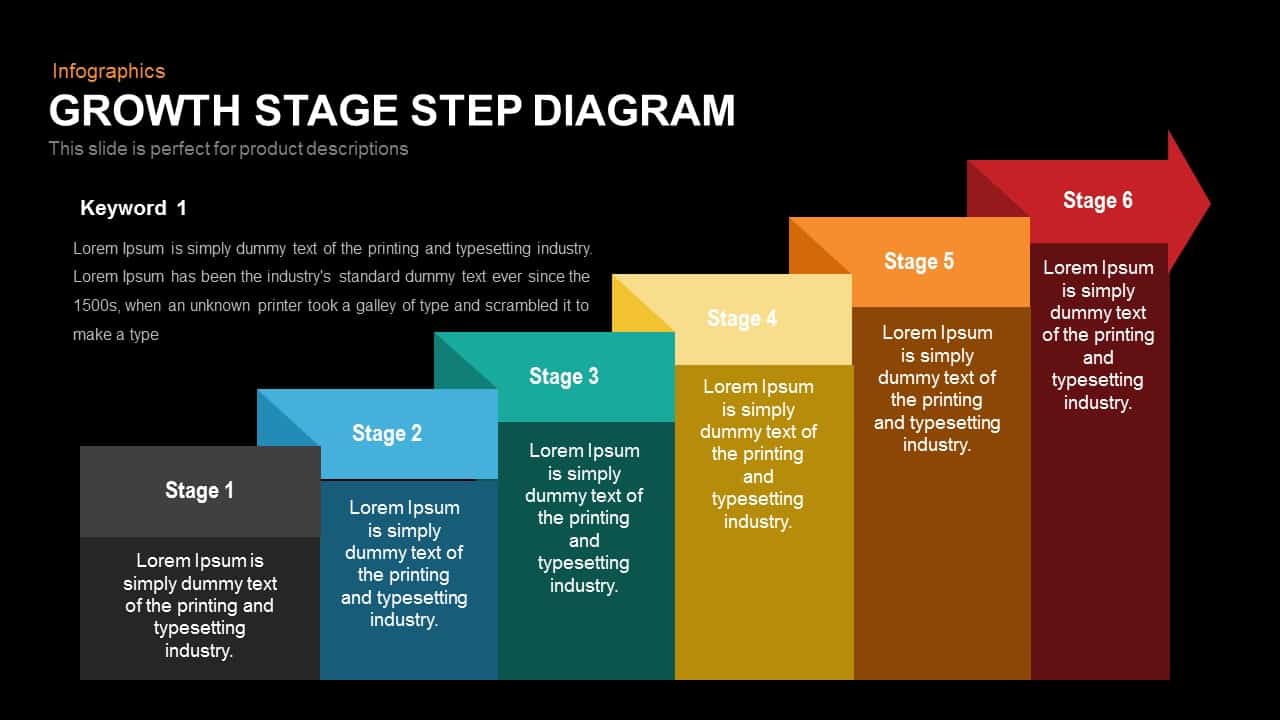
Growth Stage Diagram template for PowerPoint & Google Slides
Process
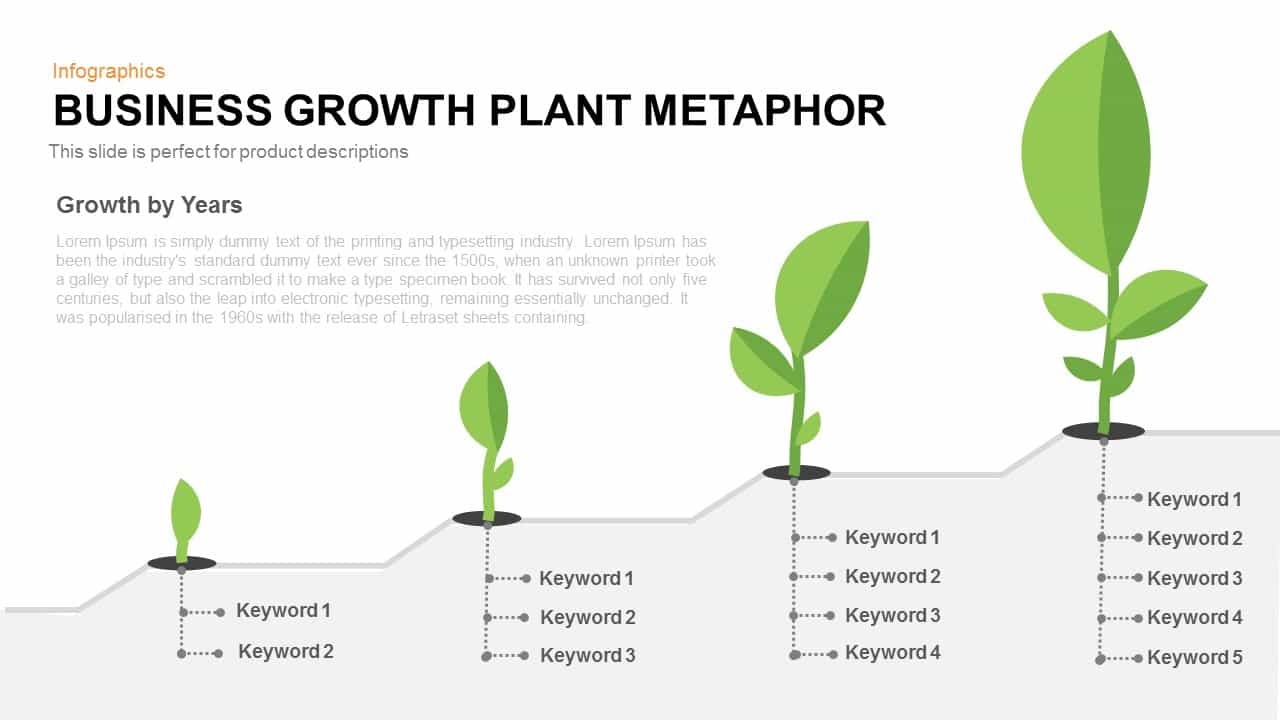
Business Growth Plant Metaphor Timeline Template for PowerPoint & Google Slides
Business Strategy
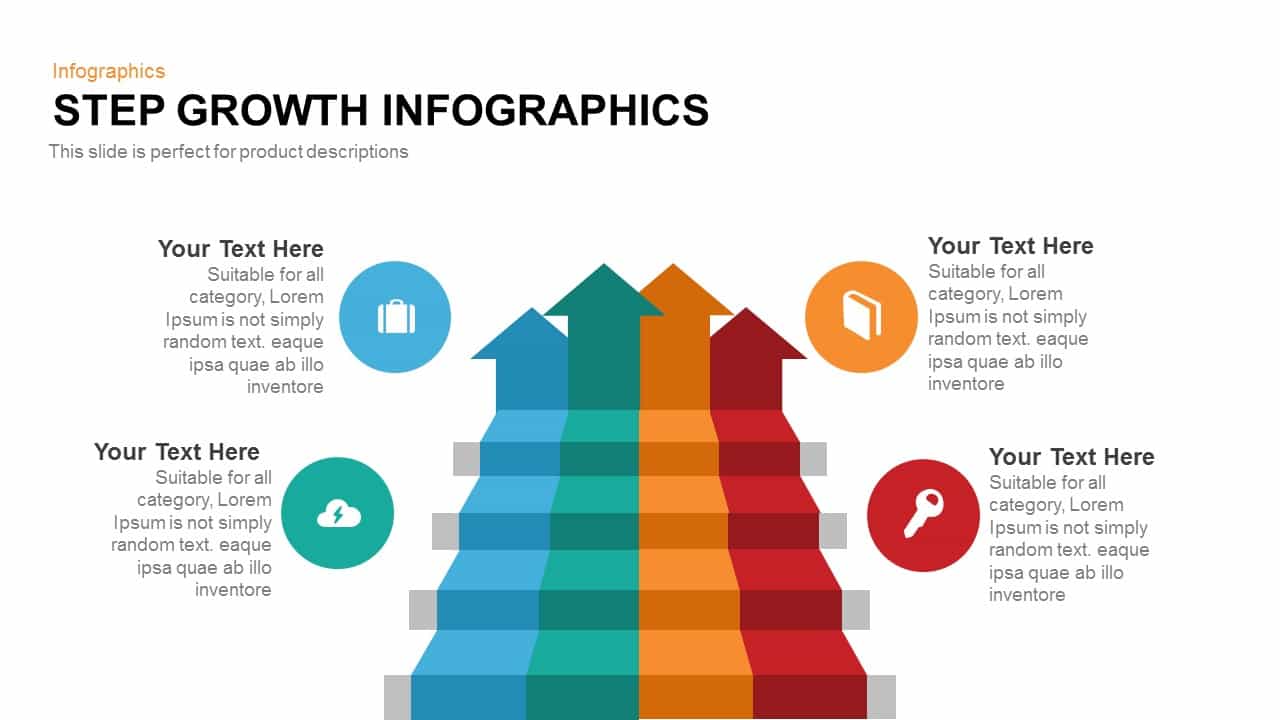
Modern Step Growth Infographics Template for PowerPoint & Google Slides
Process
Five 3D Growth Arrow Infographic Slide Template for PowerPoint & Google Slides
Arrow
5-Step Growth Staircase Infographic Template for PowerPoint & Google Slides
Process
Growth Tables Slide template for PowerPoint & Google Slides
Process
Five-Step Growth Stage Staircase Diagram Template for PowerPoint & Google Slides
Process
Modern Five-Step Growth Diagram Template for PowerPoint & Google Slides
Process
Improvement Growth Arrow Metaphor Template for PowerPoint & Google Slides
Bar/Column
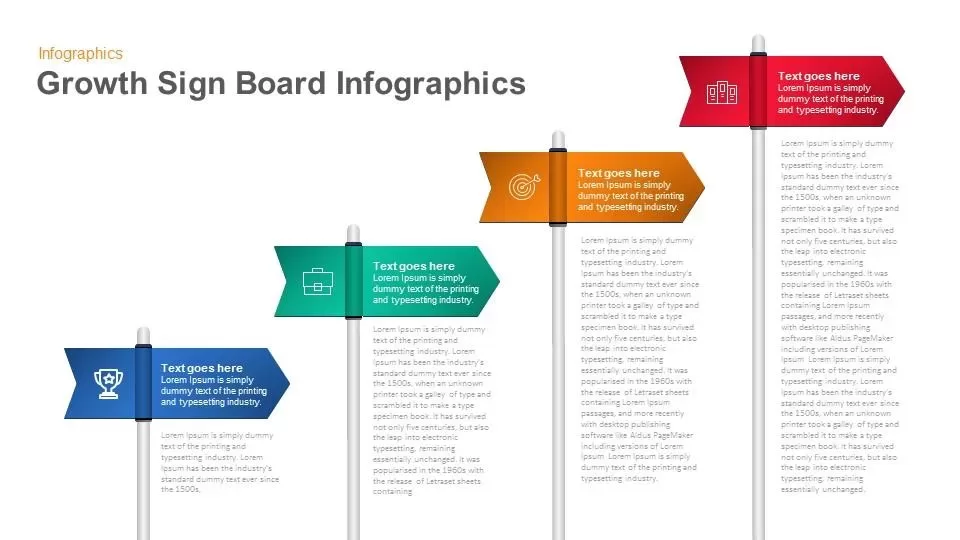
Growth Sign Board Infographics template for PowerPoint & Google Slides
Timeline
Five-Stage Growth Arrow Infographic Template for PowerPoint & Google Slides
Arrow
Ansoff Matrix Growth Strategy Model Template for PowerPoint & Google Slides
BCG
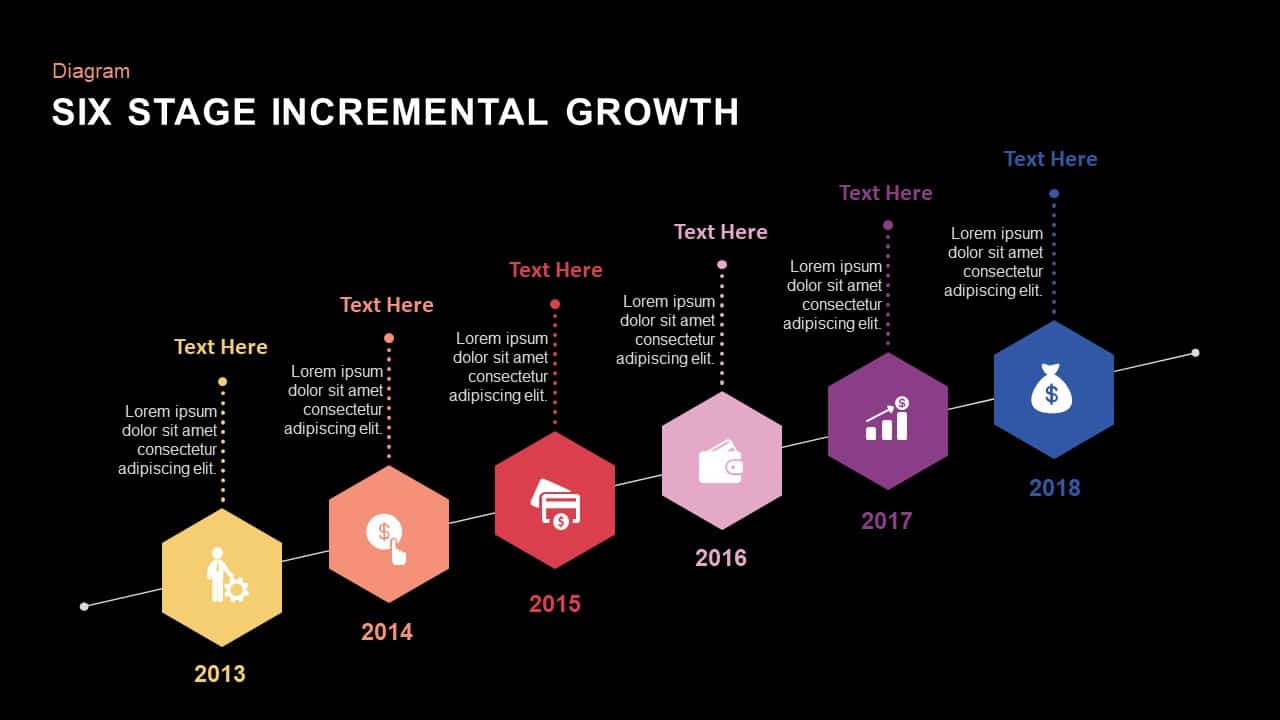
Six Stage Incremental Growth template for PowerPoint & Google Slides
Timeline
4 Step Revenue Growth Flow Diagram Template for PowerPoint & Google Slides
Process
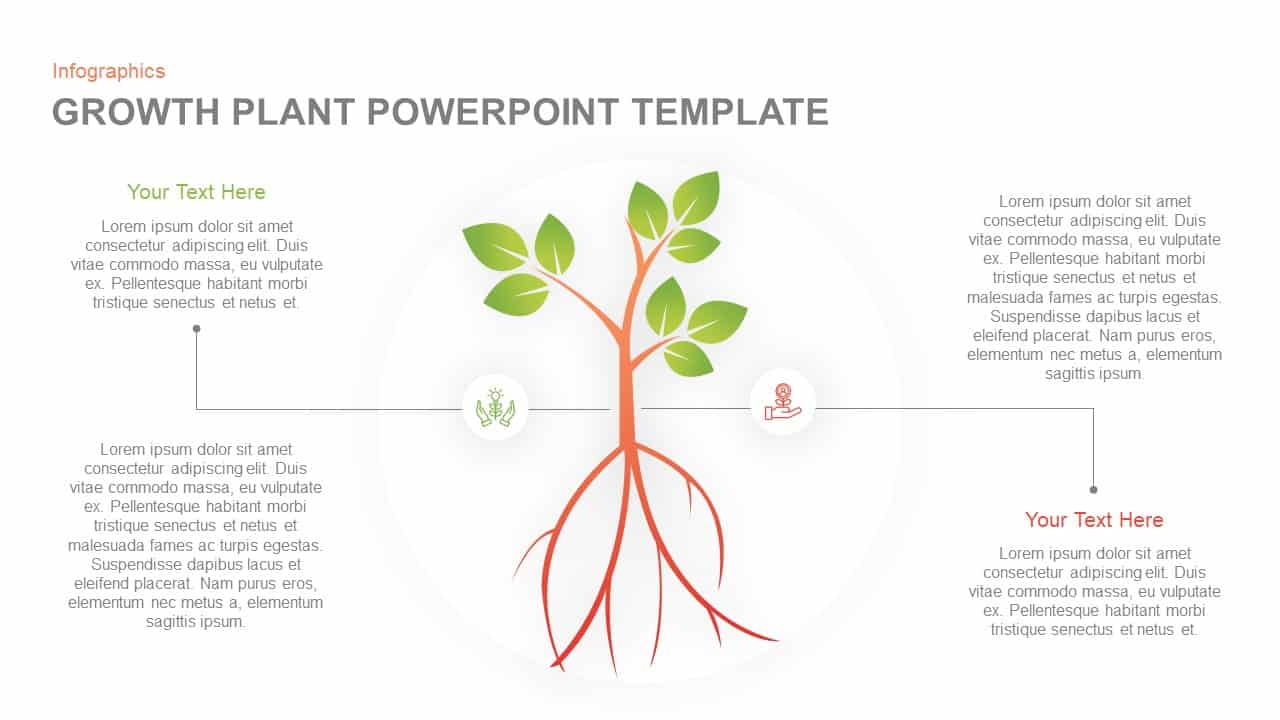
Growth Plant Infographics template for PowerPoint & Google Slides
Process
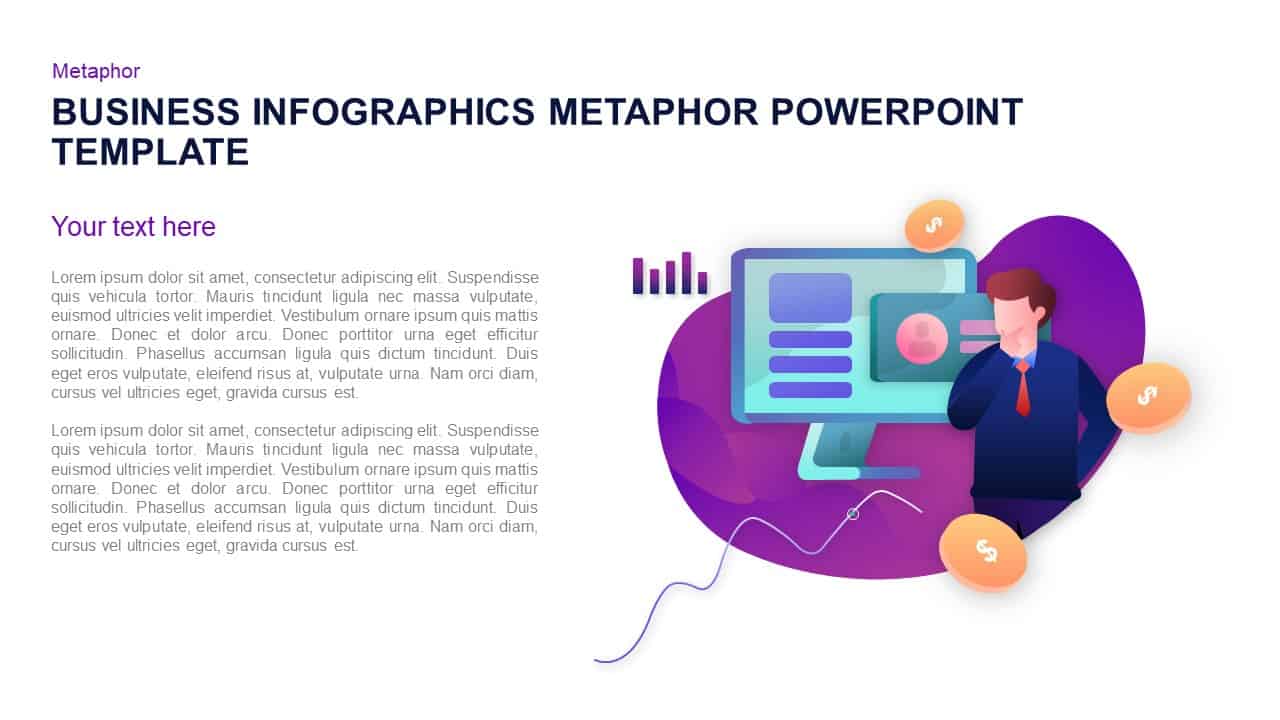
Business Growth Infographic Metaphor Template for PowerPoint & Google Slides
Revenue
Dynamic Growth Arrow Step Infographic Template for PowerPoint & Google Slides
Process
Plant Growth Lifecycle Infographic Template for PowerPoint & Google Slides
Process
Business Growth Ladder to Cloud Metaphor Template for PowerPoint & Google Slides
Vision and Mission
Business Growth Infographics Template for PowerPoint & Google Slides
Roadmap
Five-Step Growth Infographic Slide Template for PowerPoint & Google Slides
Process
4-Step Growth & Success Infographics Template for PowerPoint & Google Slides
Accomplishment
5-Step Growth Arrow Infographics Template for PowerPoint & Google Slides
Arrow
Greiner Growth Model Six-Phase Diagram Template for PowerPoint & Google Slides
Business Models
Sales Growth Dashboard: KPI Gauge & Line Template for PowerPoint & Google Slides
Revenue
5-Stage Financial Growth Timeline Template for PowerPoint & Google Slides
Timeline

Ansoff Growth Matrix Strategy Diagram Template for PowerPoint & Google Slides
Business Strategy
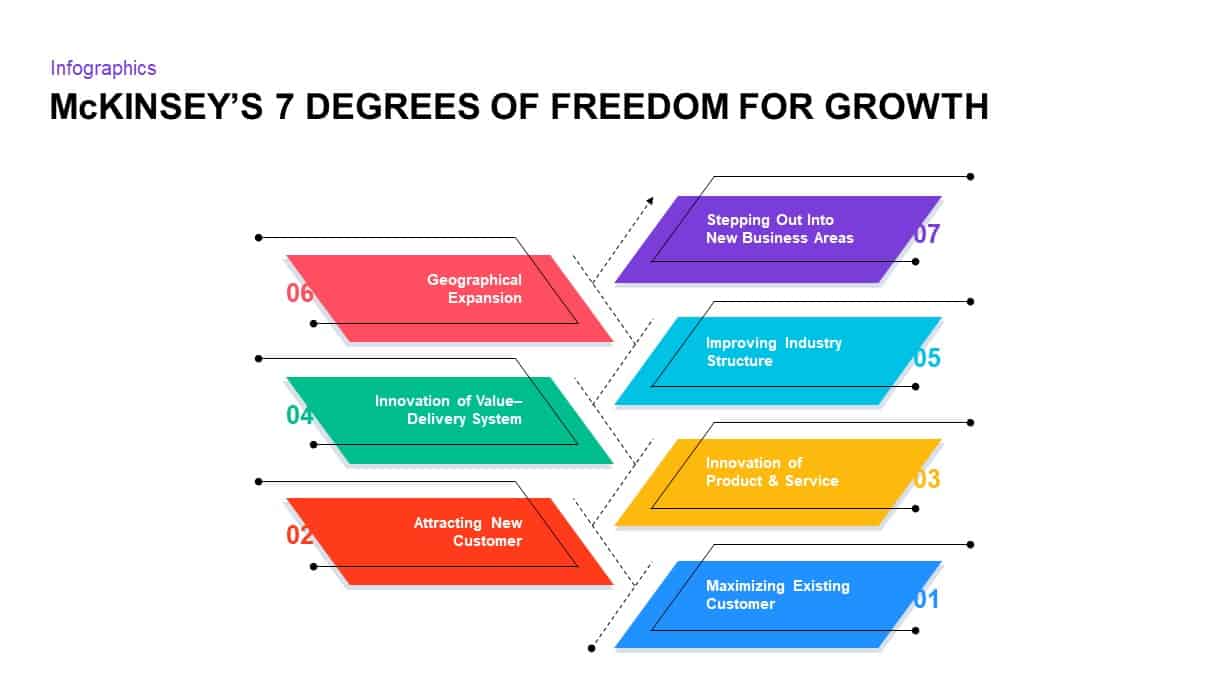
McKinsey’s 7 Degrees of Freedom Growth Template for PowerPoint & Google Slides
Process
Greiner’s Growth Model Curve template for PowerPoint & Google Slides
Infographics
Business Growth Plant Infographics Pack Template for PowerPoint & Google Slides
Process
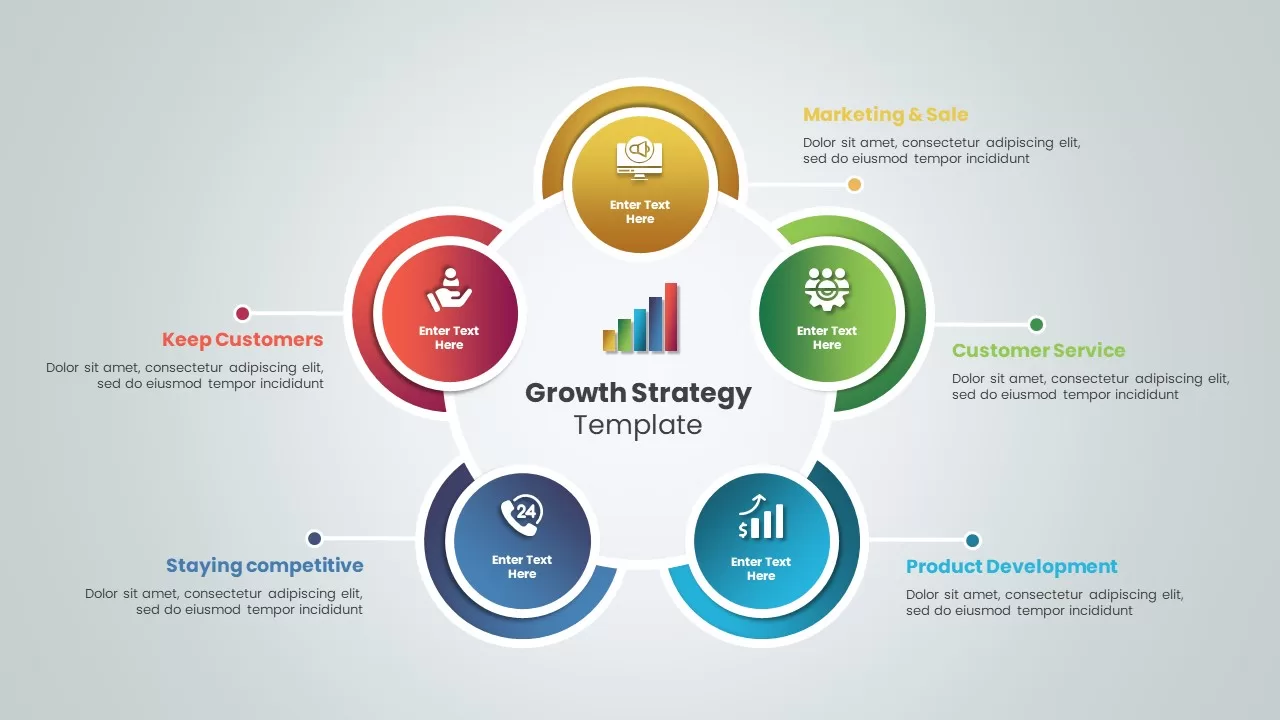
Growth Strategy Circular Diagram Template for PowerPoint & Google Slides
Circular
Data-driven GDP Growth Infographic Pack Template for PowerPoint & Google Slides
Infographics
3D Curved Arrow Growth Process Slide Template for PowerPoint & Google Slides
Process
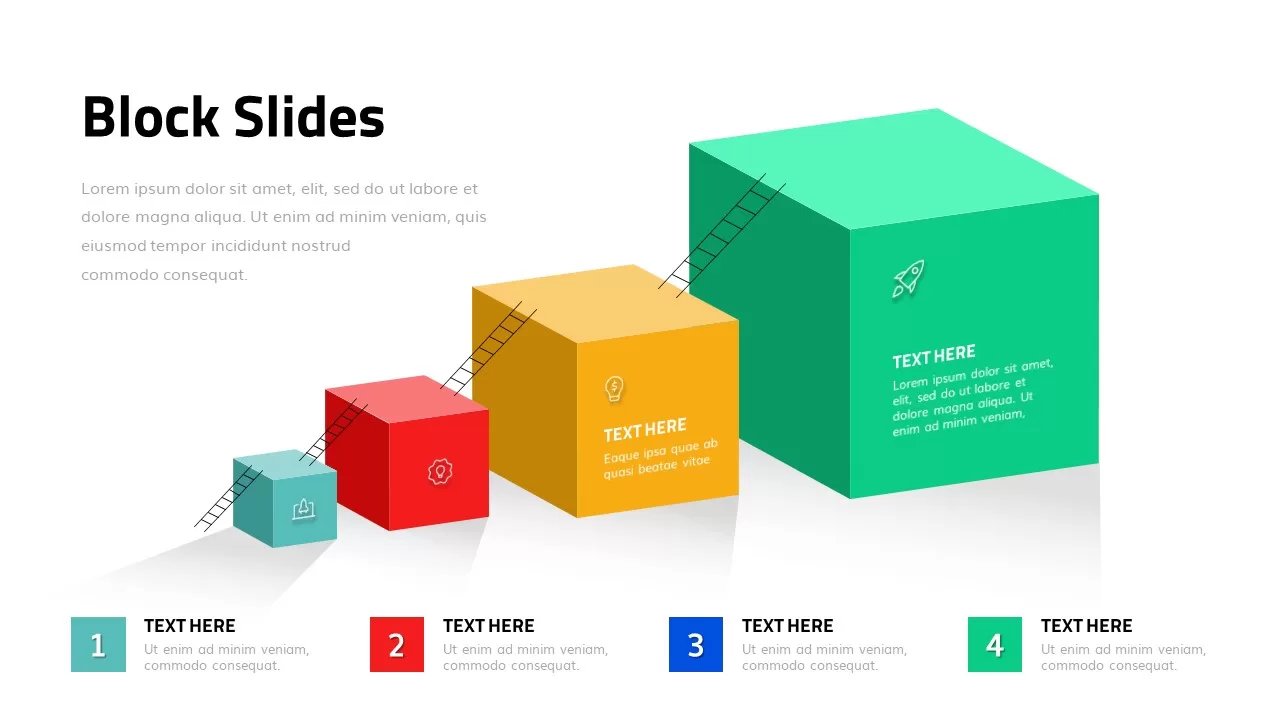
3D Growth Blocks Template for PowerPoint & Google Slides
Process
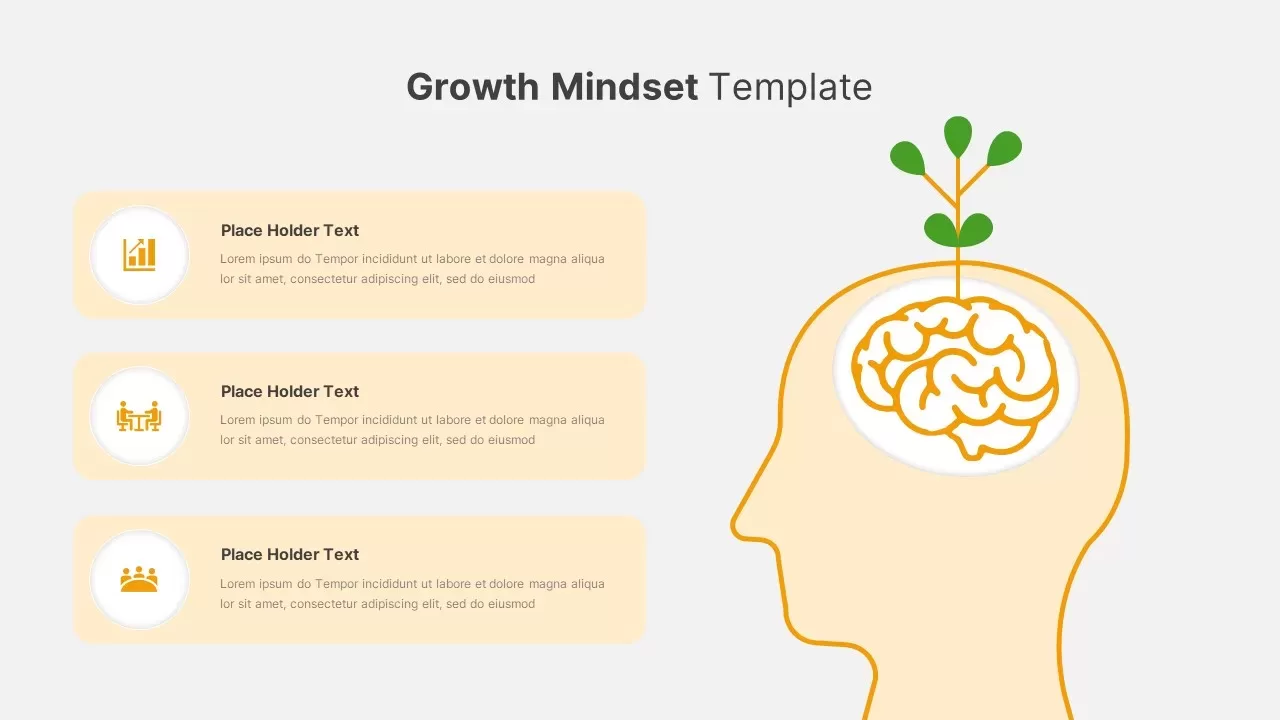
Growth Mindset Illustration Template for PowerPoint & Google Slides
Goals
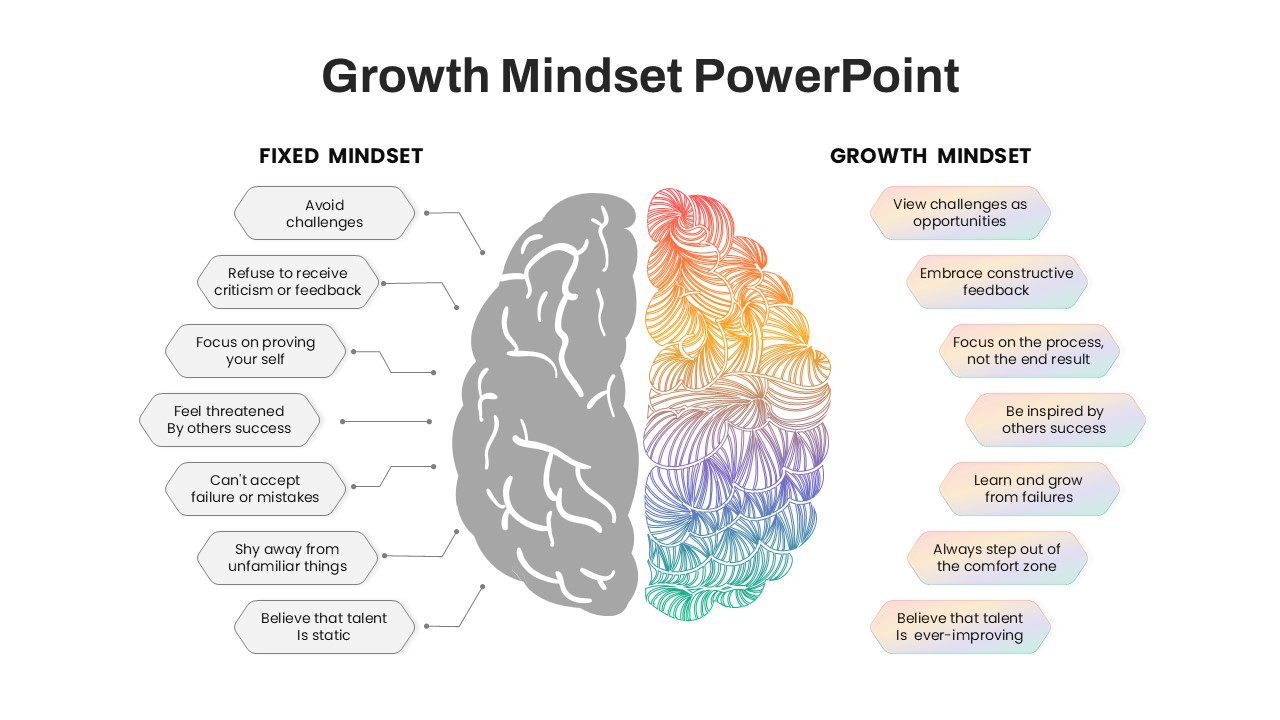
Growth vs Fixed Mindset Diagram Template for PowerPoint & Google Slides
Comparison
Abraham Maslow Growth Quote Slide Template for PowerPoint & Google Slides
Vision and Mission
Three-Stage S Curve Growth Diagram Template for PowerPoint & Google Slides
Process
Dynamic Investment & Finance Growth Template for PowerPoint & Google Slides
Finance
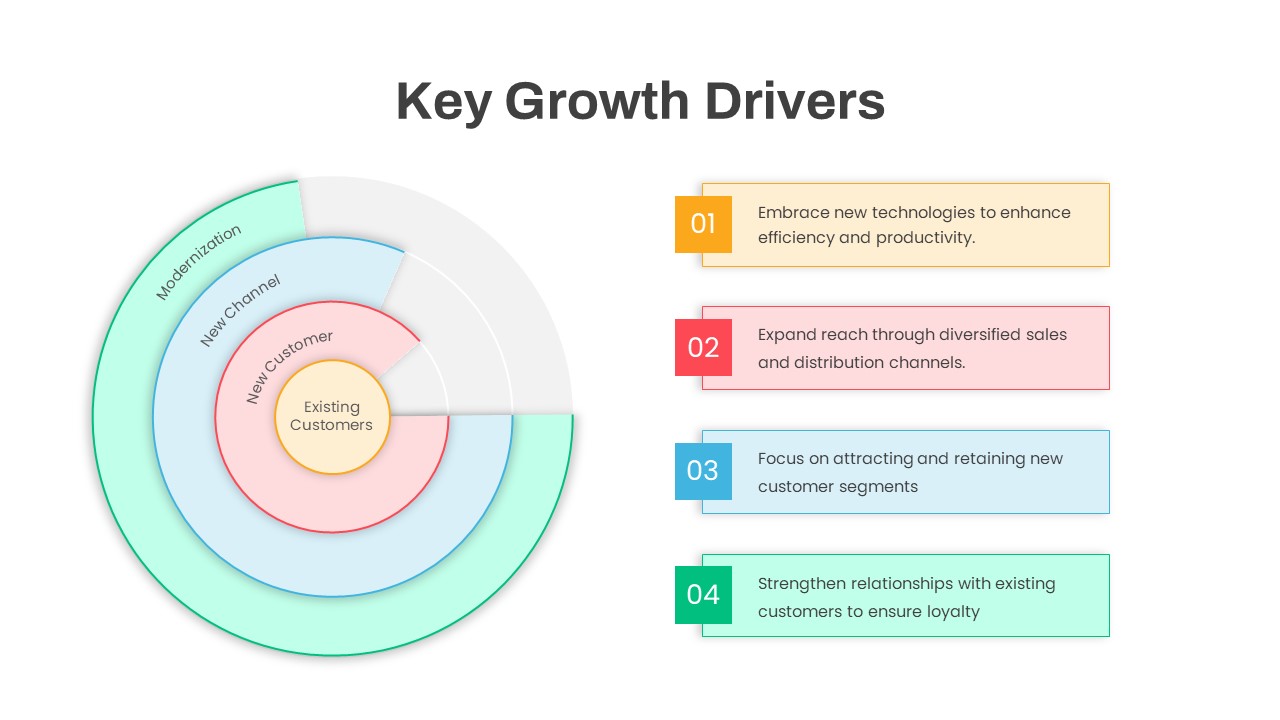
Circular Key Growth Drivers Diagram Template for PowerPoint & Google Slides
Circular
Business Growth Strategies Matrix Template for PowerPoint & Google Slides
Comparison

Growth Plant Nurture Business Development Template for PowerPoint & Google Slides
Decks
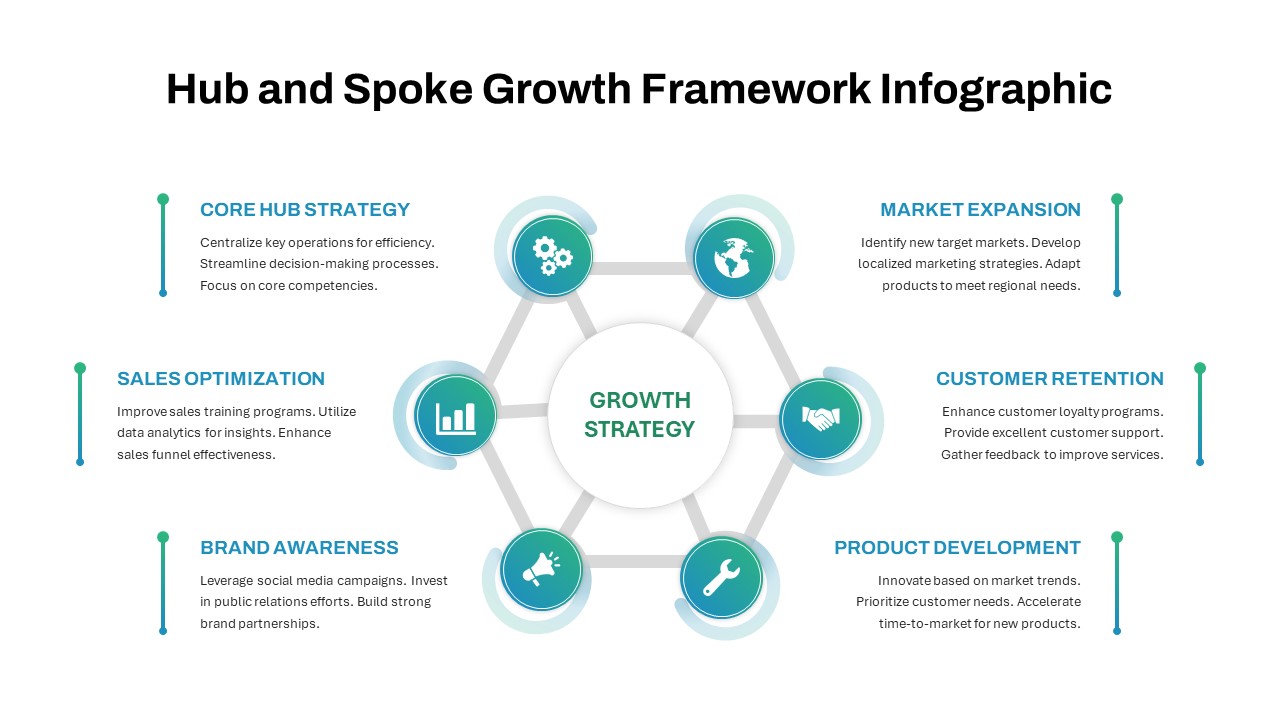
Hub and Spoke Growth Framework Template for PowerPoint & Google Slides
Circular

Quarterly Net Interest Income Growth Template for PowerPoint & Google Slides
Bar/Column
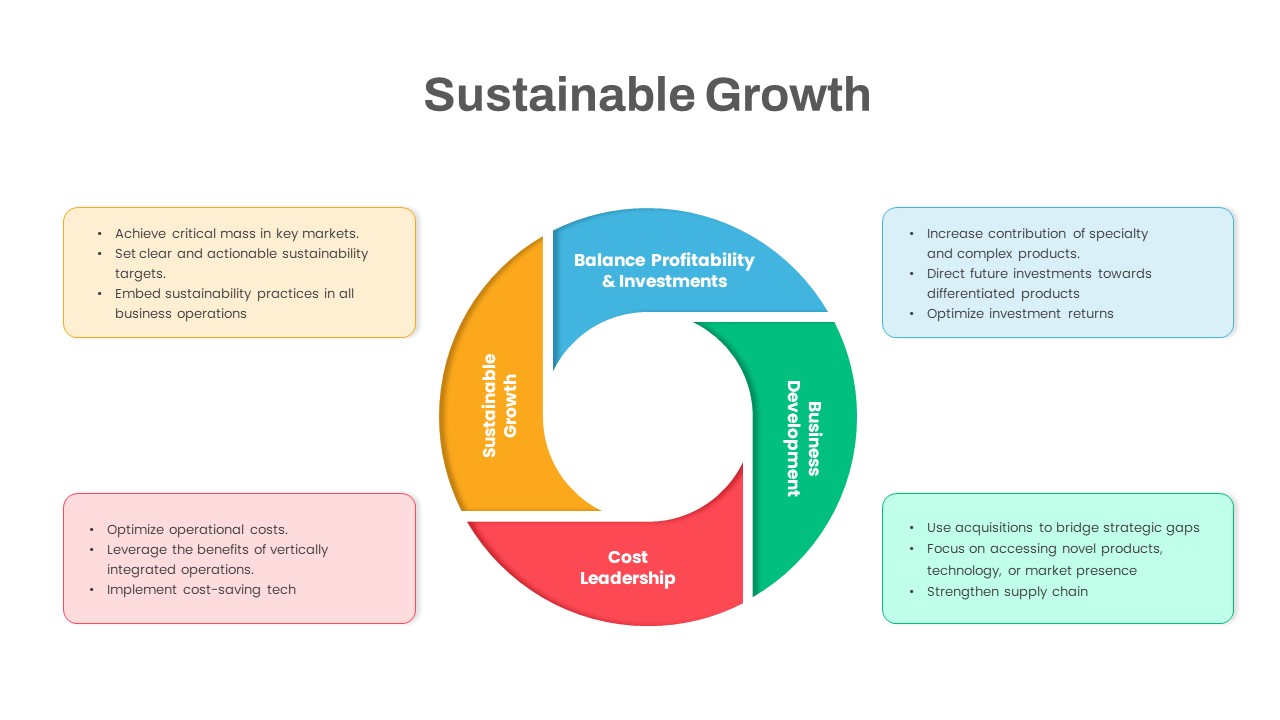
Sustainable Growth Circular Diagram Template for PowerPoint & Google Slides
Circular
Fixed vs Growth Mindset Matrix Template for PowerPoint & Google Slides
Comparison
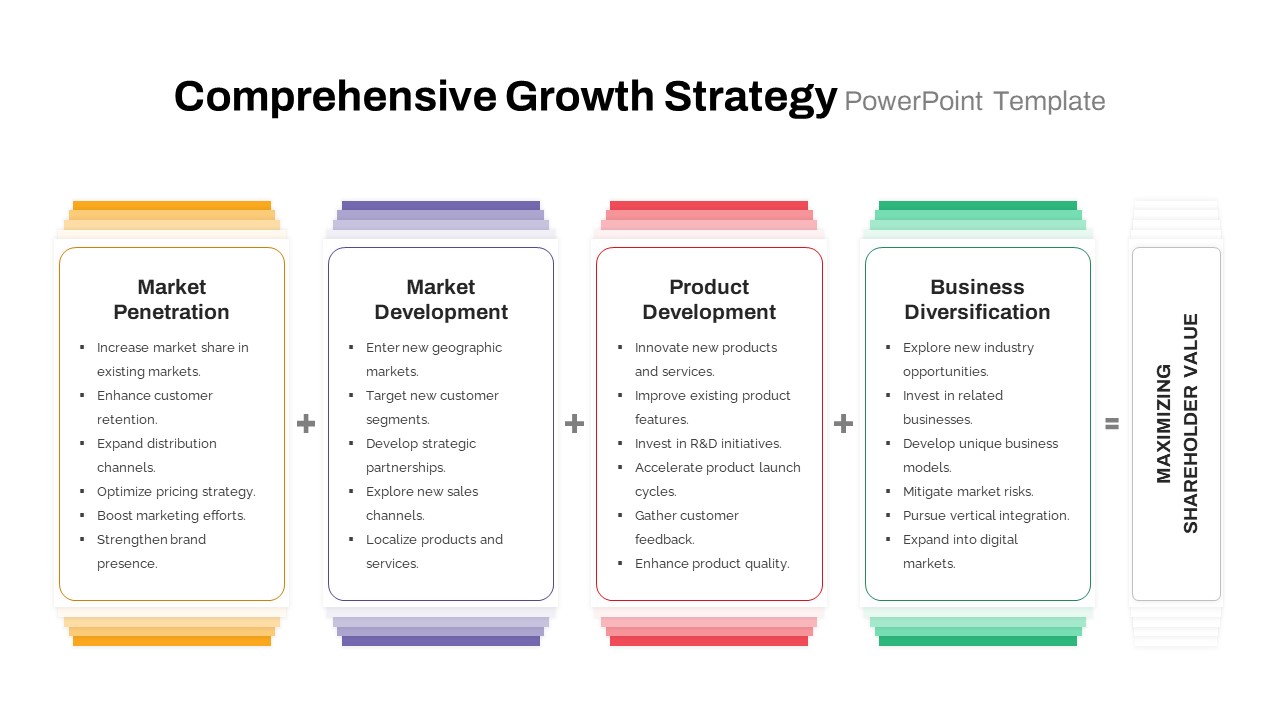
Comprehensive Growth Strategy Cards Template for PowerPoint & Google Slides
Infographics
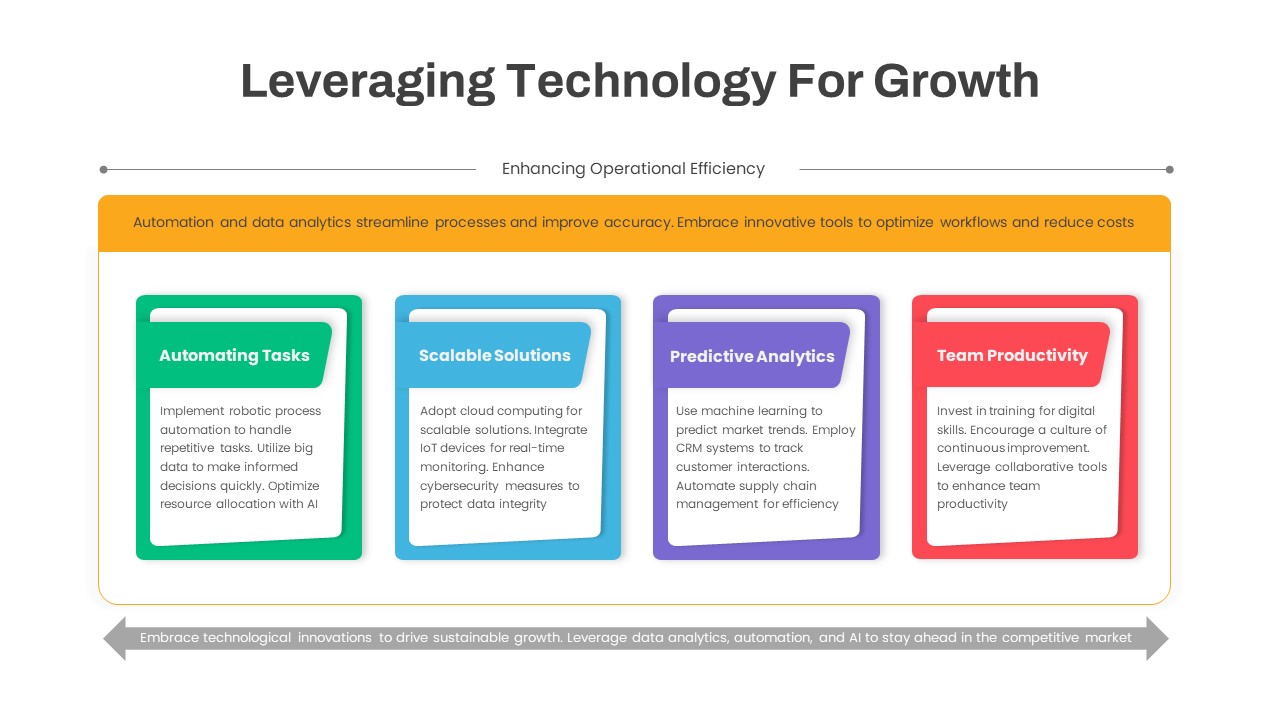
Leveraging Technology for Growth Slide Template for PowerPoint & Google Slides
Information Technology
Ansoff Growth Matrix Professional Template for PowerPoint & Google Slides
Comparison
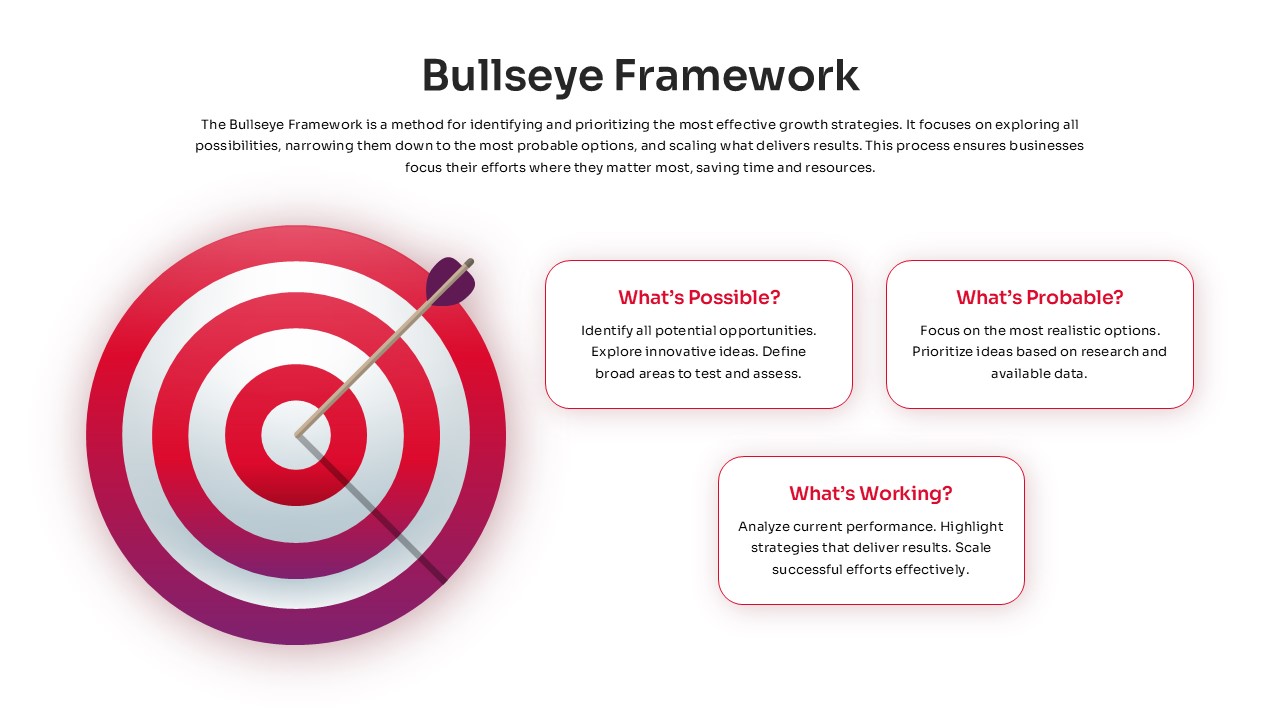
Bullseye Framework Growth Strategy Template for PowerPoint & Google Slides
Business Strategy
Modern Growth Hacking Venn Diagram Template for PowerPoint & Google Slides
Circular
Seeds Growth Cycle Business Model Template for PowerPoint & Google Slides
Process
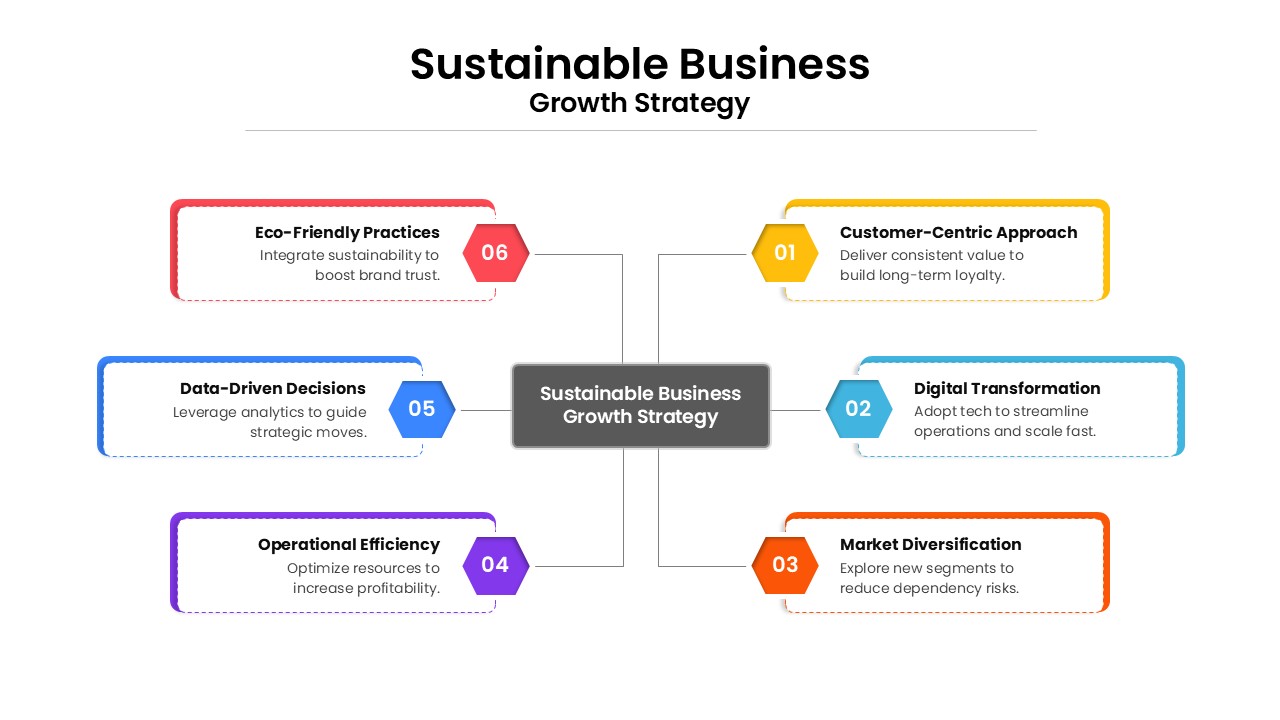
Sustainable Business Growth Strategy Template for PowerPoint & Google Slides
Process
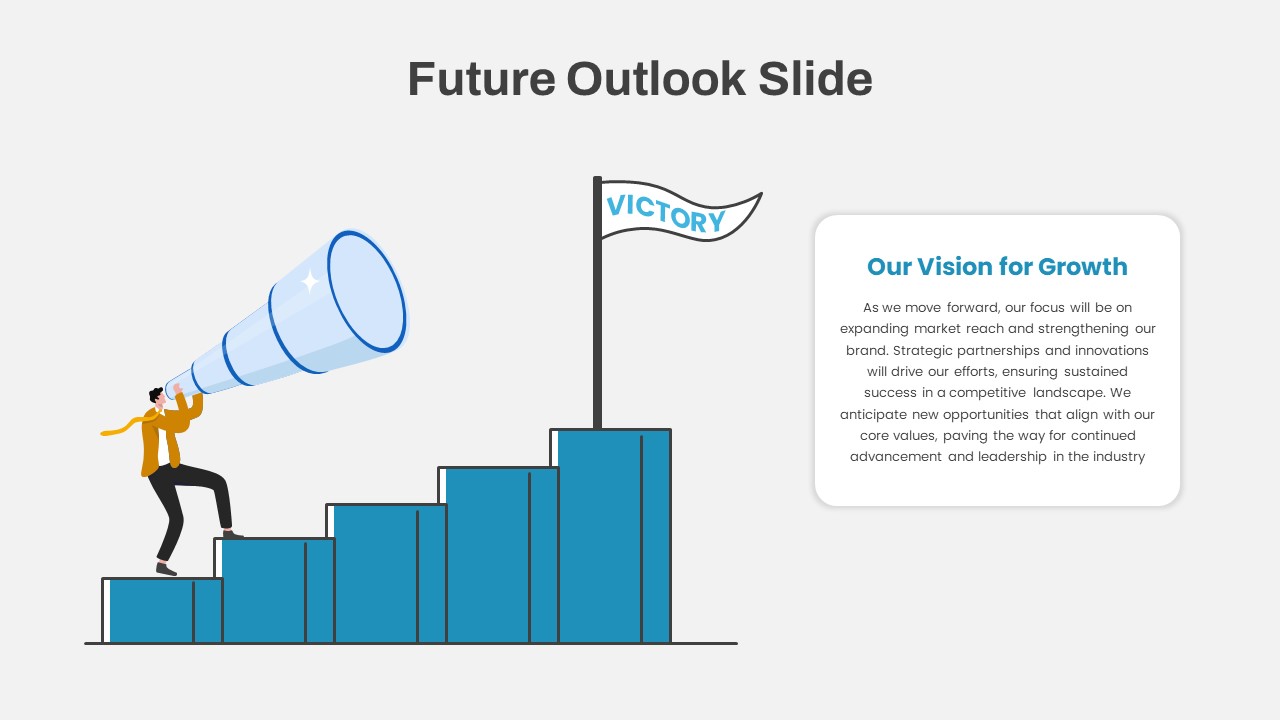
Future Outlook and Growth Strategy Slide Template for PowerPoint & Google Slides
Infographics
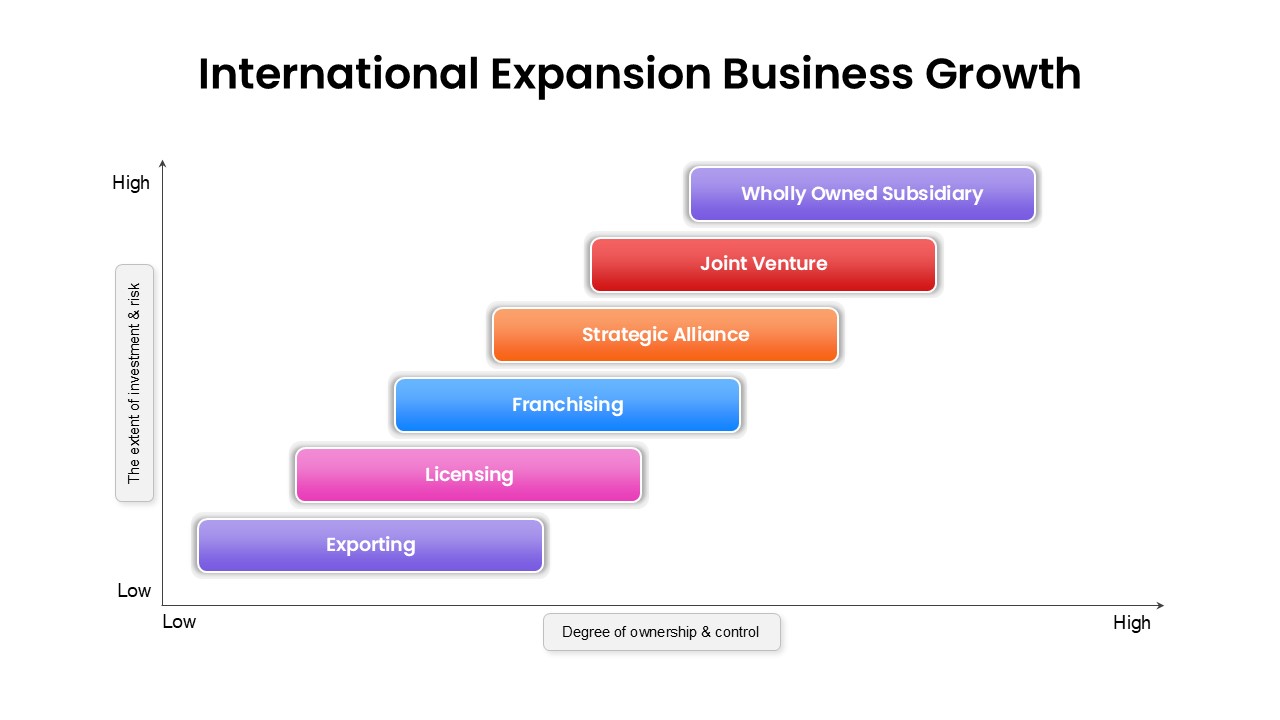
International Expansion Business Growth template for PowerPoint & Google Slides
Business Strategy
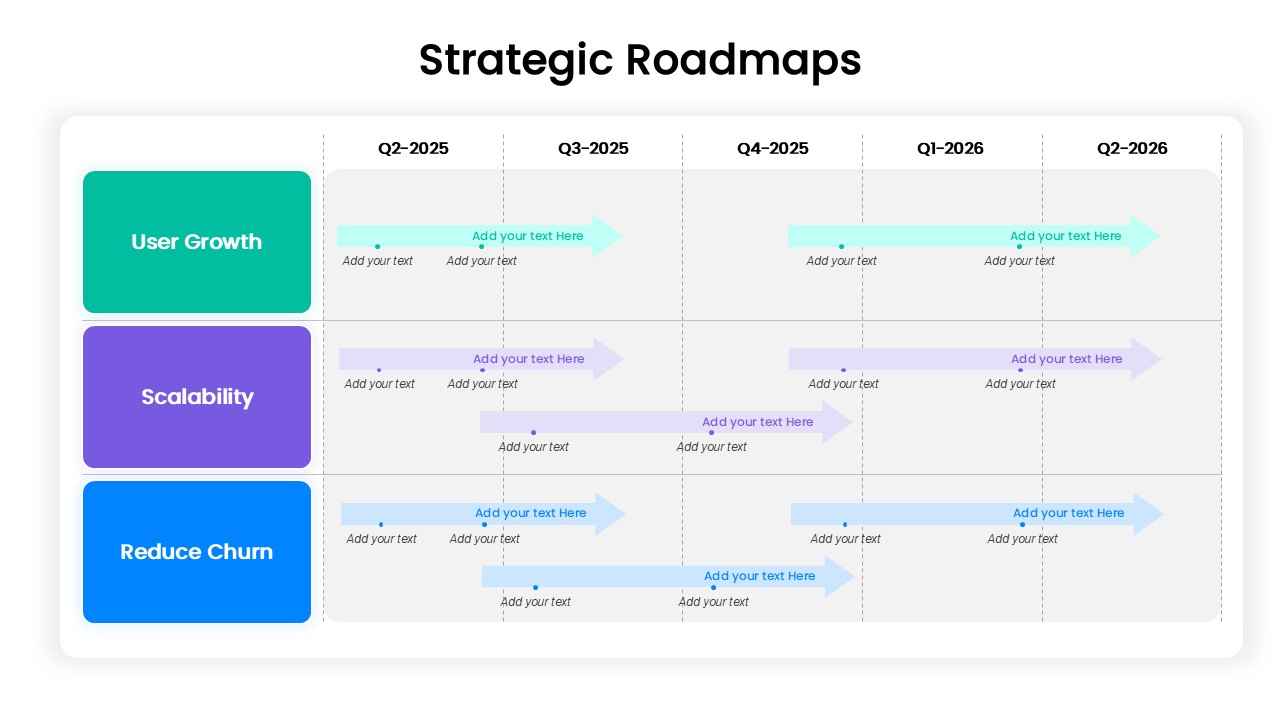
Strategic Roadmap for User Growth, Scalability, and Reducing Churn template for PowerPoint & Google Slides
Business
Flywheel Growth Cycle Diagram Template for PowerPoint & Google Slides
Circular
Business Growth Story timeline template for PowerPoint & Google Slides
Timeline
Personal Growth Overview Template for PowerPoint & Google Slides
Business
Ansoff Growth Matrix Template for PowerPoint & Google Slides
Business Strategy