Abell’s 3D Cube Model Diagram Template for PowerPoint & Google Slides

Description
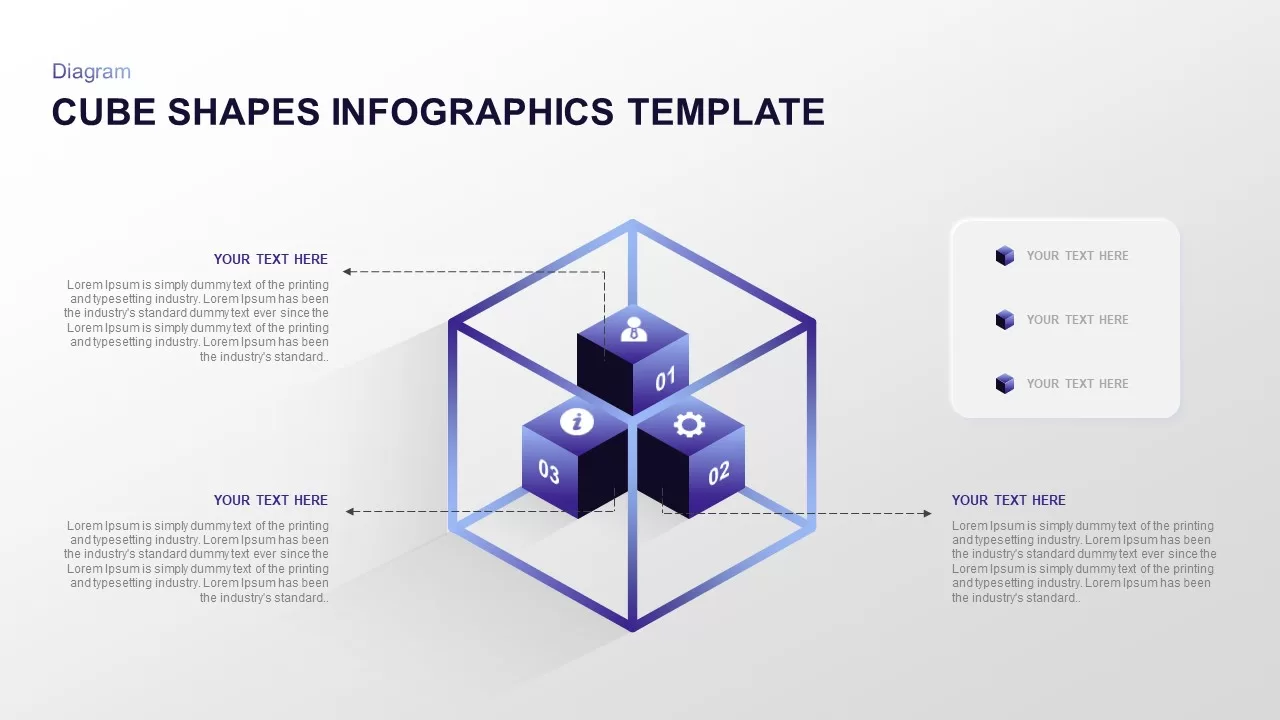
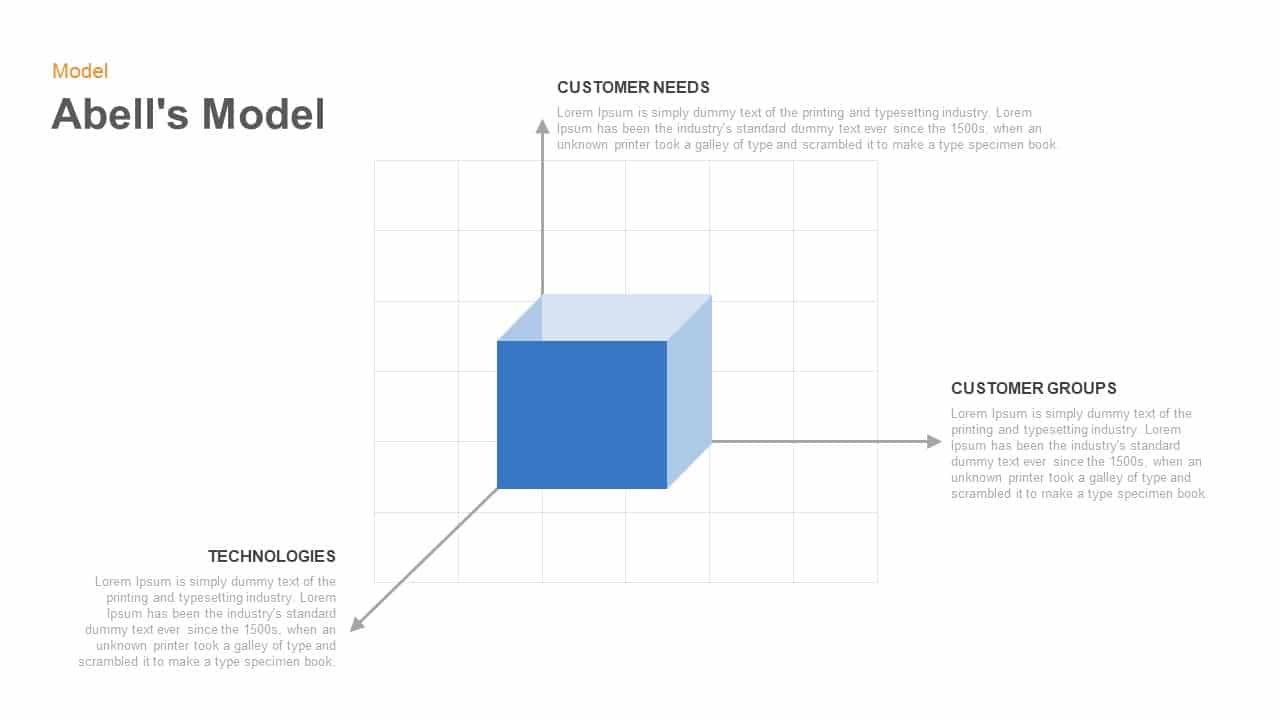
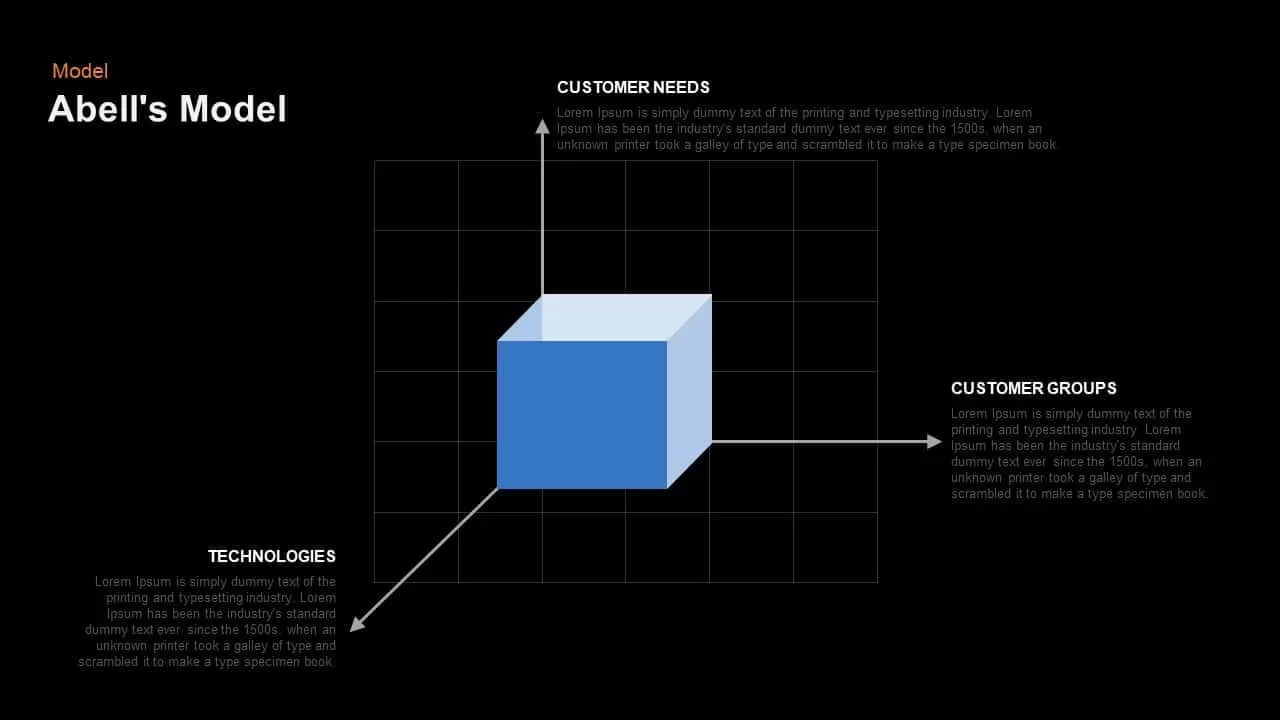
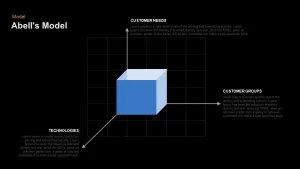
Craft powerful strategic analyses with this fully editable Abell’s Model slide, showcasing a three-dimensional cube anchored at the intersection of Customer Needs (vertical axis), Customer Groups (horizontal axis), and Technologies (diagonal axis). The central cube, rendered with a vibrant blue front face and lighter blue side planes, stands against a soft gray grid backdrop that emphasizes precise market-definition and dimensional mapping. Each axis extends into labeled arrowheads with placeholder text boxes for concise elaboration of critical criteria. The minimalist white canvas, coupled with crisp sans-serif typography, ensures clarity and professional polish.
Built on master slides for both PowerPoint and Google Slides, this diagram leverages vector shapes for seamless customization. Easily adjust axis labels, reposition the cube, or swap facet colors in seconds to align with your brand palette. Utilize entrance animations on each axis and the cube to guide audience focus, or apply fade transitions to text entries for stepwise storytelling. The high-resolution vector design supports large-format displays, print-ready handouts, and PDF exports without loss of fidelity.
Use the placeholder text above and beside each axis to articulate market segments, technology platforms, or customer pain points. The slide’s modular structure also allows you to overlay data charts, milestone markers, or performance indicators directly onto the grid for deeper analysis.
Who is it for
Management consultants, business strategists, and product managers will leverage this diagram to define market scope, segment target audiences, and assess technology enablers. Marketing leaders, innovation teams, and executive workshops can also deploy the model to align cross-functional stakeholders.
Other Uses
Beyond strategic market analysis, repurpose this slide to visualize product portfolio positioning, innovation roadmap planning, or risk-vs-opportunity matrices. Adapt the cube and axes to illustrate capability assessments, resource allocations, or comparative scenario planning for any industry context.
Login to download this file

Item ID
SB00921
Related Templates

3D Cube Problem-Solving Diagram Template for PowerPoint & Google Slides
Process

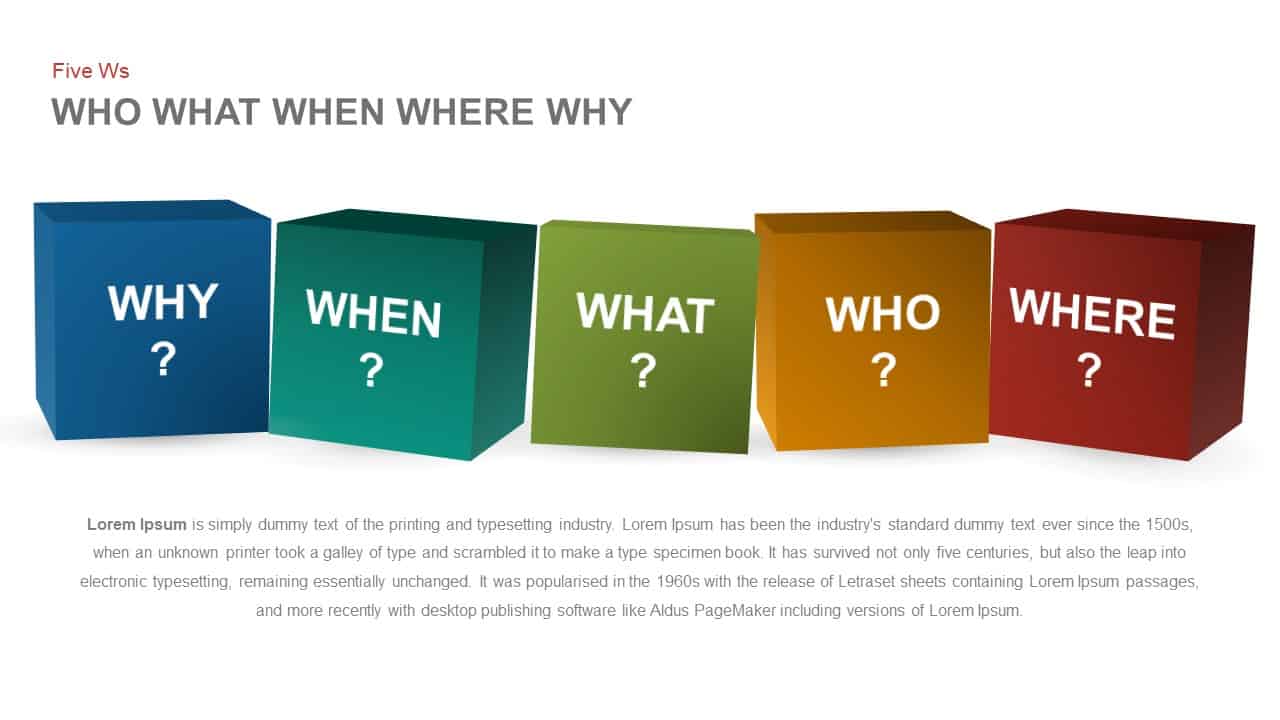
Five Ws Framework Cube Diagram Template for PowerPoint & Google Slides
Comparison
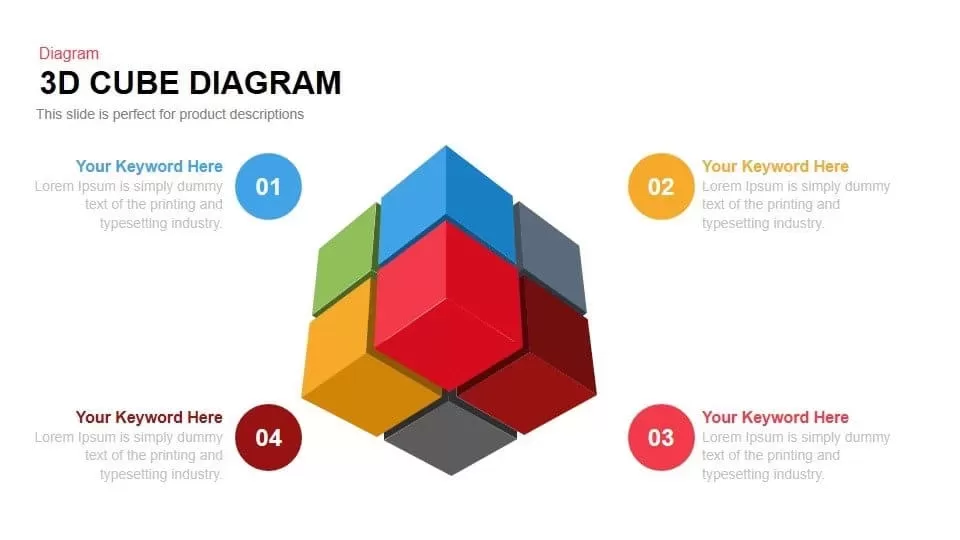
Circular 3D Cube Six-Segment Diagram Template for PowerPoint & Google Slides
Infographics
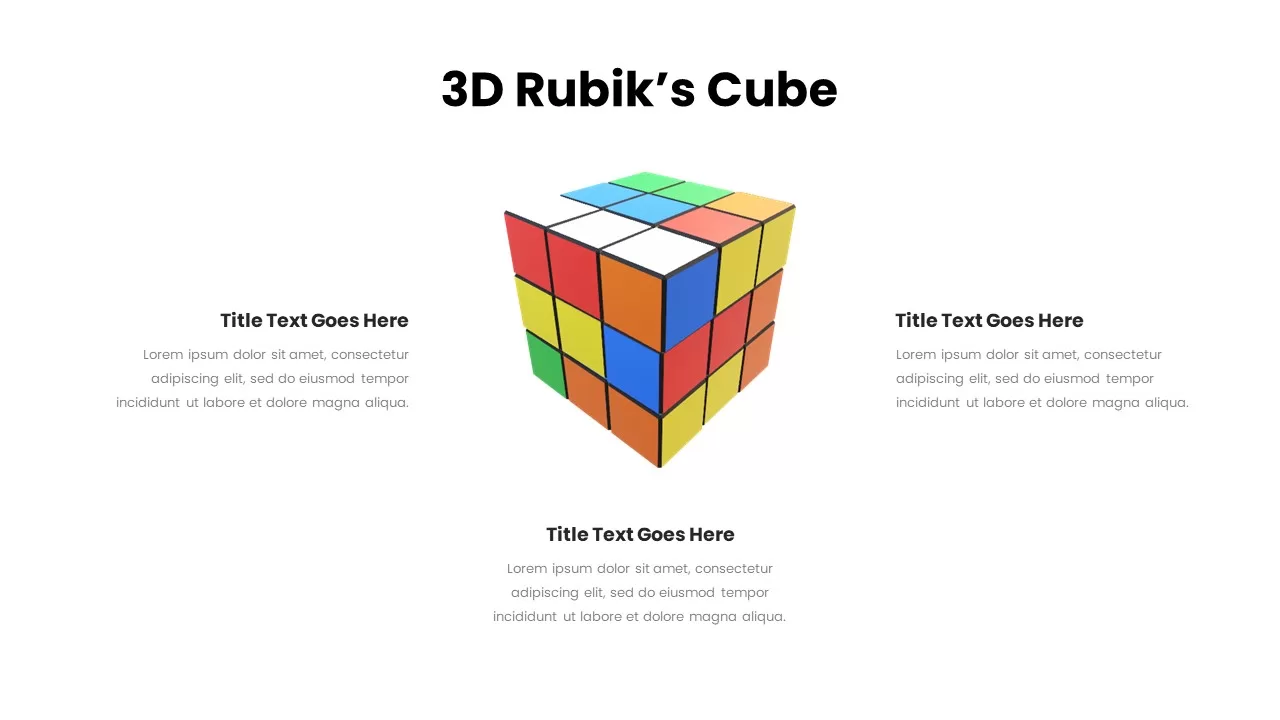
Dynamic 3D Rubik’s Cube Diagram Pack Template for PowerPoint & Google Slides
Infographics
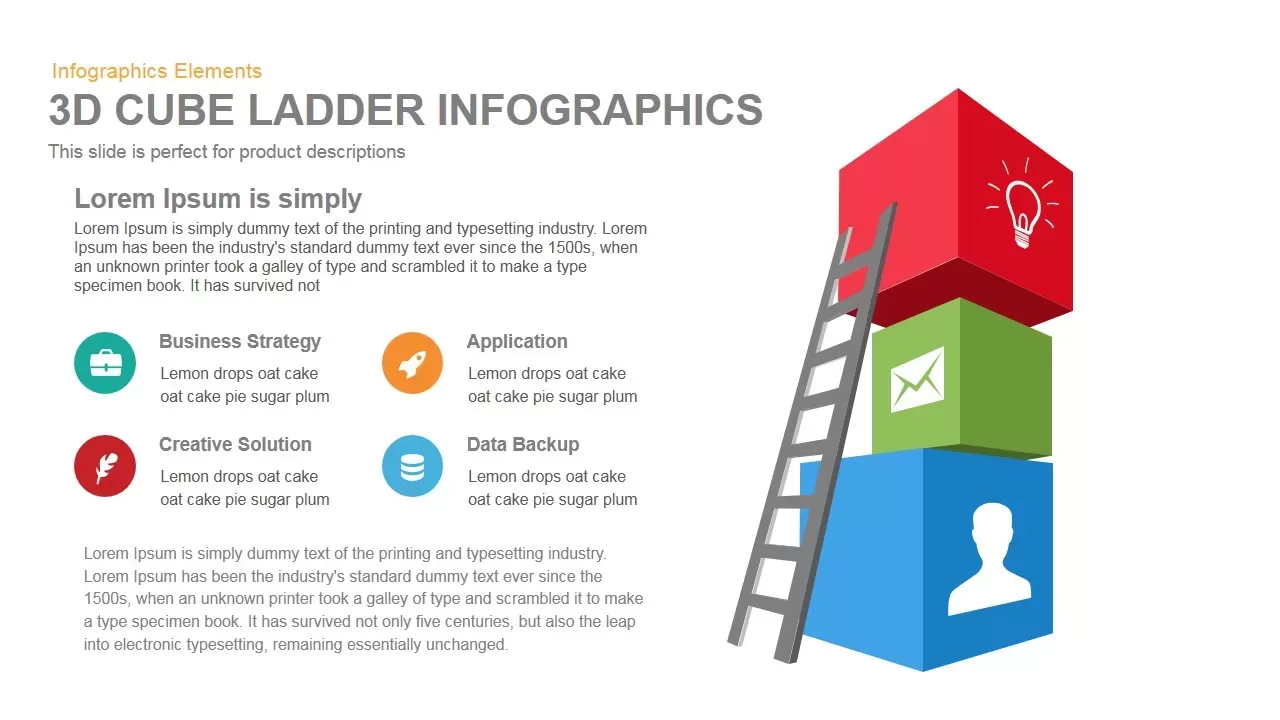
3D Cube Ladder template for PowerPoint & Google Slides
Process
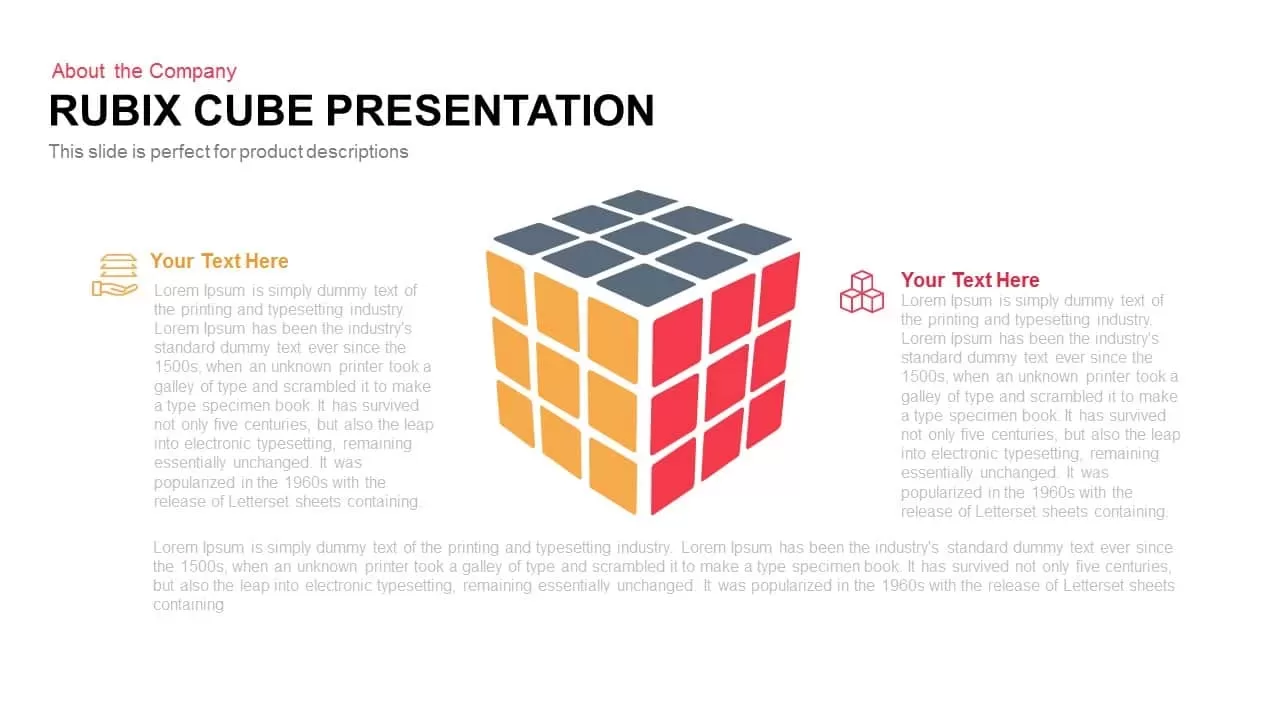
Rubix Cube Product Description Template for PowerPoint & Google Slides
Business
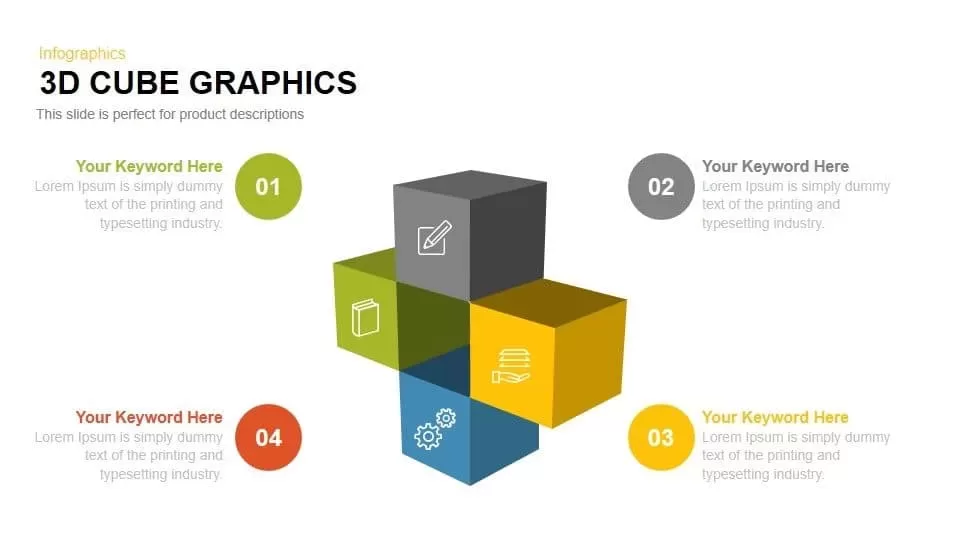
3D Cube Graphics for Four-Step Process Template for PowerPoint & Google Slides
Process
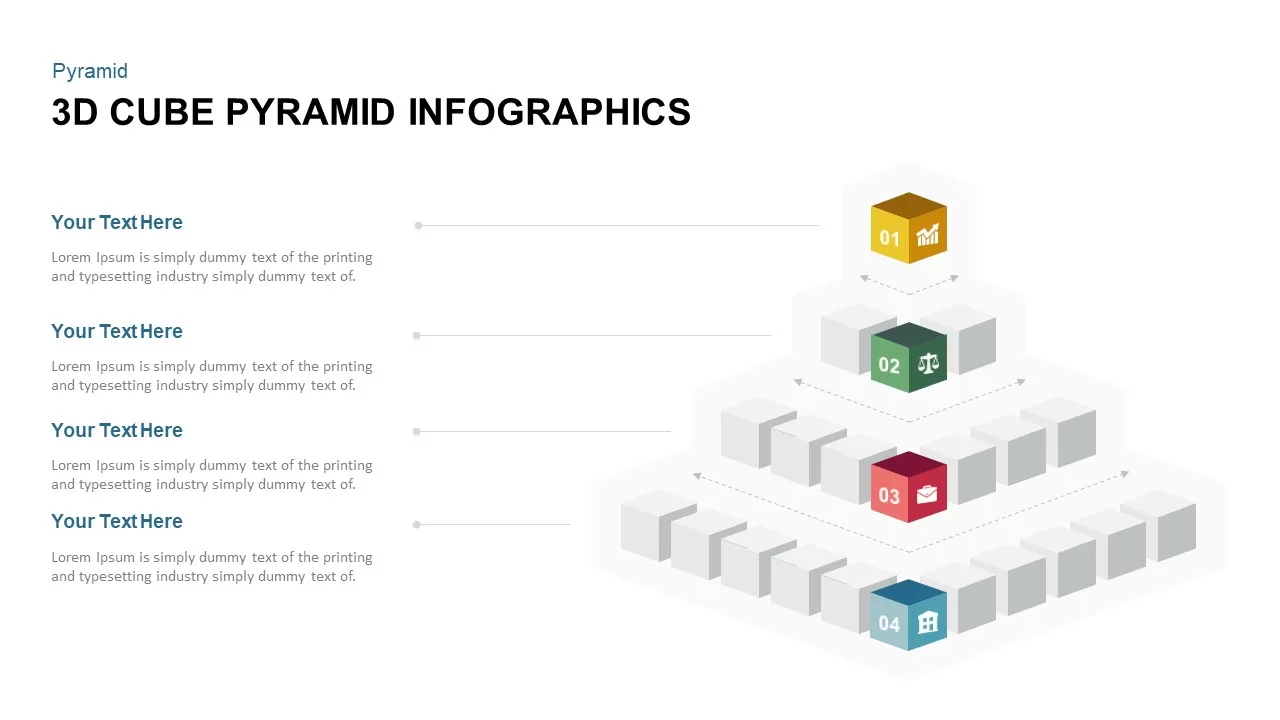
3D Cube Pyramid Infographics Slide Template for PowerPoint & Google Slides
Pyramid
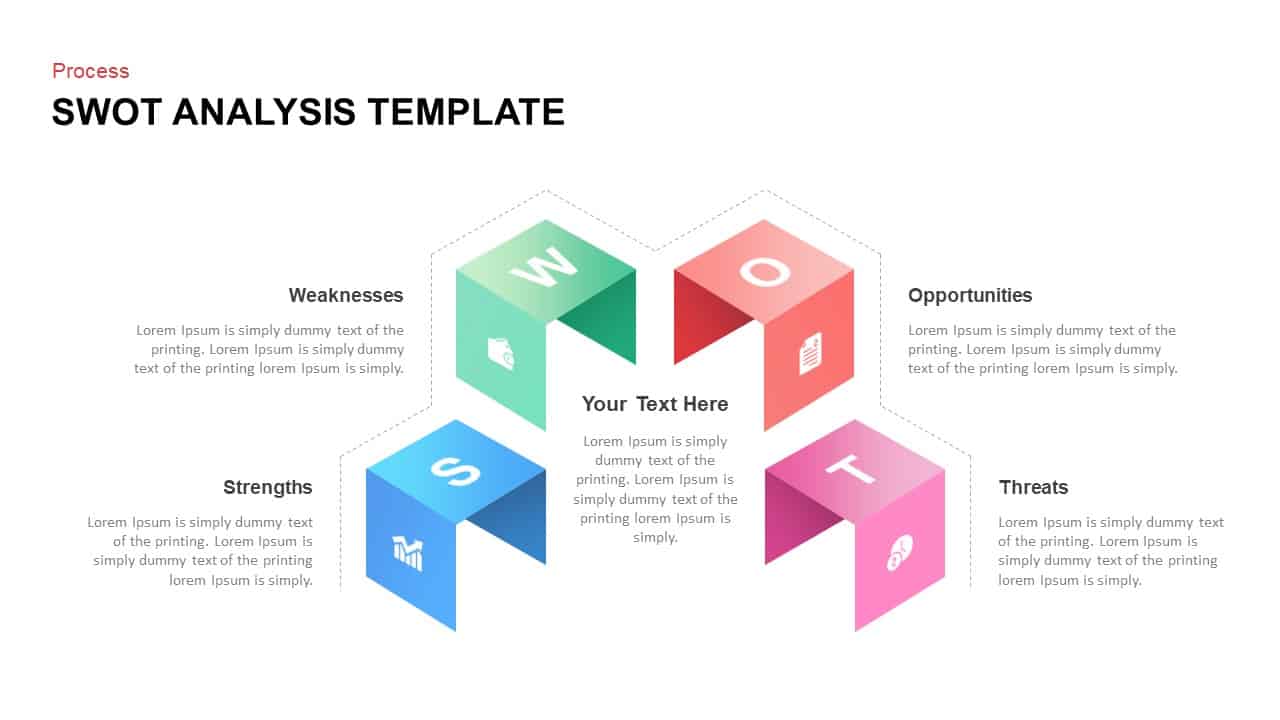
3D Cube SWOT Analysis Infographic Template for PowerPoint & Google Slides
SWOT
3D Cube Infographics template for PowerPoint & Google Slides
Process
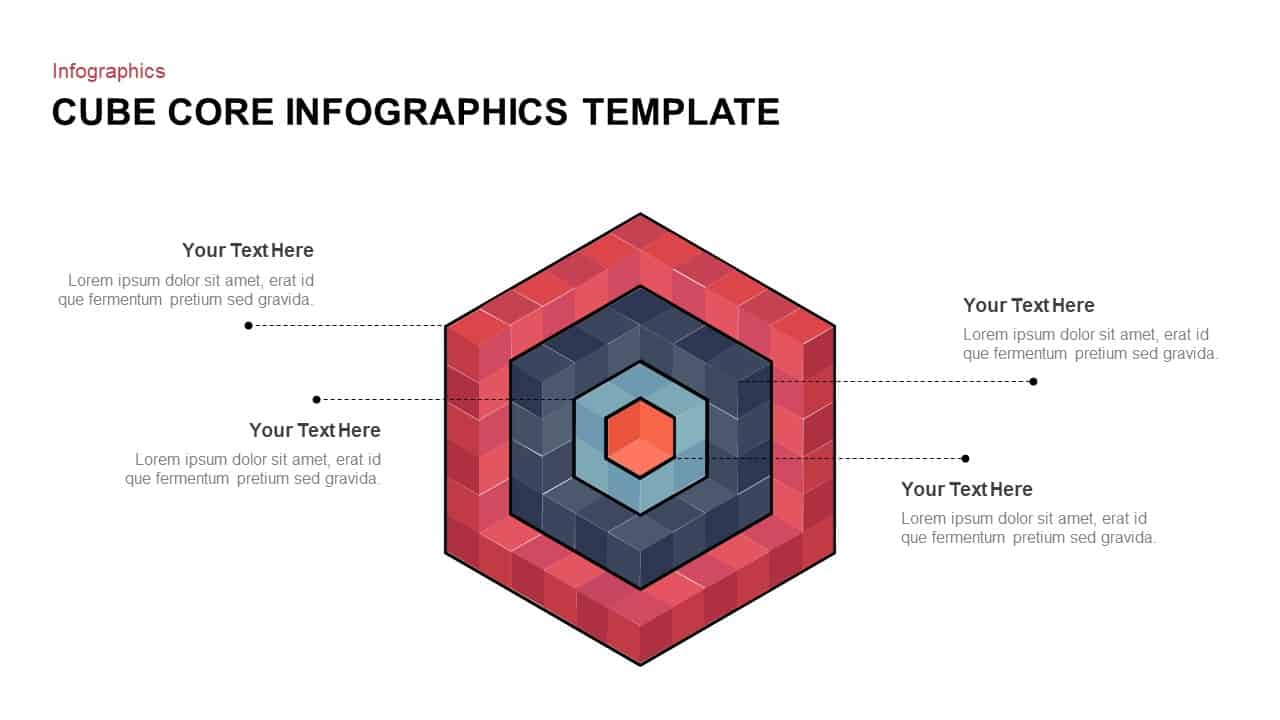
Cube Core Infographics Template for PowerPoint & Google Slides
Process
Isometric 3D Cube Shapes Infographics Template for PowerPoint & Google Slides
Infographics
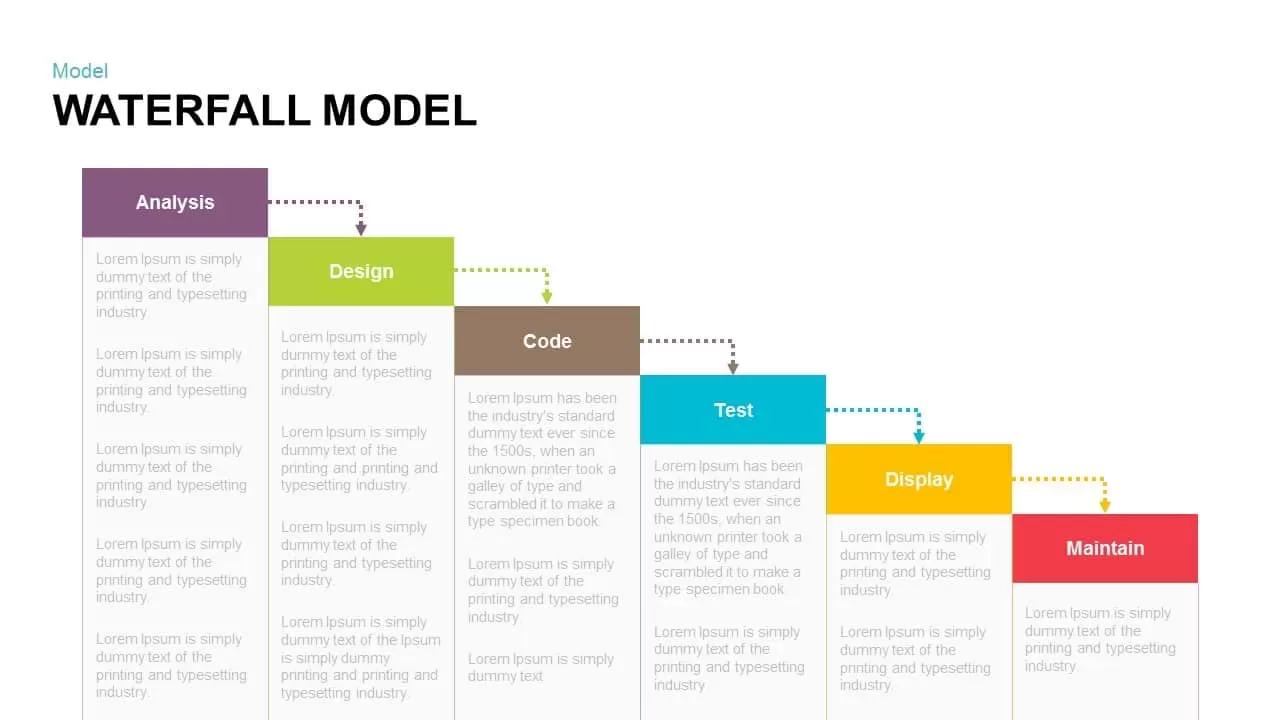
Waterfall Model Diagram Template for PowerPoint & Google Slides
Information Technology
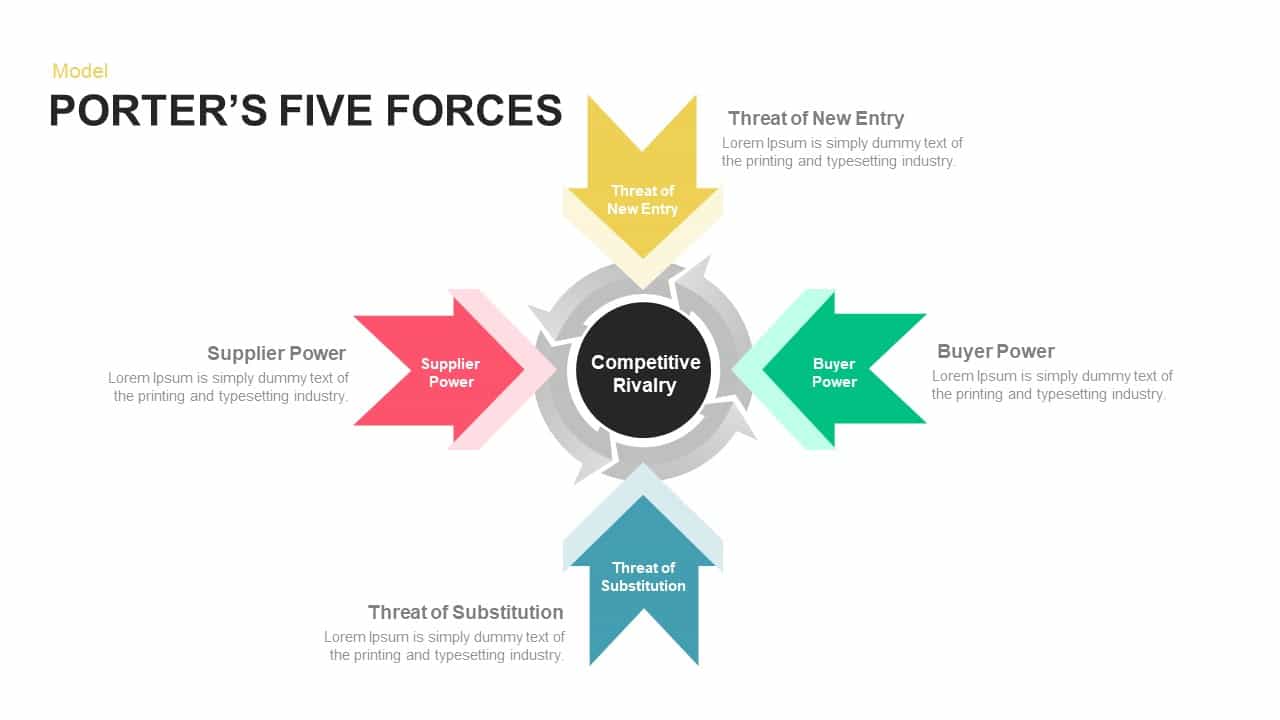
Porter’s Five Forces Model Diagram Template for PowerPoint & Google Slides
Competitor Analysis

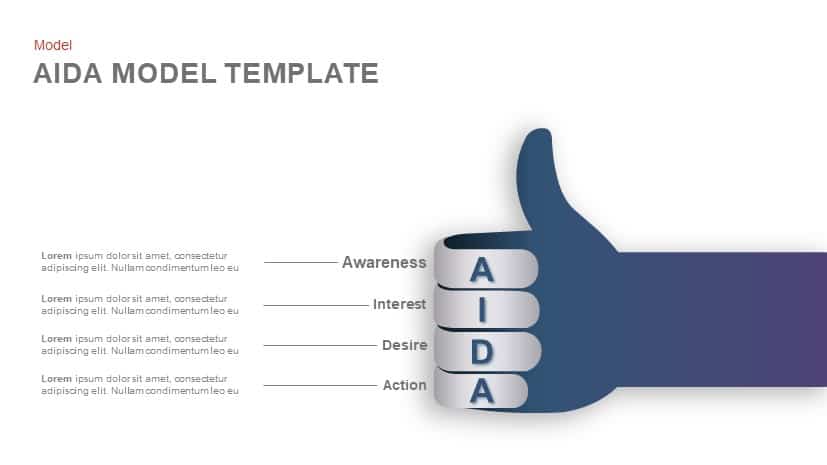
AIDA Model Funnel Thumb Diagram Template for PowerPoint & Google Slides
Process
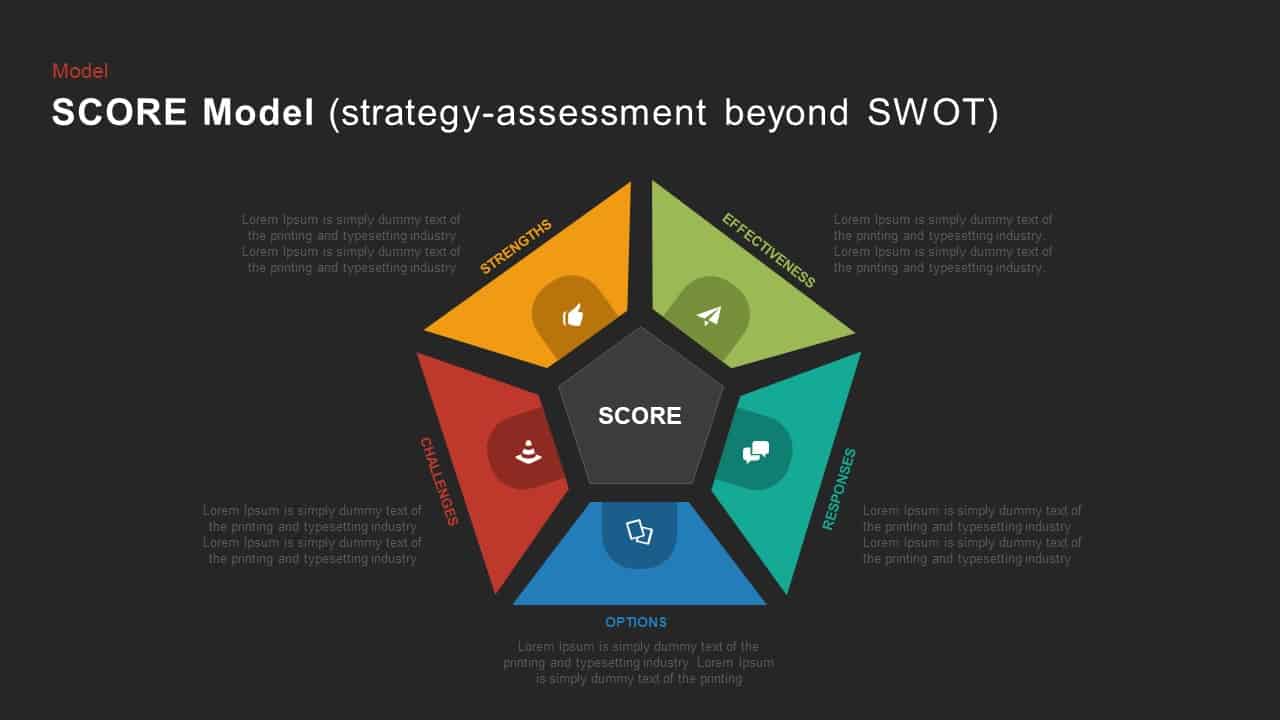
SCORE Model Pentagon Assessment Diagram Template for PowerPoint & Google Slides
Circular
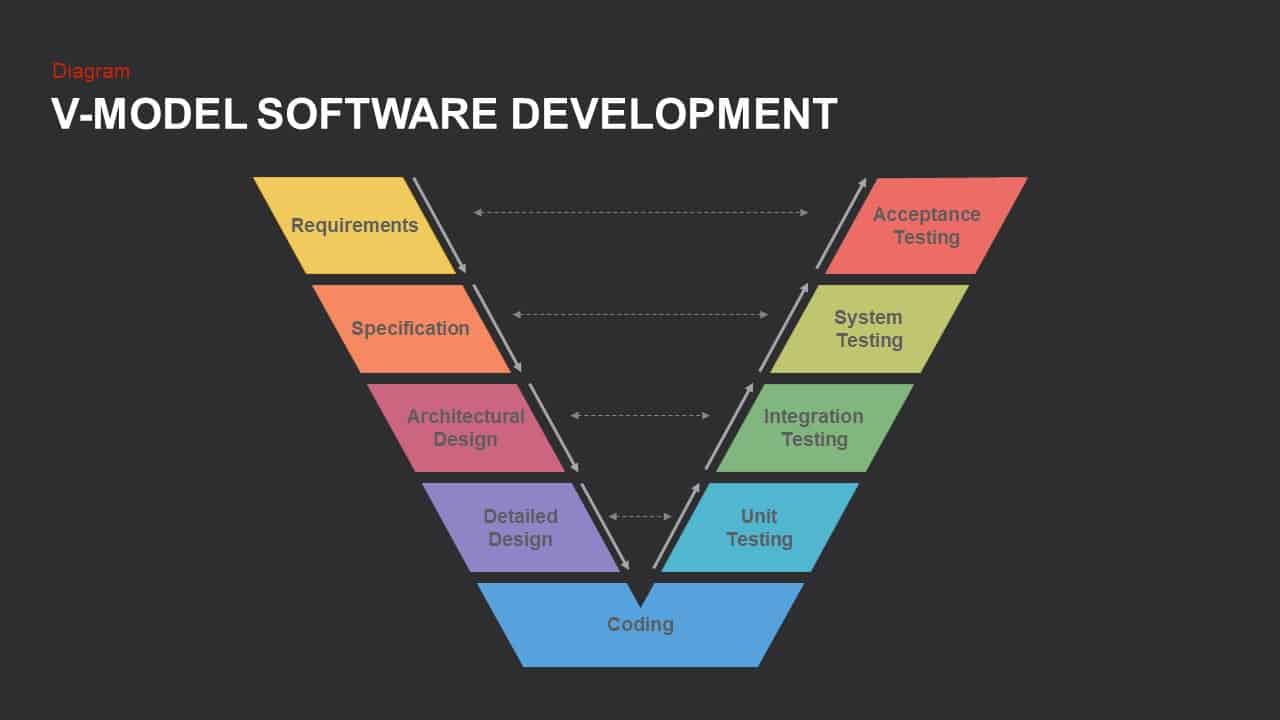
V-Model Software Development Diagram Template for PowerPoint & Google Slides
Software Development
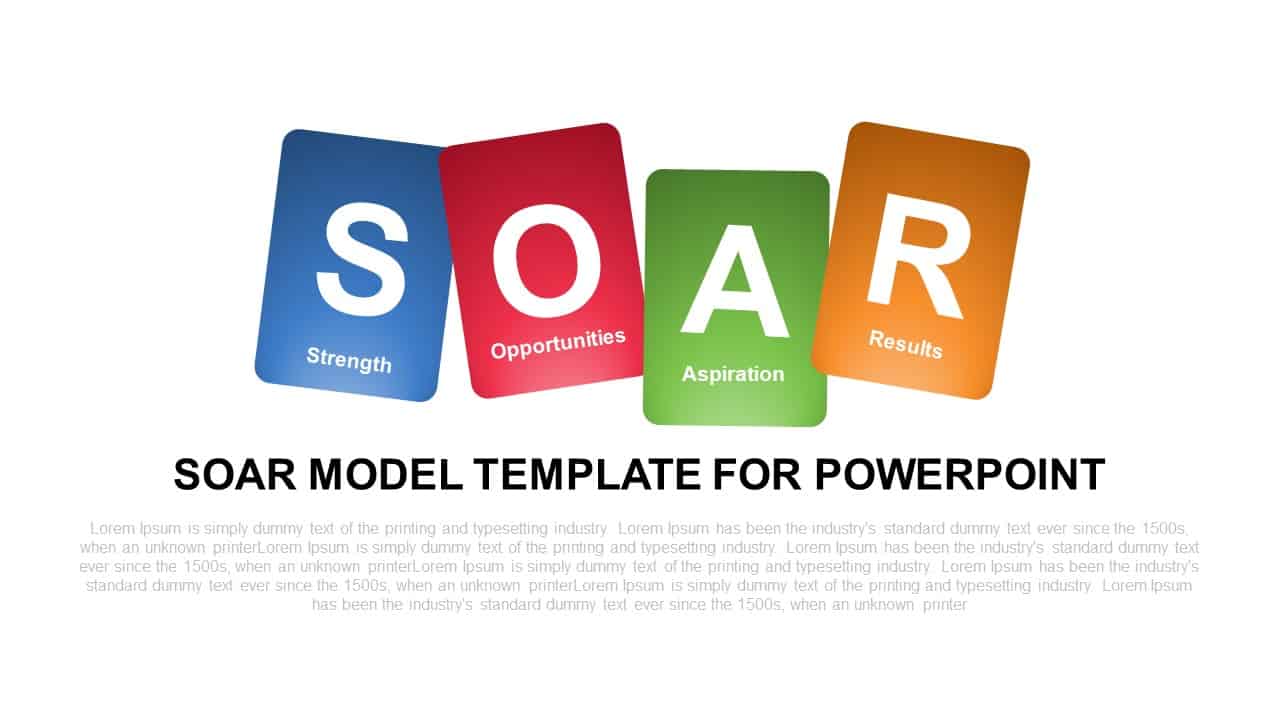
SOAR Strategic Model Card Diagram Template for PowerPoint & Google Slides
Process
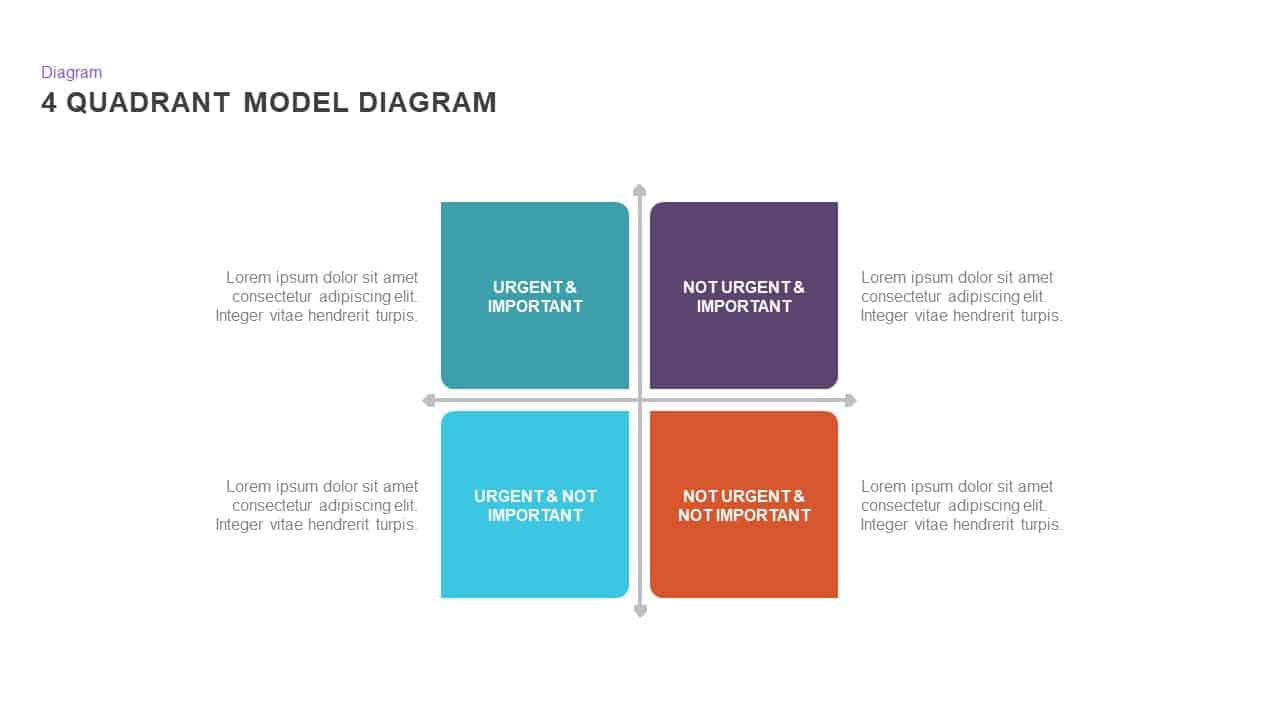
4 Quadrant Model Diagram template for PowerPoint & Google Slides
Process
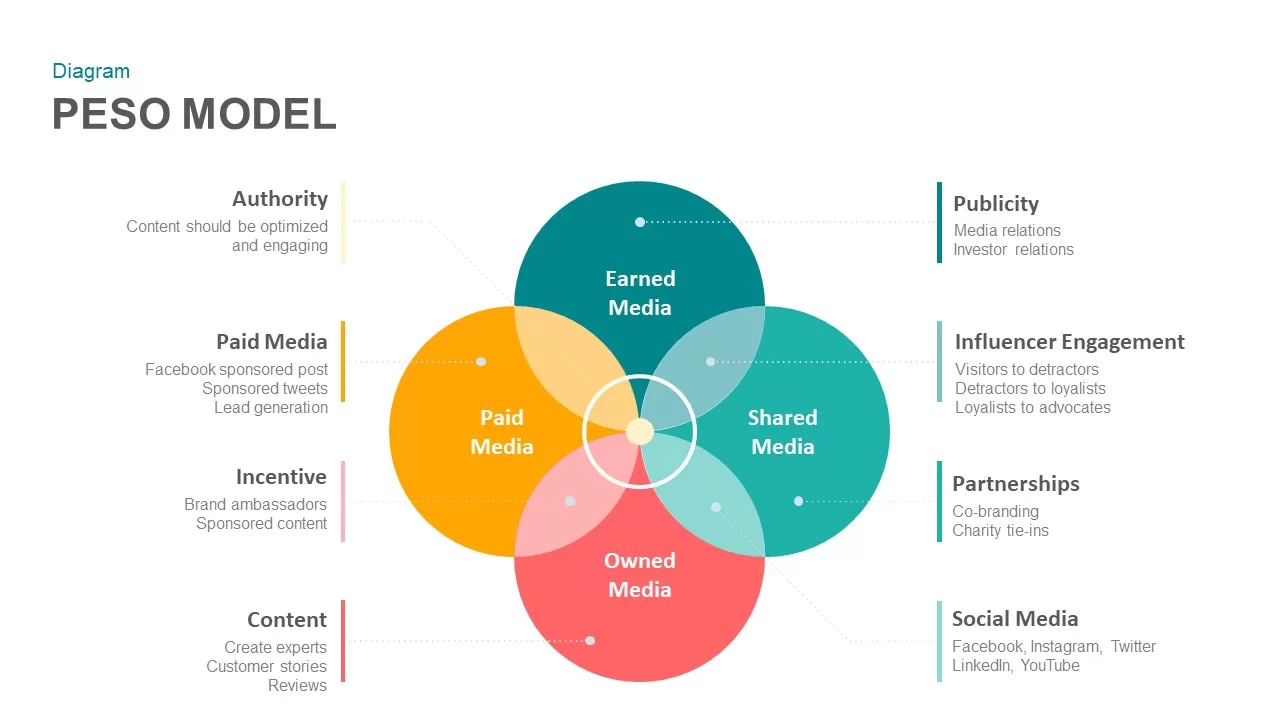
PESO Model Marketing Diagram Template for PowerPoint & Google Slides
Digital Marketing
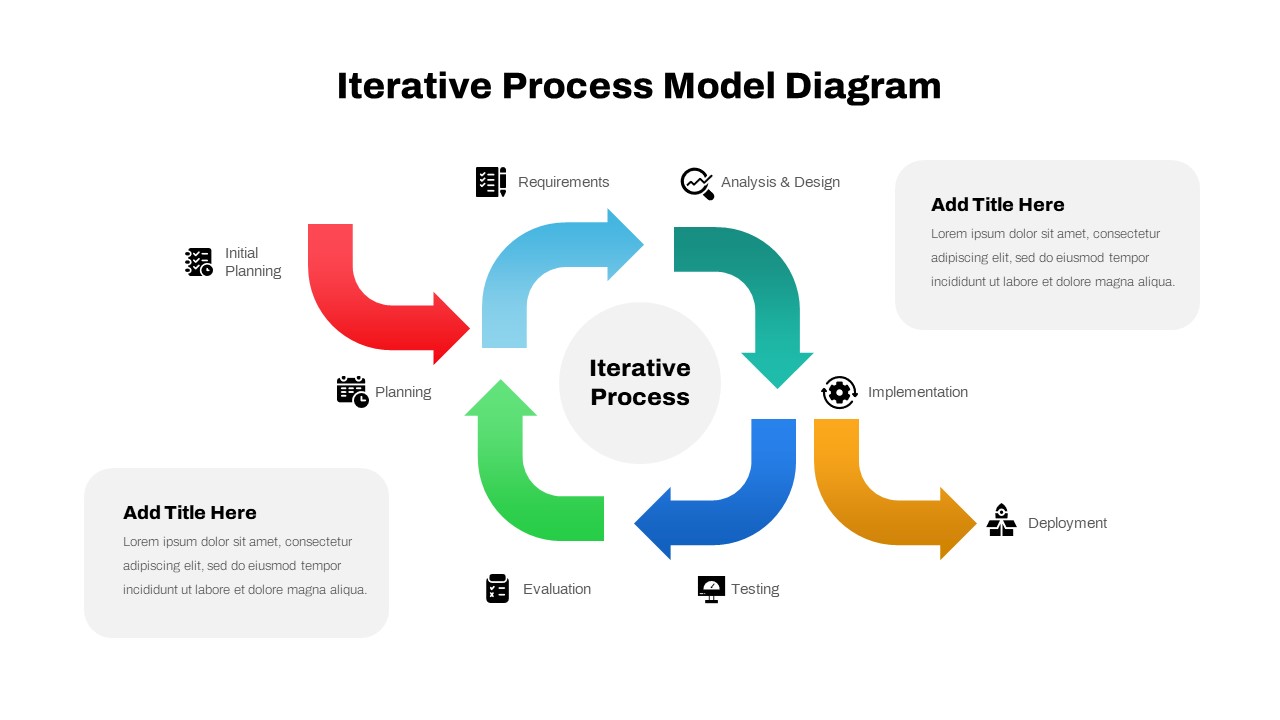
Iterative Process Model Diagram Template for PowerPoint & Google Slides
Process
Greiner Growth Model Six-Phase Diagram Template for PowerPoint & Google Slides
Business Models
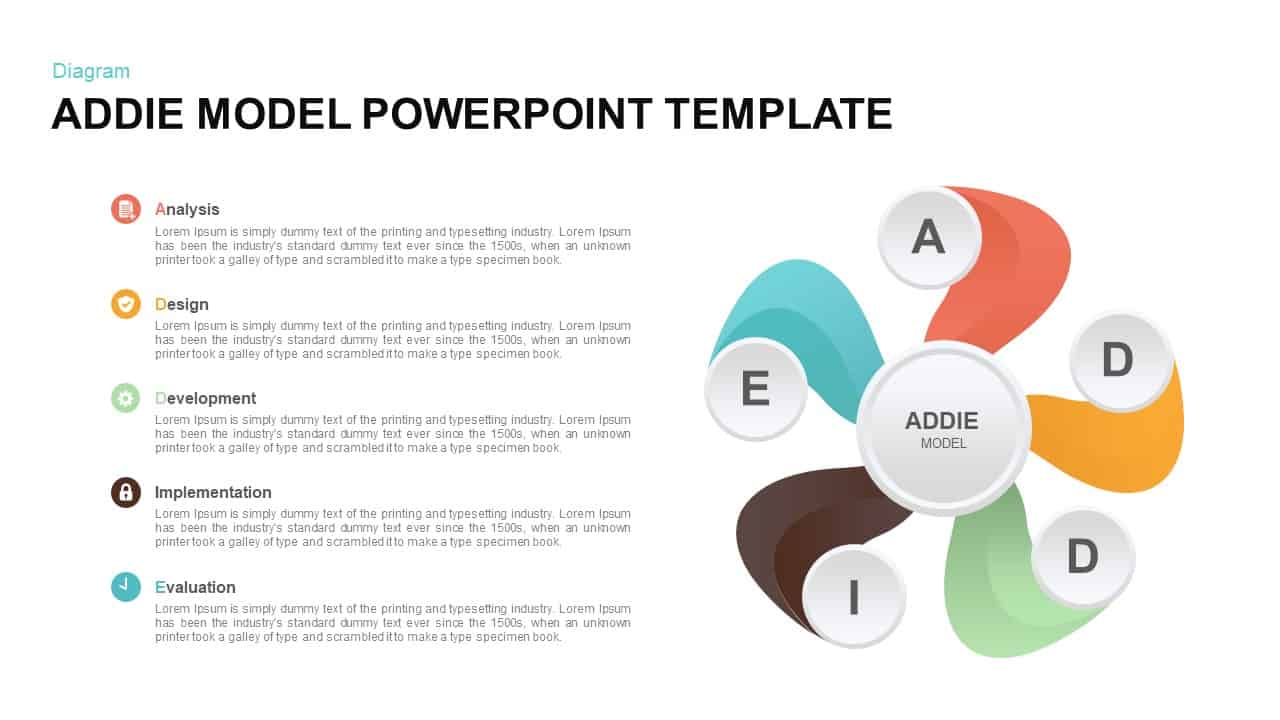
ADDIE Model Hub and Spoke Diagram Template for PowerPoint & Google Slides
Process

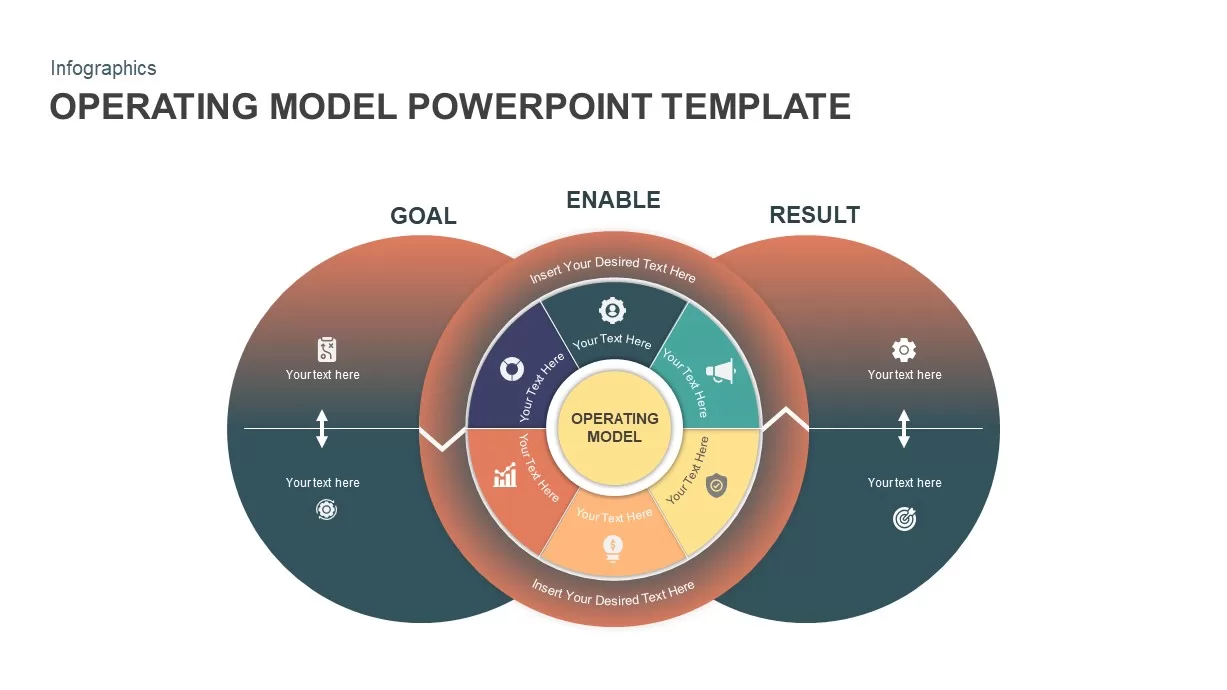
Operating Model Hub-and-Spoke Diagram Template for PowerPoint & Google Slides
Business Models
Four-Phase Maturity Model Diagram Template for PowerPoint & Google Slides
Process
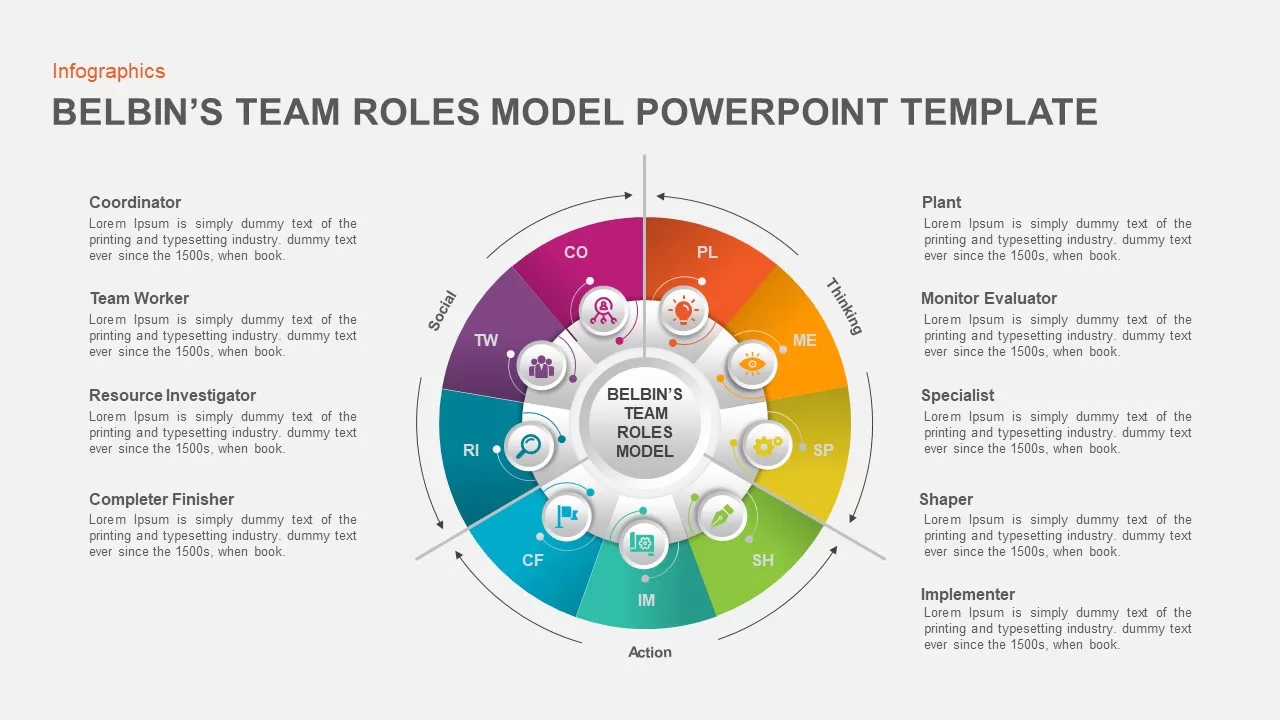
Belbin’s Team Roles Model Diagram Template for PowerPoint & Google Slides
HR

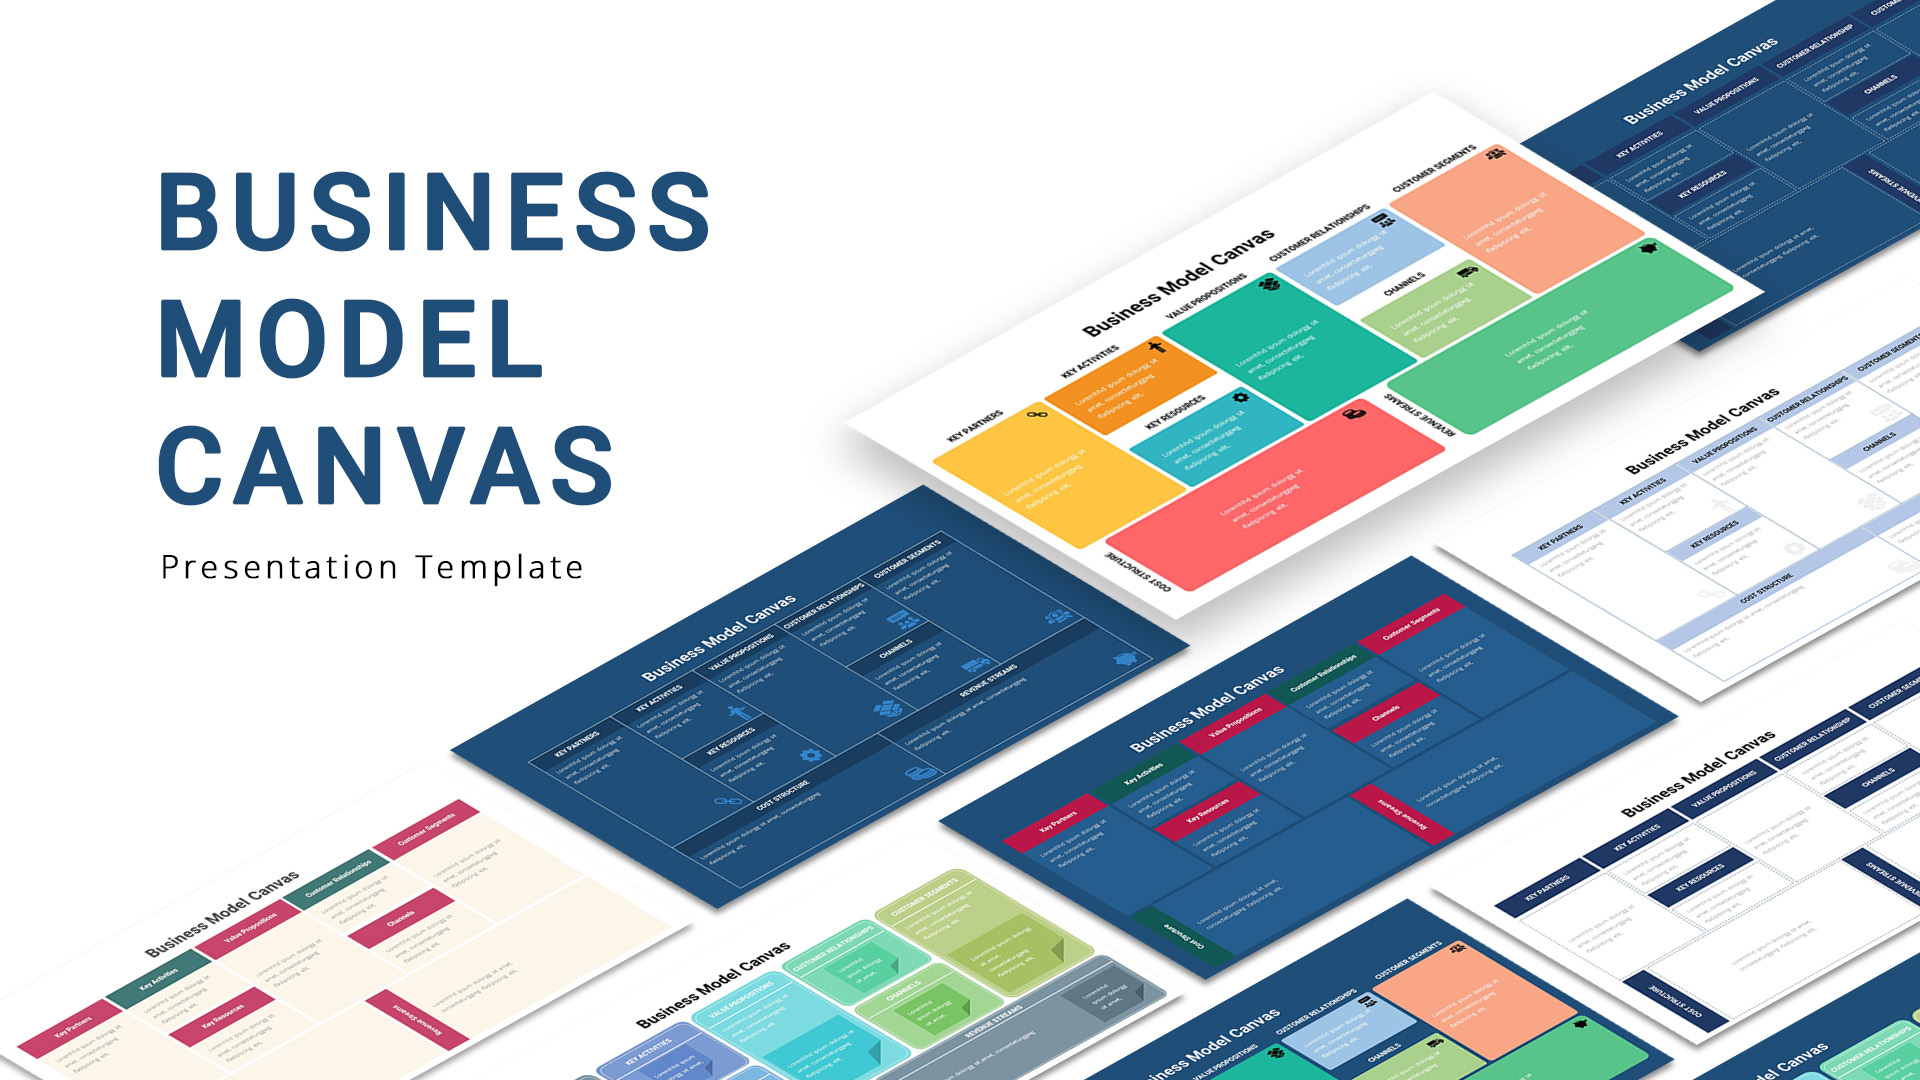
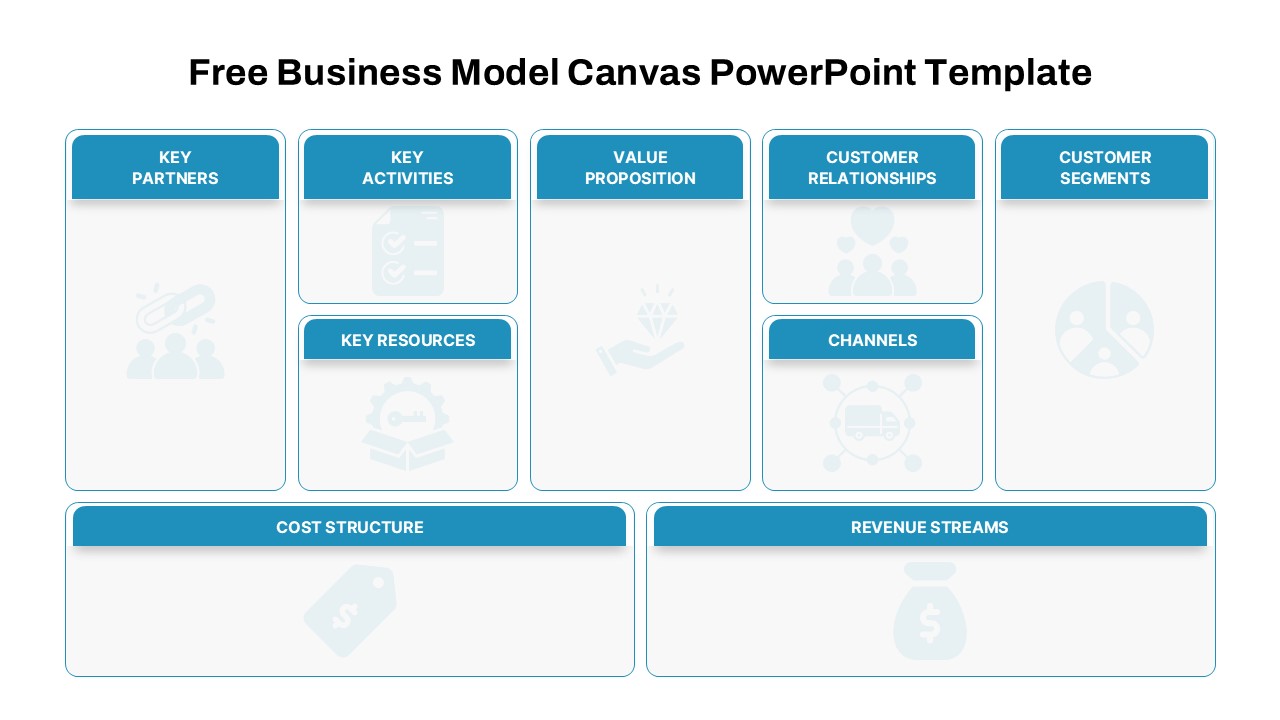
Business Model Canvas Diagram Template for PowerPoint & Google Slides
Business Models
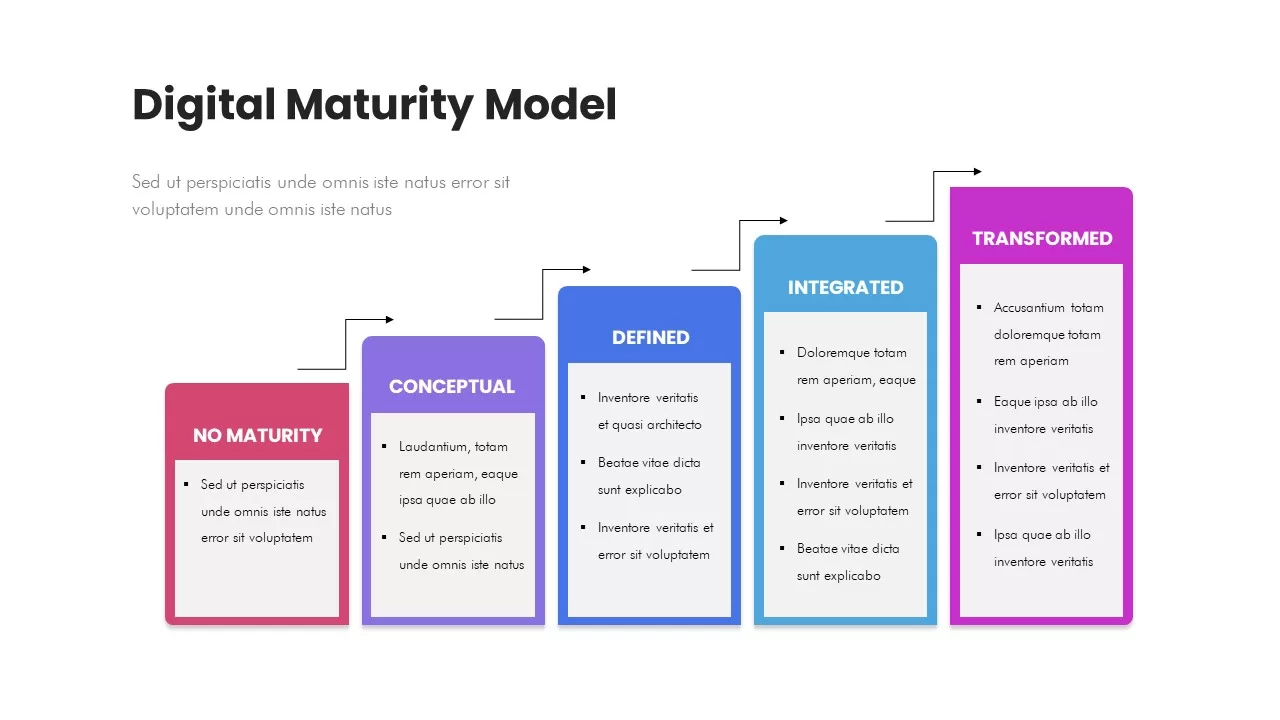
Digital Maturity Model Stages Diagram Template for PowerPoint & Google Slides
Process
Five-Stage Digital Maturity Model Diagram Template for PowerPoint & Google Slides
Process
Business Strategy House Model Diagram Template for PowerPoint & Google Slides
Business Strategy
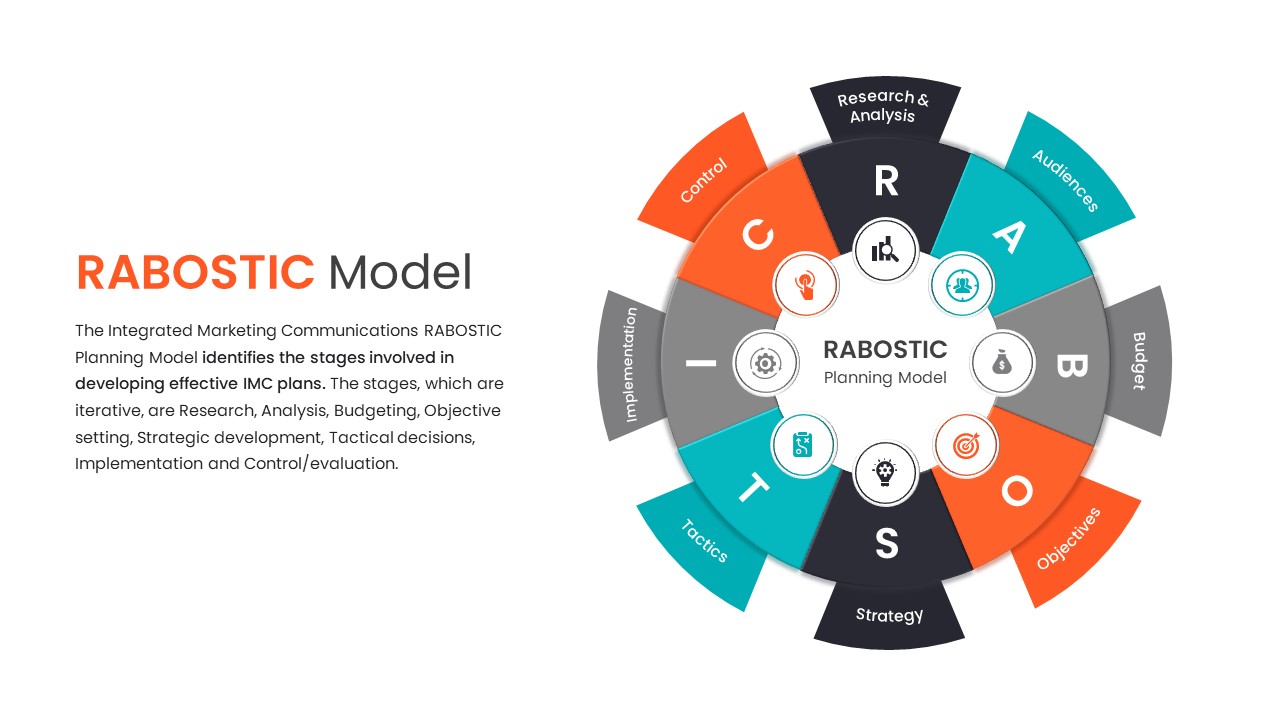
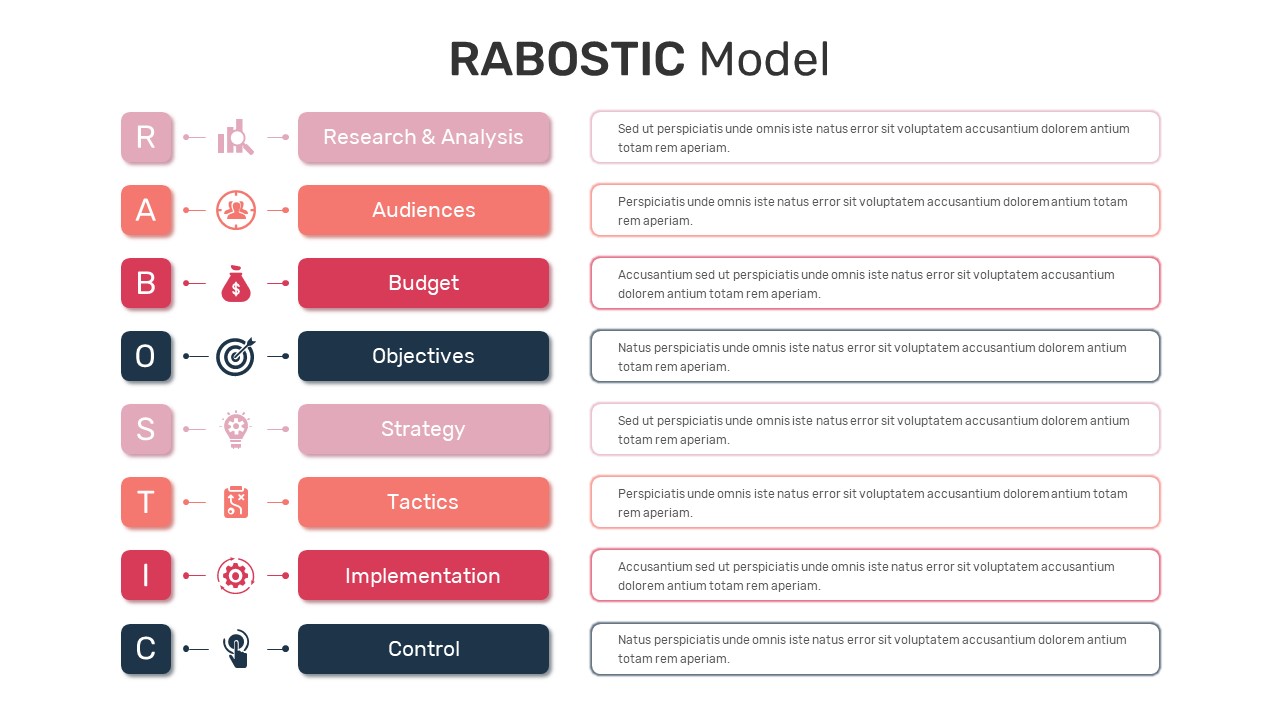
RABOSTIC IMC Planning Model Diagram Template for PowerPoint & Google Slides
Process
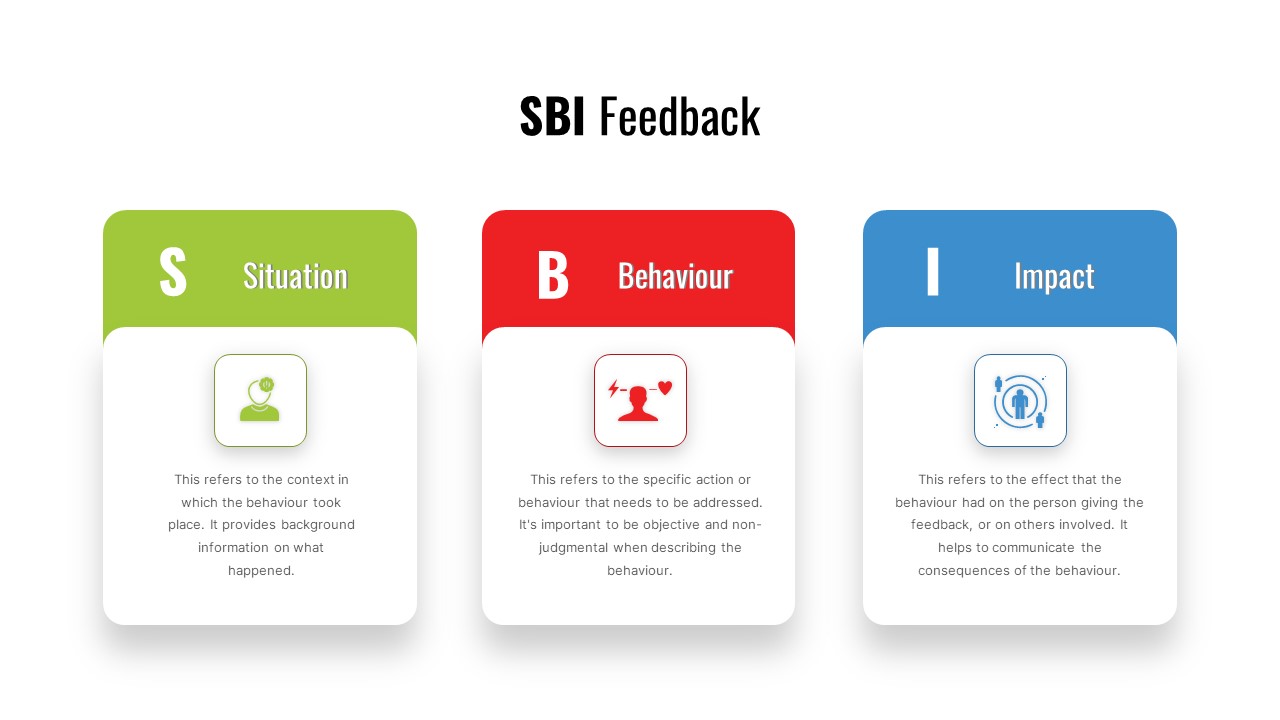
SBI Feedback Model Process Diagram Template for PowerPoint & Google Slides
Process
RABOSTIC Marketing Model Process Diagram Template for PowerPoint & Google Slides
Process
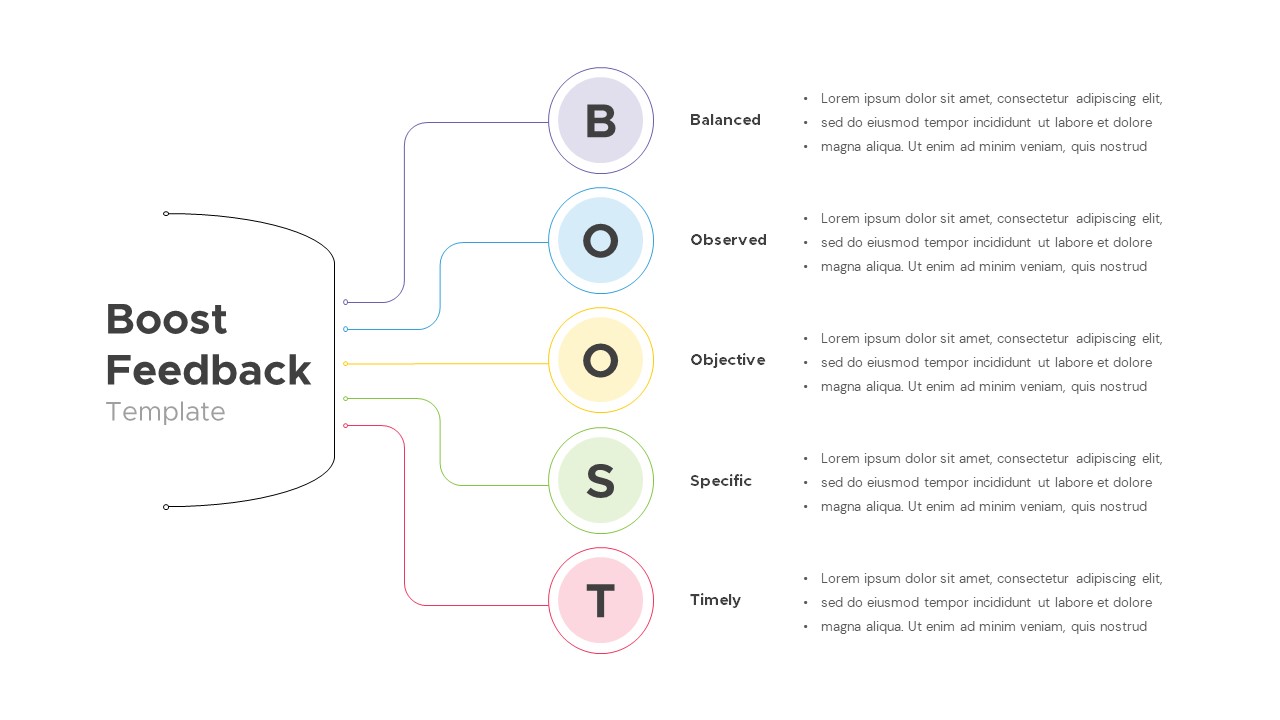
Interactive Boost Feedback Model Diagram Template for PowerPoint & Google Slides
Process
Organizational Maturity Model Diagram Template for PowerPoint & Google Slides
Process
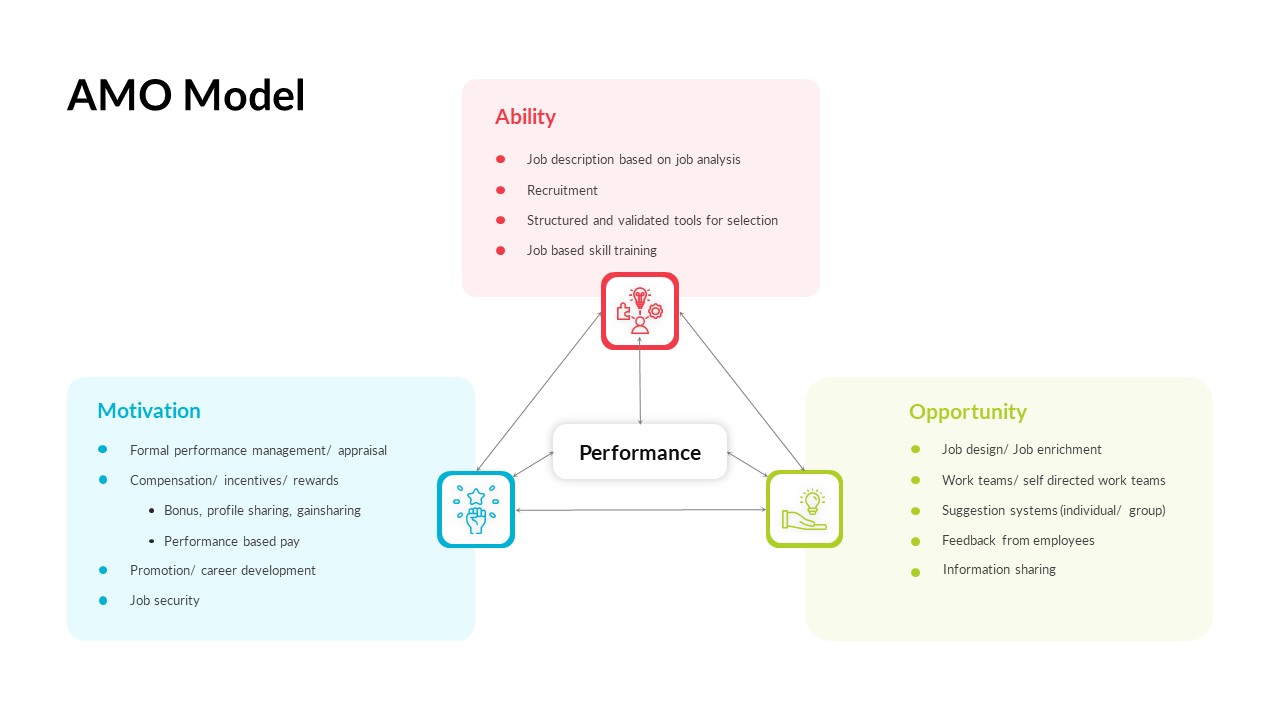
AMO Performance Model Feedback Diagram Template for PowerPoint & Google Slides
Employee Performance
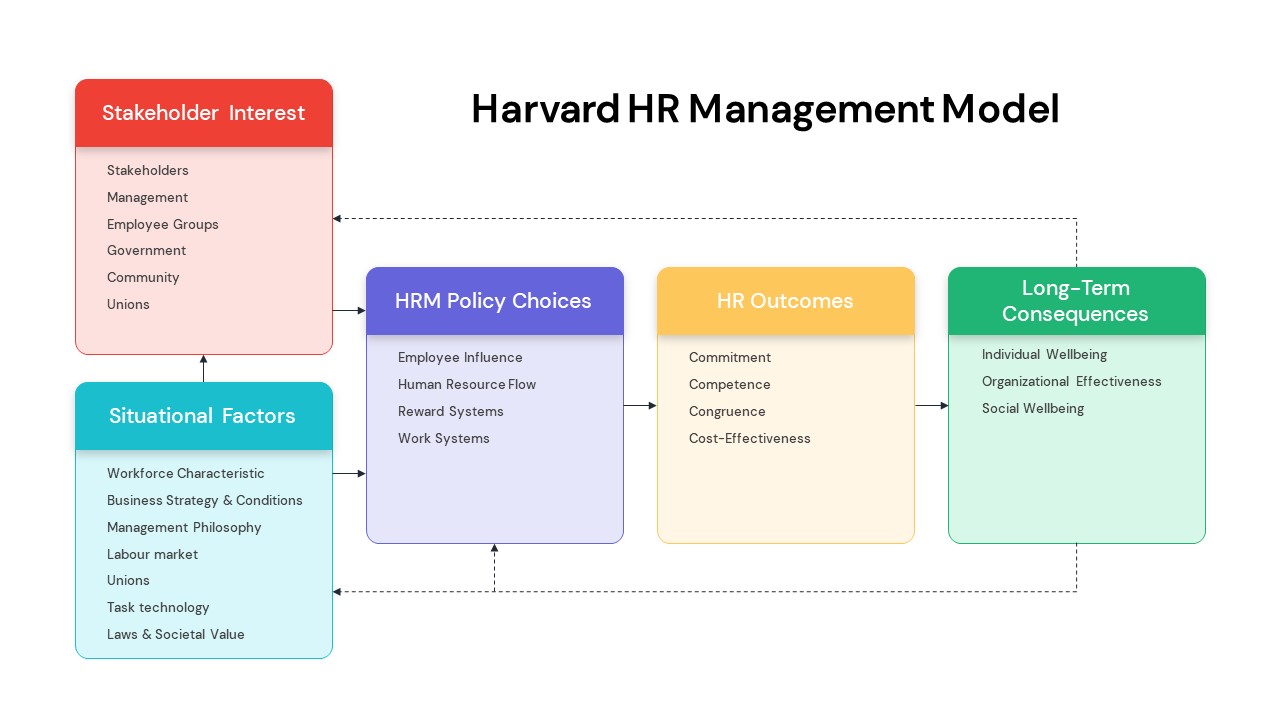
Harvard HR Management Model Diagram Template for PowerPoint & Google Slides
Process
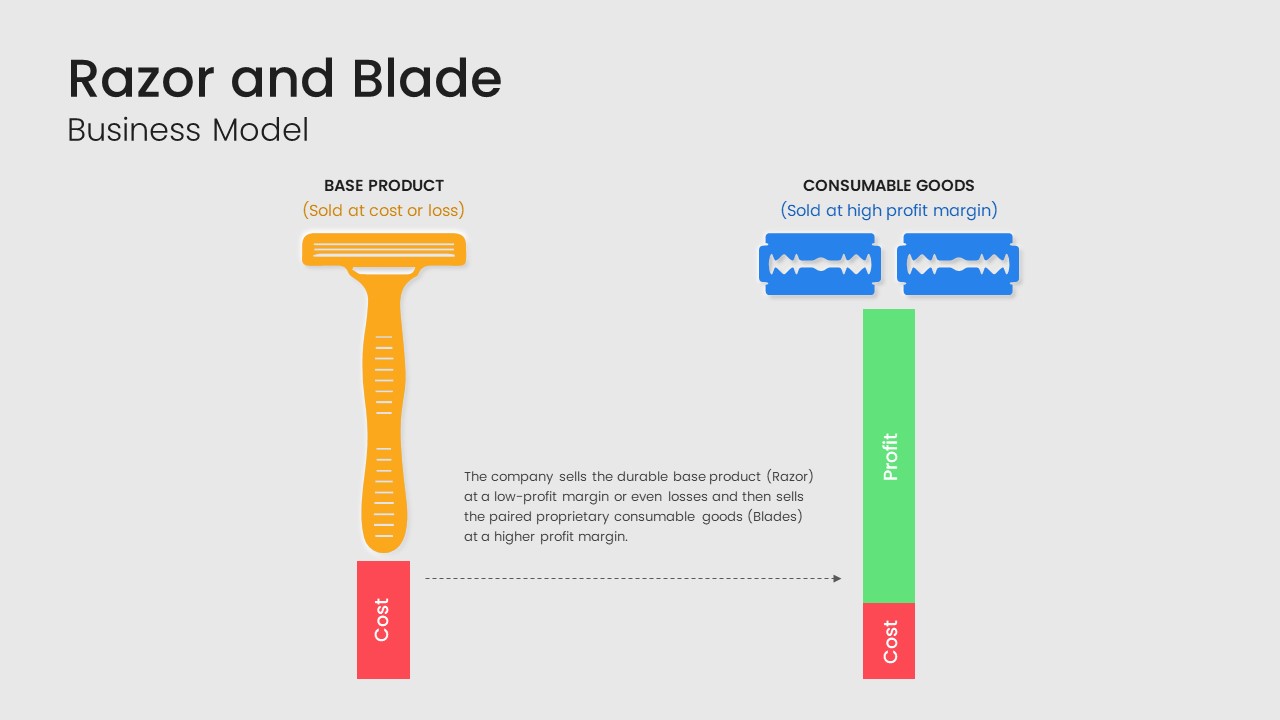
Razor and Blade Business Model Diagram Template for PowerPoint & Google Slides
Business Models
Free Business Model Canvas Diagram Slide Template for PowerPoint & Google Slides
Business Models
Free
Salience Model Venn Diagram Infographic Template for PowerPoint & Google Slides
Circular
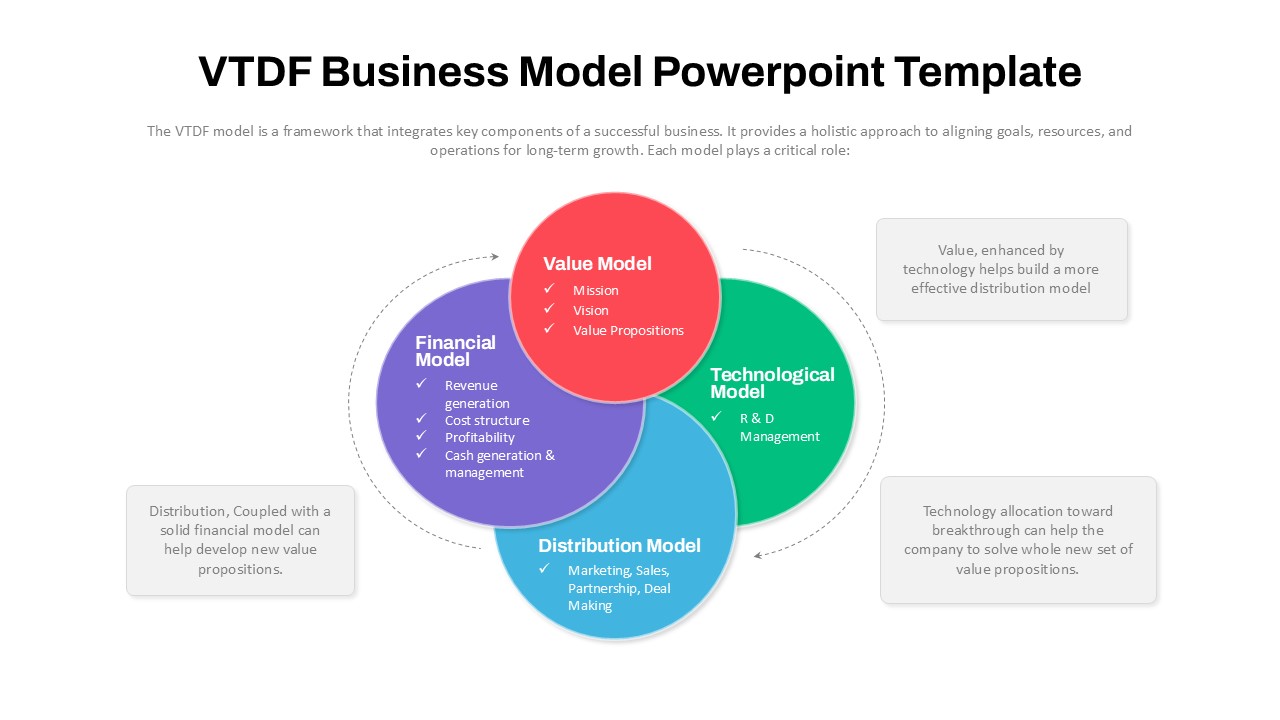
VTDF Business Model Framework Diagram Template for PowerPoint & Google Slides
Business Models
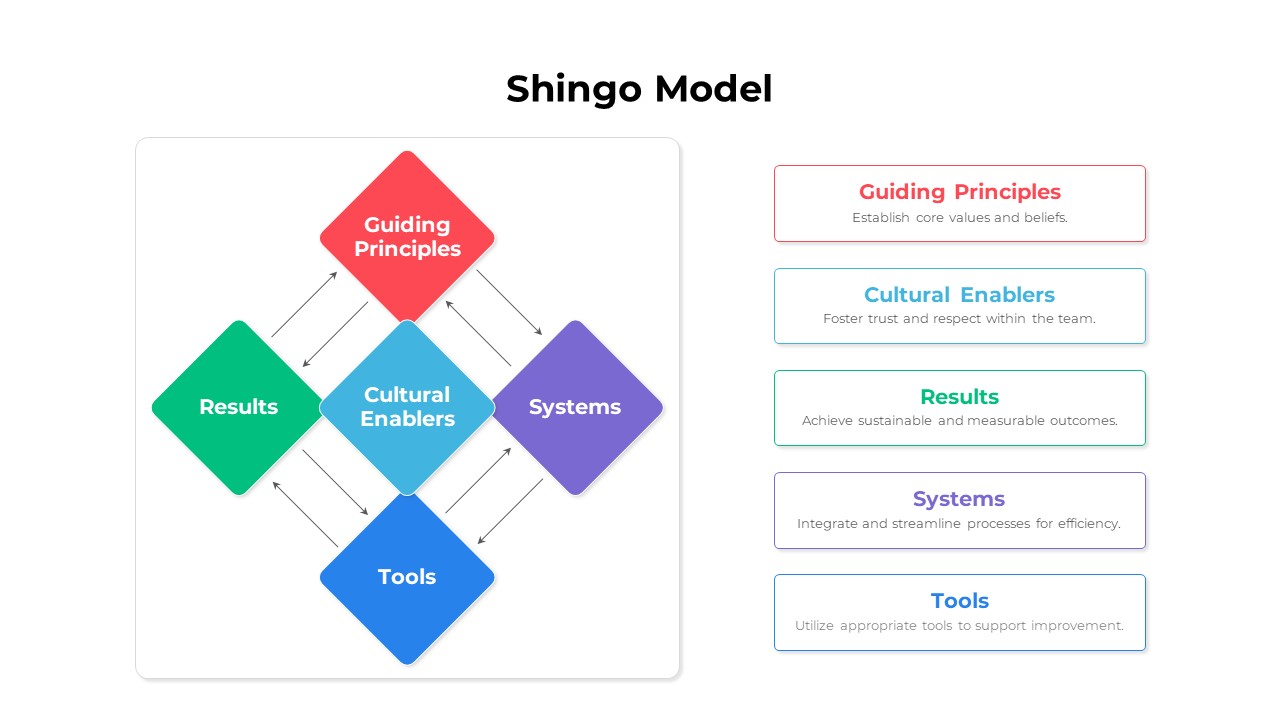
Shingo Model Diagram Template for PowerPoint & Google Slides
Process
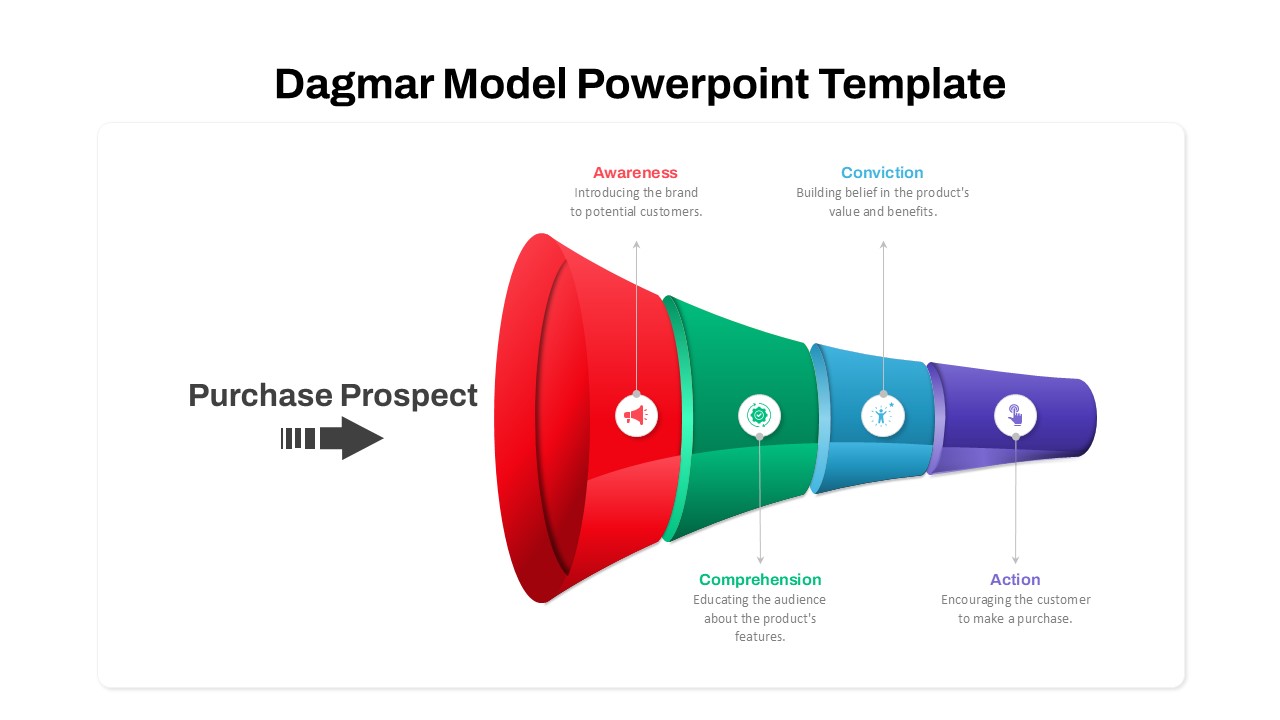
Dagmar Model Marketing Funnel Diagram Template for PowerPoint & Google Slides
Funnel
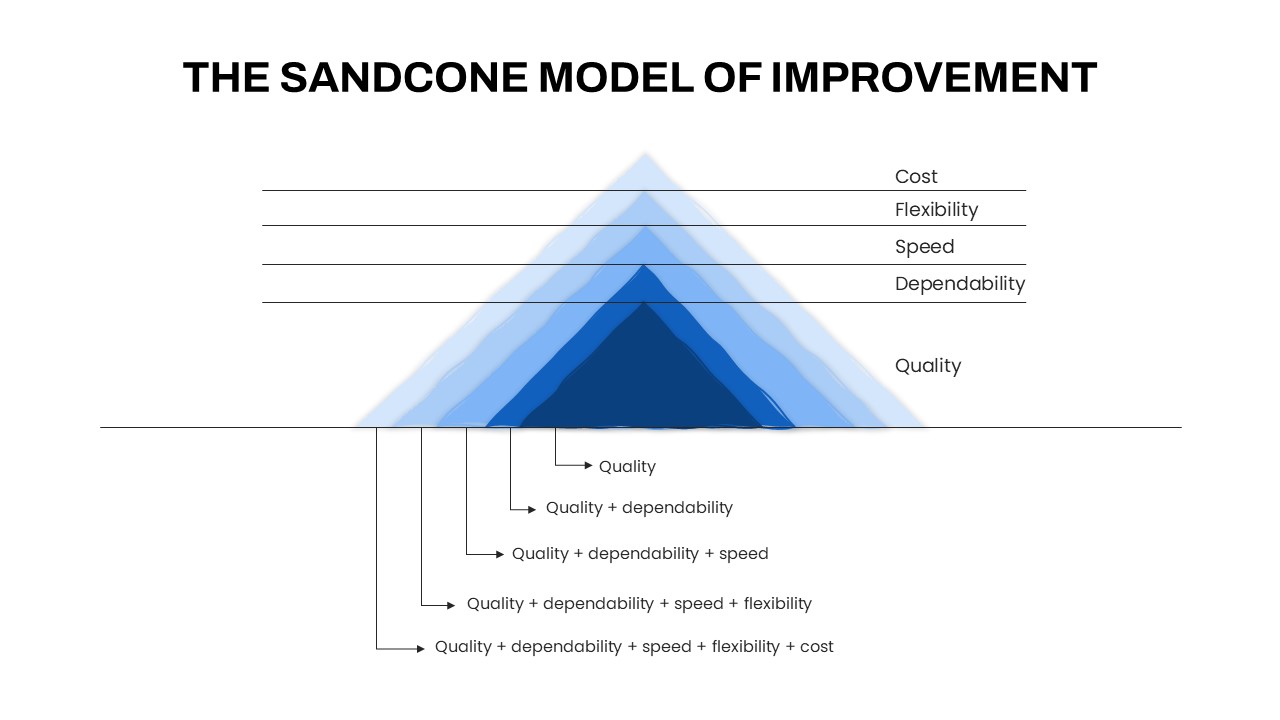
Sandcone Model of Improvement Diagram Template for PowerPoint & Google Slides
Pyramid
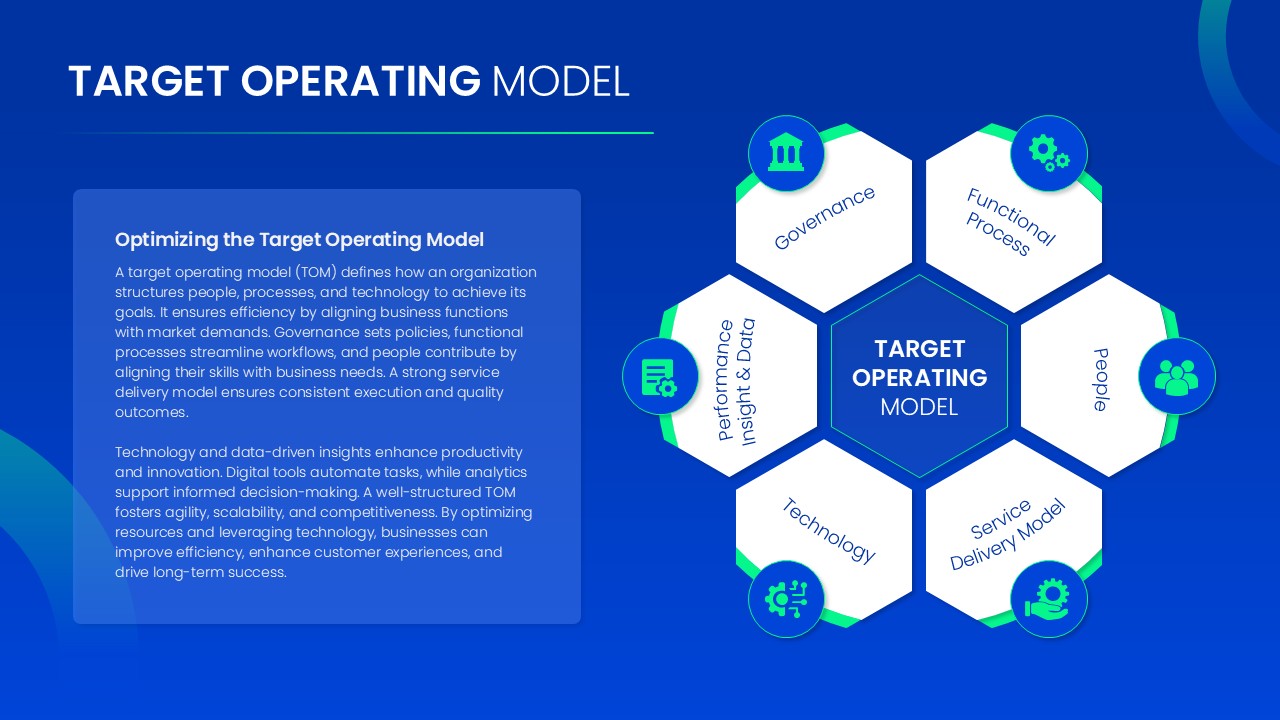
Target Operating Model Diagram Template for PowerPoint & Google Slides
Business Strategy
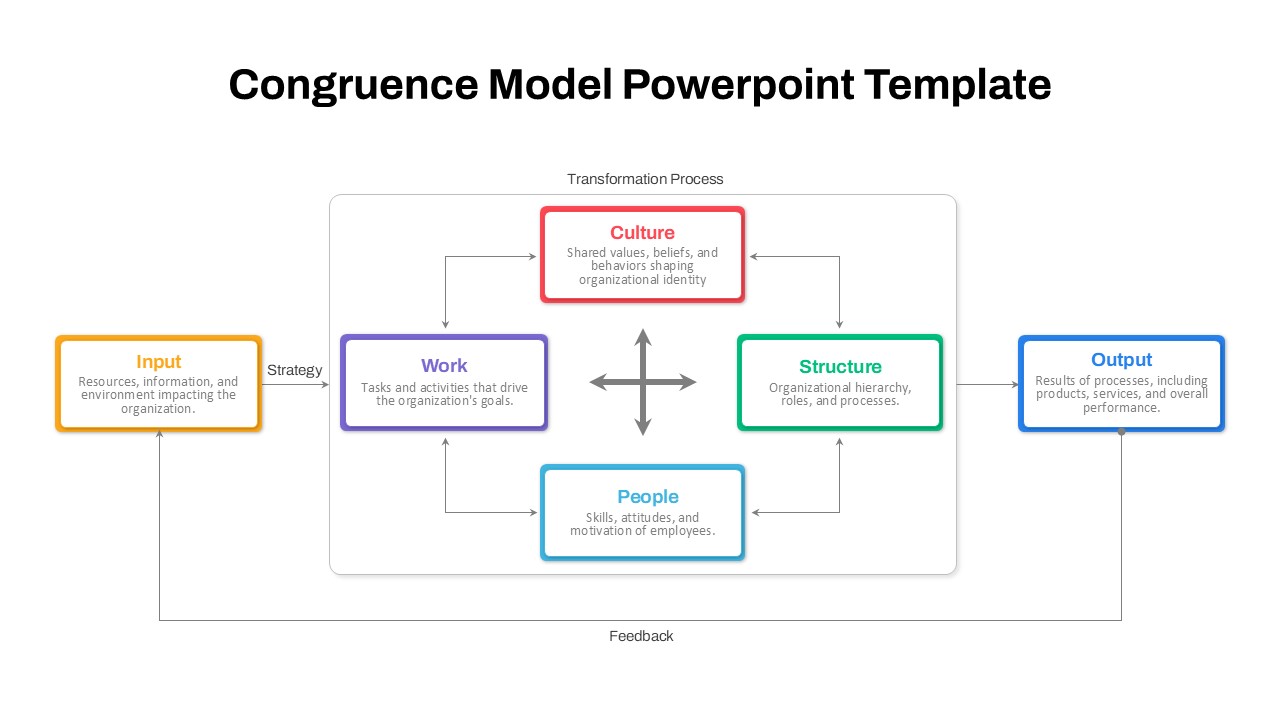
Organizational Congruence Model Diagram Template for PowerPoint & Google Slides
Process
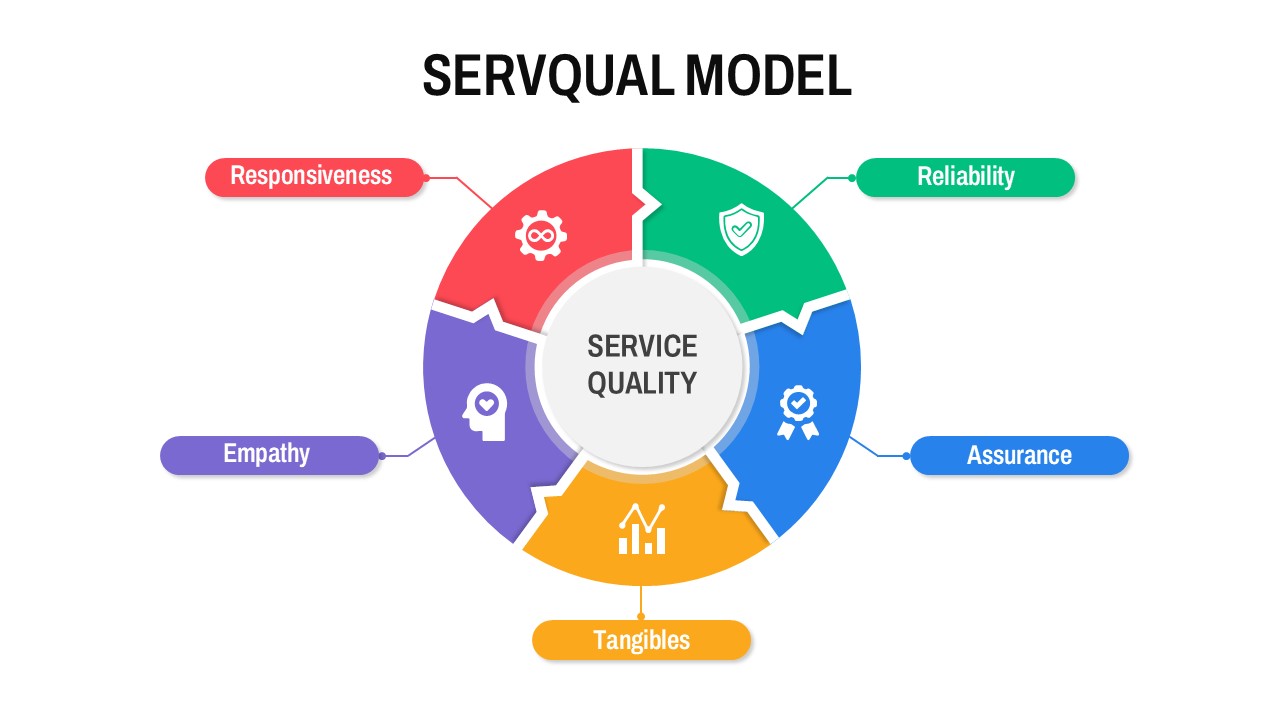
Circular SERVQUAL Model Diagram Template for PowerPoint & Google Slides
Business Strategy
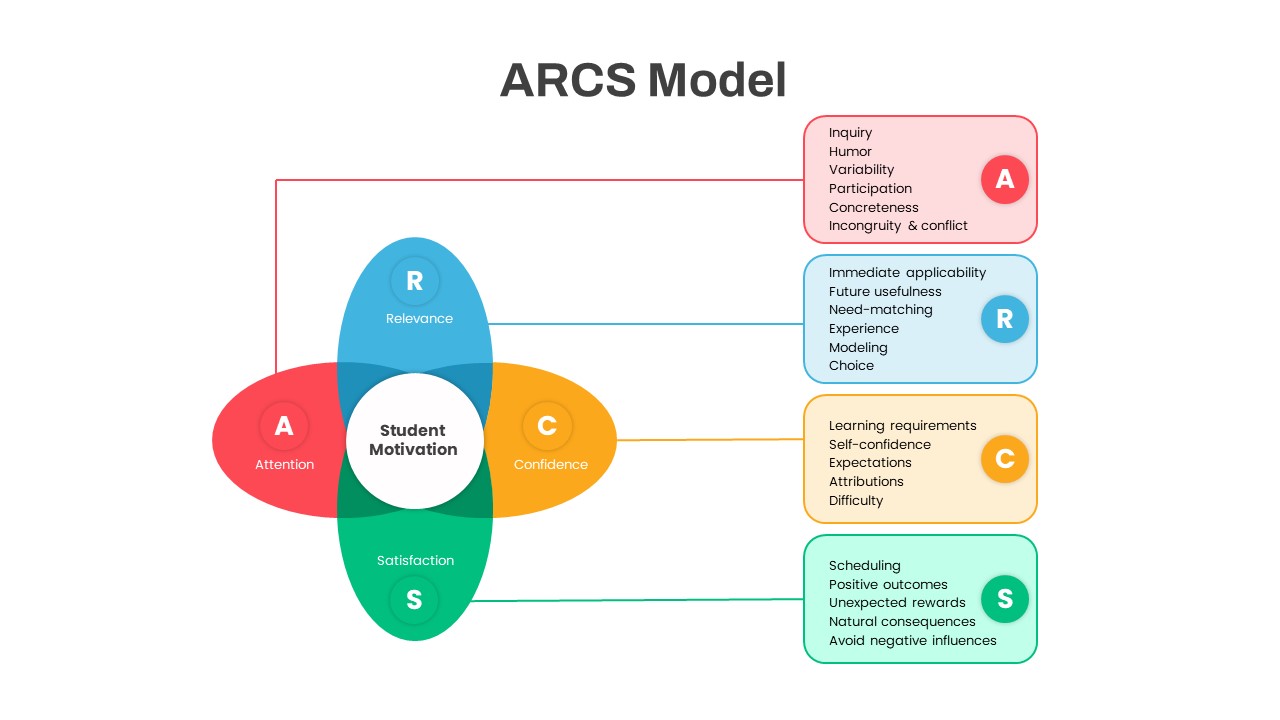
ARCS Student Motivation Model Diagram Template for PowerPoint & Google Slides
Process
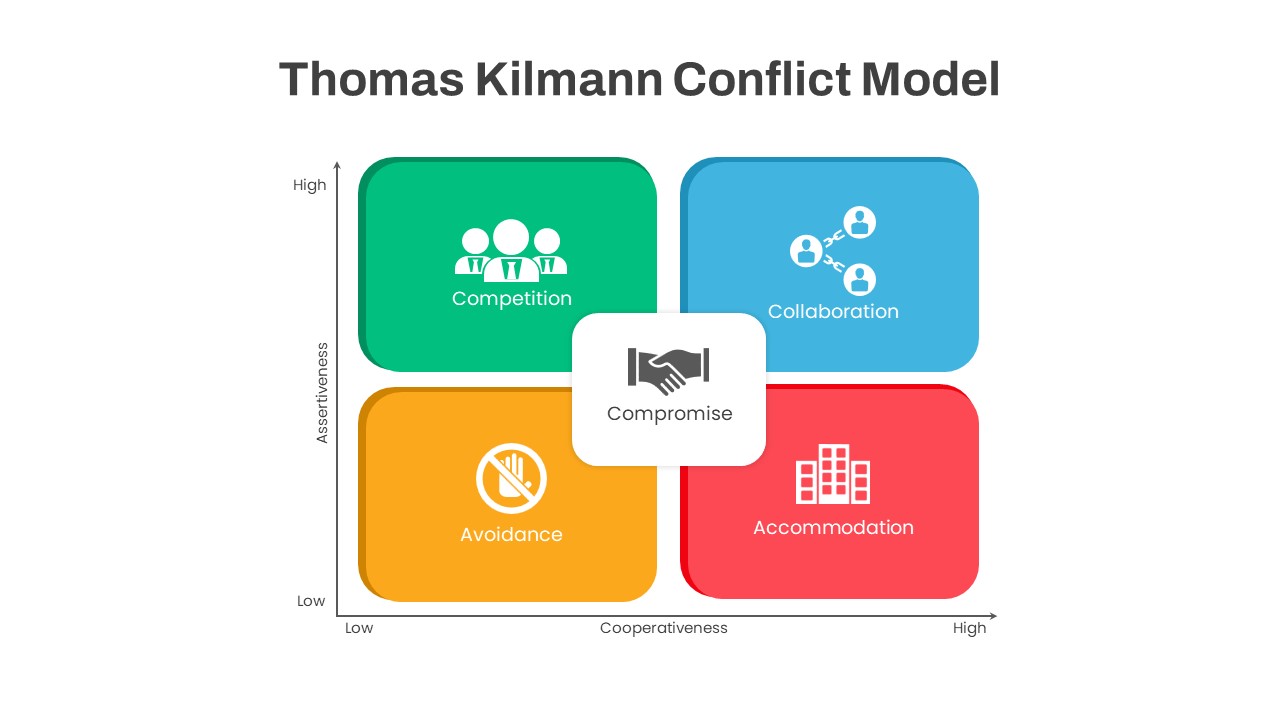
Thomas Kilmann Conflict Model Diagram Template for PowerPoint & Google Slides
Leadership
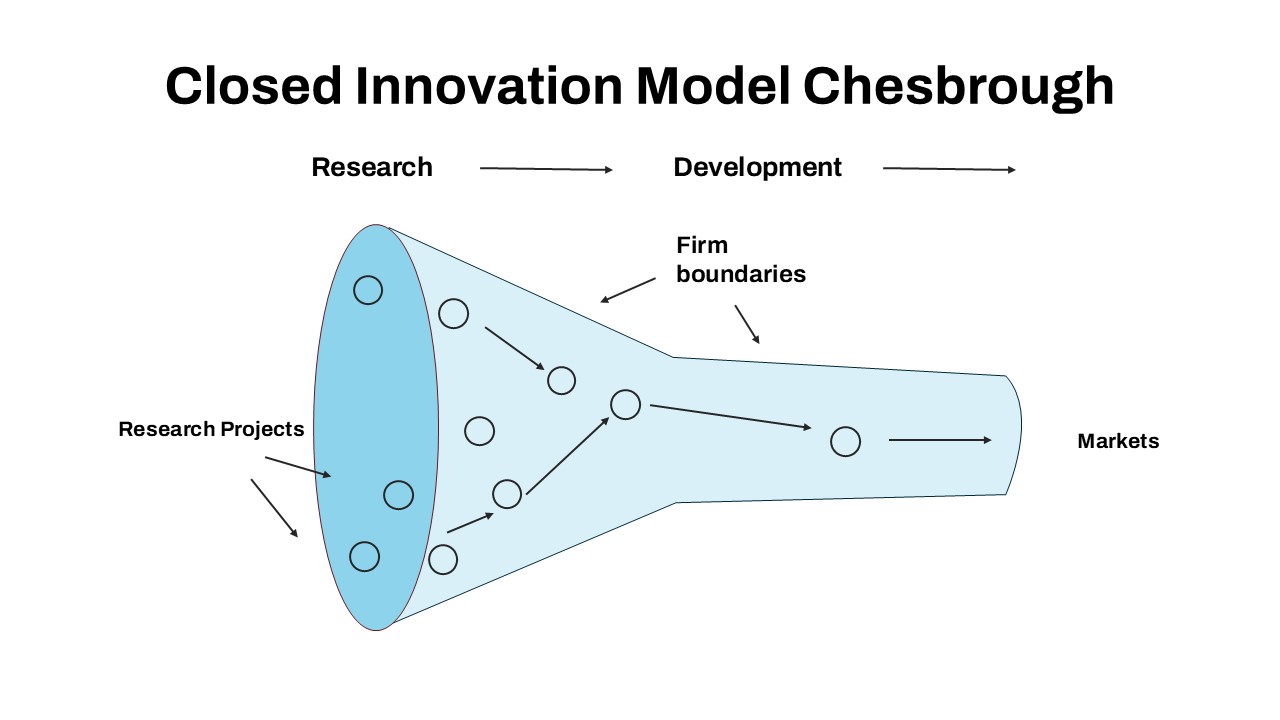
Closed Innovation Model Funnel Diagram Template for PowerPoint & Google Slides
Funnel
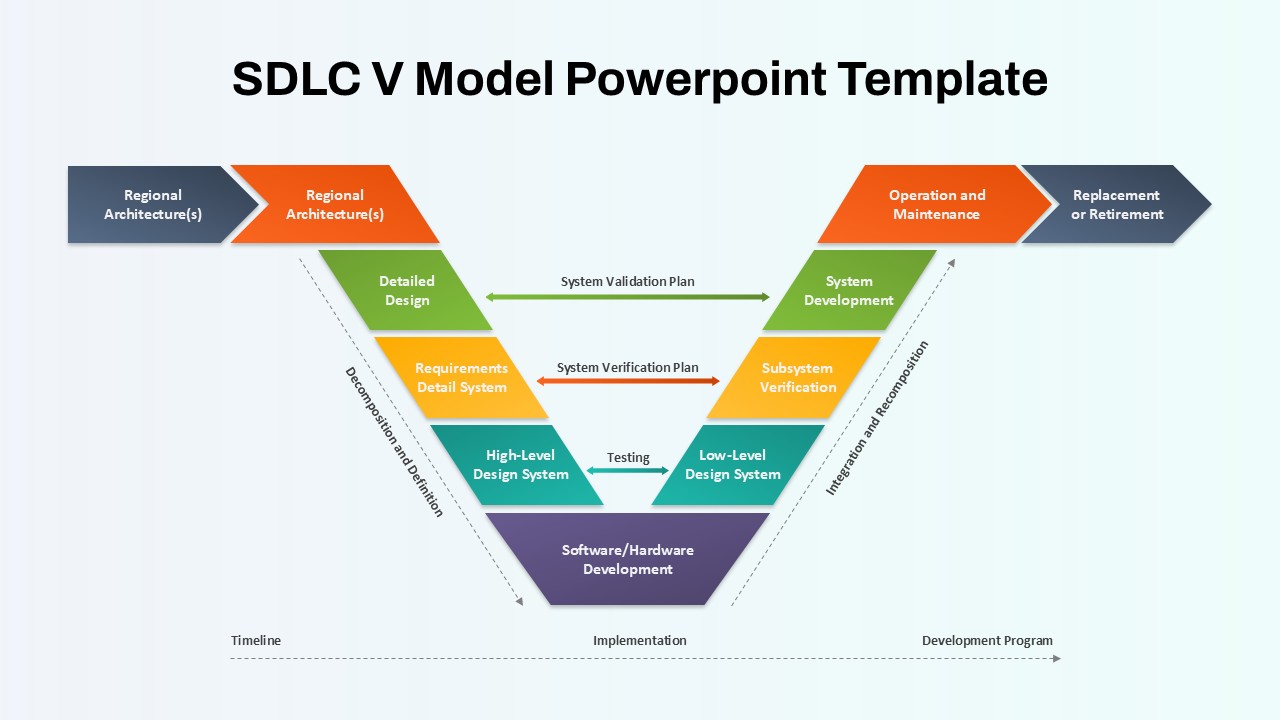
SDLC V Model Lifecycle Diagram Template for PowerPoint & Google Slides
Process
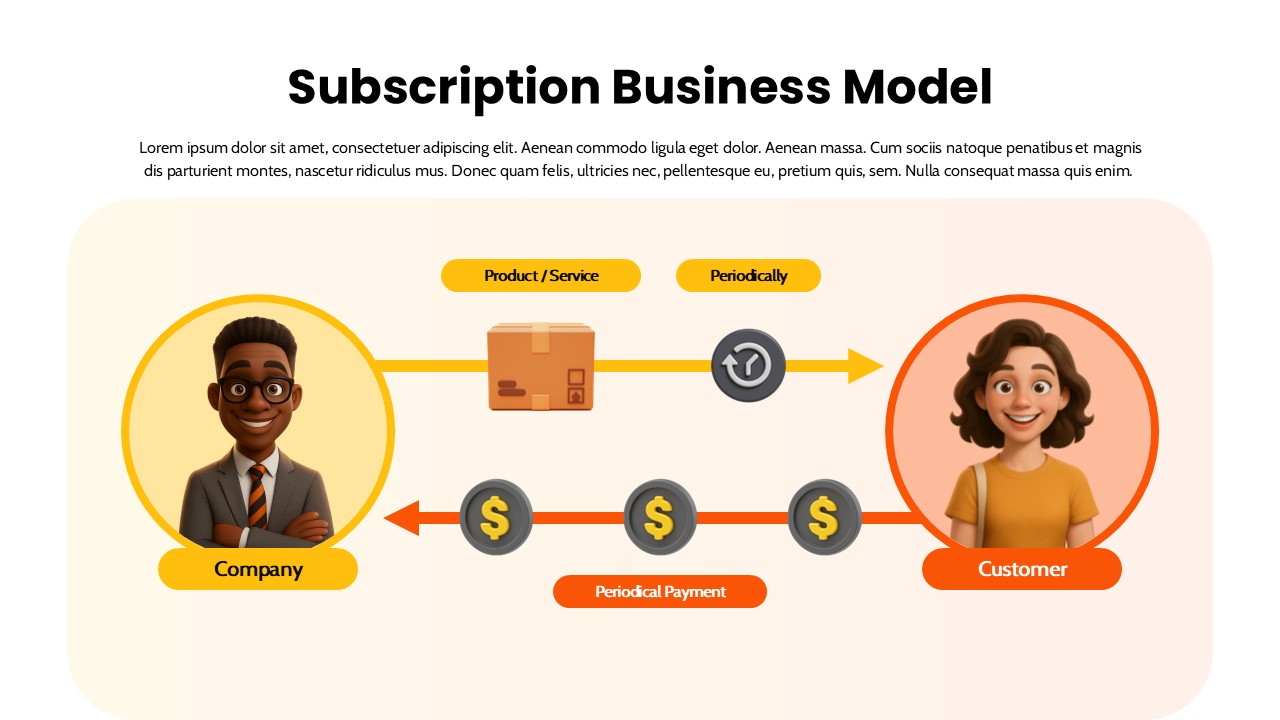
Subscription Business Model Flow Diagram Template for PowerPoint & Google Slides
Business Models
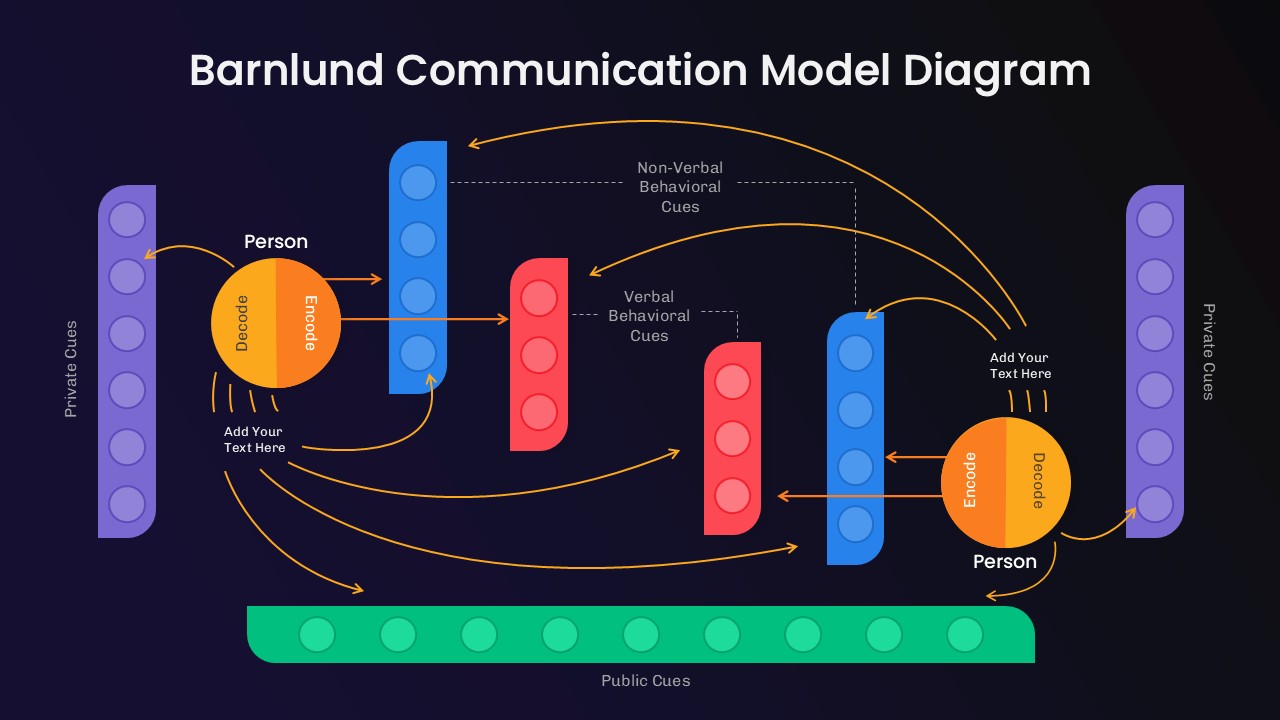
Barnlund Communication Model Diagram Template for PowerPoint & Google Slides
Process
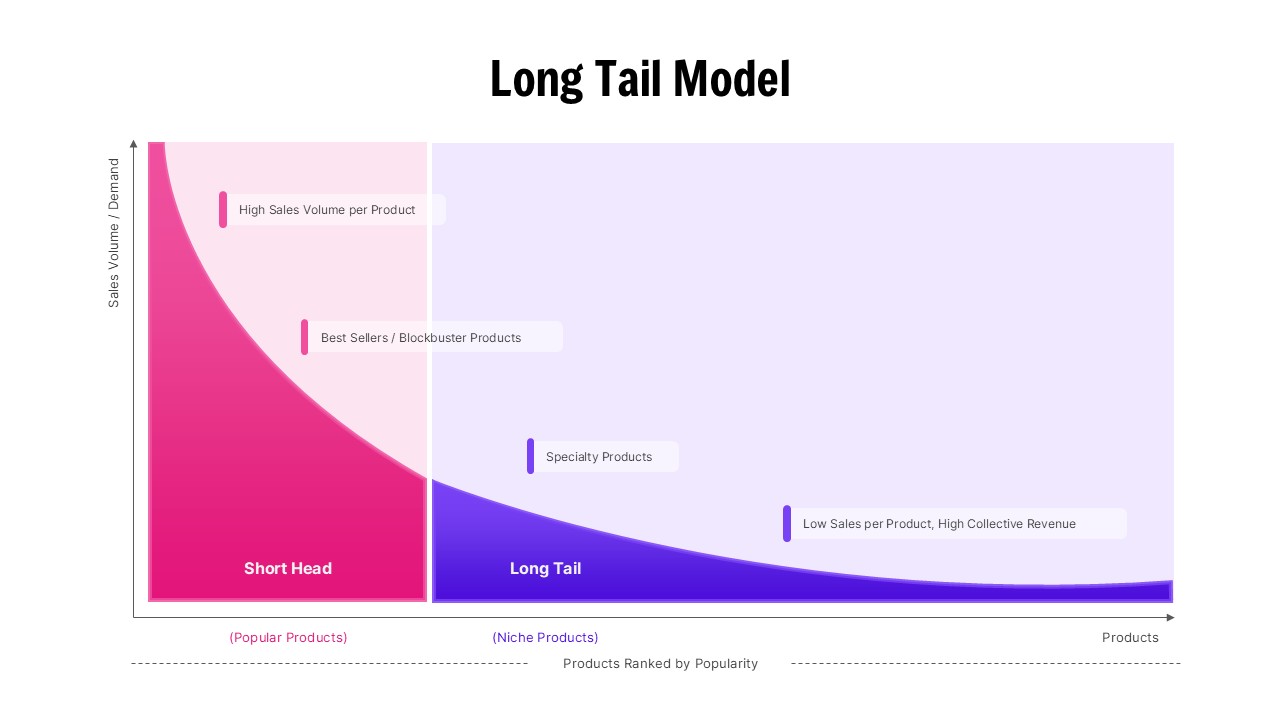
Long Tail Model Business Strategy Diagram Template for PowerPoint & Google Slides
Business
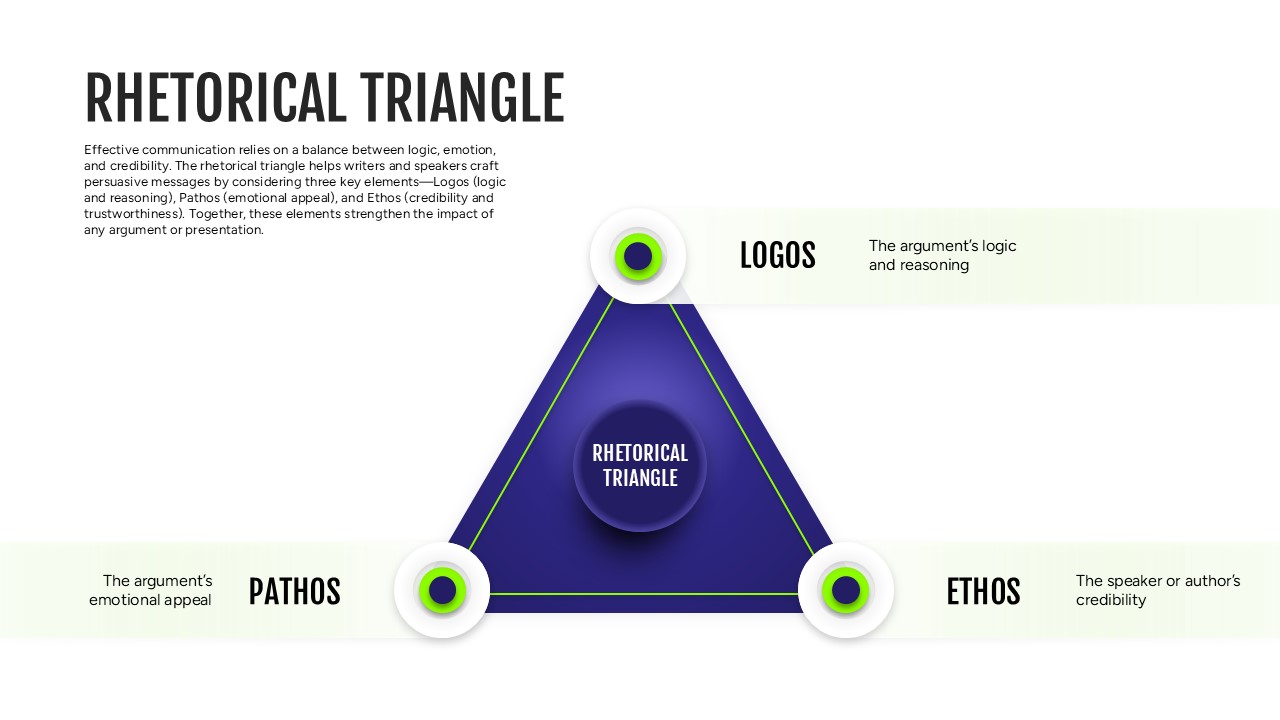
Rhetorical Triangle Model Diagram Template for PowerPoint & Google Slides
Leadership
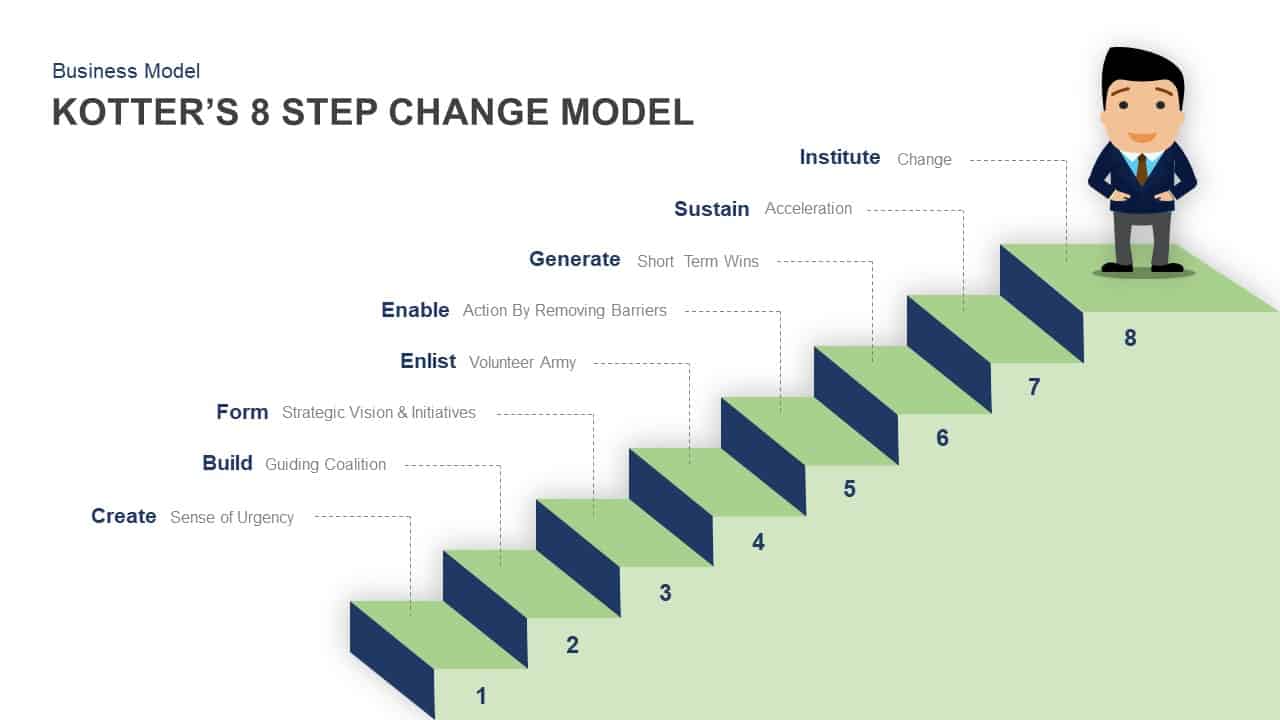
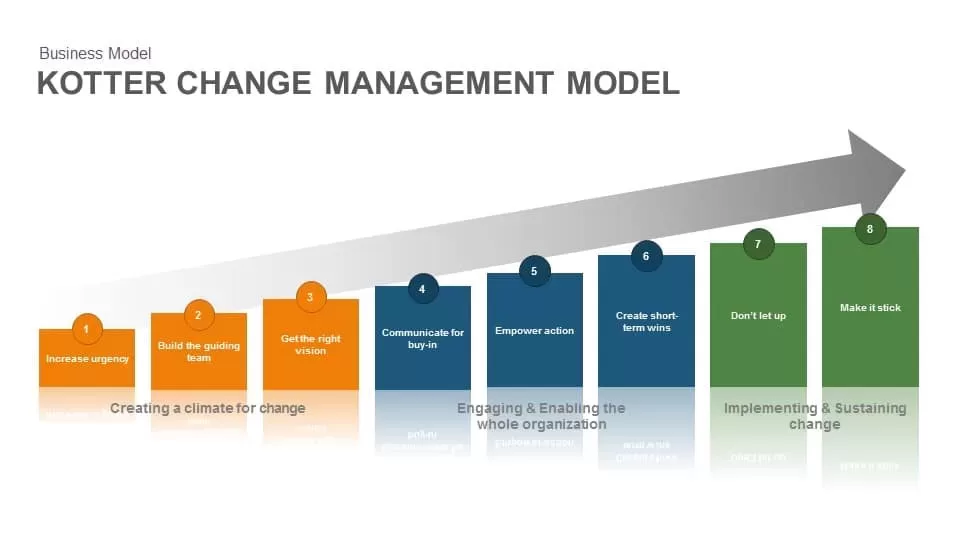
Kotter’s 8 Step Change Model Diagram for PowerPoint & Google Slides
Business Models
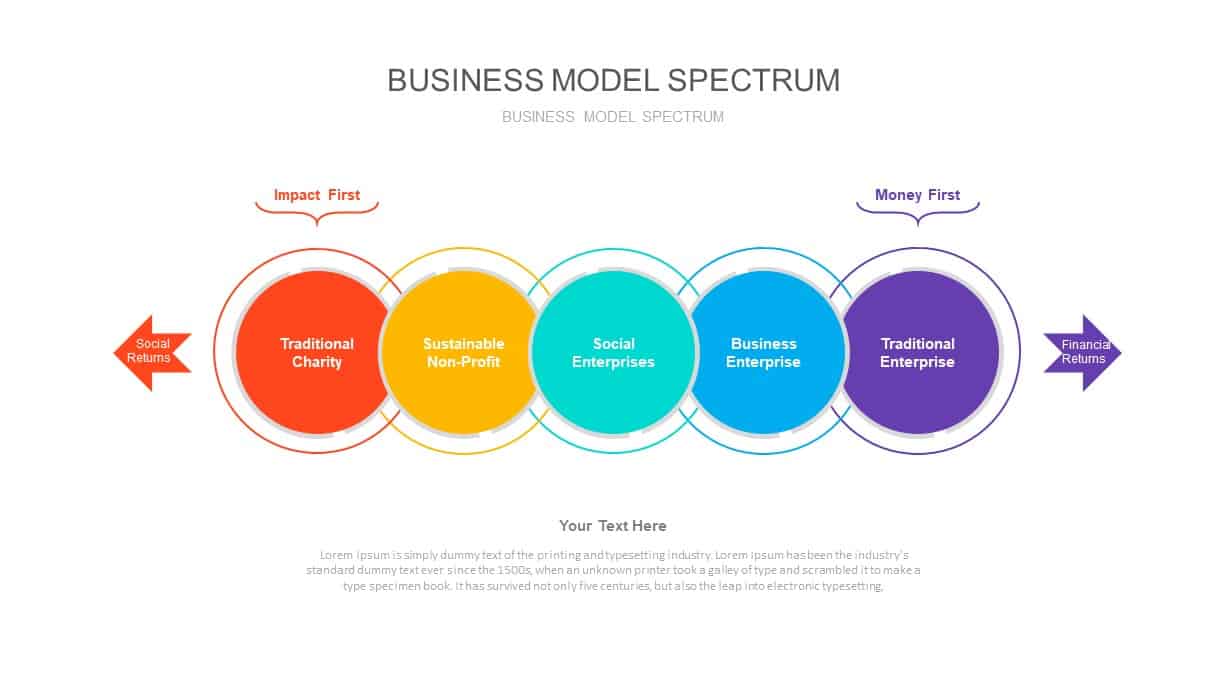
Business Model Spectrum Diagram Pack for PowerPoint & Google Slides
Business Models
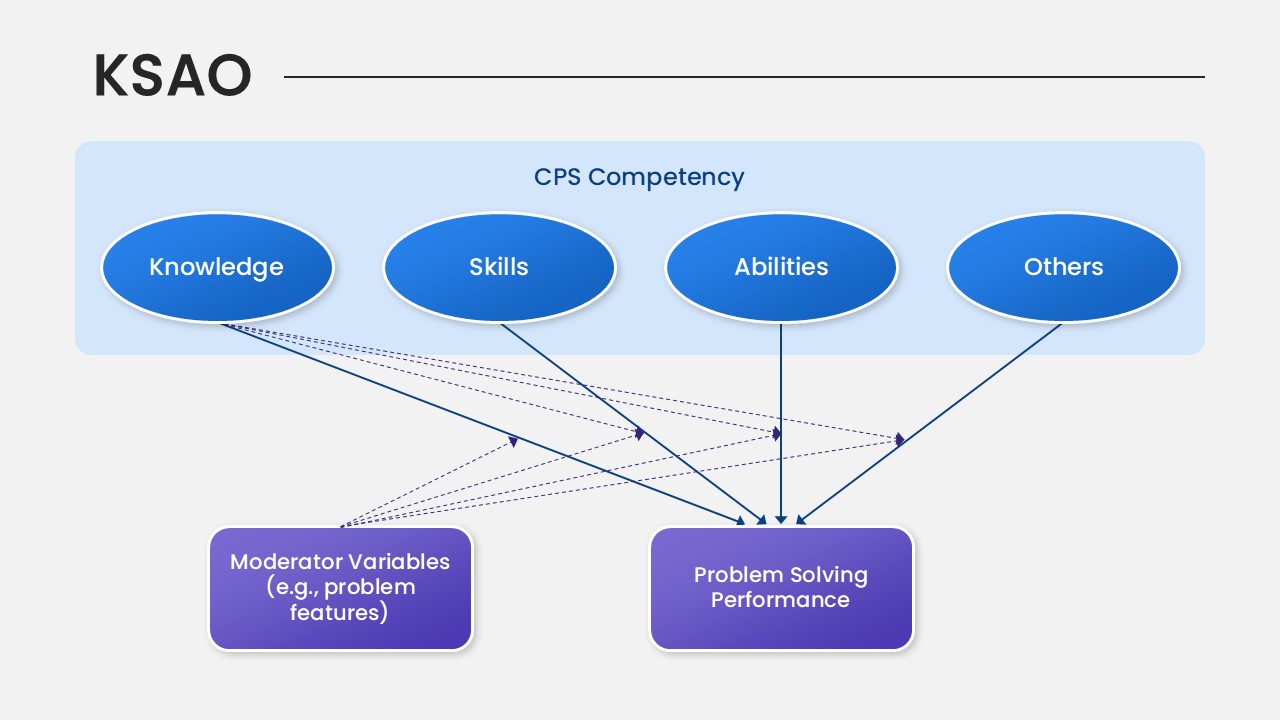
KSAO Model PowerPoint Template for PowerPoint & Google Slides
Business Strategy
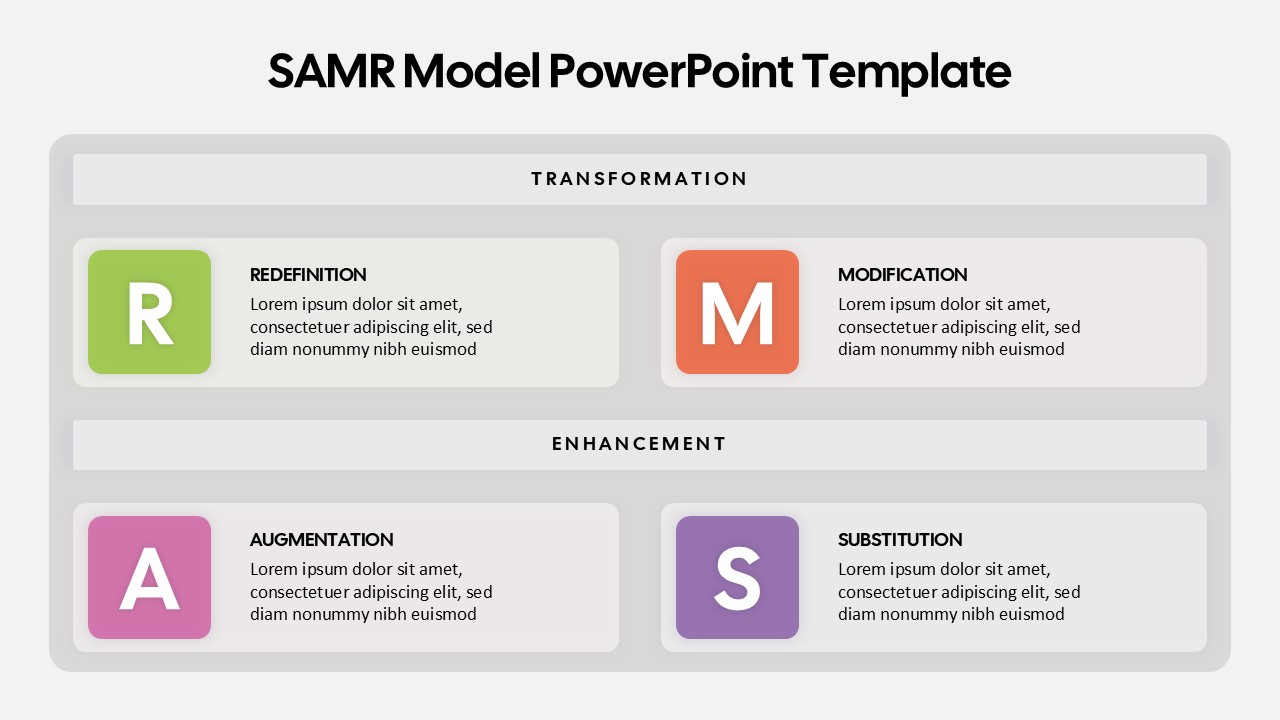
SAMR Model PowerPoint Template for PowerPoint & Google Slides
Business
Kotter Change Management Model template for PowerPoint & Google Slides
Business Strategy
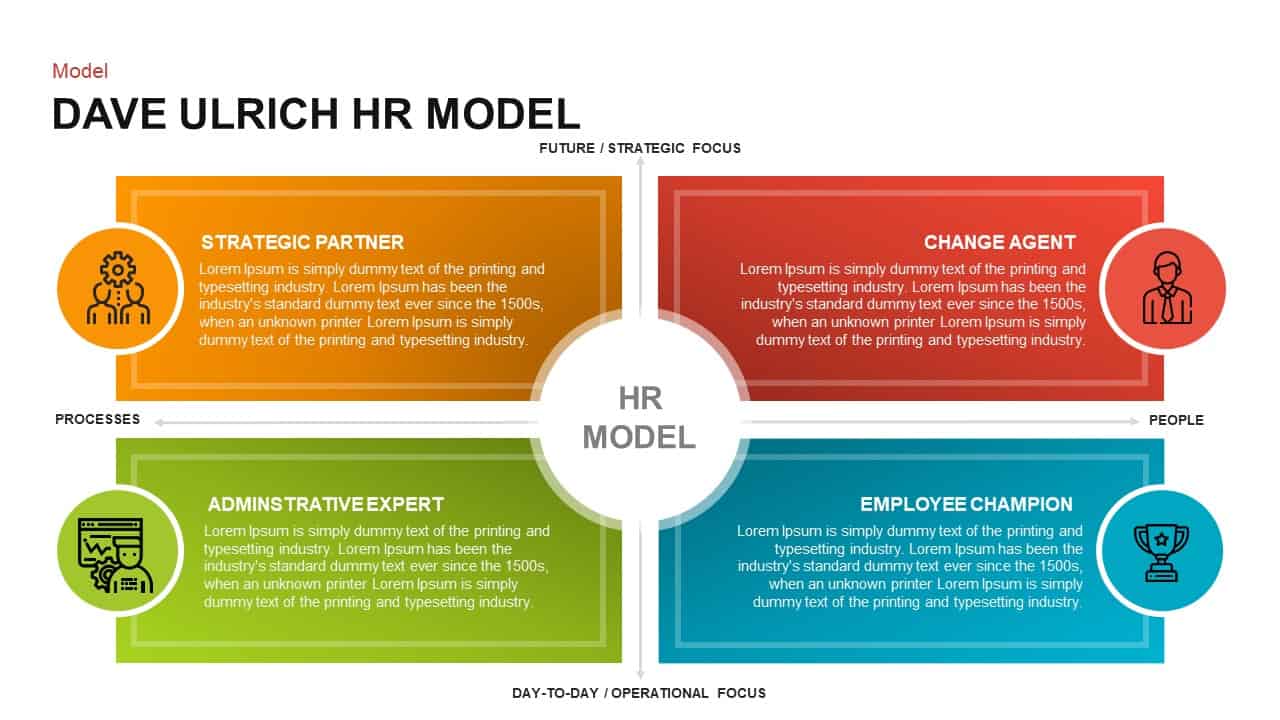
Dave Ulrich Strategic HR Model Quadrant Template for PowerPoint & Google Slides
Employee Performance
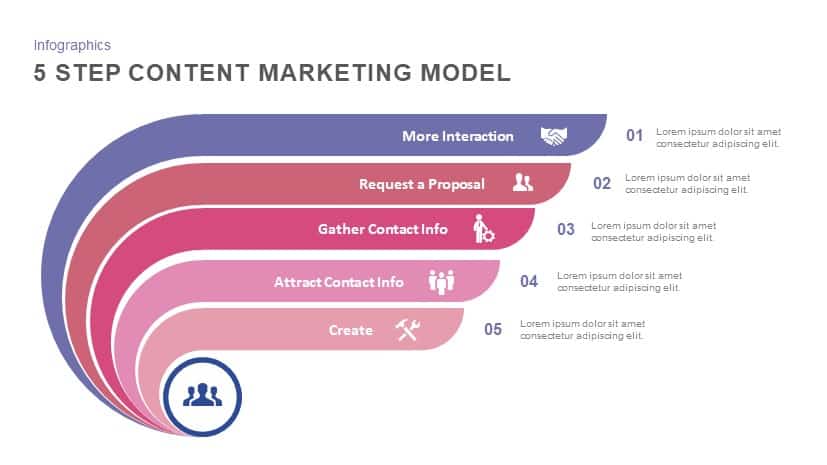
5 Step Content Marketing Model template for PowerPoint & Google Slides
Marketing

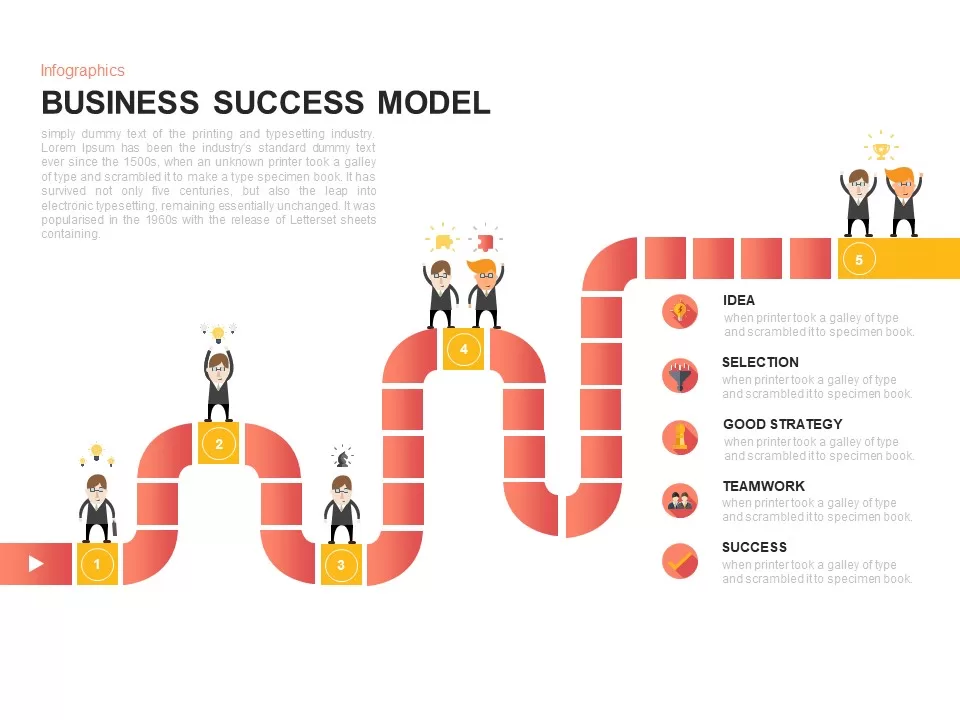
Business Success Model Infographic Template for PowerPoint & Google Slides
Roadmap
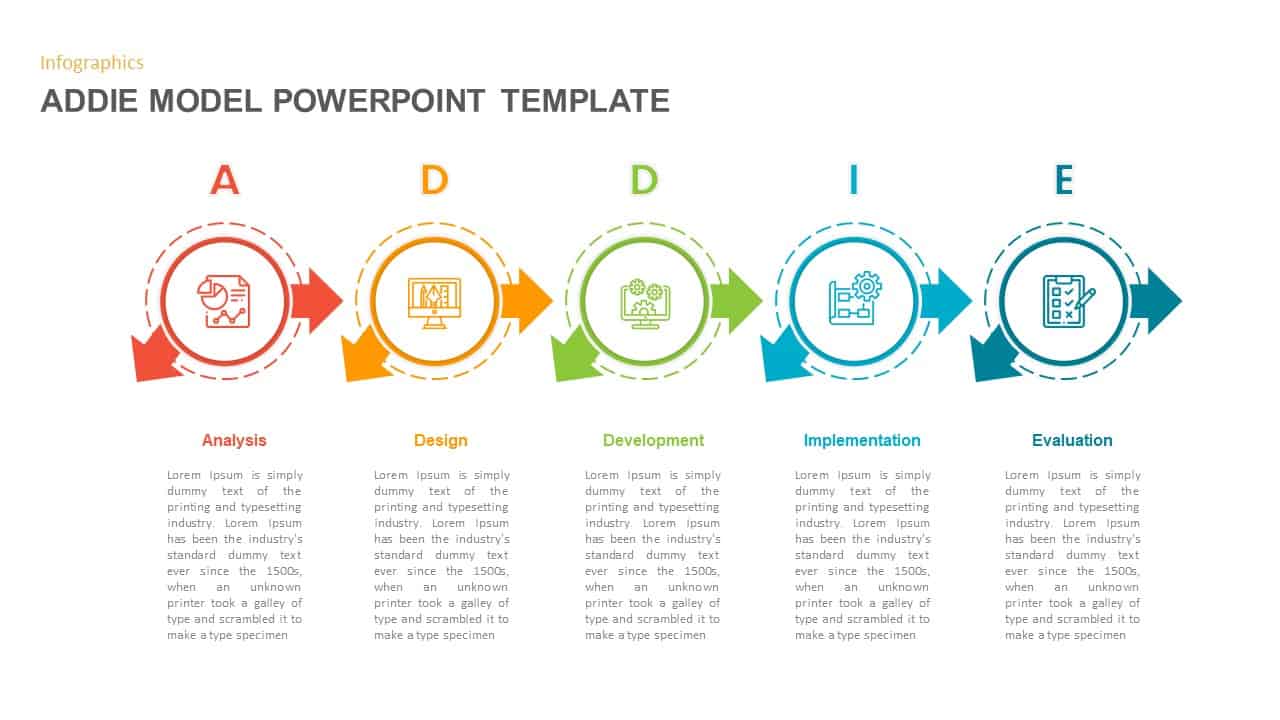
ADDIE Instructional Design Model Template for PowerPoint & Google Slides
Process
Supply Positioning Model Matrix Template for PowerPoint & Google Slides
Comparison Chart
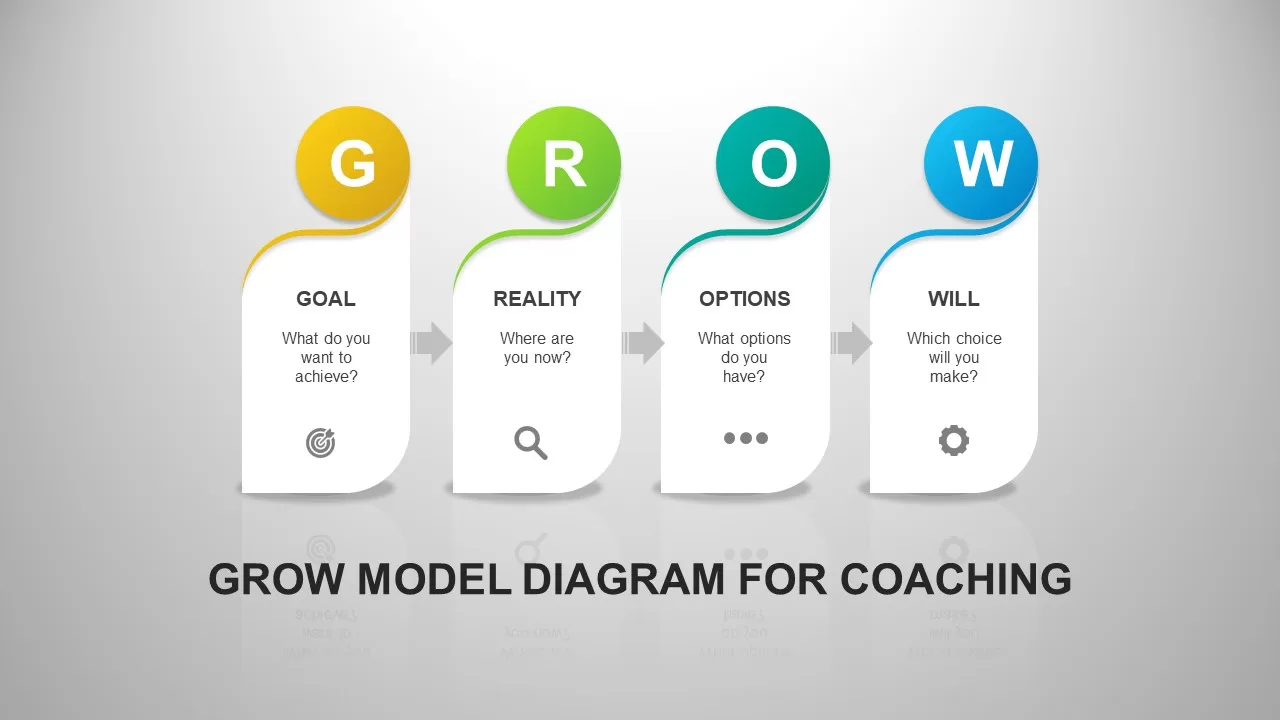
GROW Model Coaching PowerPoint & Google Slides Template for Presentations
Business Strategy
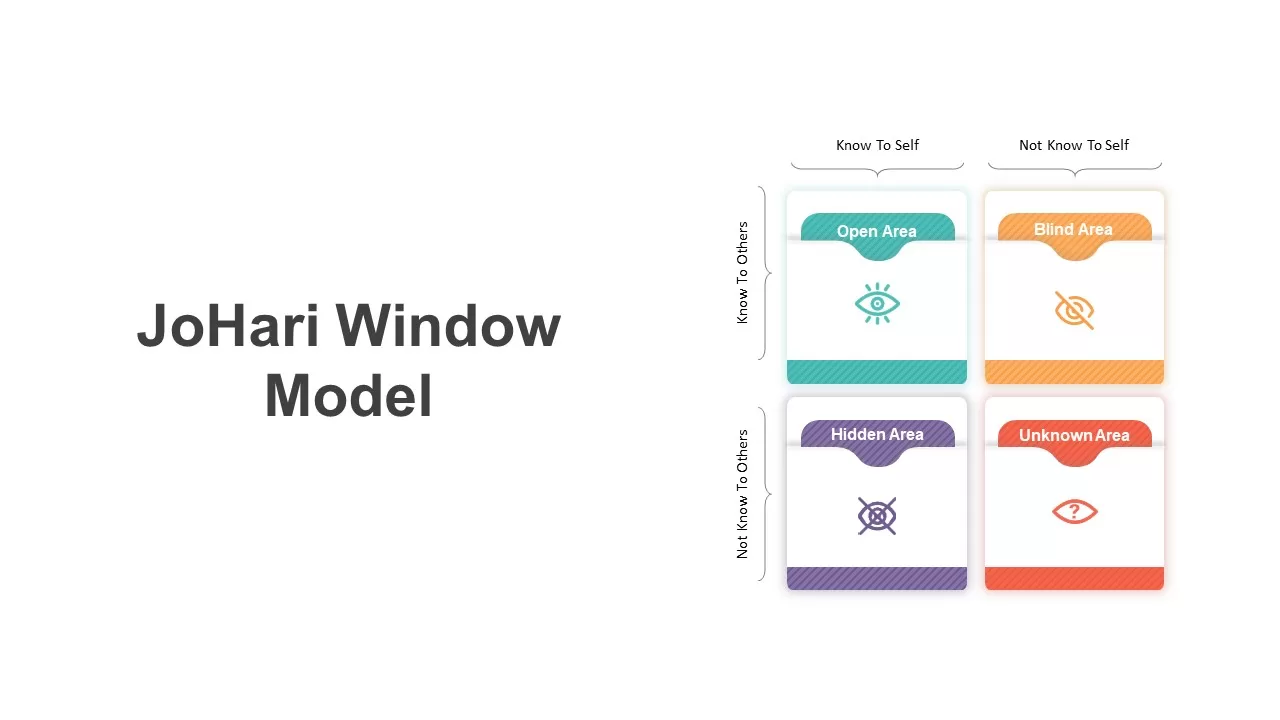
JoHari Window Model Template for PowerPoint & Google Slides
Employee Performance
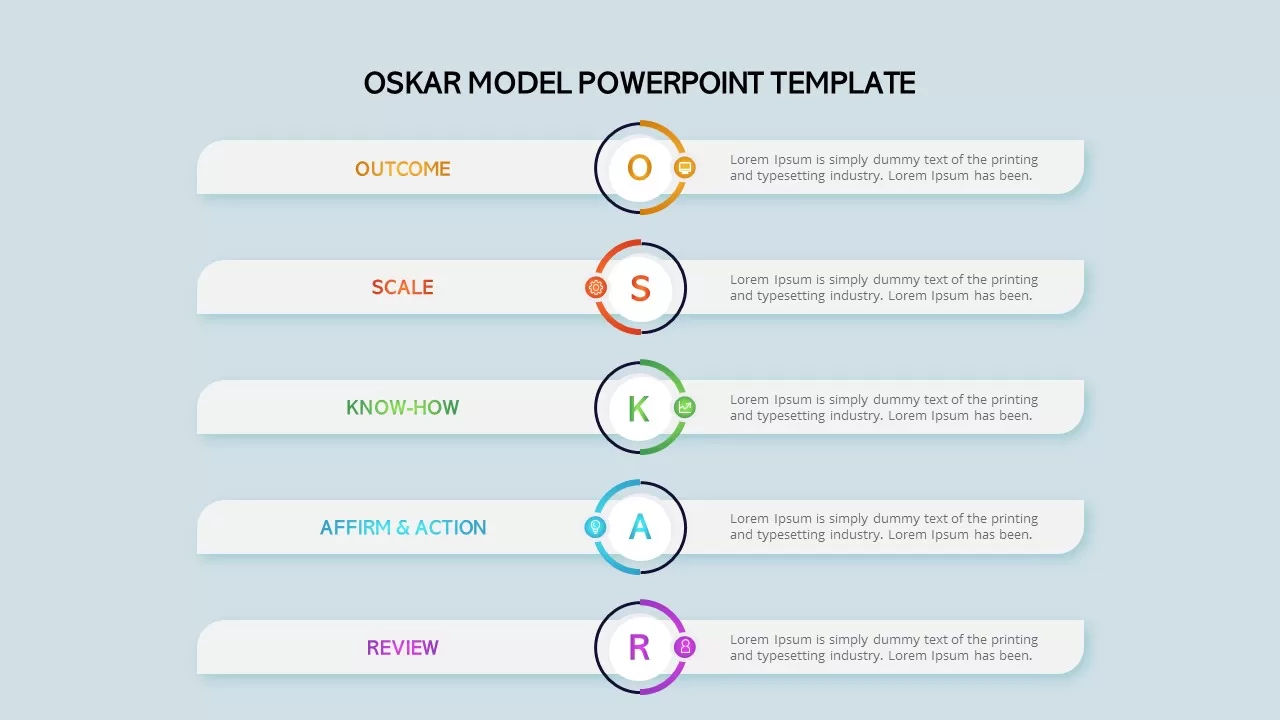
OSKAR Coaching Model Five-Step Framework Template for PowerPoint & Google Slides
Leadership
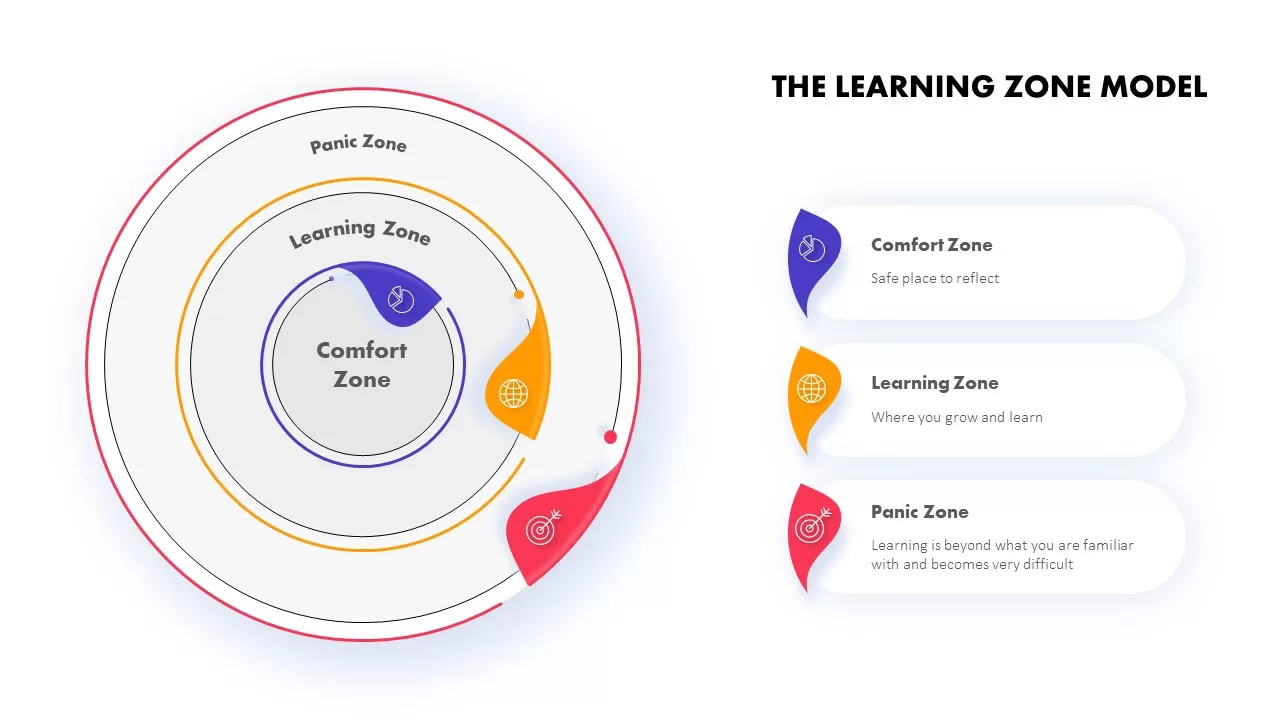
The Learning Zone Model Template for PowerPoint & Google Slides
Process
Lewin’s Change Model Overview Template for PowerPoint & Google Slides
Gap
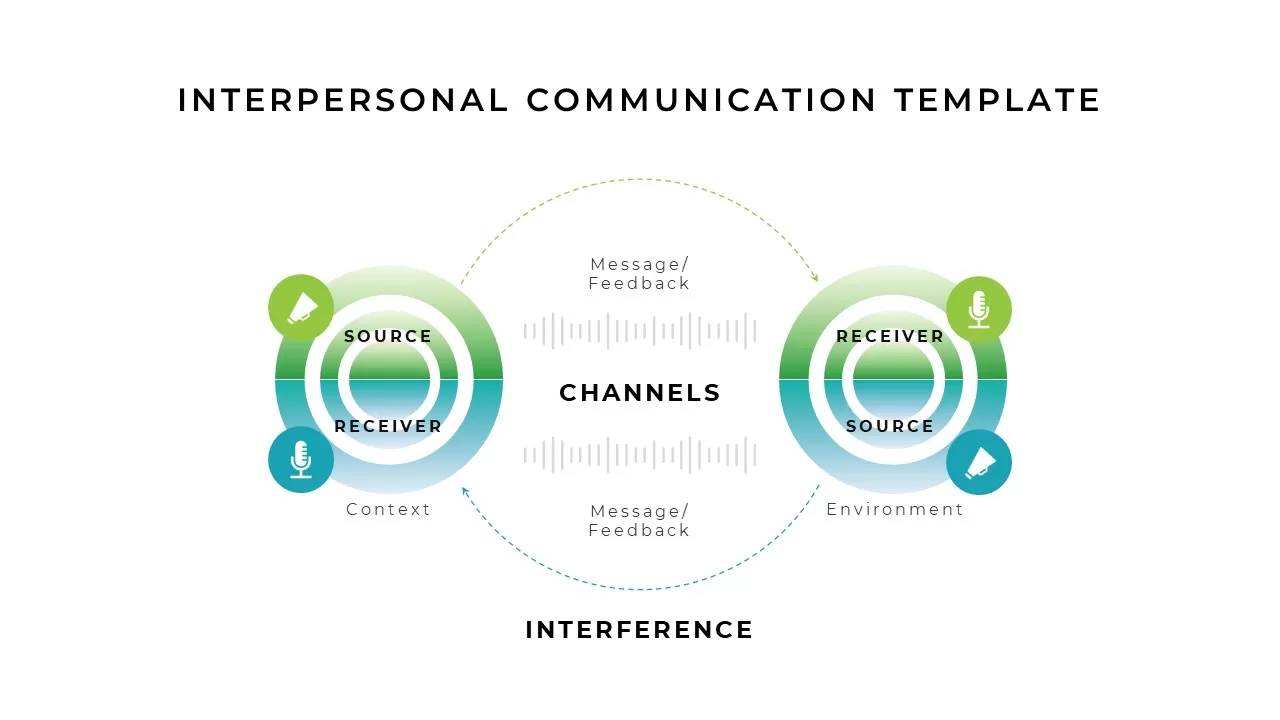
Interpersonal Communication Model Overview template for PowerPoint & Google Slides
Business
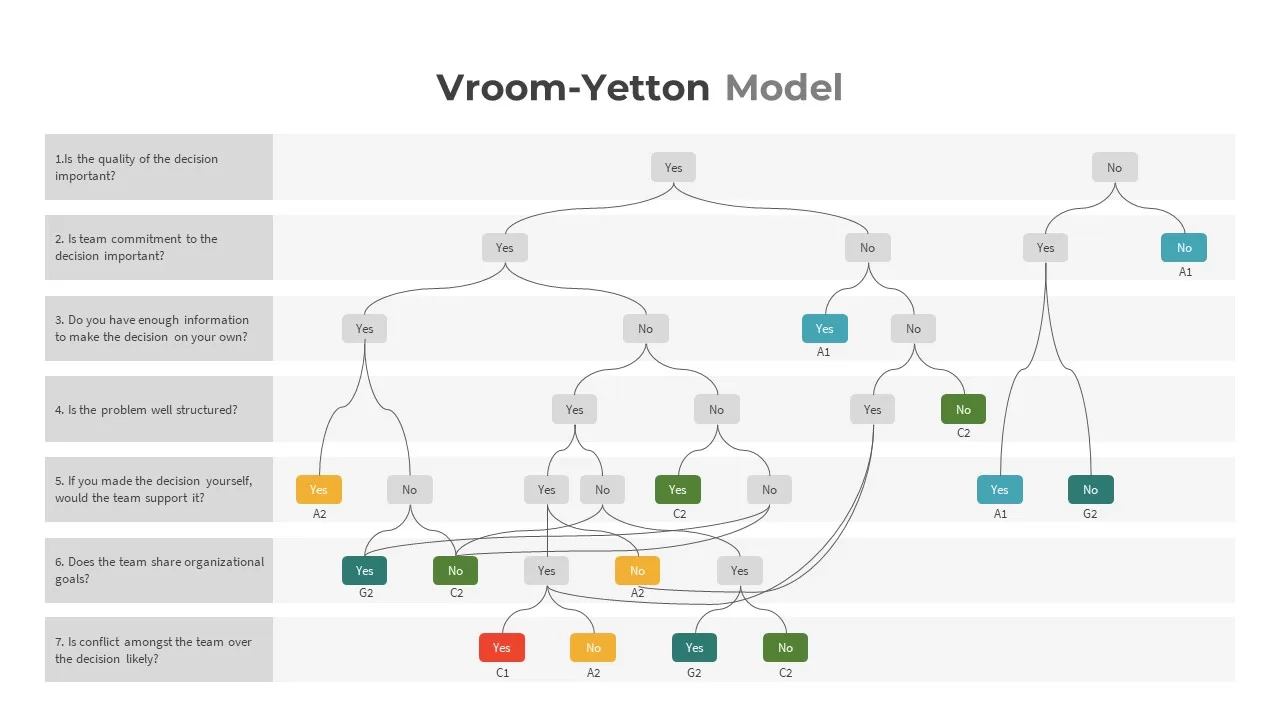
Vroom Yetton Model Template for PowerPoint & Google Slides
Business
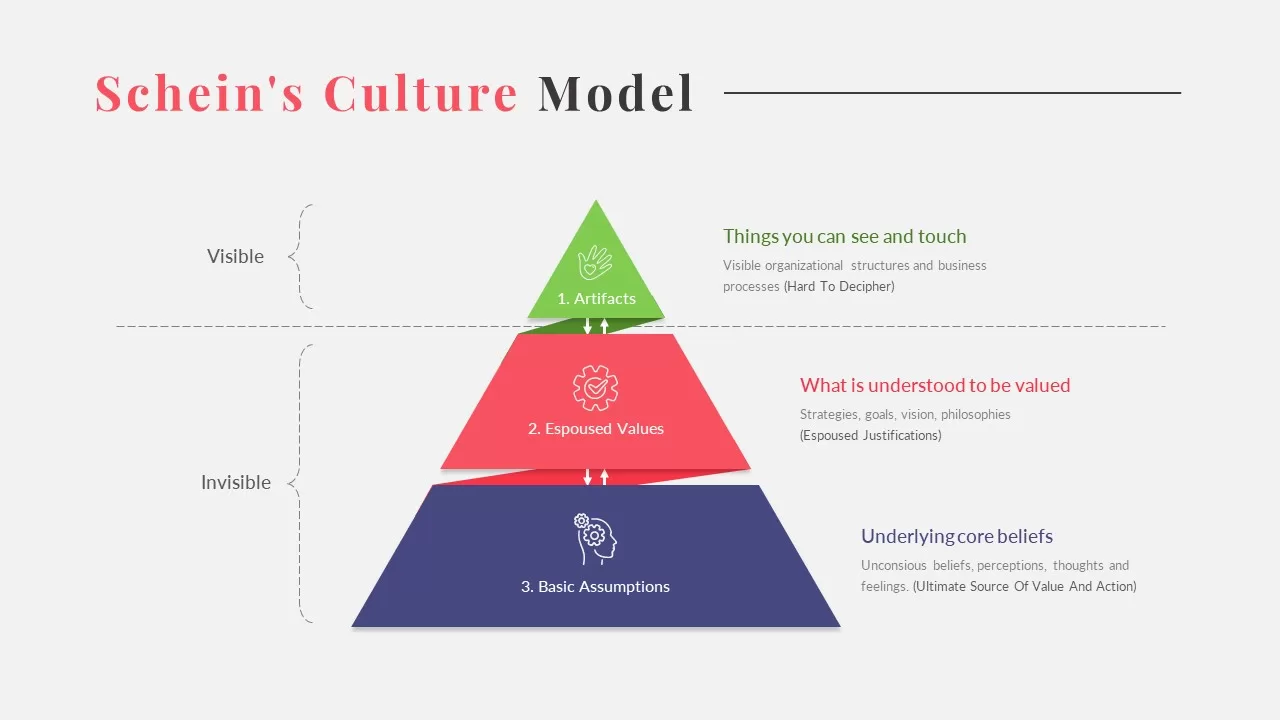
Schein’s Culture Pyramid Model Template for PowerPoint & Google Slides
Pyramid
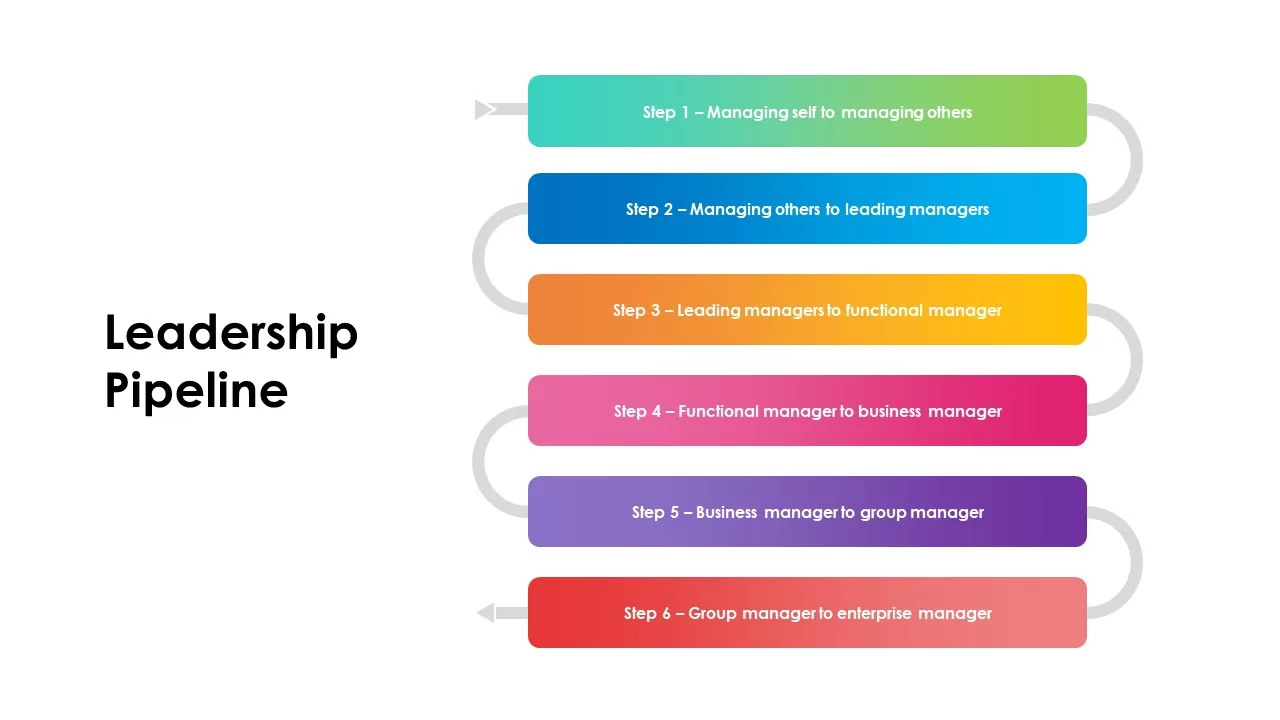
Leadership Pipeline Model Template for PowerPoint & Google Slides
Business Strategy
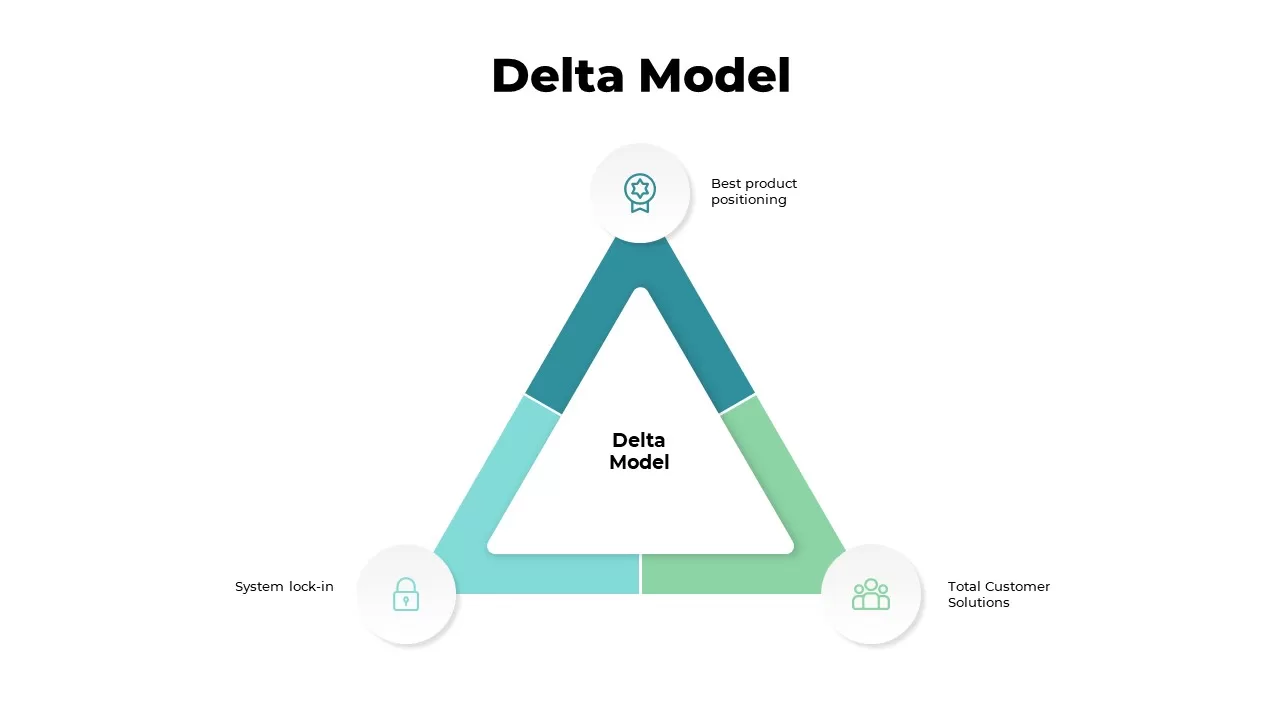
Delta Model Strategic Framework Template for PowerPoint & Google Slides
Business Strategy
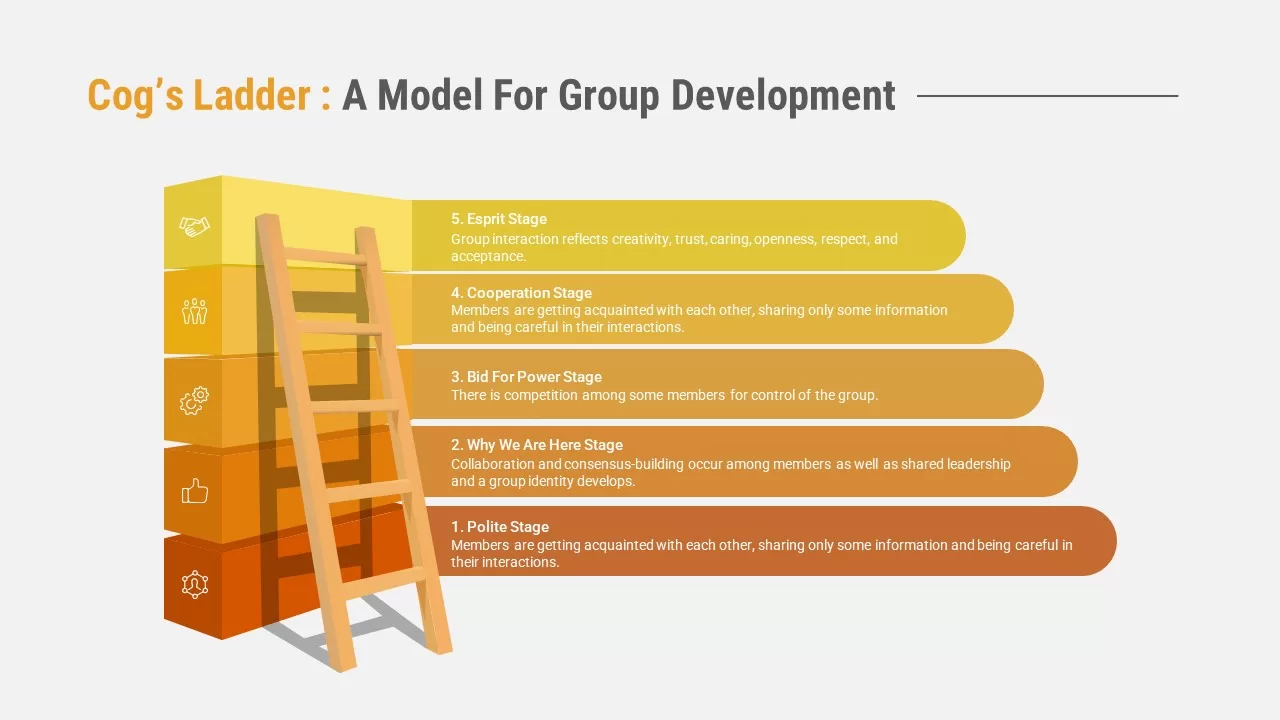
Cog’s Ladder Model for Group Development PowerPoint & Google Slides Template
Leadership
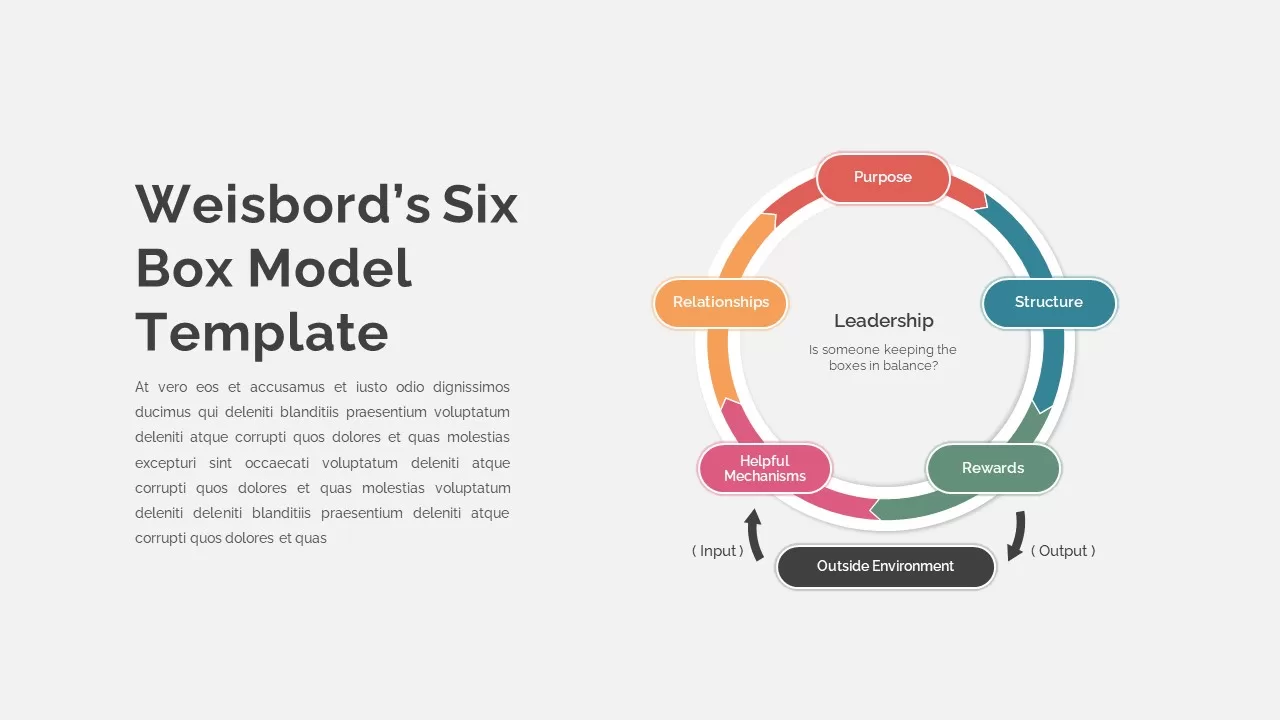
Weisbord’s Six Box Model Infographics Template for PowerPoint & Google Slides
Circular
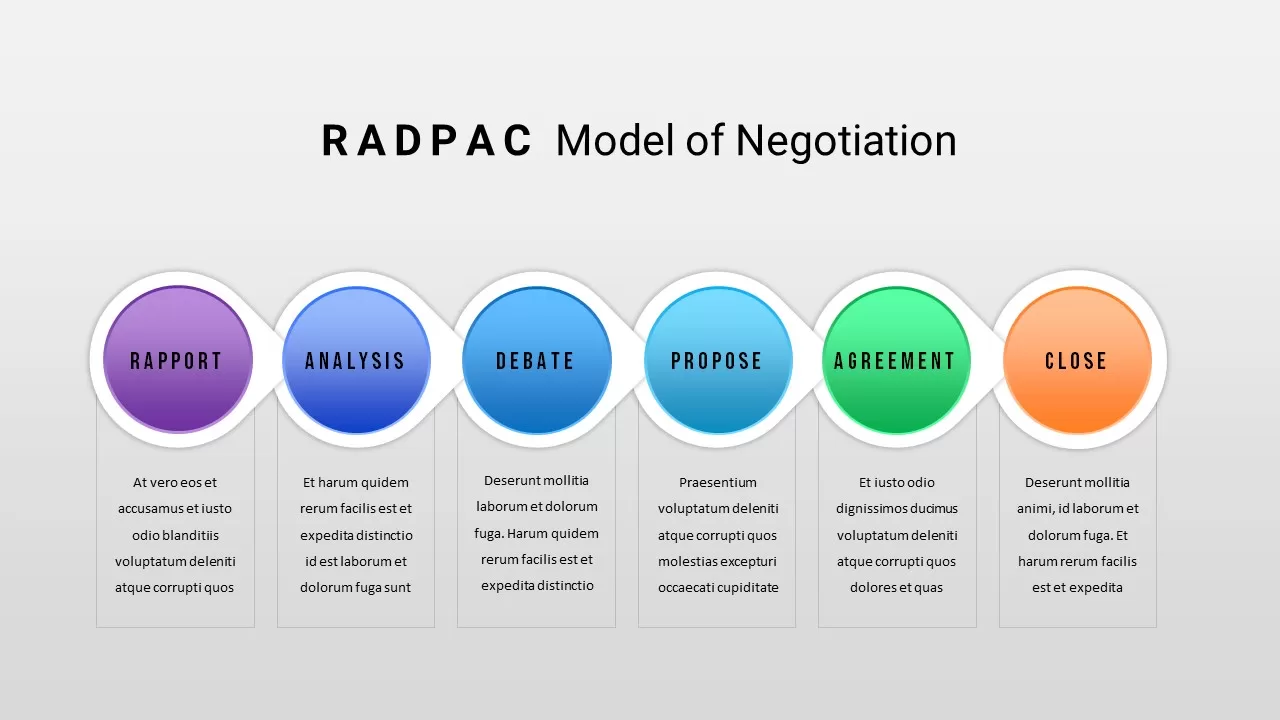
RADPAC Model of Negotiation template for PowerPoint & Google Slides
Competitor Analysis
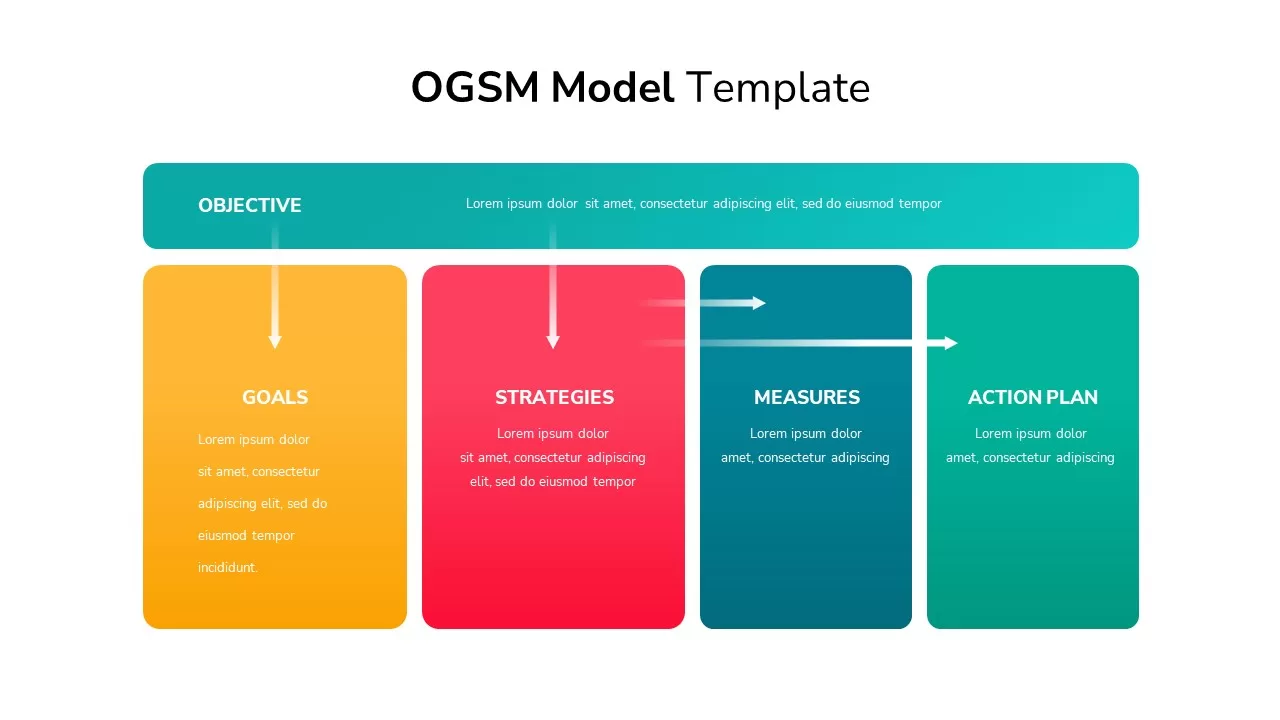
OGSM Model Template for PowerPoint & Google Slides
Competitor Analysis
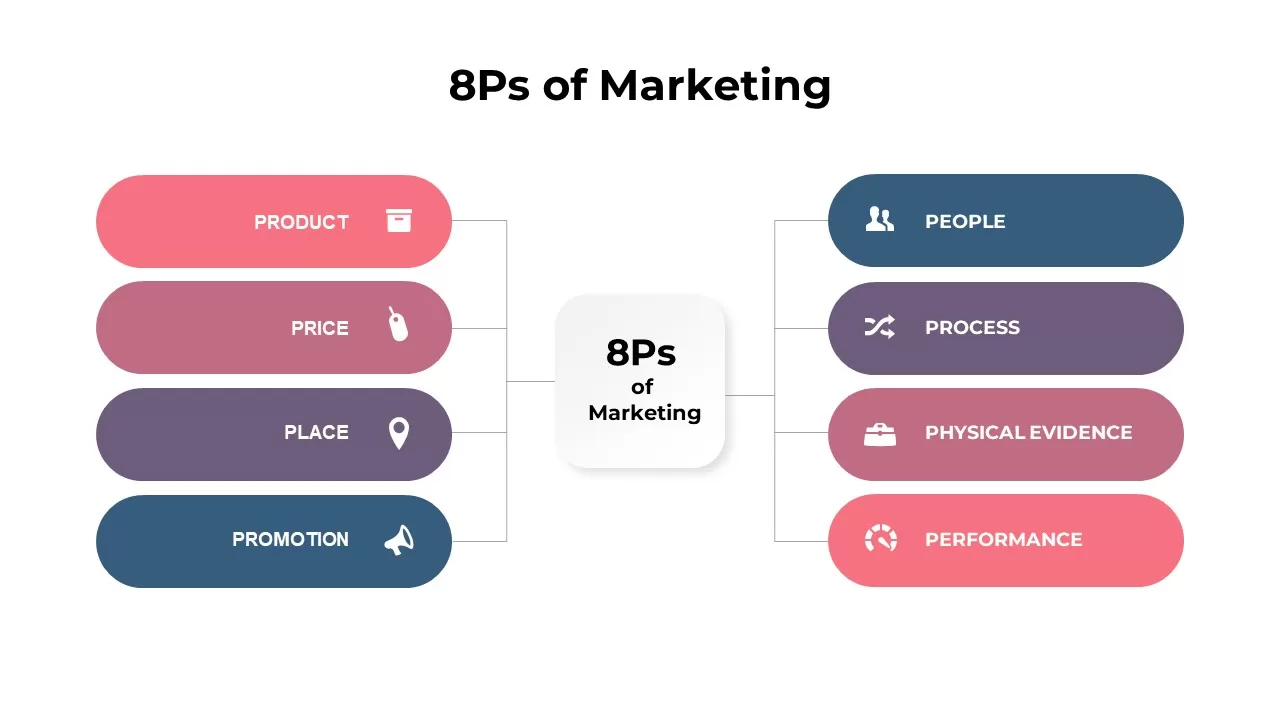
8Ps of Marketing Infographic Model Template for PowerPoint & Google Slides
Comparison
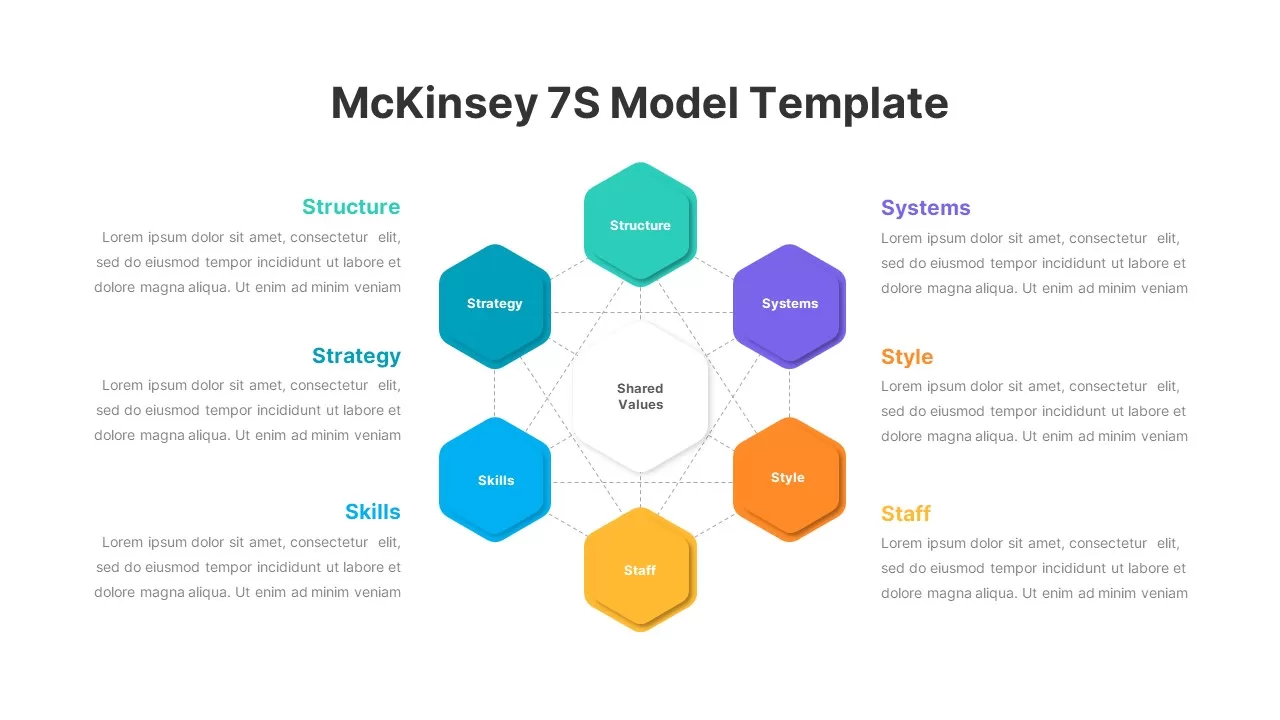
McKinsey 7S Strategic Alignment Model Template for PowerPoint & Google Slides
Business Strategy
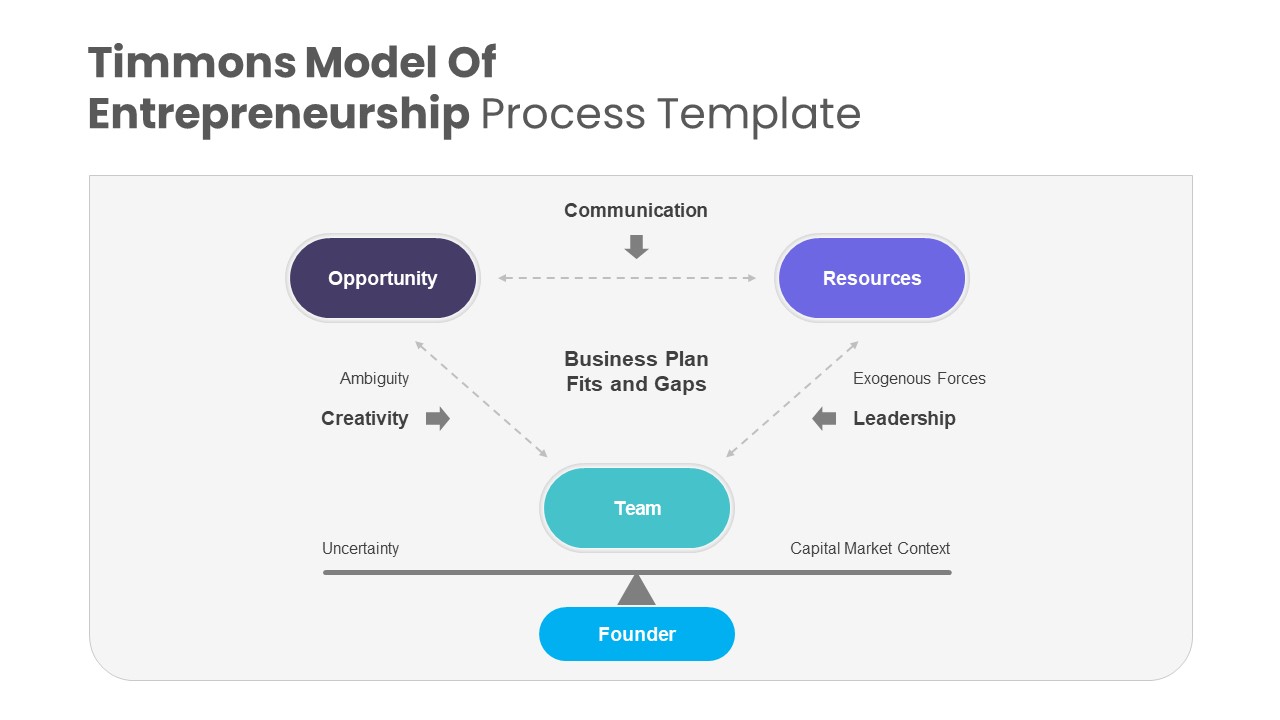
Timmons Model of Entrepreneurship Process Template for PowerPoint & Google Slides
Business Models
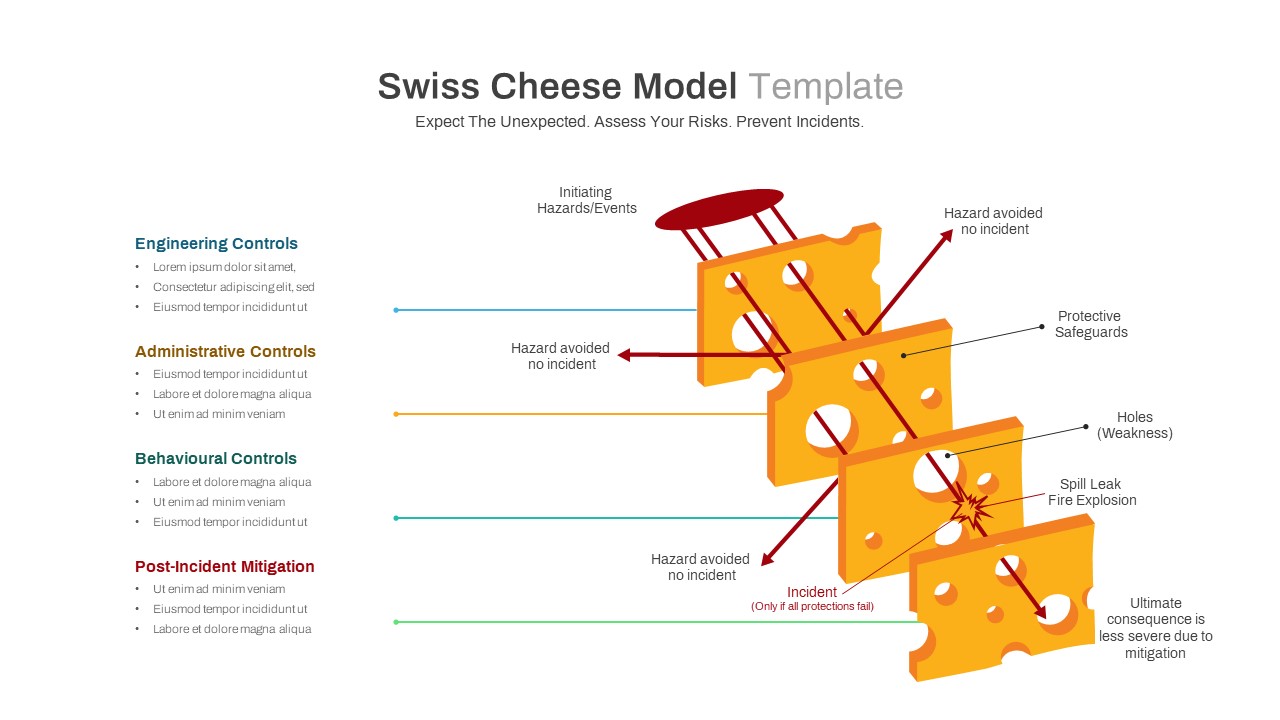
Swiss Cheese Risk Management Model Template for PowerPoint & Google Slides
Risk Management
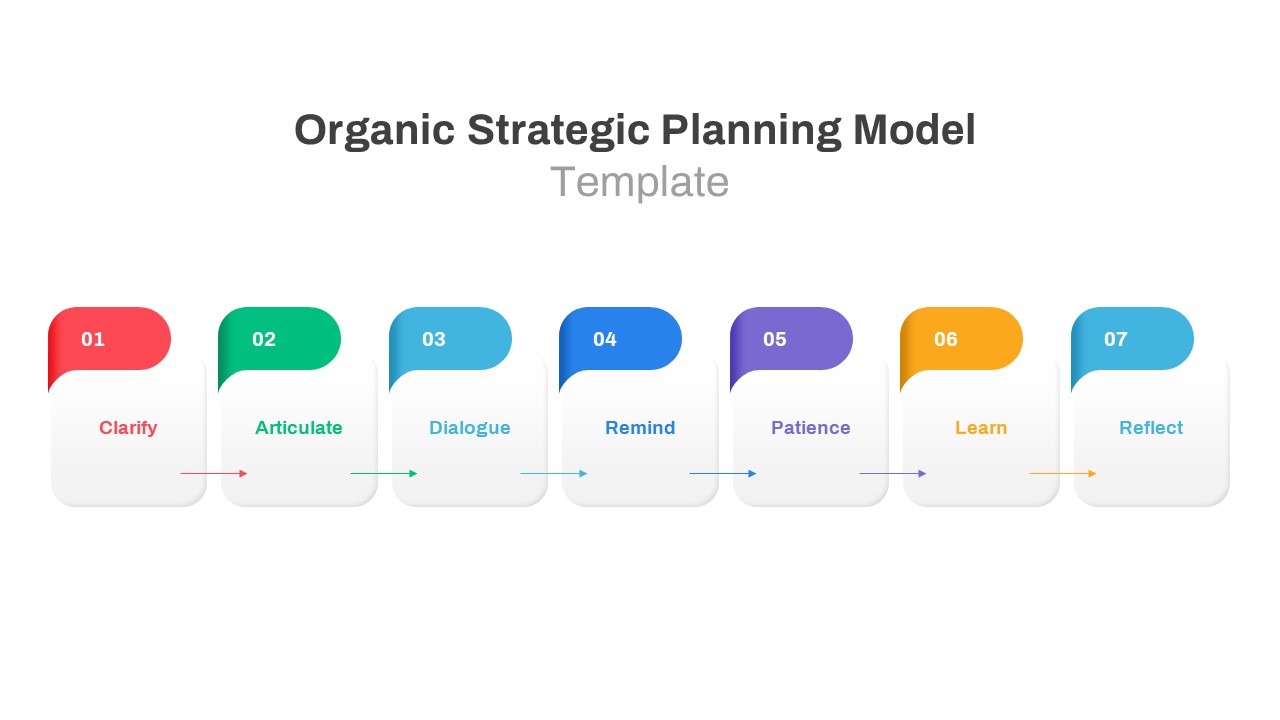
Organic Strategic Planning Model Template for PowerPoint & Google Slides
Business Strategy
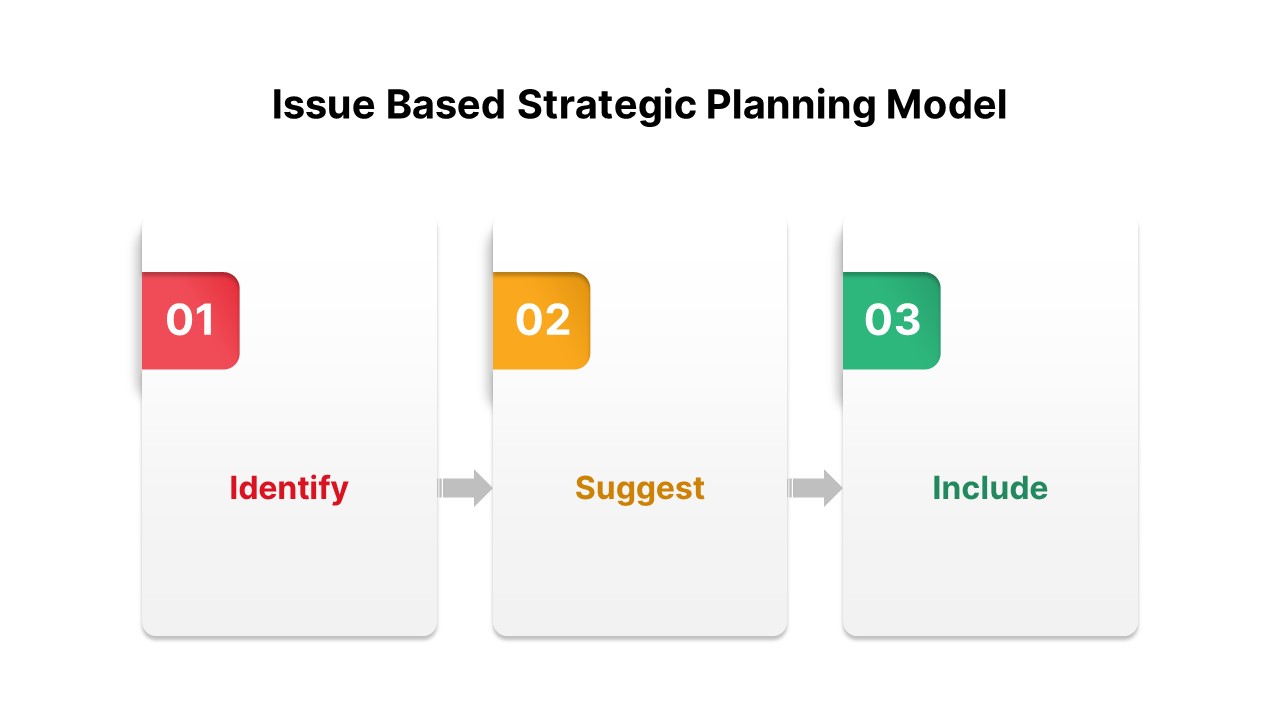
Issue-Based Strategic Planning Model Template for PowerPoint & Google Slides
Business Strategy
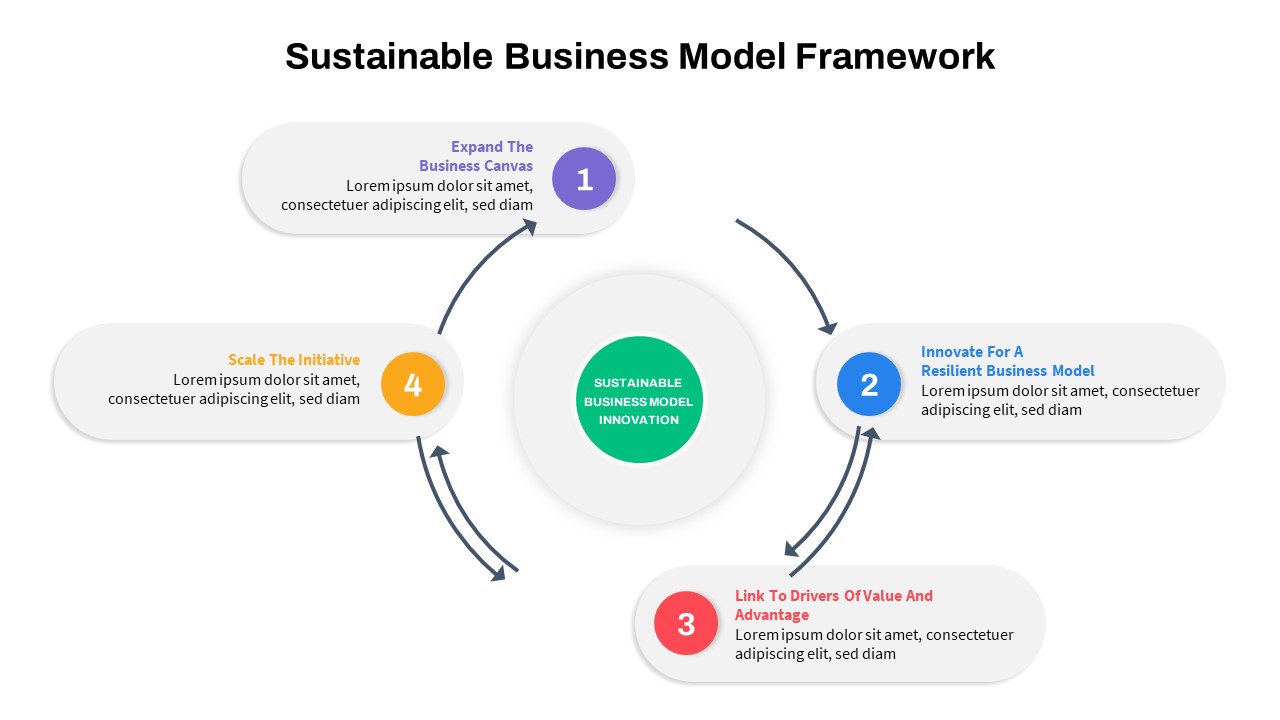
Sustainable Business Model Circular Infographic Template for PowerPoint & Google Slides
Business Strategy
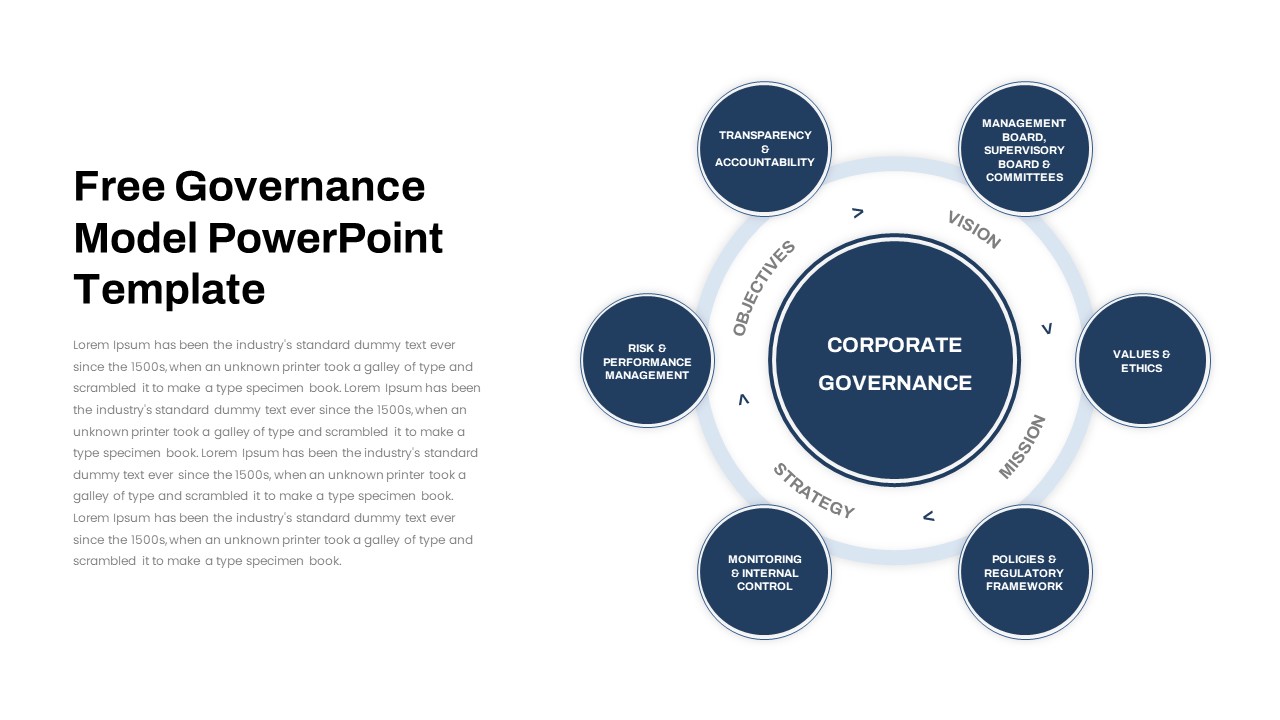
Free Corporate Governance Circular Model Template for PowerPoint & Google Slides
Circular
Free
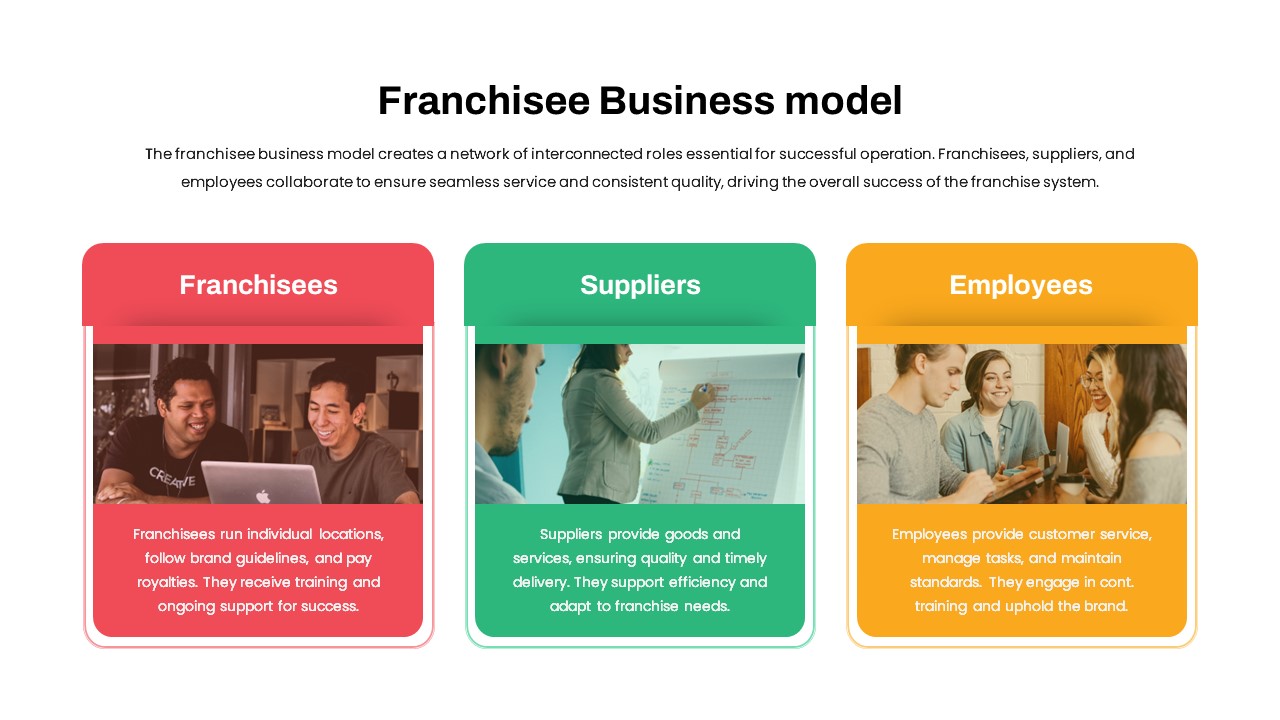
Franchisee Business Model Overview Template for PowerPoint & Google Slides
Business Models
Pricing Model Types Comparison Infographic Template for PowerPoint & Google Slides
Pitch Deck
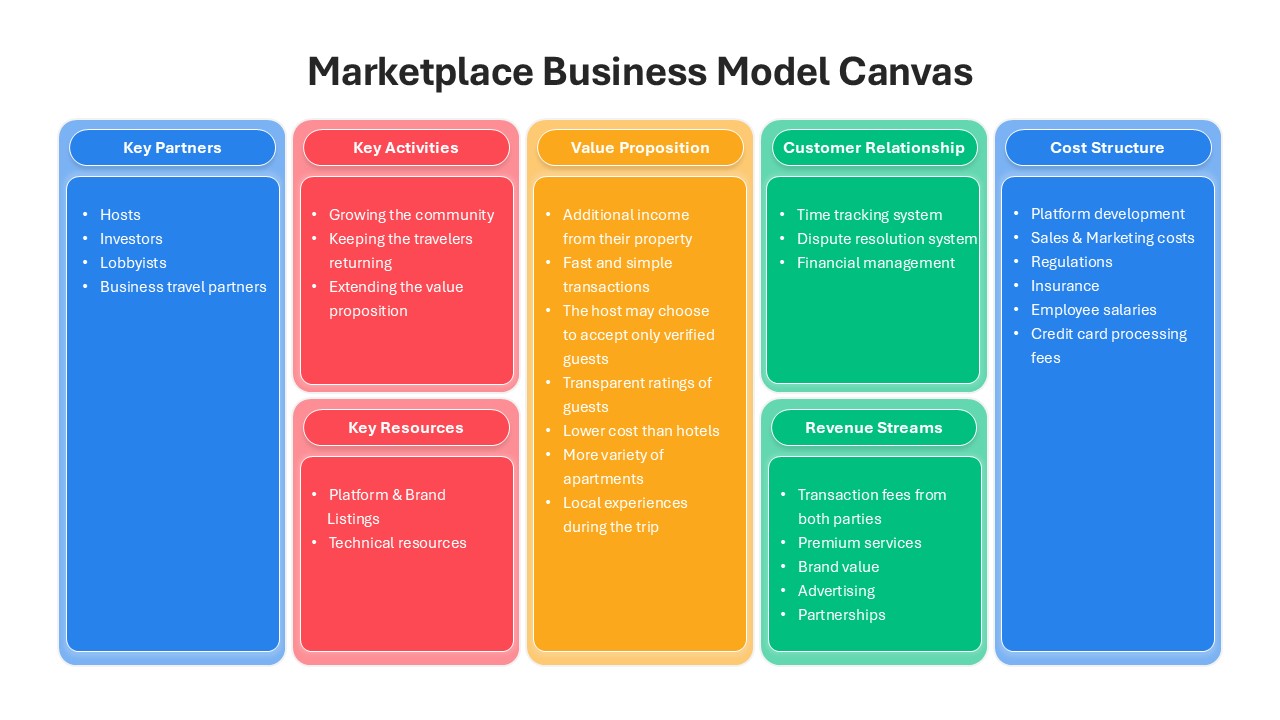
Marketplace Business Model Canvas Slide Template for PowerPoint & Google Slides
Business Models
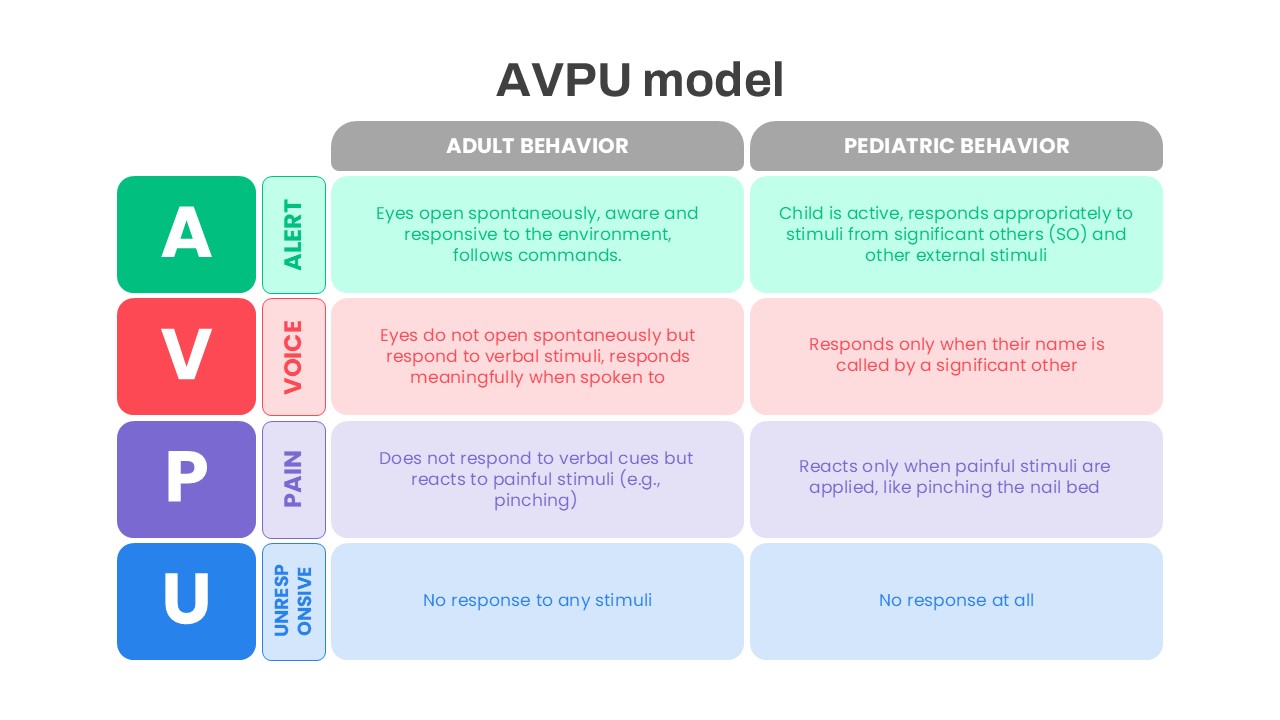
AVPU Model Behavior Assessment Template for PowerPoint & Google Slides
Health
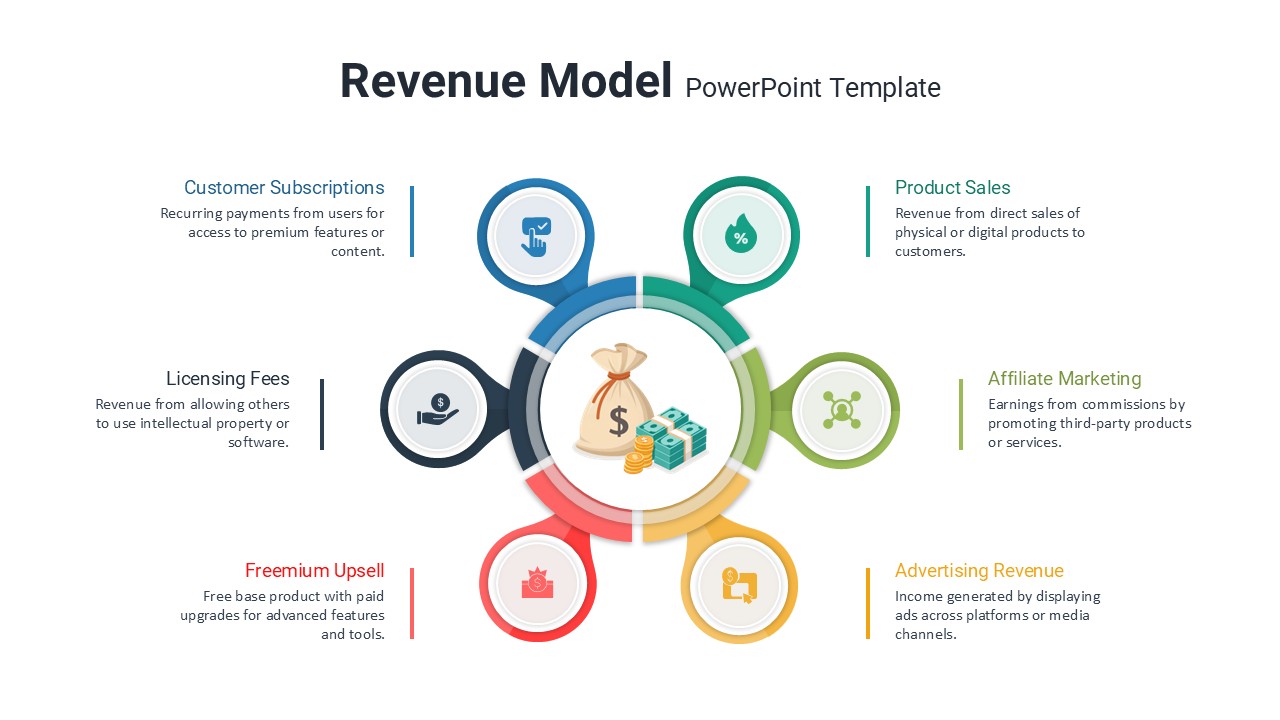
Six Revenue Stream Model Infographic Template for PowerPoint & Google Slides
Circular
Zero Trust Security Model Overview template for PowerPoint & Google Slides
Infographics
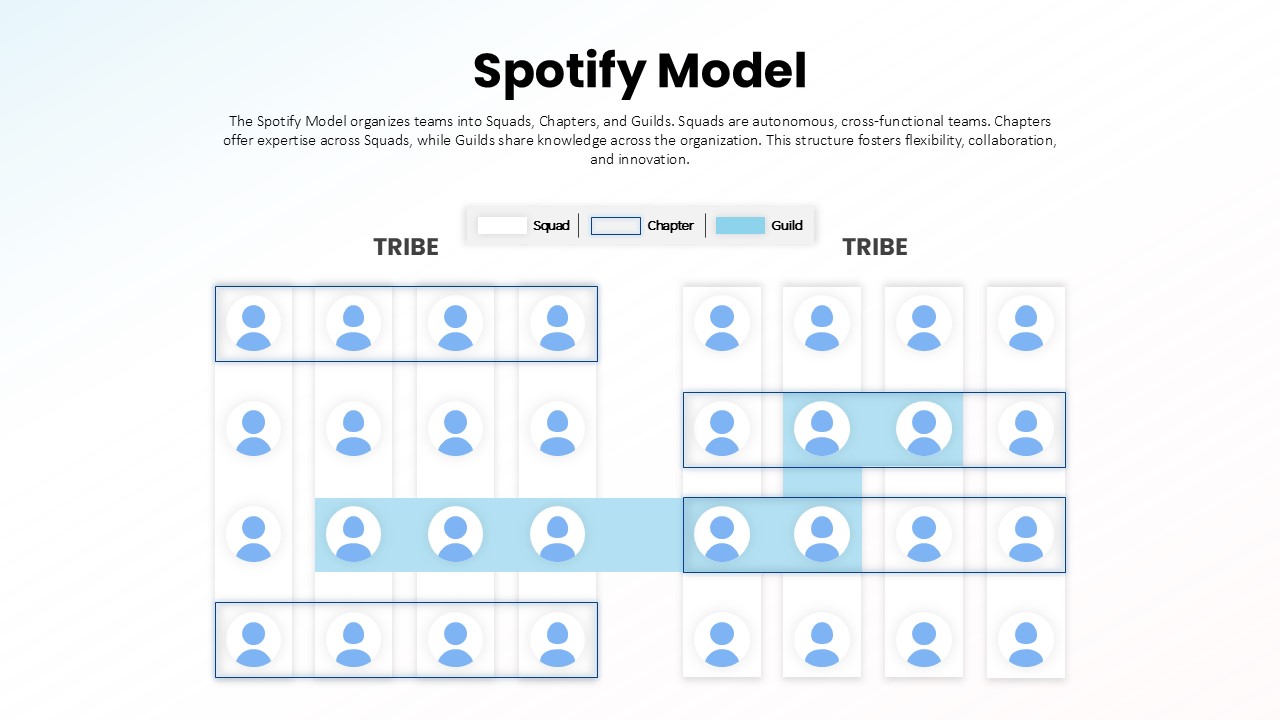
Spotify Model Organizational Structure template for PowerPoint & Google Slides
Business Strategy
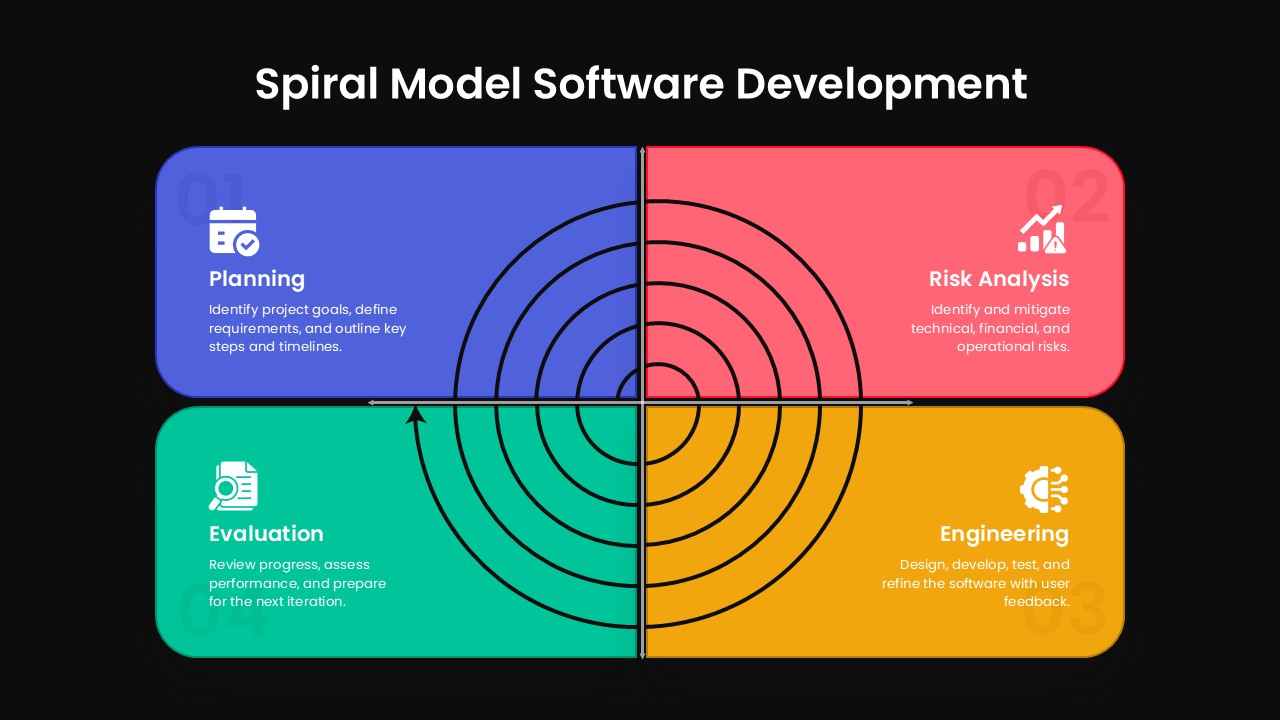
Spiral Model Software Development Template for PowerPoint & Google Slides
Process
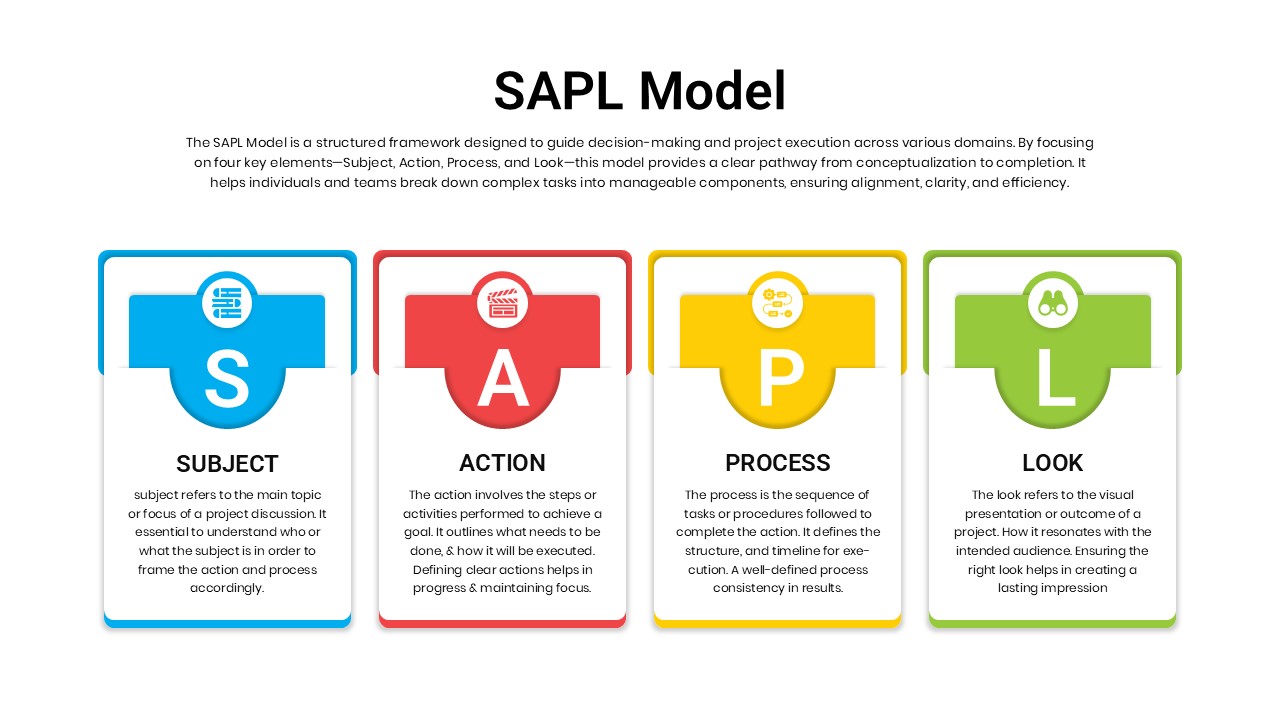
SAPL Model Framework template for PowerPoint & Google Slides
Business
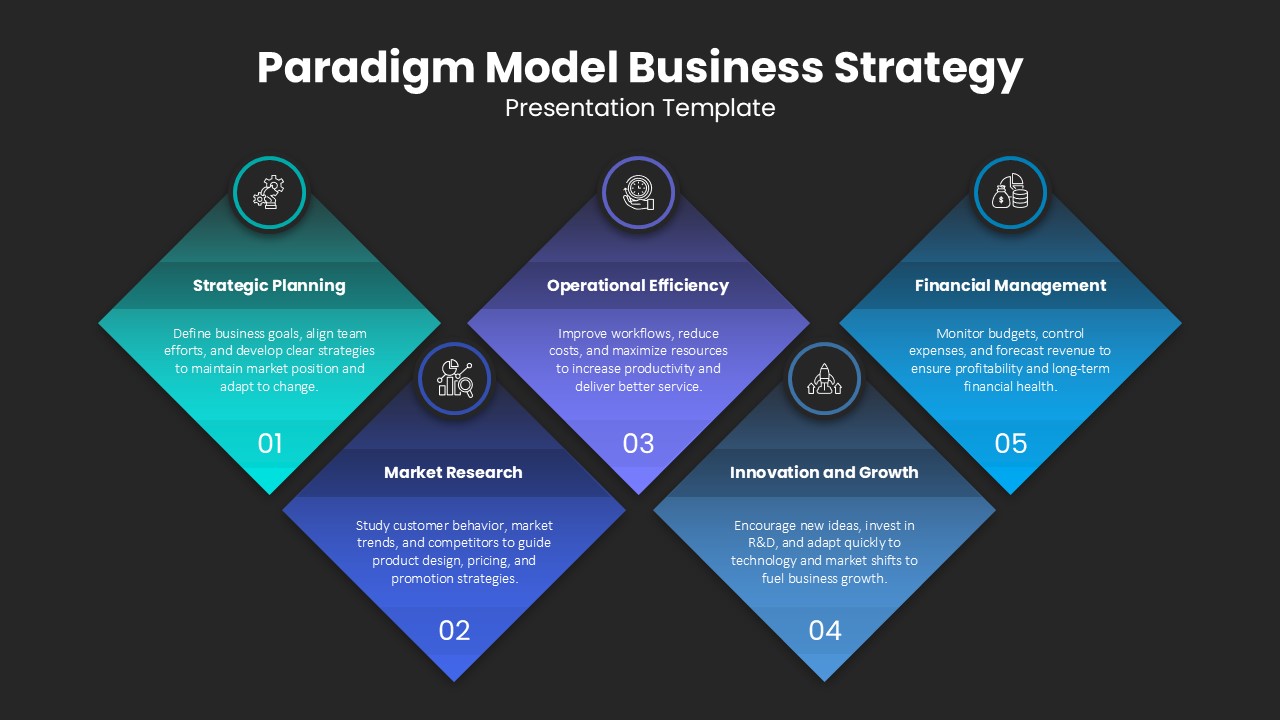
Paradigm Model Business Strategy Template for PowerPoint & Google Slides
Business Strategy
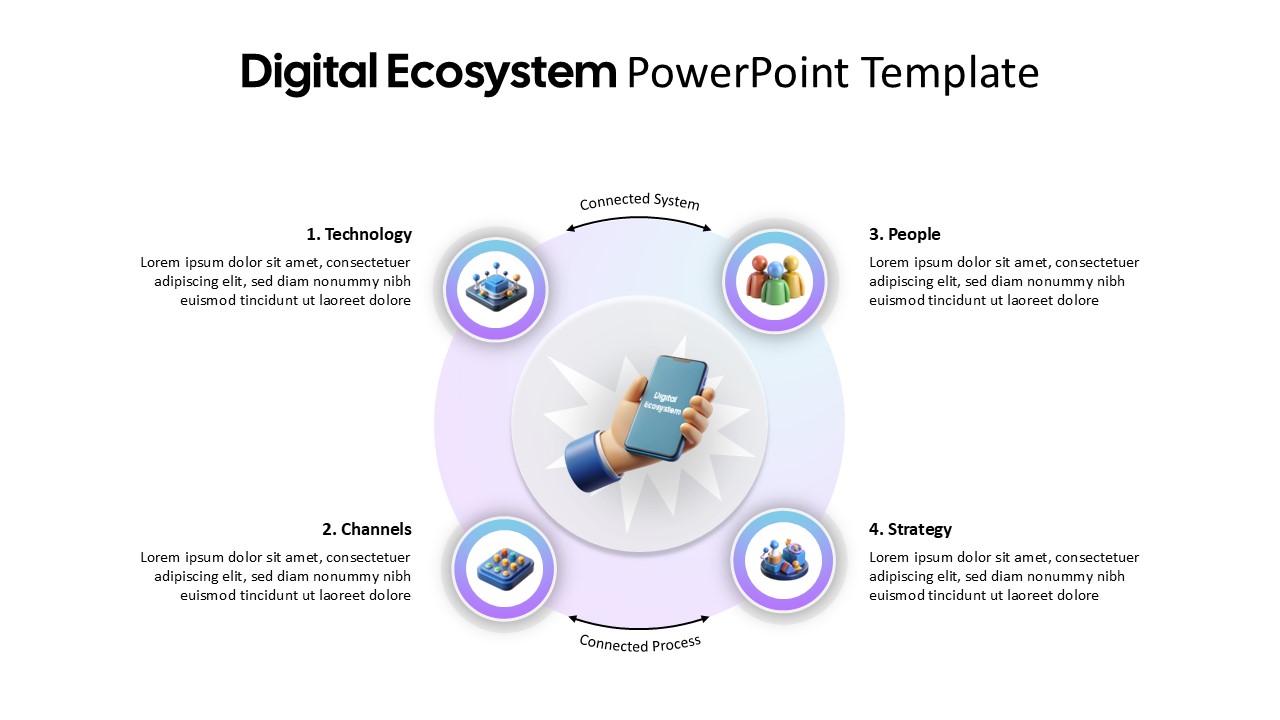
Digital Ecosystem Circular Model Template for PowerPoint & Google Slides
Information Technology
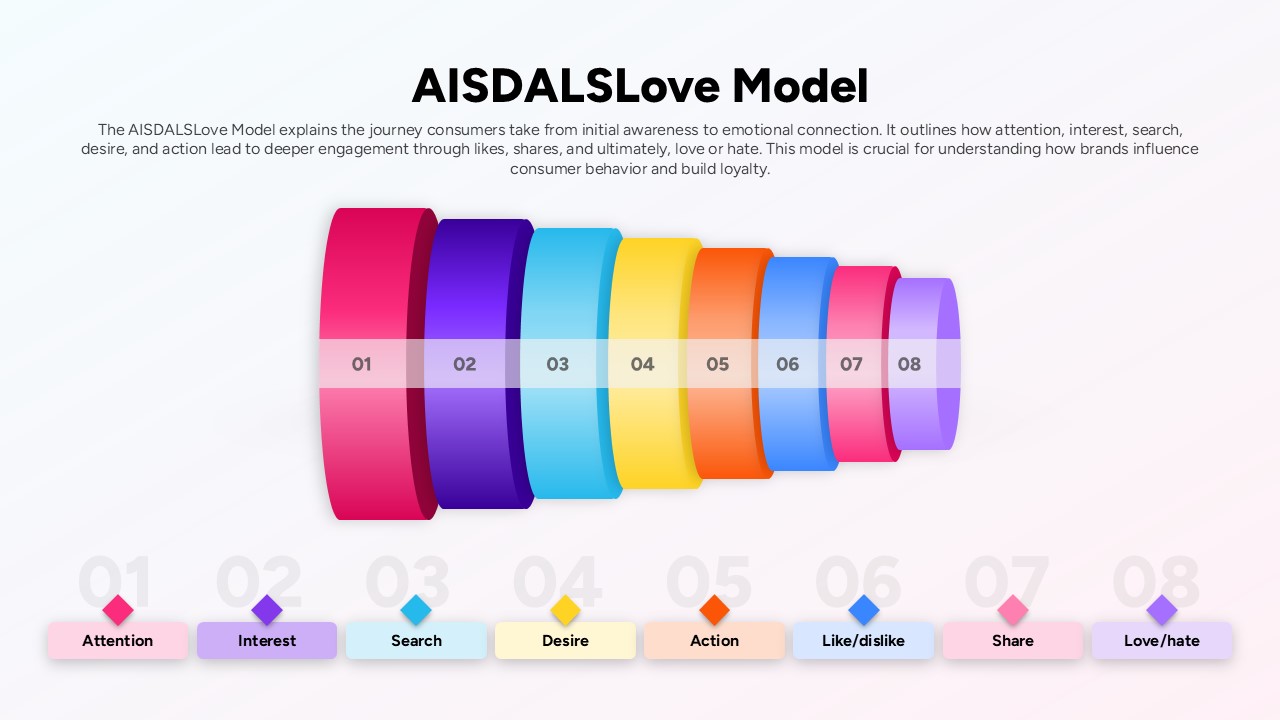
AISDALSLove Consumer Journey Model Slide Template for PowerPoint & Google Slides
Customer Journey
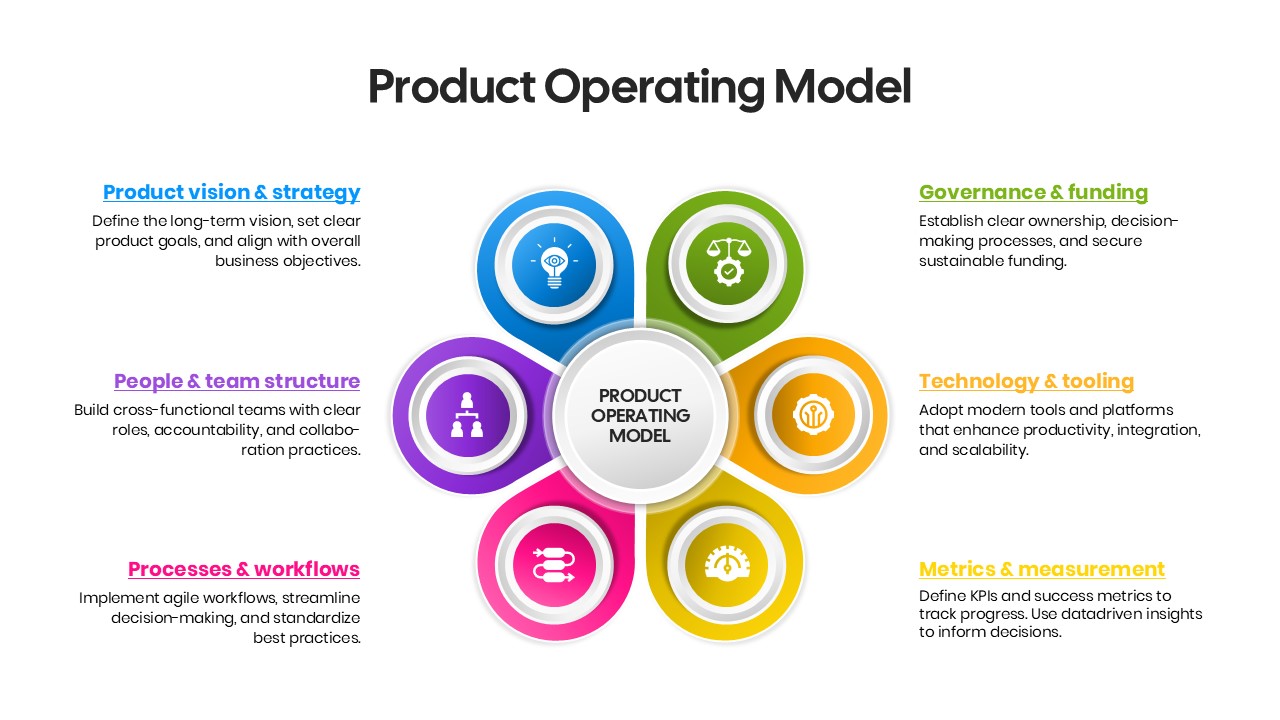
Product Operating Model Framework Template for PowerPoint & Google Slides
Business Strategy