A/B Testing Tools Radial Diagram Template for PowerPoint & Google Slides

Description
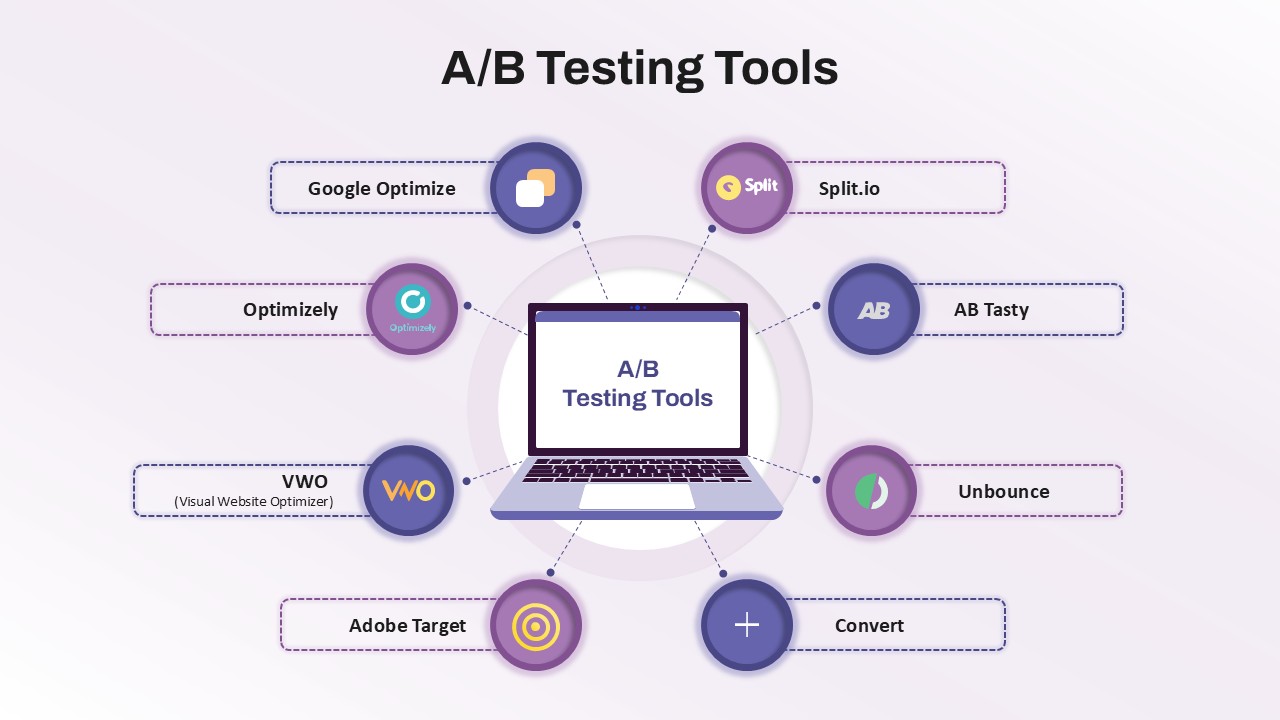
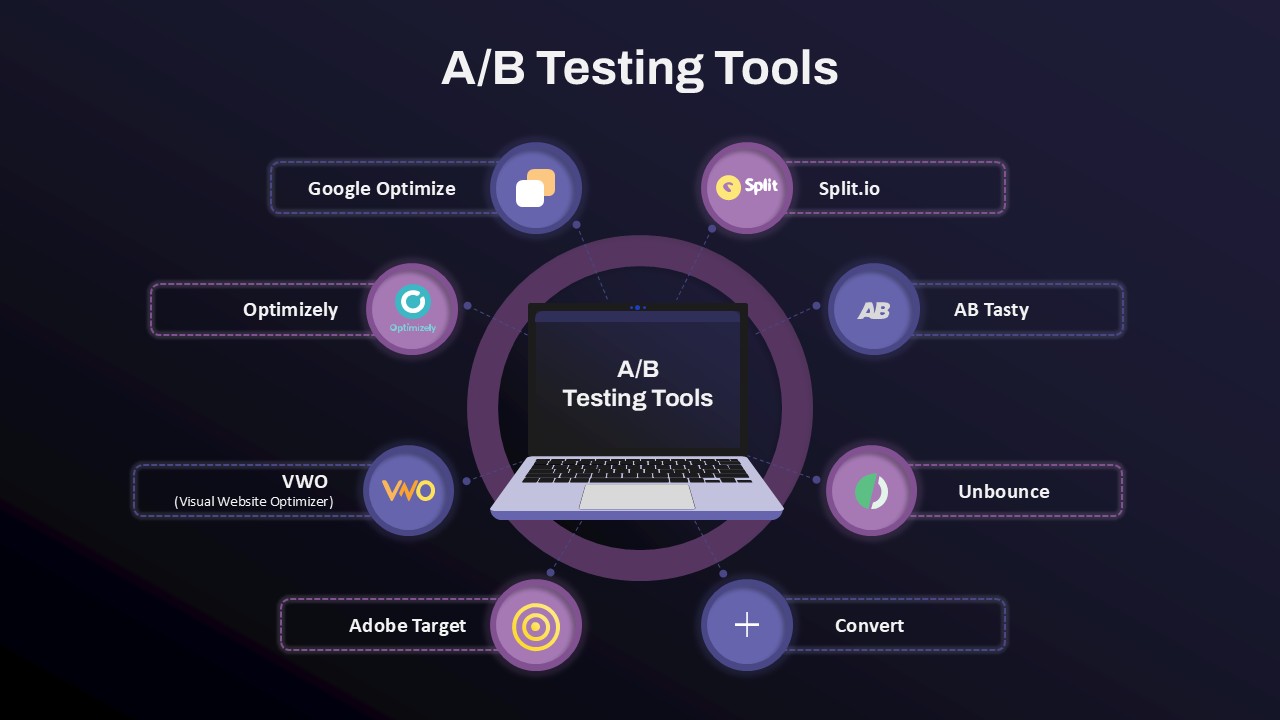
Map out essential A/B testing platforms with this radial infographic slide. A central laptop icon anchors editable vector circles for Google Optimize, Optimizely, VWO, Adobe Target, Split.io, AB Tasty, Unbounce, and Convert—each linked by dashed lines to text placeholders. Swap logos, relabel callouts, or adjust circle colors in seconds using master-slide controls. Preconfigured entrance animations reveal each tool sequentially, guiding viewers through your optimization toolkit. The subtle gradient background and clean sans-serif typography ensure clarity and a polished, professional aesthetic across devices.
Who is it for
Digital marketers, conversion-rate optimization specialists, and UX teams will leverage this diagram to present platform comparisons, audit tool coverage, and recommend best-fit solutions during strategy workshops and client pitches.
Other Uses
Repurpose this radial layout for any ecosystem overview—such as CRM integrations, DevOps toolchains, or social-media management suites—by swapping icons, relabeling segments, and updating callouts to fit your narrative.
Login to download this file

Item ID
SB05337
Related Templates

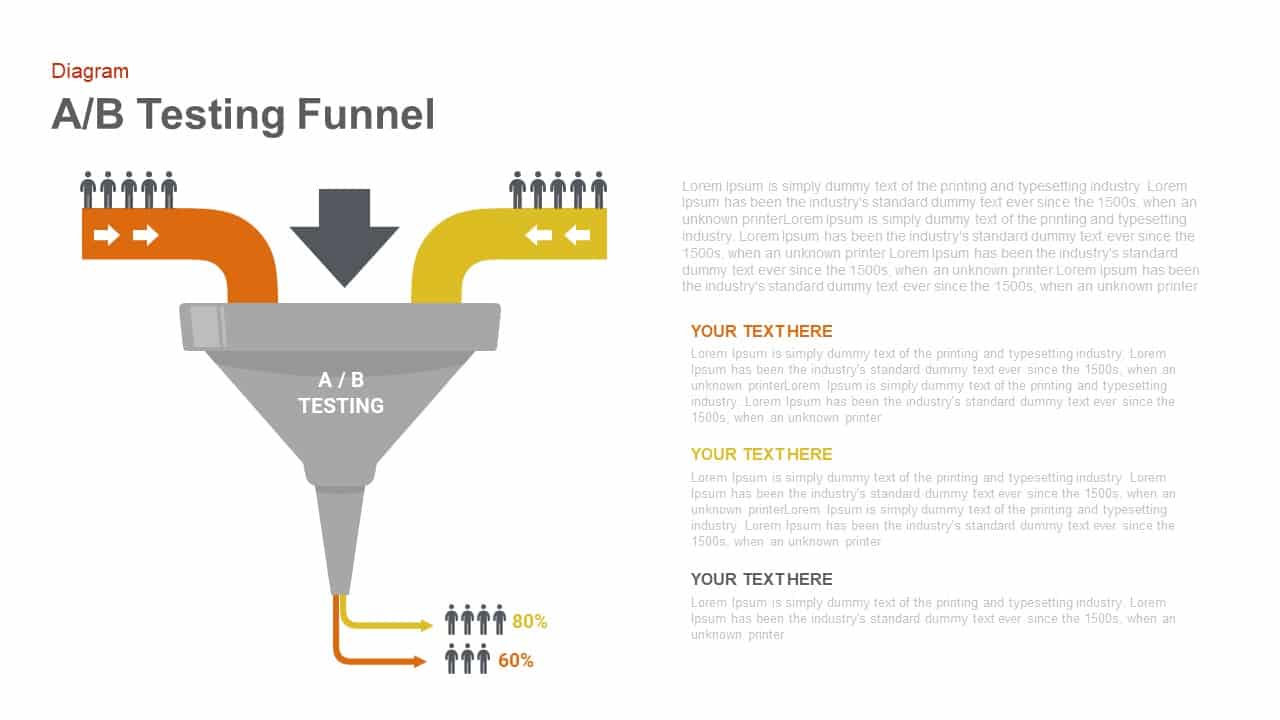
A/B Testing Funnel Diagram Template for PowerPoint & Google Slides
Digital Marketing

A/B Testing Comparison Infographic template for PowerPoint & Google Slides
Comparison
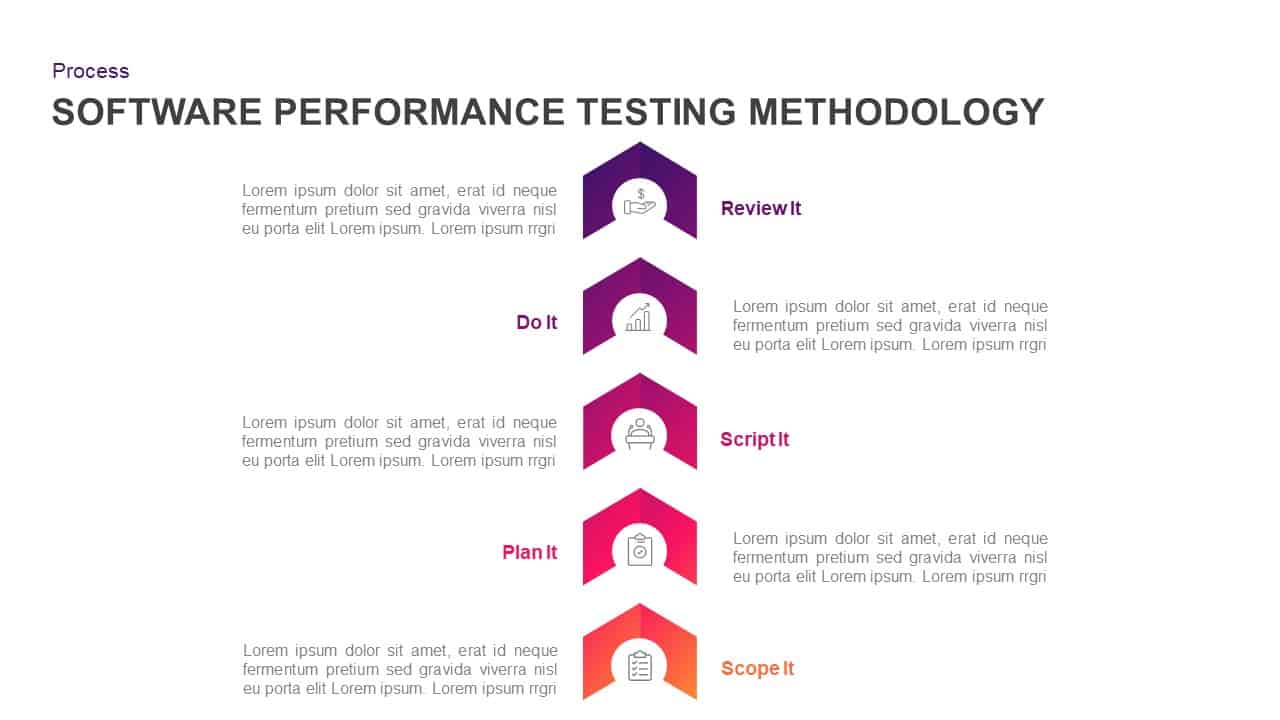
Software Performance Testing Methodology Template for PowerPoint & Google Slides
Process
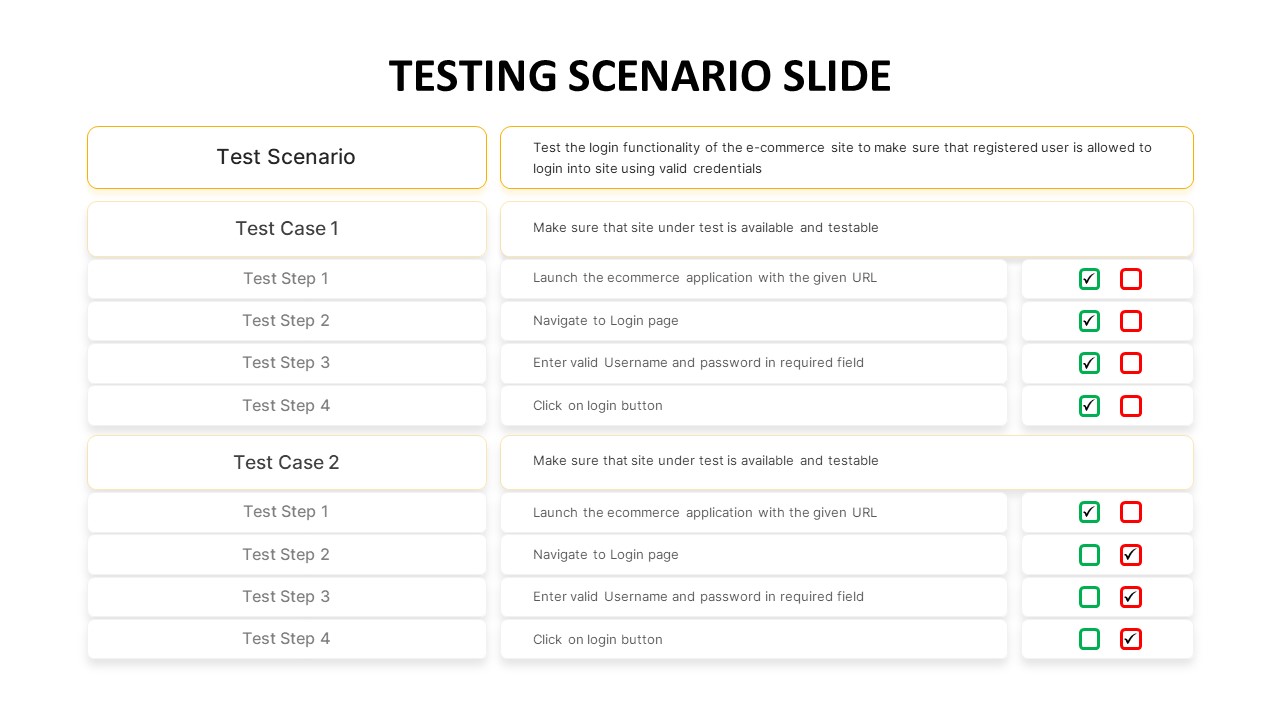
Testing Scenario Table Template for PowerPoint & Google Slides
Business Requirements
Six Arrow Radial Process Diagram template for PowerPoint & Google Slides
Infographics
Risk Management Mind Map Radial Diagram template for PowerPoint & Google Slides
Mind Maps

Eight-Stage Radial Process Flow Diagram Template for PowerPoint & Google Slides
Process
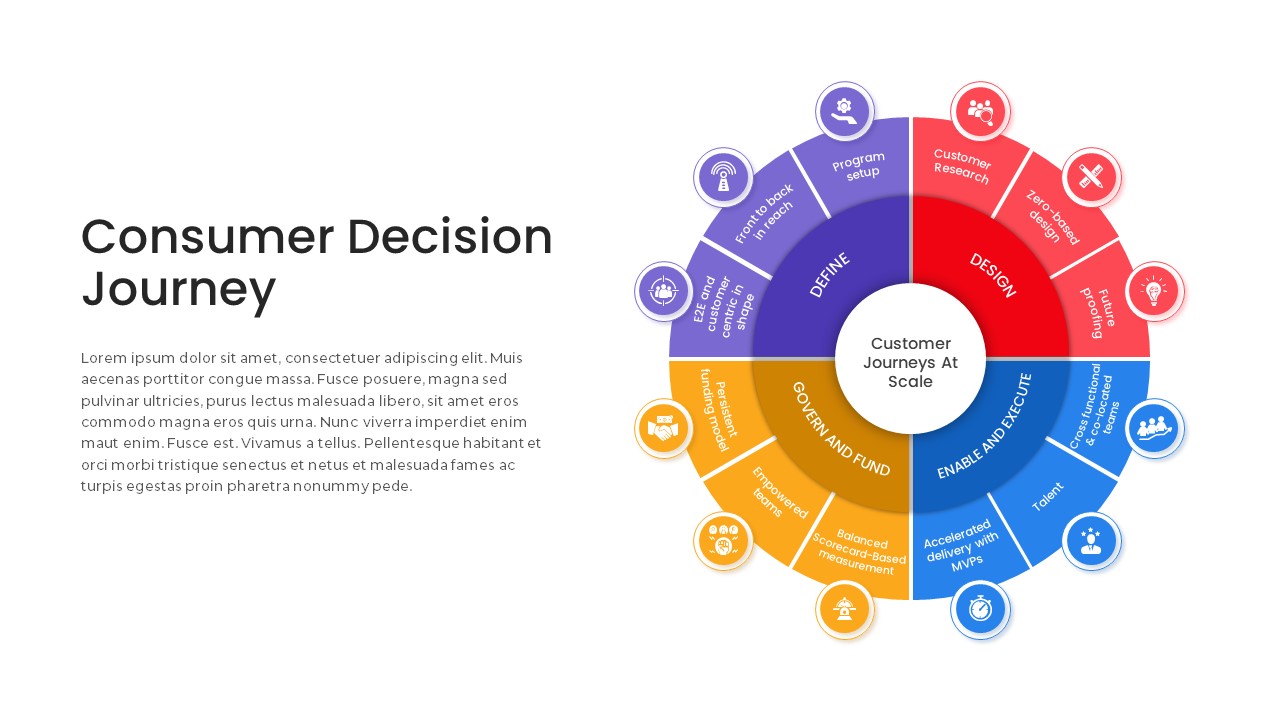
Consumer Decision Journey Radial Diagram Template for PowerPoint & Google Slides
Circular
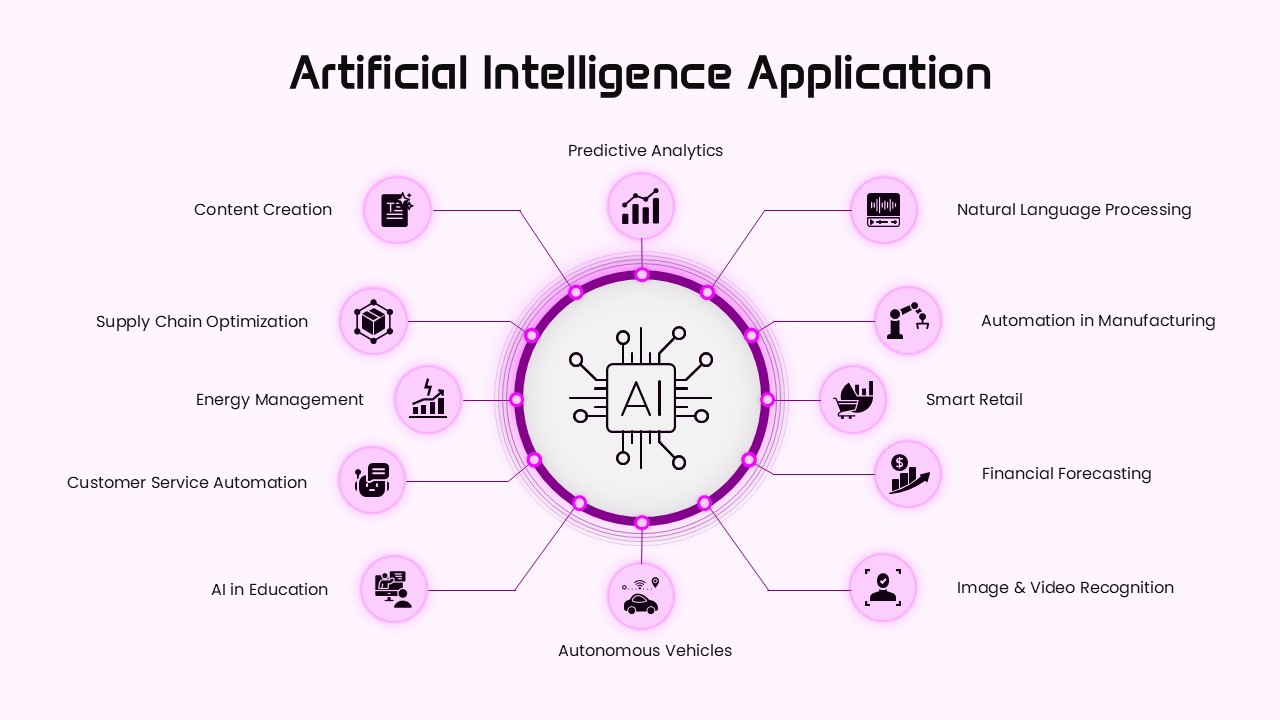
AI Applications Radial Hub Diagram Template for PowerPoint & Google Slides
Circular
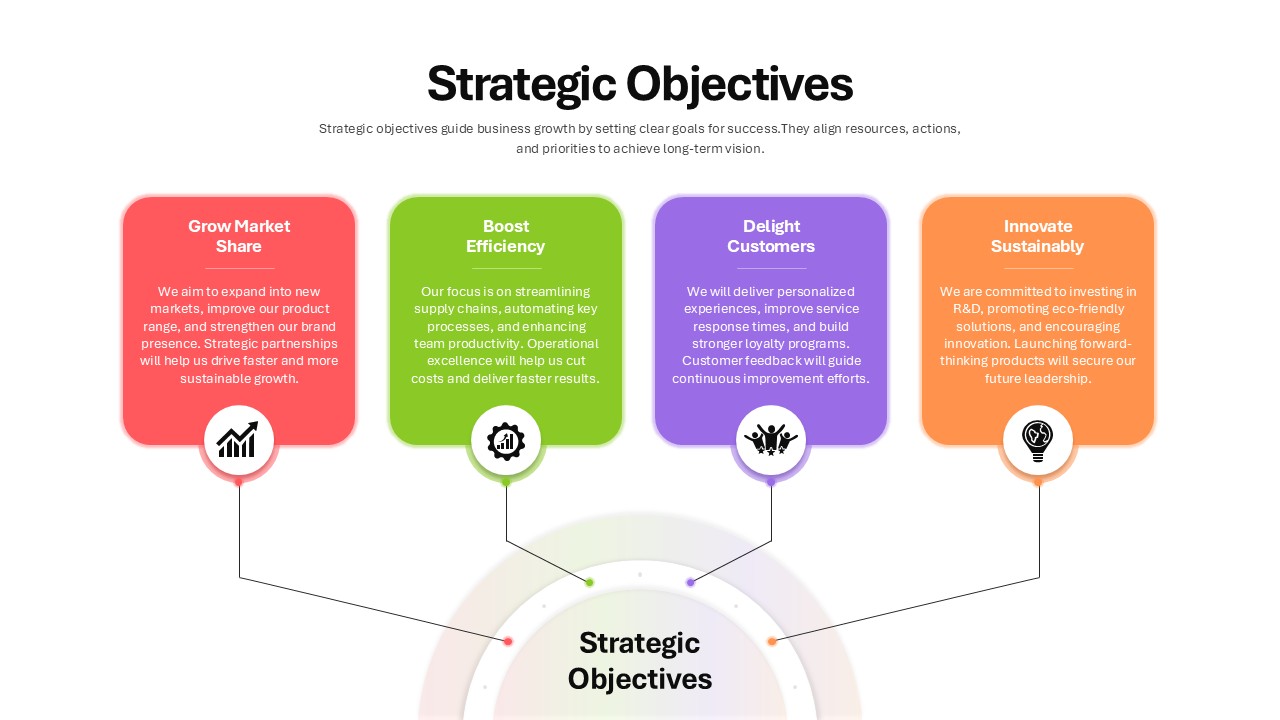
Four Strategic Objectives Radial Diagram Template for PowerPoint & Google Slides
Business Strategy
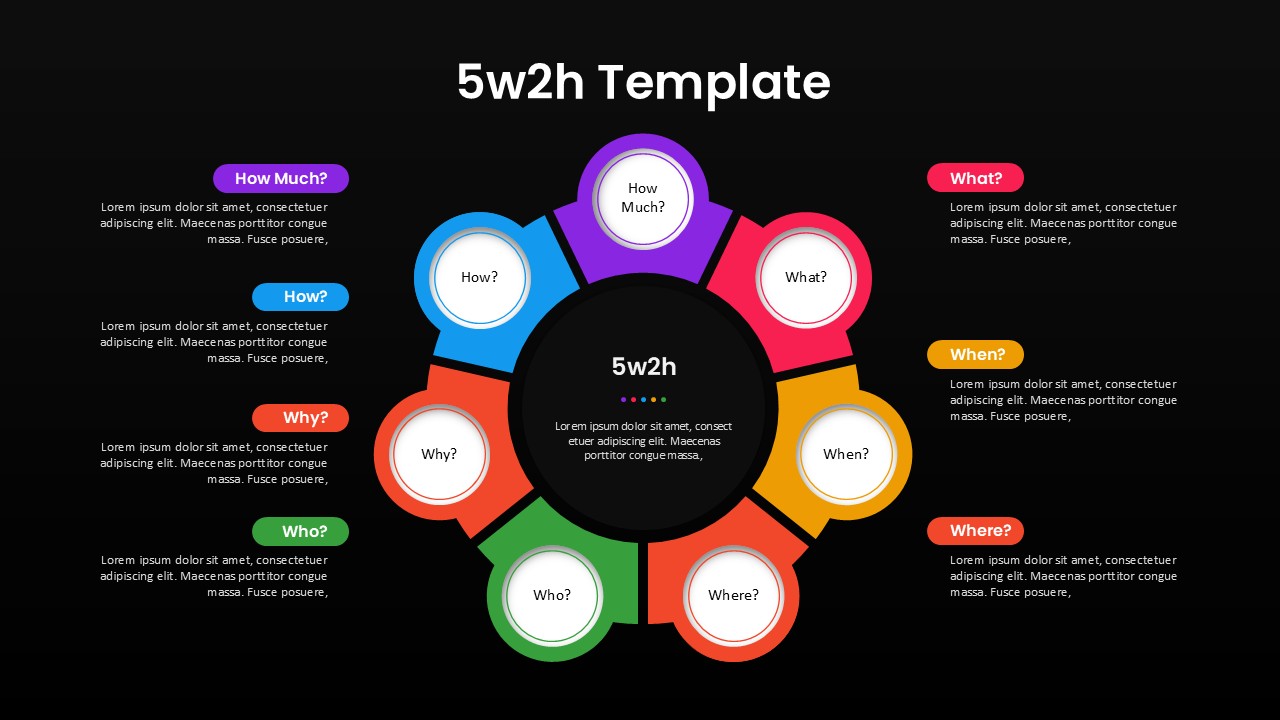
5W2H Analysis Radial Diagram Template for PowerPoint & Google Slides
Decision Tree
Radial Bar Chart Diagram for PowerPoint & Google Slides
Bar/Column
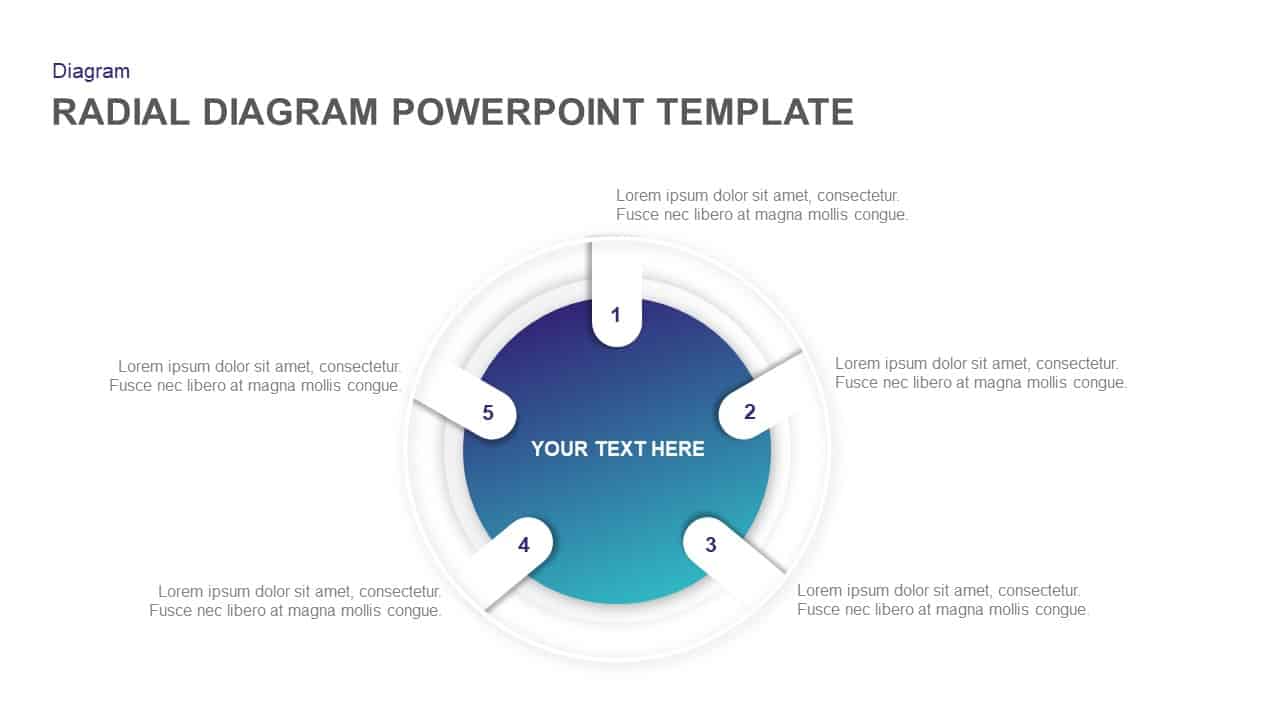
Radial Diagram for PowerPoint & Google Slides
Process
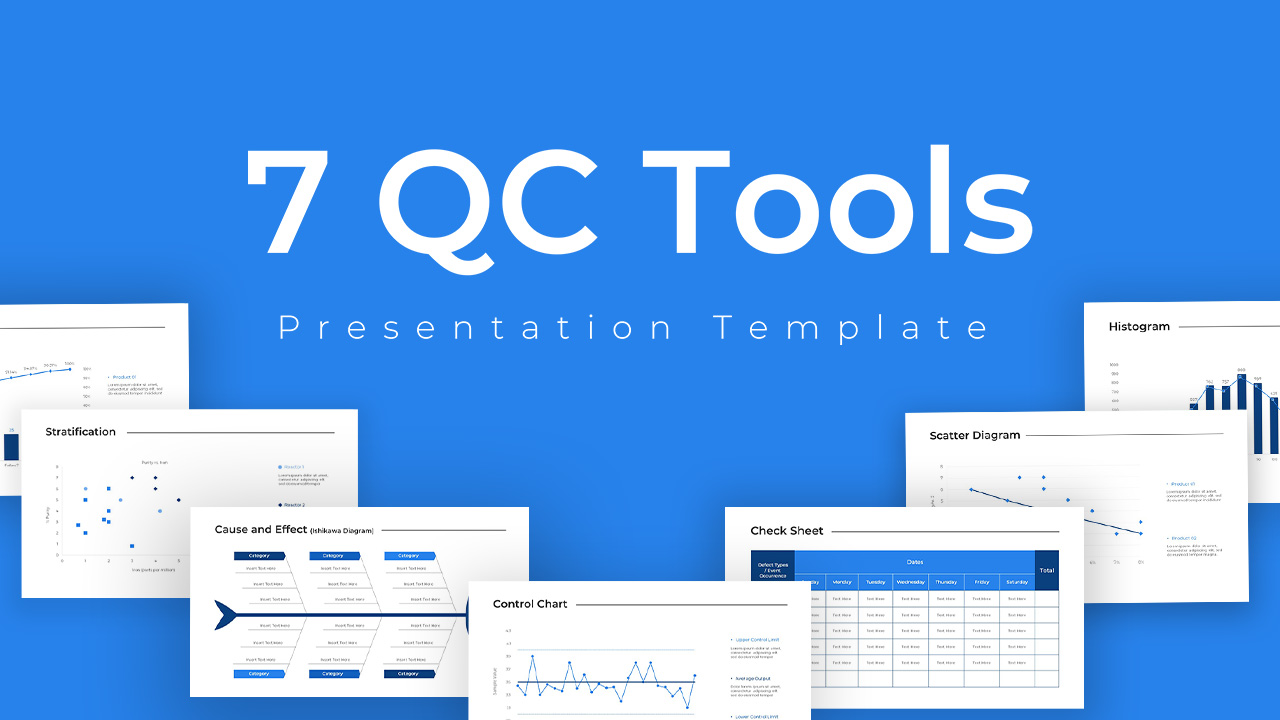
Seven Quality Control Tools Diagram Template for PowerPoint & Google Slides
Decks
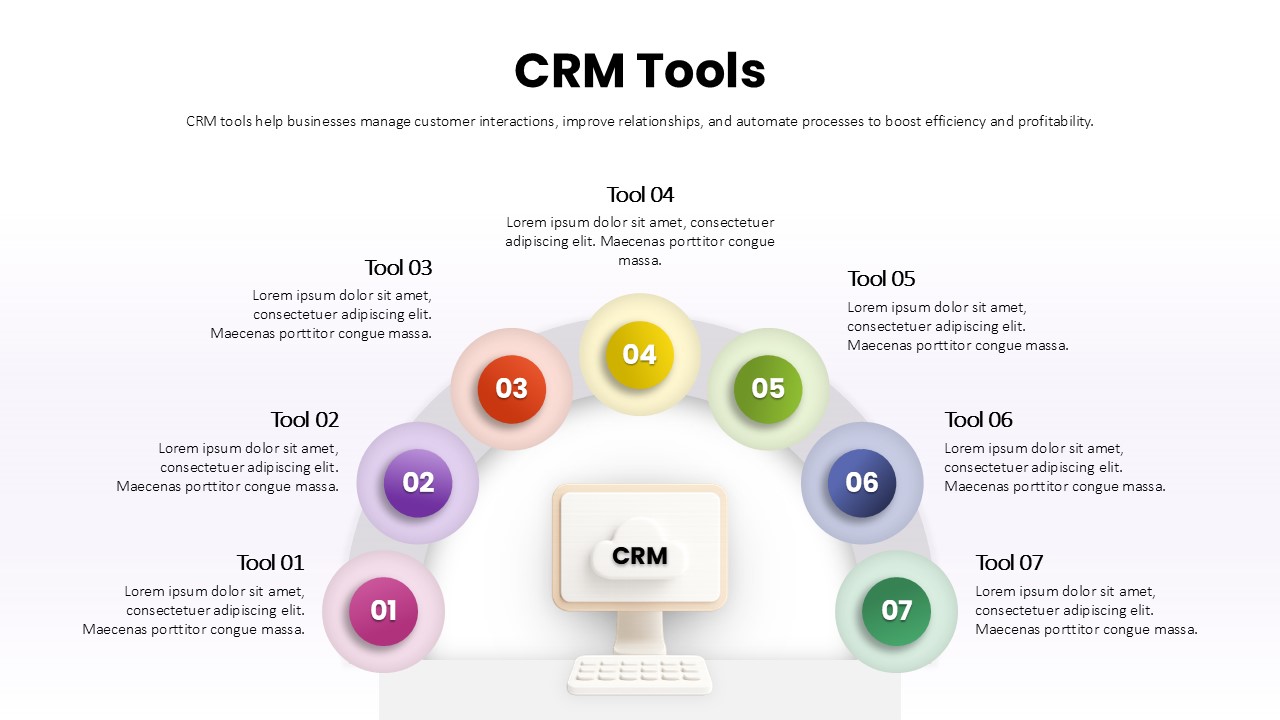
Seven-Part CRM Tools Arc Diagram Template for PowerPoint & Google Slides
Digital Marketing
Colorful Radial Bar Chart Template for PowerPoint & Google Slides
Bar/Column
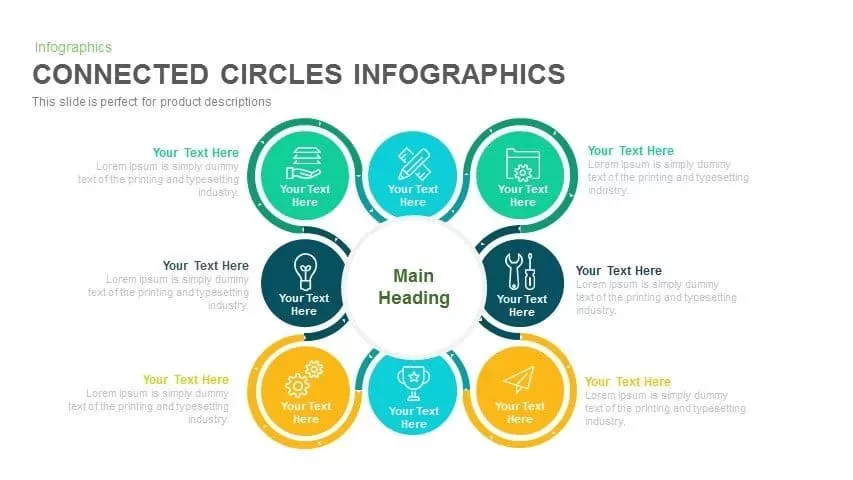
Radial Connected Circles Infographic Template for PowerPoint & Google Slides
Circular

4-Way Radial Arrow Infographic Template for PowerPoint & Google Slides
Arrow
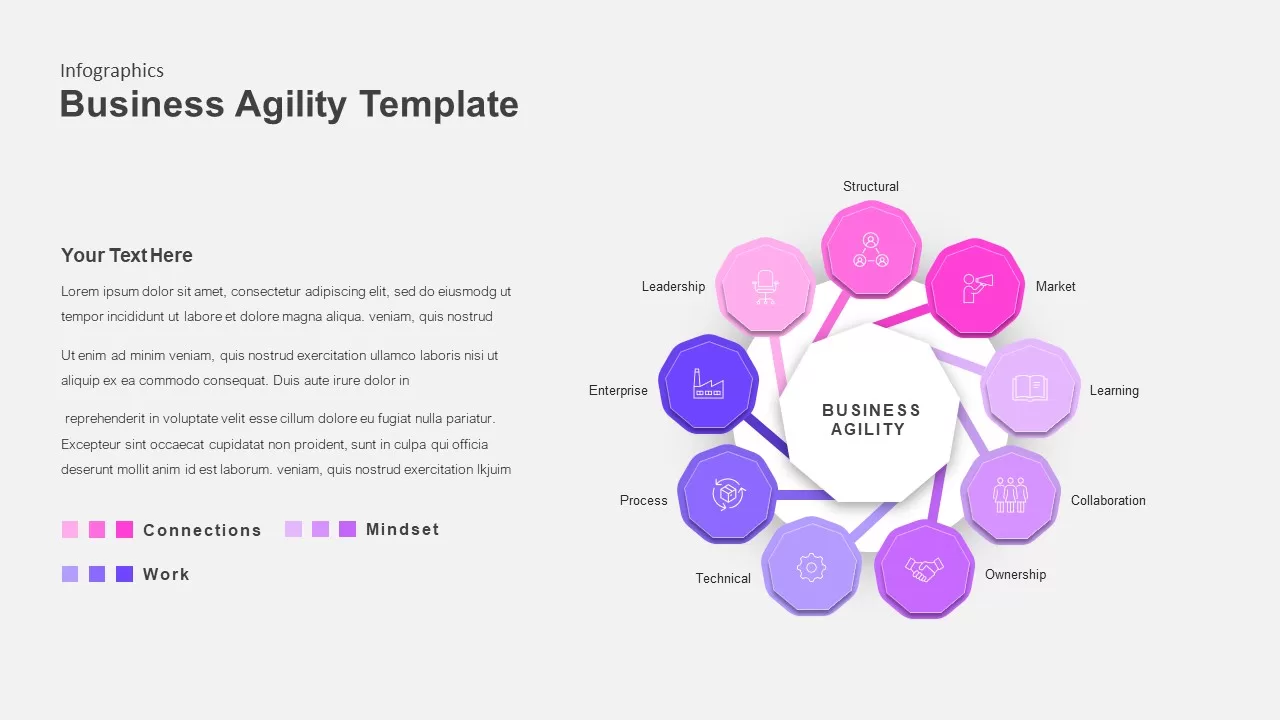
Color-Coded Business Agility Radial Template for PowerPoint & Google Slides
Business
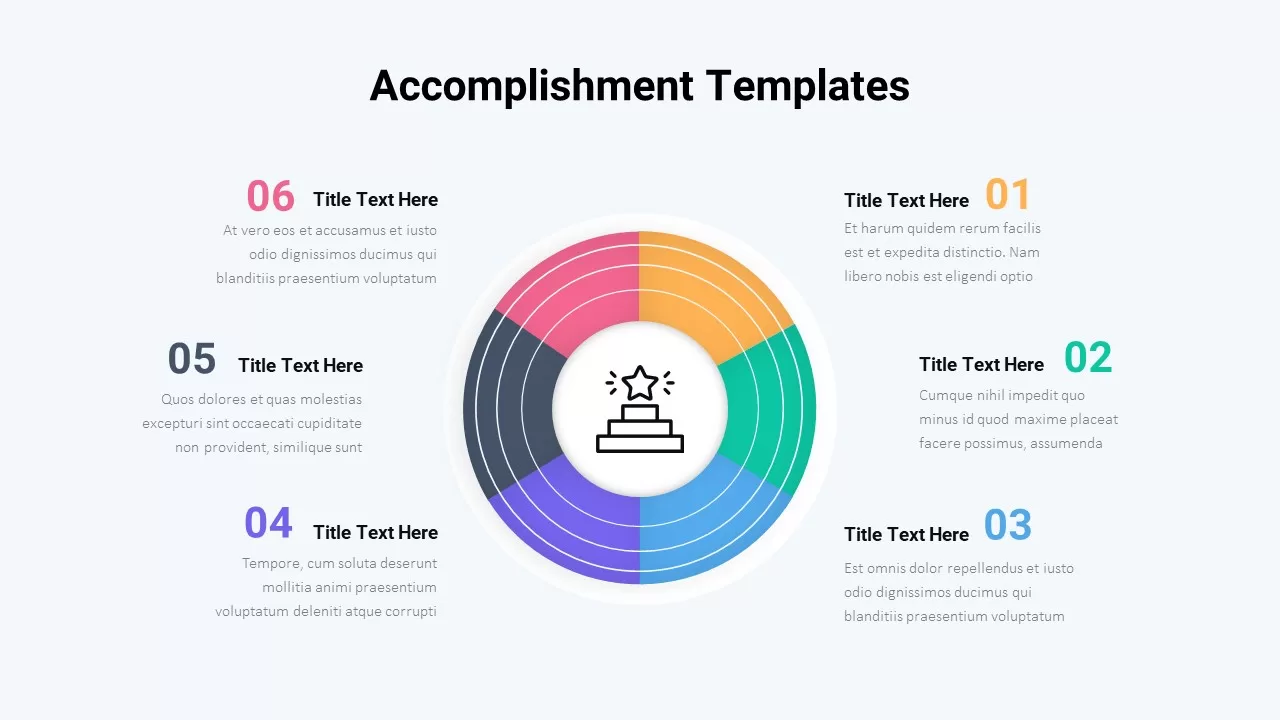
Six-Step Accomplishment Radial Infographic Template for PowerPoint & Google Slides
Accomplishment
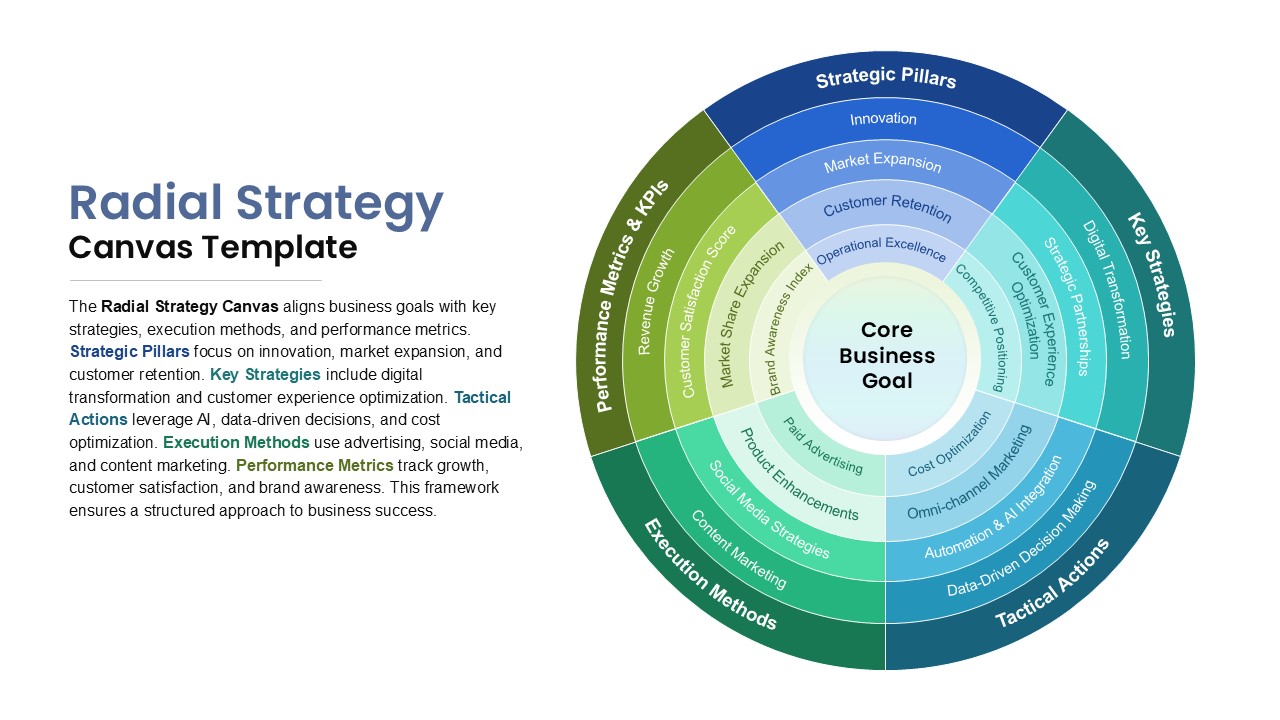
Radial Strategy Canvas for Goals Template for PowerPoint & Google Slides
Circular
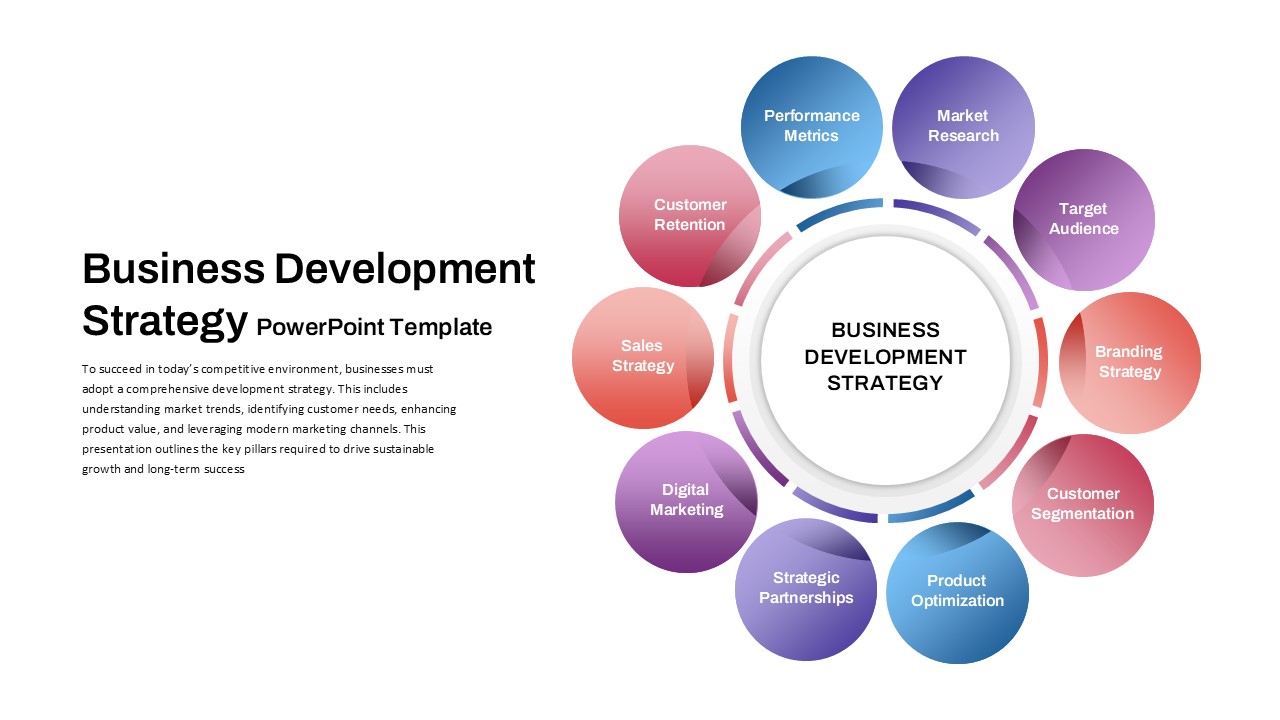
Business Development Strategy Radial Hub Template for PowerPoint & Google Slides
Circular
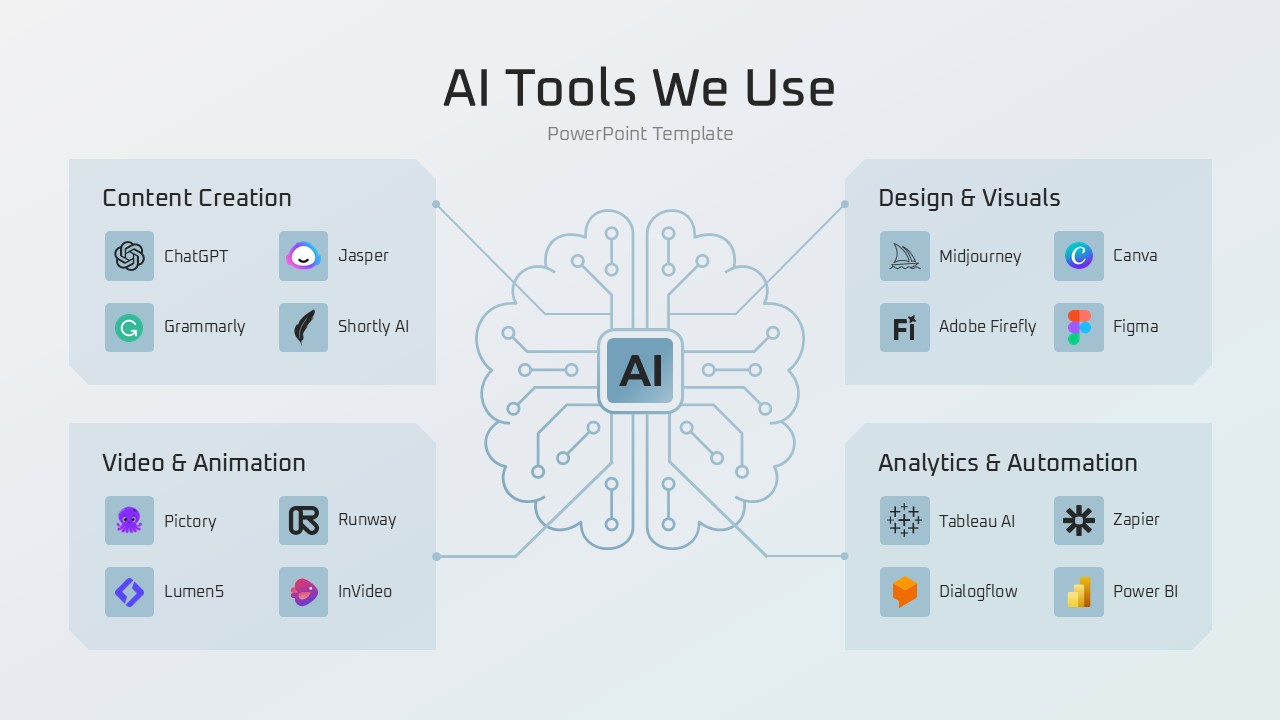
AI Tools We Use PowerPoint Template
AI
Snake Diagram Pack of 8 Slides template for PowerPoint & Google Slides
Process
Gear Process Diagram PowerPoint Template for PowerPoint & Google Slides
Process
Sales Process Workflow Funnel Diagram PowerPoint Template for PowerPoint & Google Slides
Funnel
Puzzle Diagram PowerPoint Template for PowerPoint & Google Slides
Process
Transportation Logistics PowerPoint Diagram template for PowerPoint & Google Slides
Process
Emoji Scale PowerPoint Diagram for PowerPoint & Google Slides
Infographics
4 Step Problem Solving PowerPoint Diagram for PowerPoint & Google Slides
Process
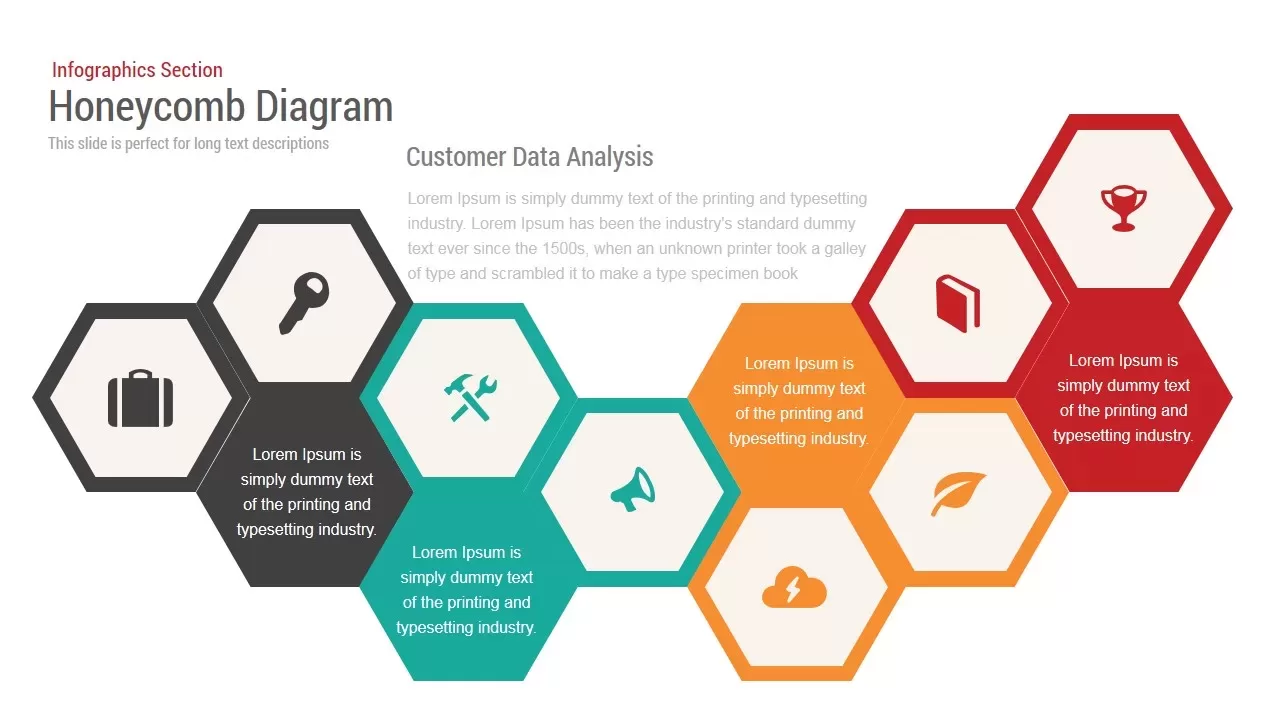
Honeycomb Diagram template for PowerPoint & Google Slides
Infographics
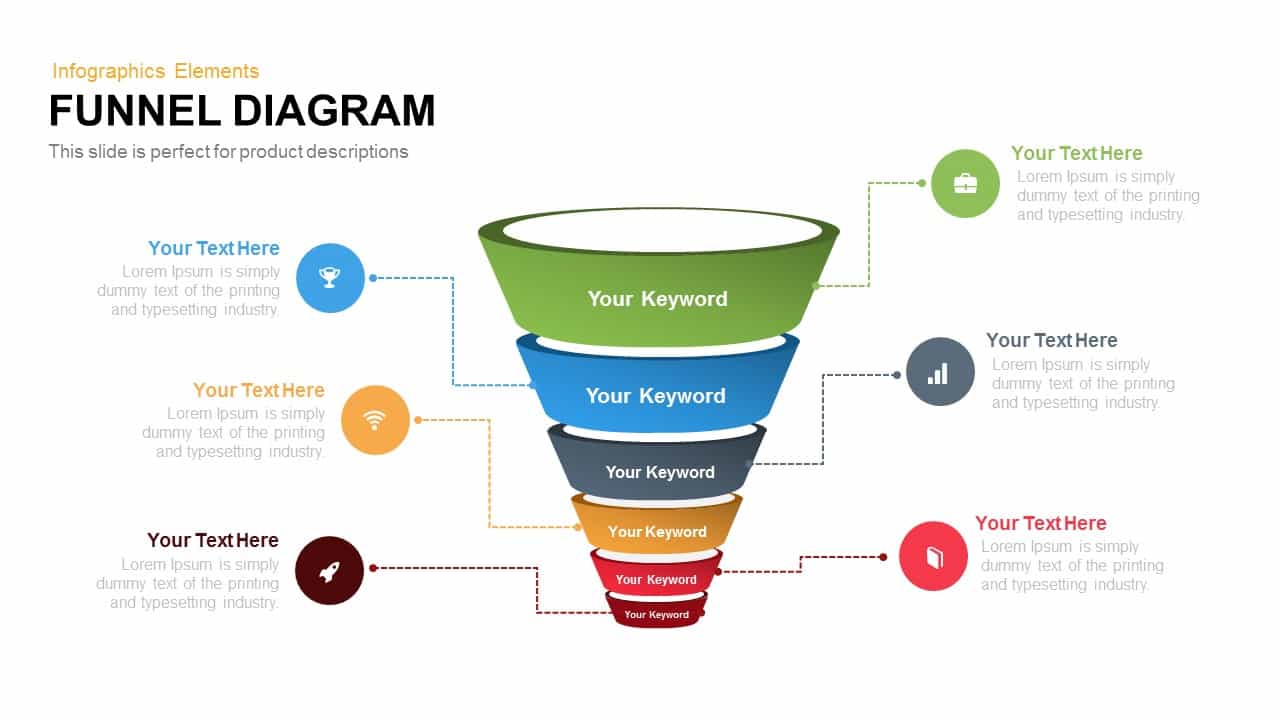
Funnel Diagram Template for PowerPoint & Google Slides
Infographics
6-Step Arrow Process Diagram Template for PowerPoint & Google Slides
Process
Colorful Arrow Process Diagram Template for PowerPoint & Google Slides
Arrow
Five Up Arrow Infographic Diagram Template for PowerPoint & Google Slides
Arrow
Gear Process Phase Diagram template for PowerPoint & Google Slides
Process
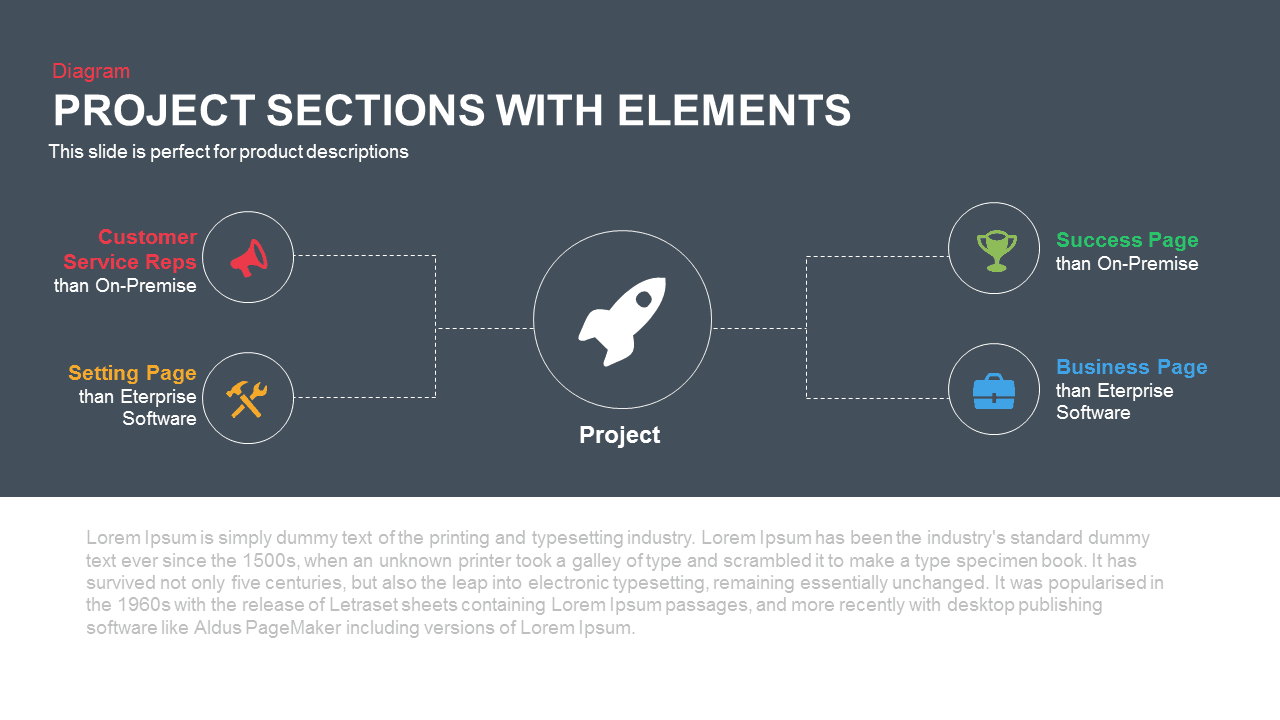
Project Sections Hub-and-Spoke Diagram template for PowerPoint & Google Slides
Flow Charts
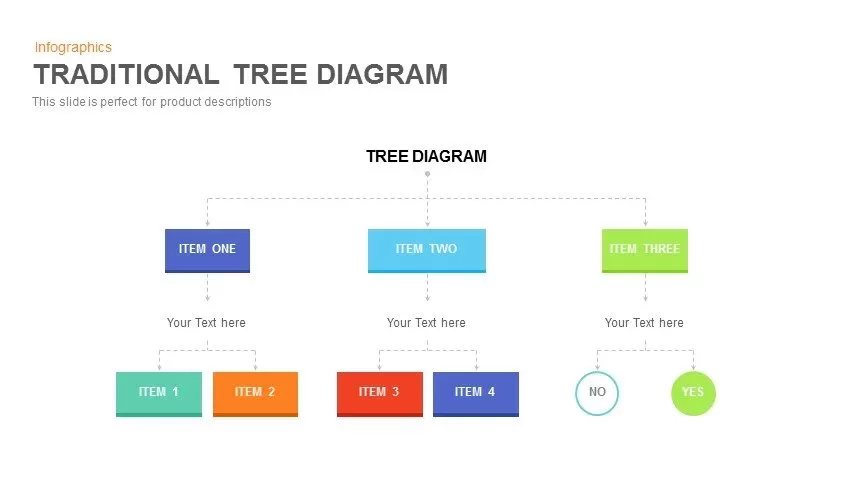
Editable Hierarchical Tree Diagram Template for PowerPoint & Google Slides
Decision Tree

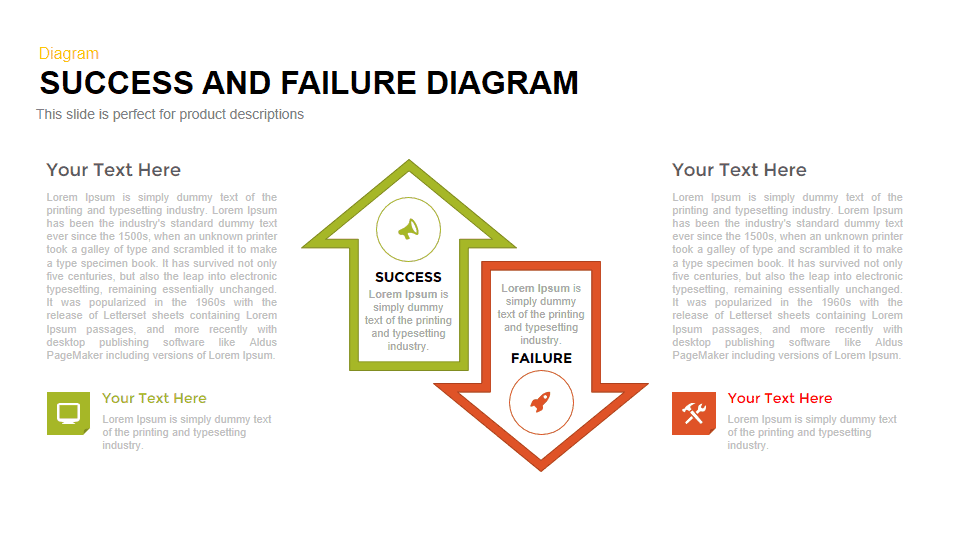
Success vs Failure Comparison Diagram Template for PowerPoint & Google Slides
Comparison
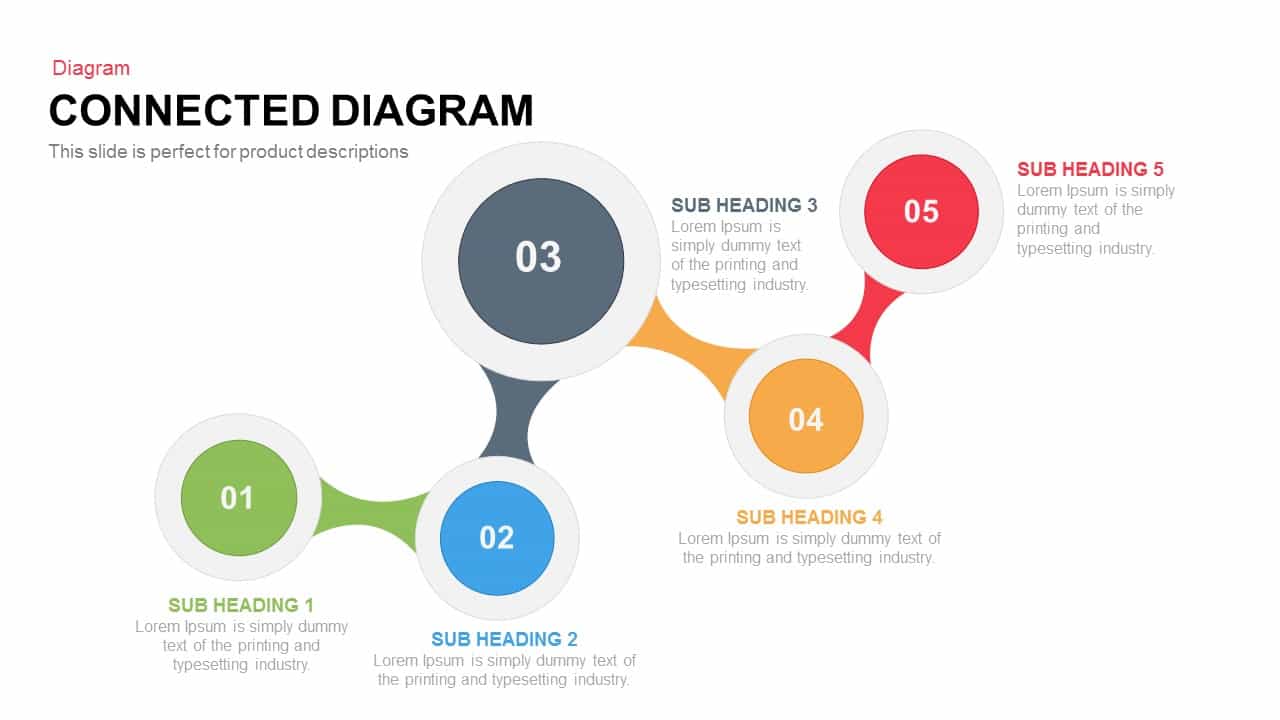
Interactive Connected Network Diagram Template for PowerPoint & Google Slides
Process
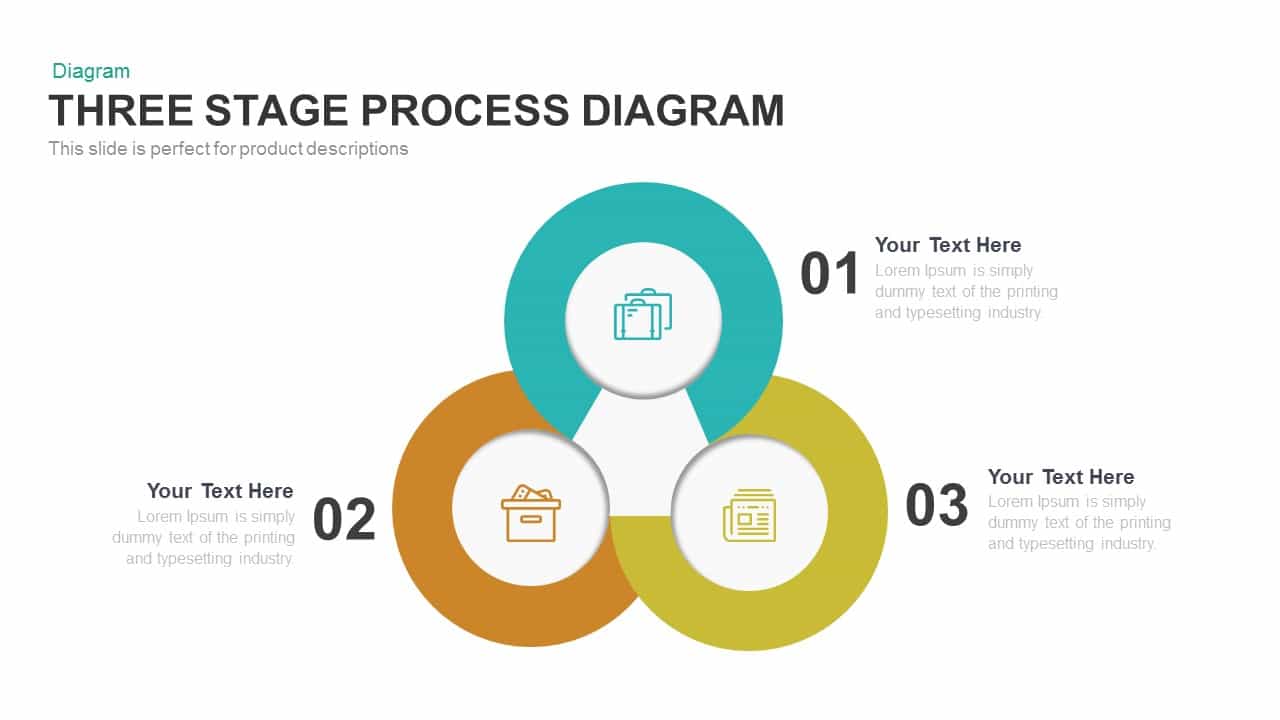
Engaging Three-Stage Process Diagram Template for PowerPoint & Google Slides
Process
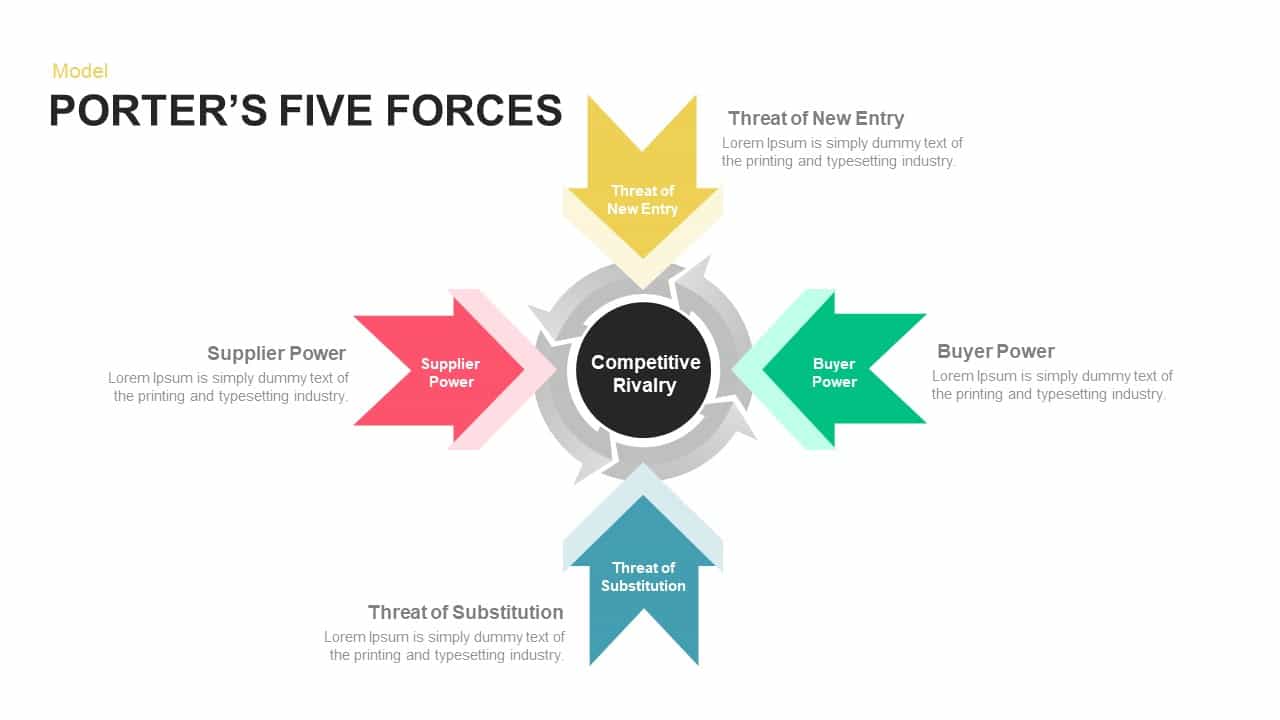
Porter’s Five Forces Model Diagram Template for PowerPoint & Google Slides
Competitor Analysis
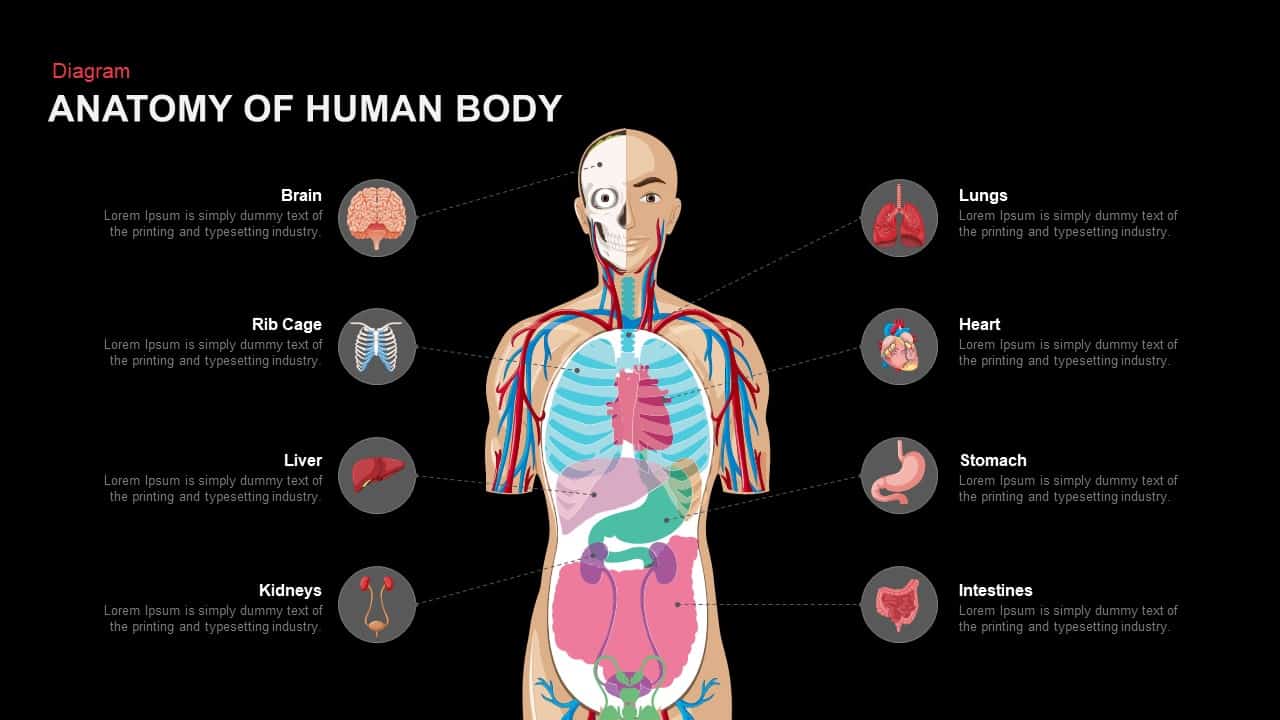
Anatomy of the Human Body Diagram Template for PowerPoint & Google Slides
Health
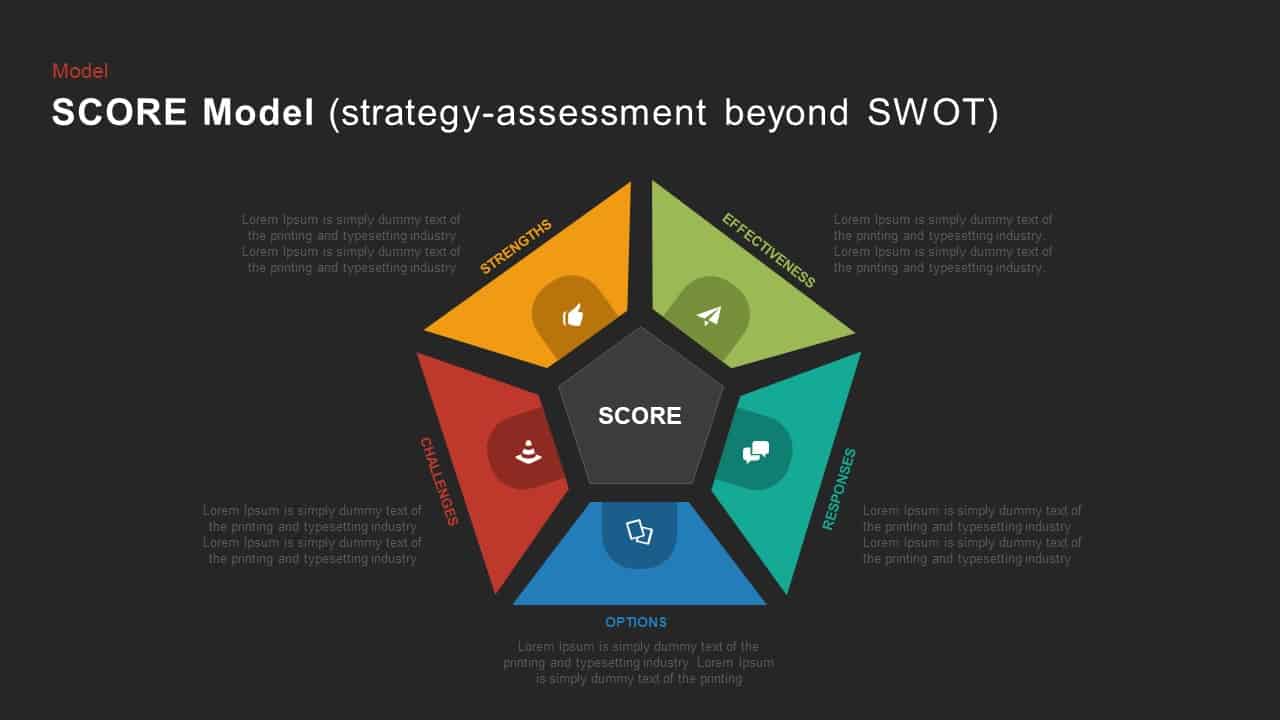
SCORE Model Pentagon Assessment Diagram Template for PowerPoint & Google Slides
Circular
4 Step Revenue Growth Flow Diagram Template for PowerPoint & Google Slides
Process
Fishbone Cause and Effect Diagram Template for PowerPoint & Google Slides
Process
Venn Diagram Infographics Pack Template for PowerPoint & Google Slides
Circular
Data Management and Analytics Diagram Template for PowerPoint & Google Slides
Circular
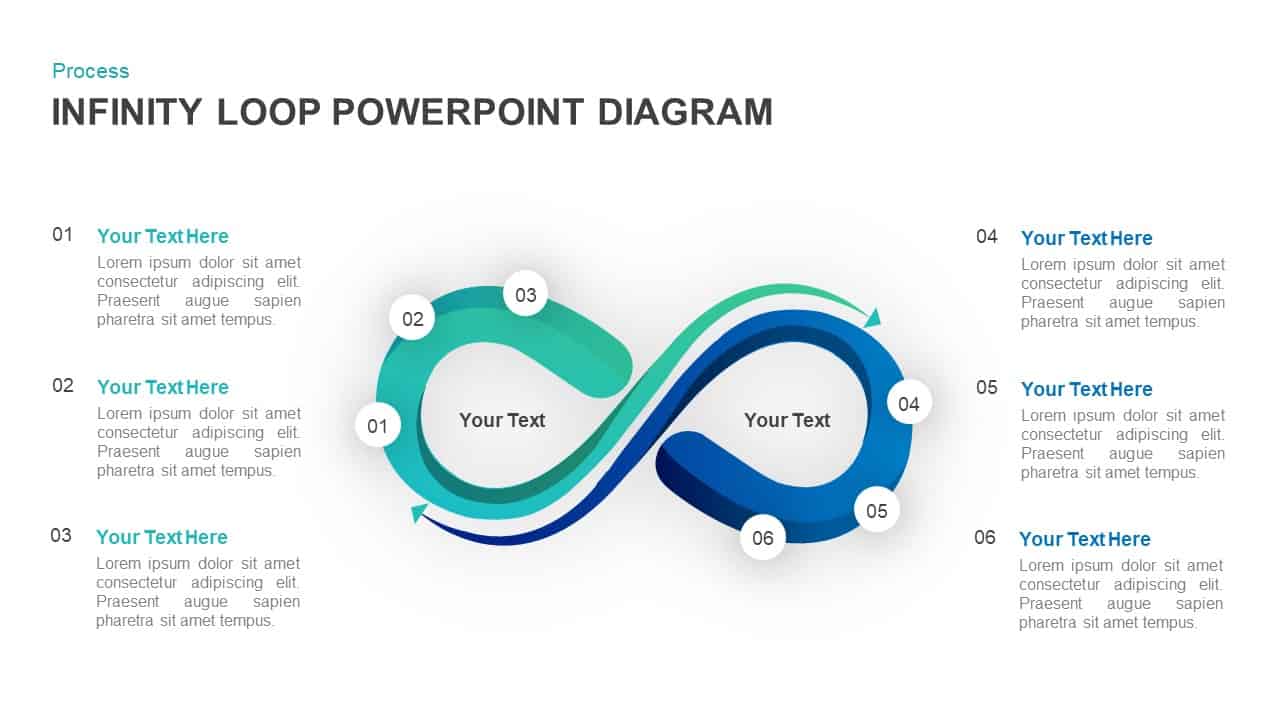
Six-Stage Infinity Loop Process Diagram Template for PowerPoint & Google Slides
Process
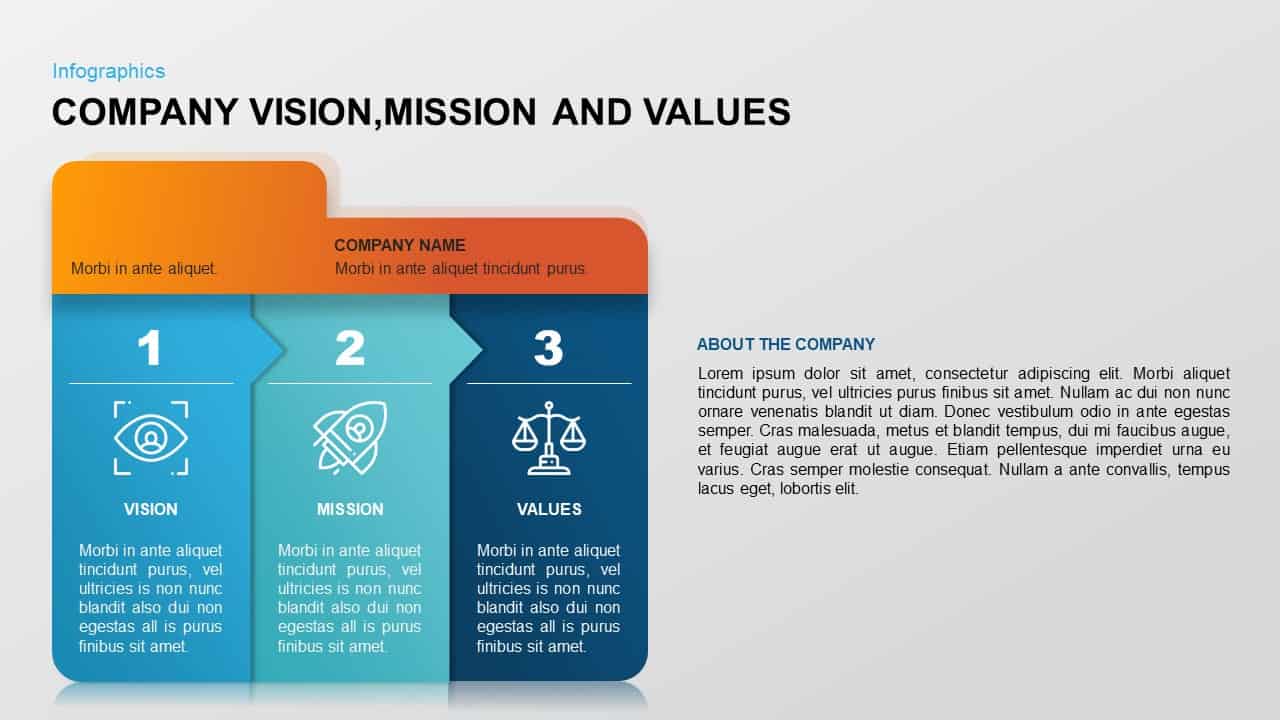
Company Vision, Mission & Values Diagram Template for PowerPoint & Google Slides
Vision and Mission
Four-Stage Circular Flow Diagram Template for PowerPoint & Google Slides
Circular
Data Migration Life Cycle Curved Diagram Template for PowerPoint & Google Slides
Process
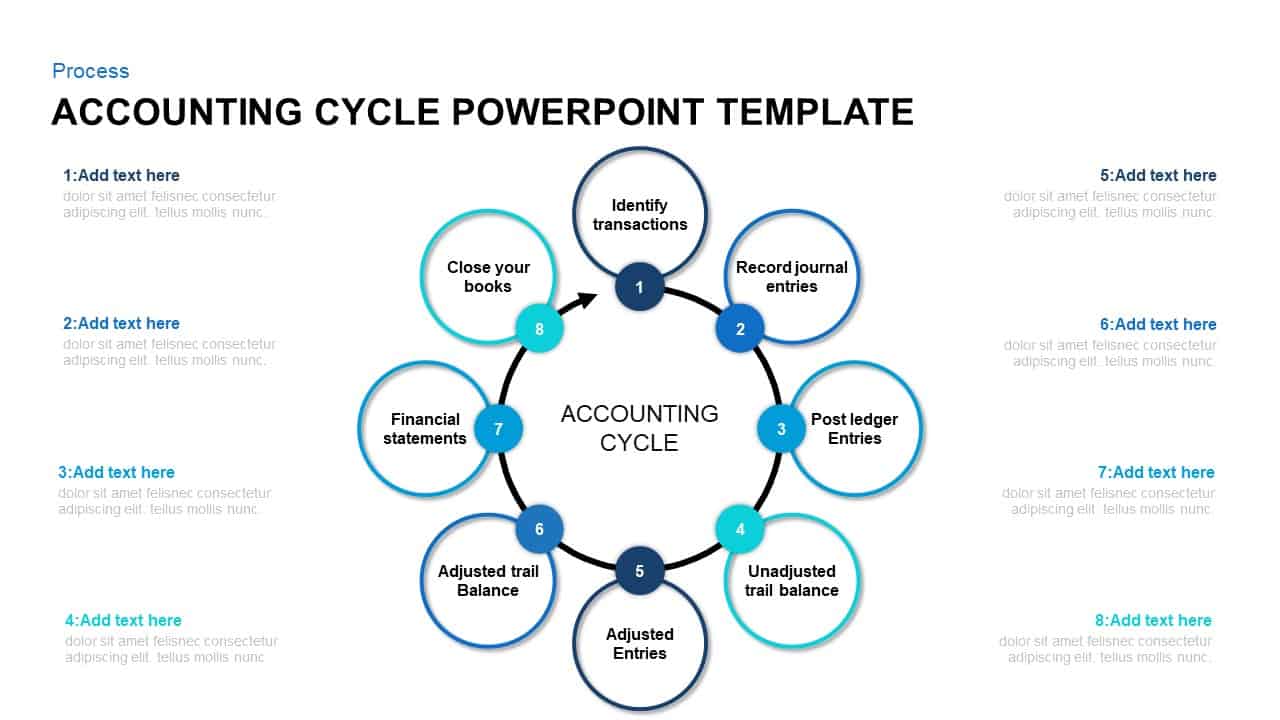
8-Step Circular Accounting Cycle Diagram Template for PowerPoint & Google Slides
Accounting
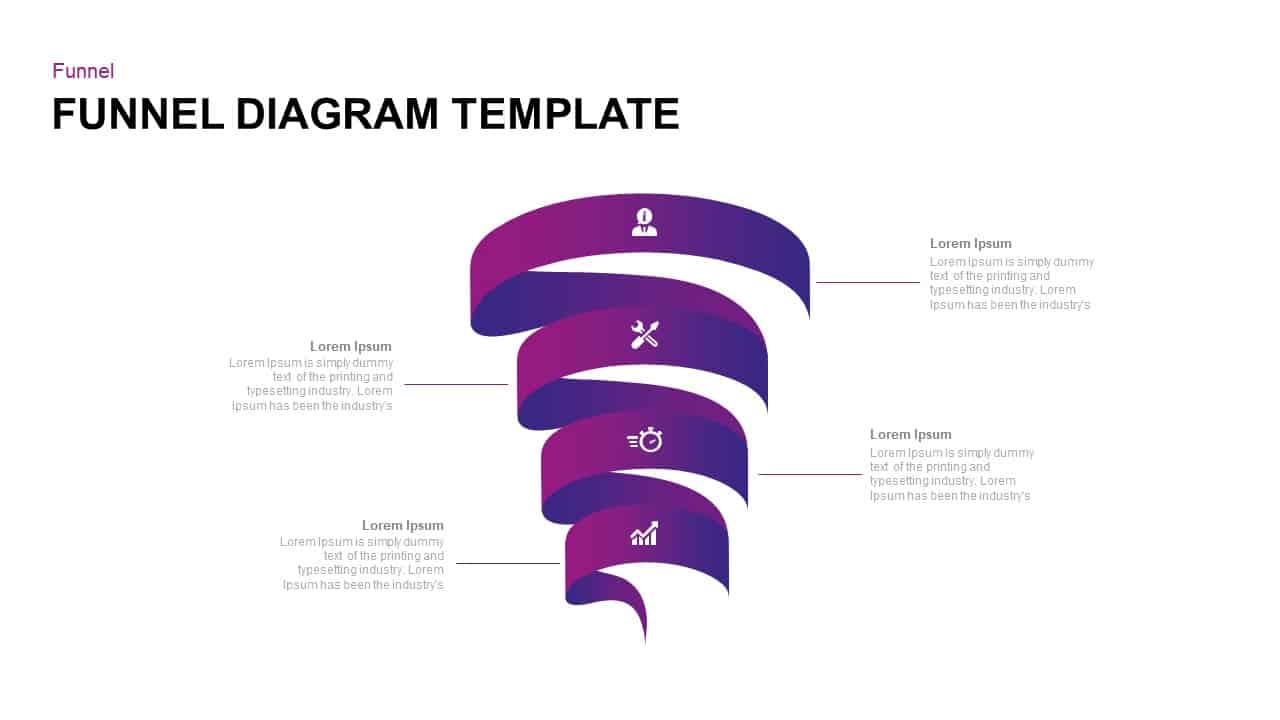
Four-Step Spiral Funnel Diagram Template for PowerPoint & Google Slides
Funnel
Financial Agreement Signing Flow Diagram Template for PowerPoint & Google Slides
Process
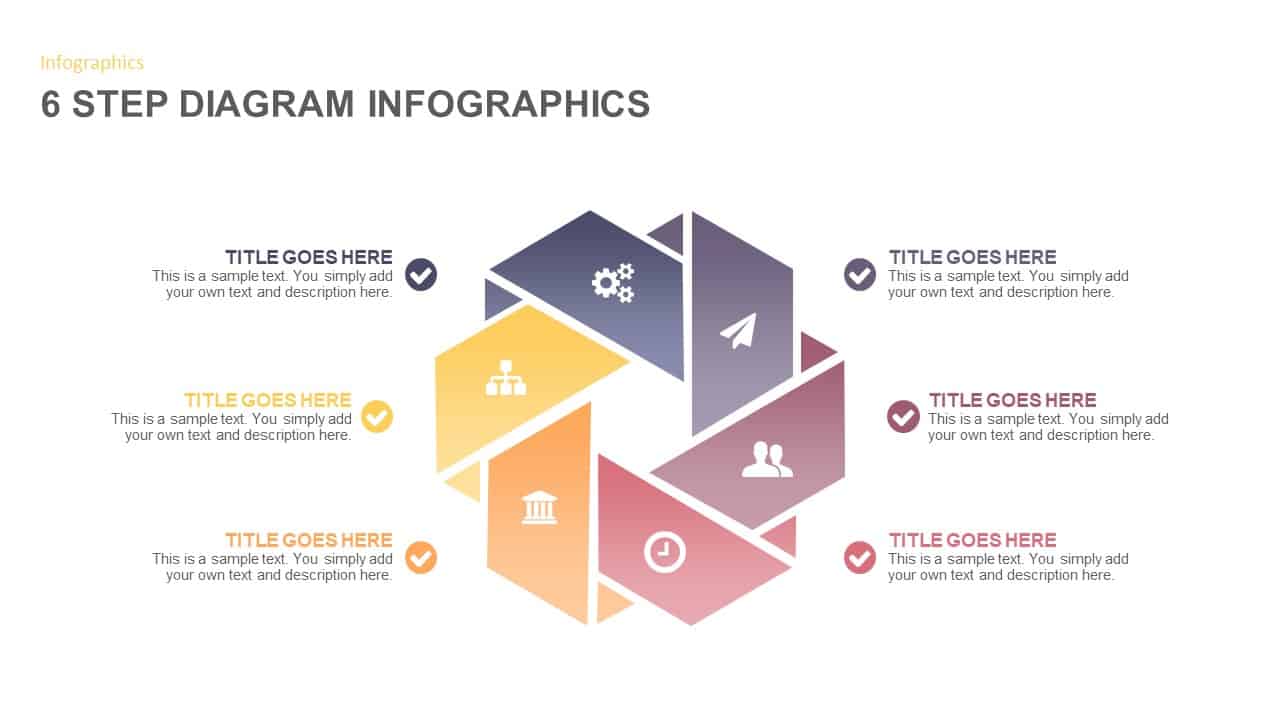
6-Step Circular Diagram Infographic Template for PowerPoint & Google Slides
Circular
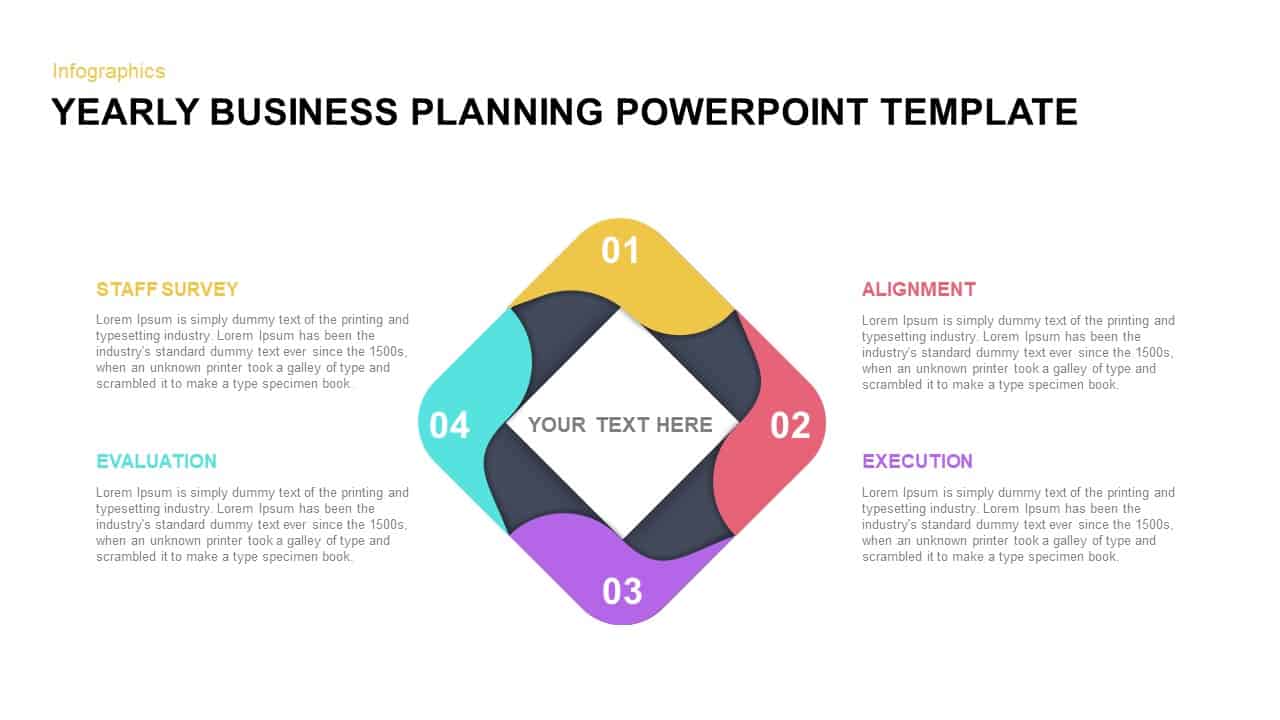
Yearly Business Planning Diamond Diagram Template for PowerPoint & Google Slides
Process
Colorful 8-Stage Droplet Process Flow Diagram Template for PowerPoint & Google Slides
Process
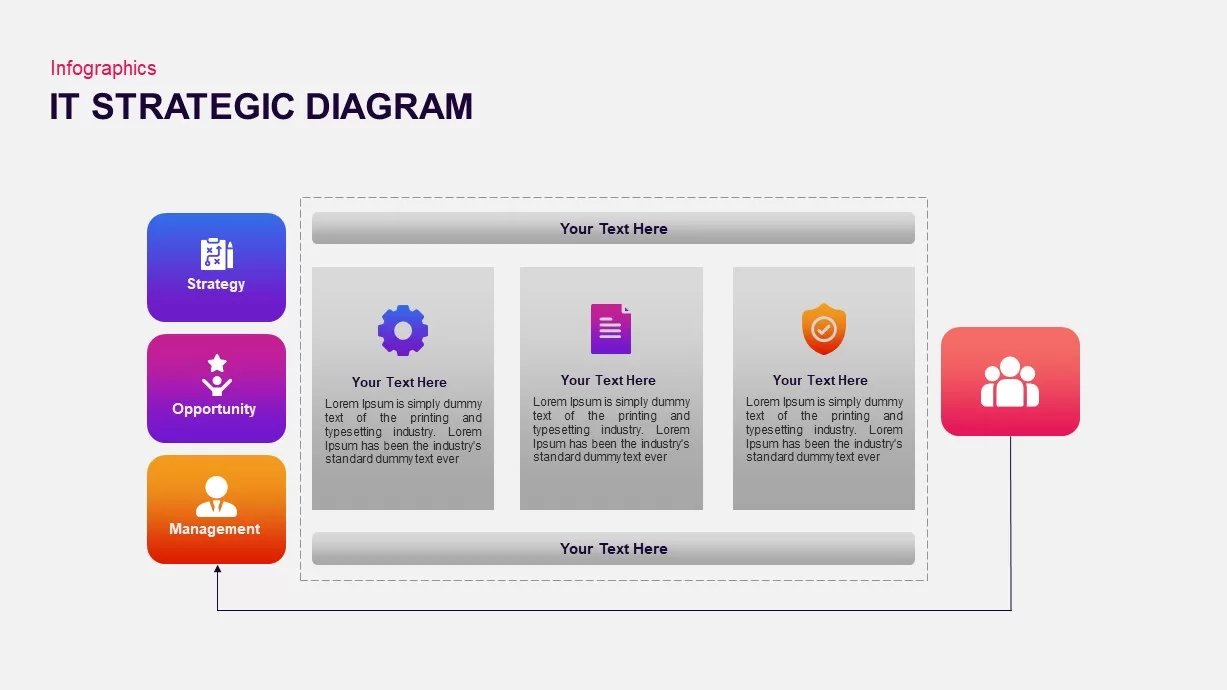
IT Strategic Diagram Infographic Pack Template for PowerPoint & Google Slides
Business Strategy
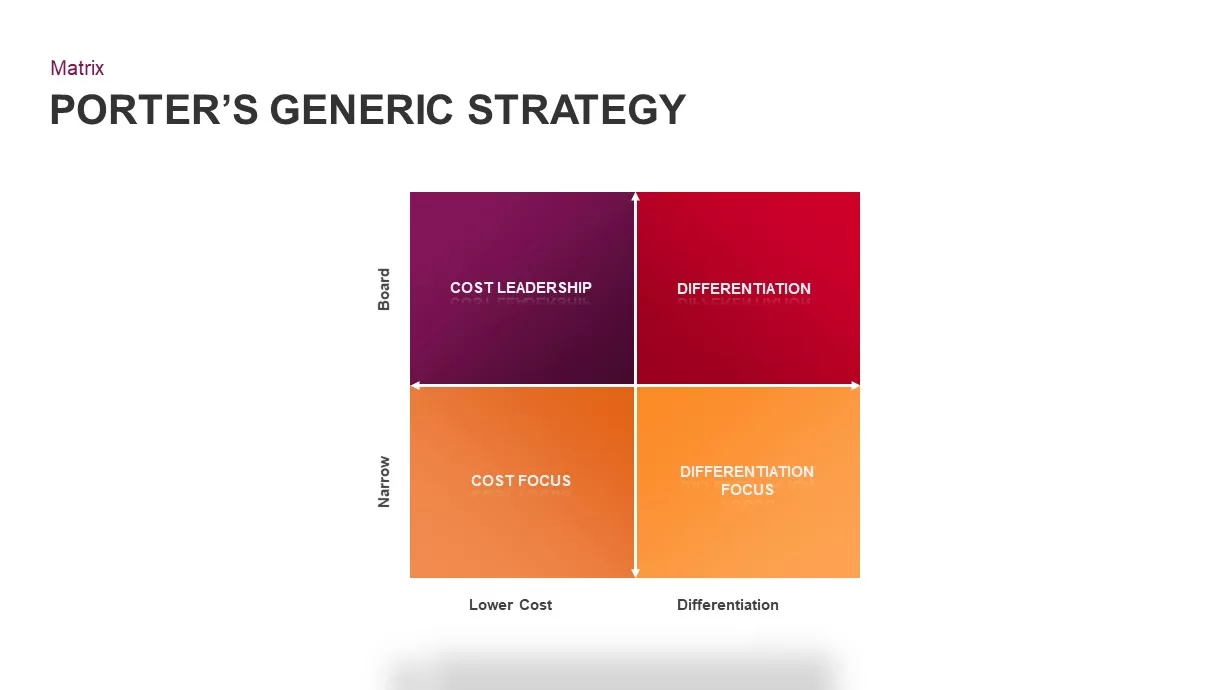
Porter’s Generic Strategy Matrix Diagram Template for PowerPoint & Google Slides
Competitor Analysis
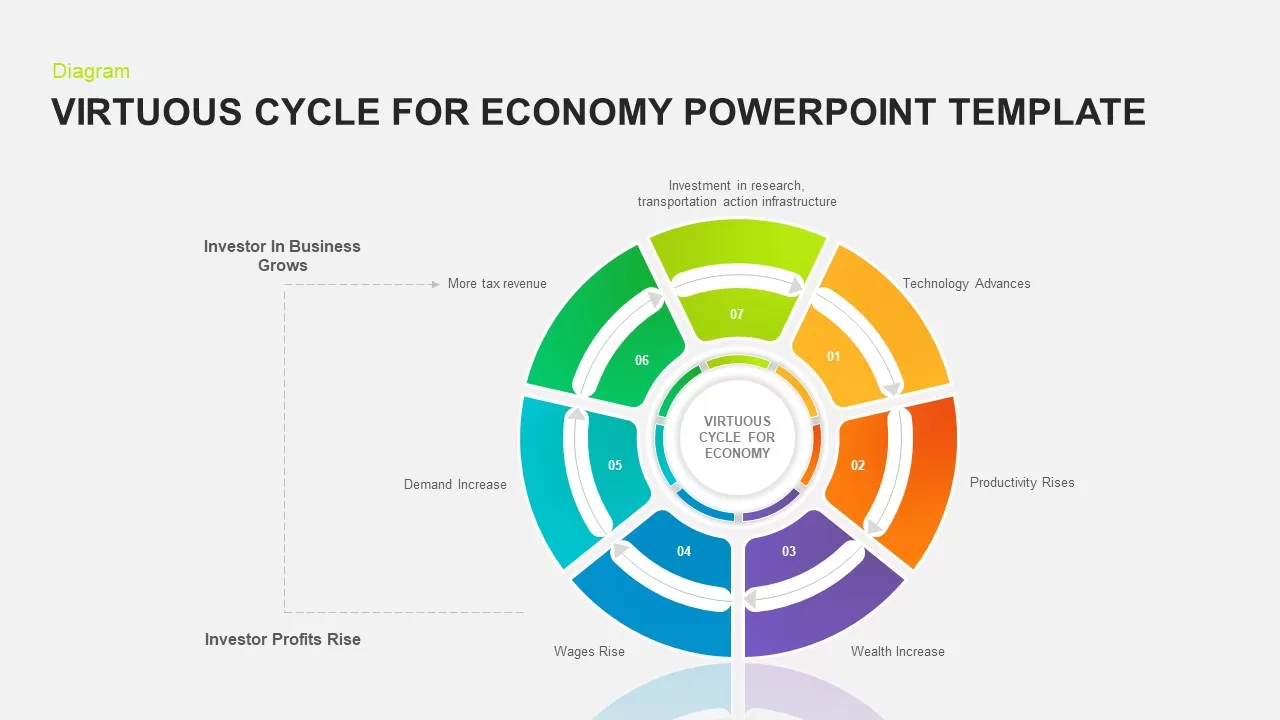
7-Step Virtuous Economy Cycle Diagram Template for PowerPoint & Google Slides
Process
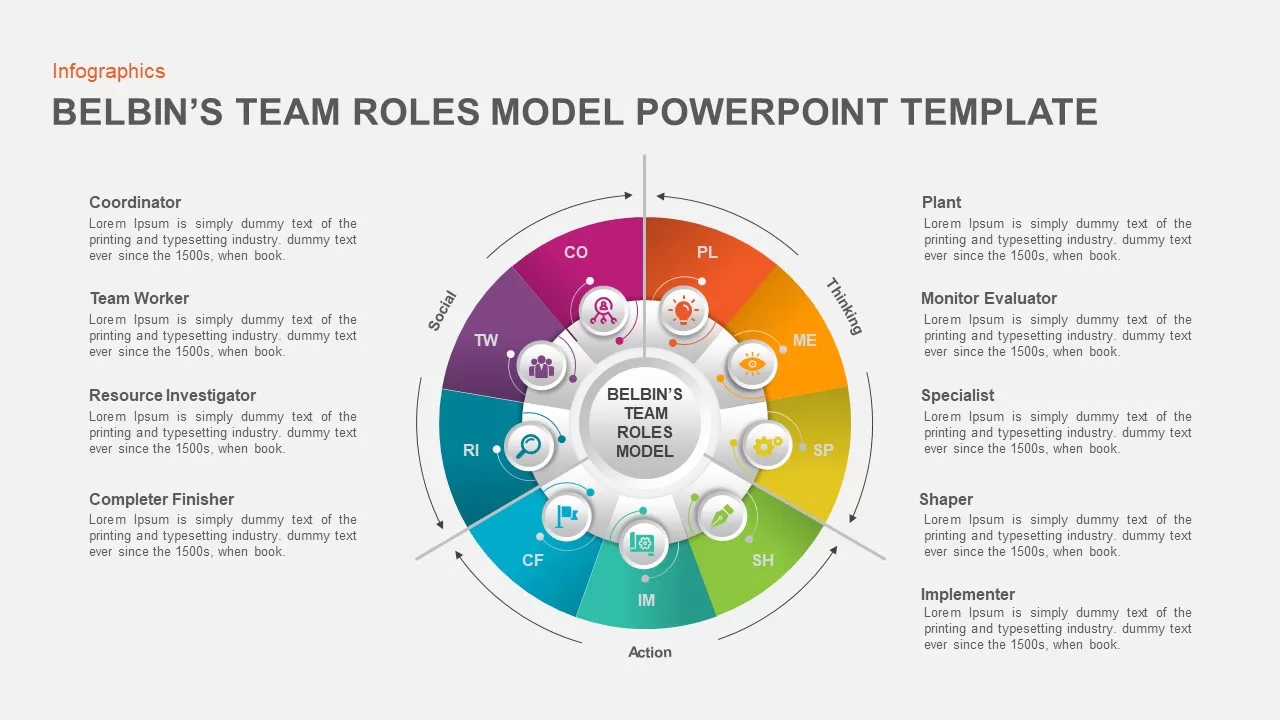
Belbin’s Team Roles Model Diagram Template for PowerPoint & Google Slides
HR
Problem Solving Process Diagram Template for PowerPoint & Google Slides
Process
Negotiation Matrix Diagram Template for PowerPoint & Google Slides
Business
Professional Organizational Chart Diagram Template for PowerPoint & Google Slides
Org Chart
Free Curved Arrow Infographic Diagram Template for PowerPoint & Google Slides
Arrow
Free
Customizable Sales Tree Diagram Template for PowerPoint & Google Slides
Org Chart
Three-Step Circular Arrows Diagram Template for PowerPoint & Google Slides
Process
Arrowed Strategic Initiatives Diagram Template for PowerPoint & Google Slides
Process
Chain Link Process Infographic Diagram Template for PowerPoint & Google Slides
Process
10-Step Colorful Circular Diagram Template for PowerPoint & Google Slides
Circular
Dynamic Hub-and-Spoke Infographic Diagram Template for PowerPoint & Google Slides
Circular
Flat Organization Chart Diagram Template for PowerPoint & Google Slides
Org Chart
Multi-Variation Circular Chart Diagram Template for PowerPoint & Google Slides
Circular
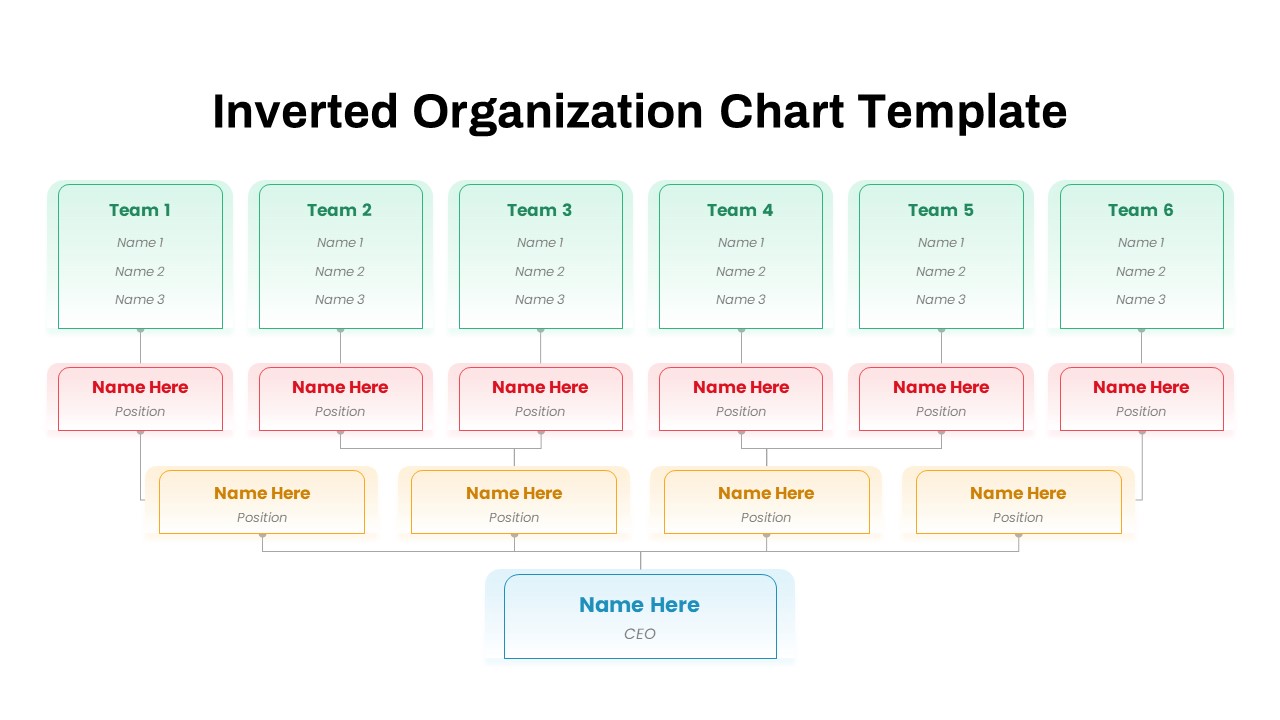
Inverted Organization Chart Diagram Template for PowerPoint & Google Slides
Org Chart
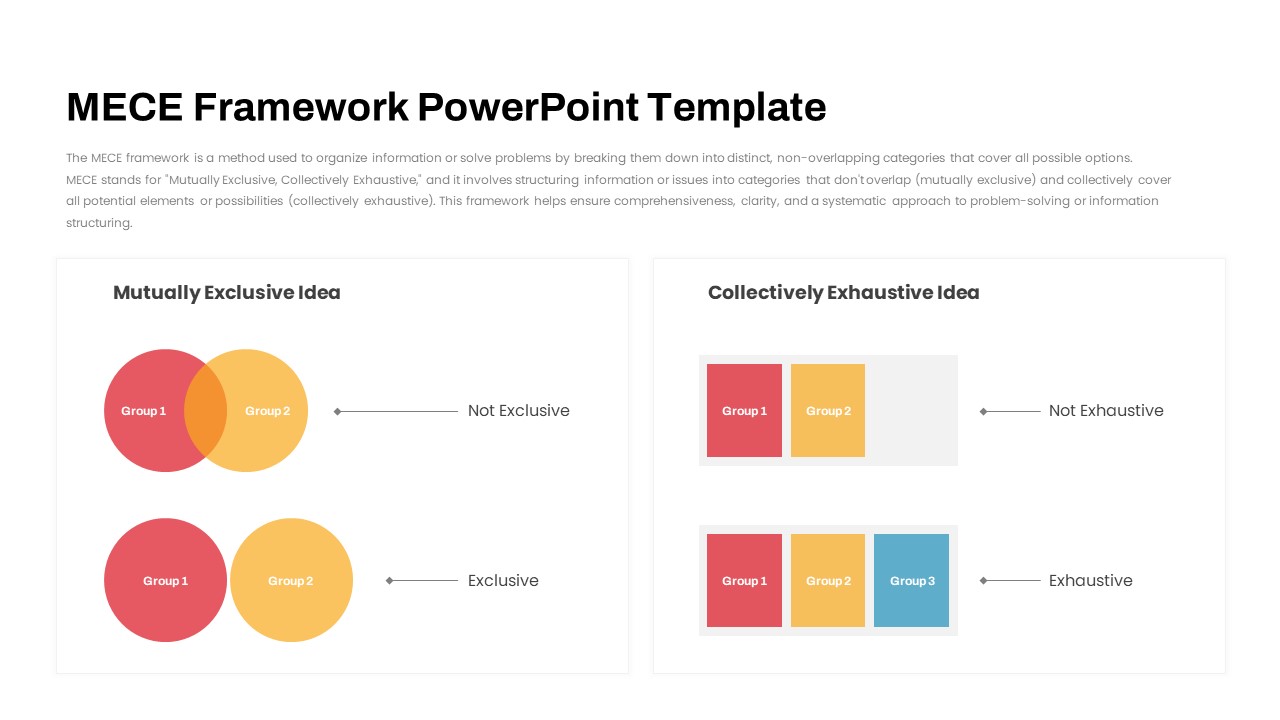
MECE Framework Venn & Block Diagram Template for PowerPoint & Google Slides
Comparison
Experience Curve Analysis Diagram Template for PowerPoint & Google Slides
Business Strategy
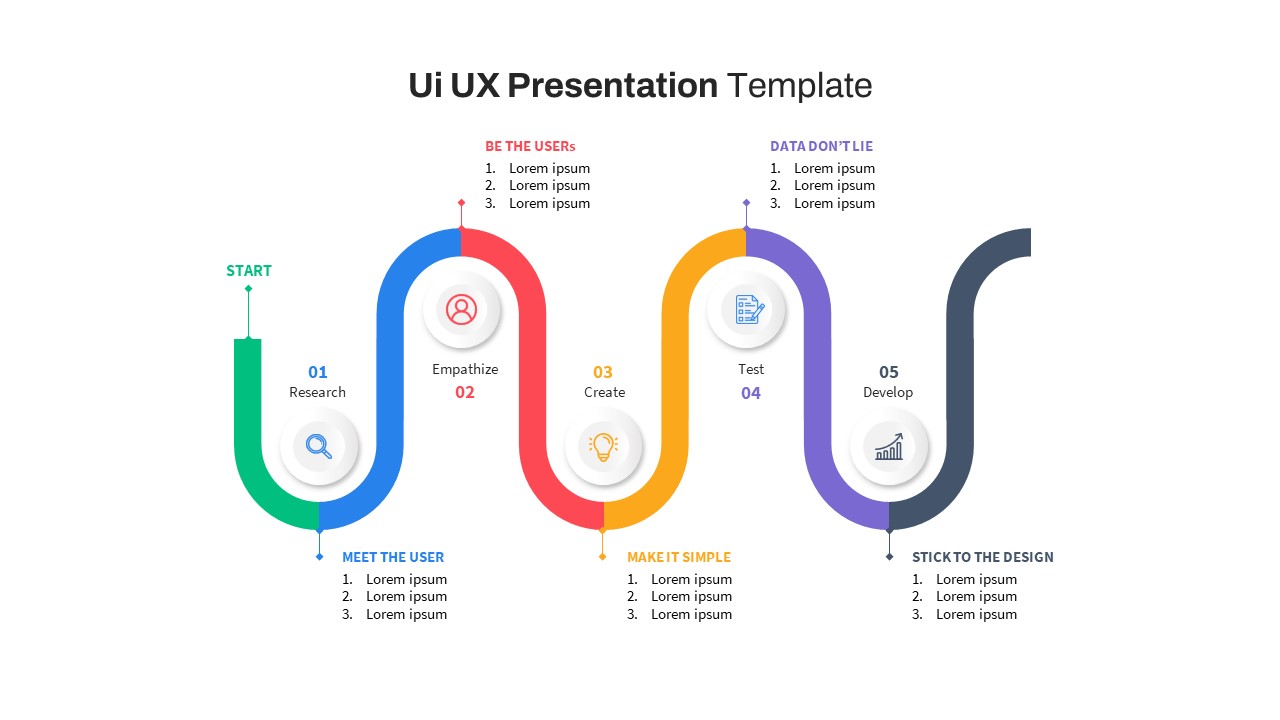
Free UI/UX Process Timeline Diagram Template for PowerPoint & Google Slides
Process
Free
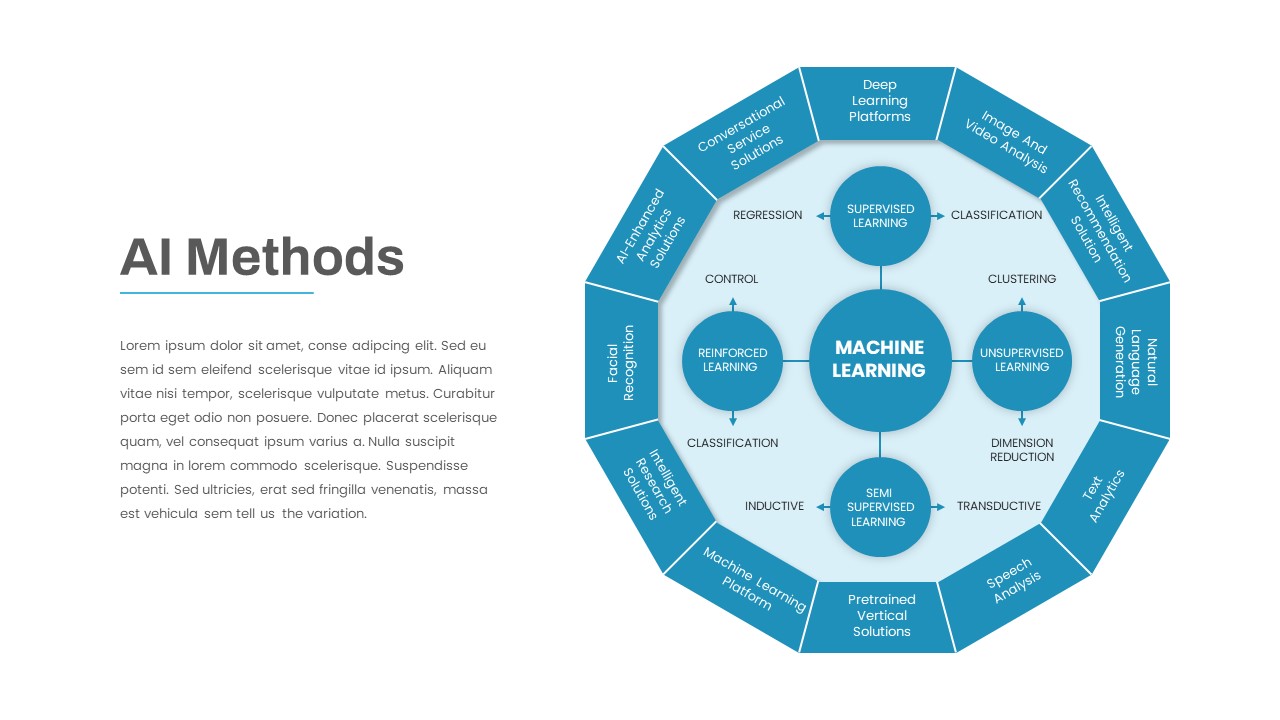
AI Methods Circular Diagram Slide Template for PowerPoint & Google Slides
AI
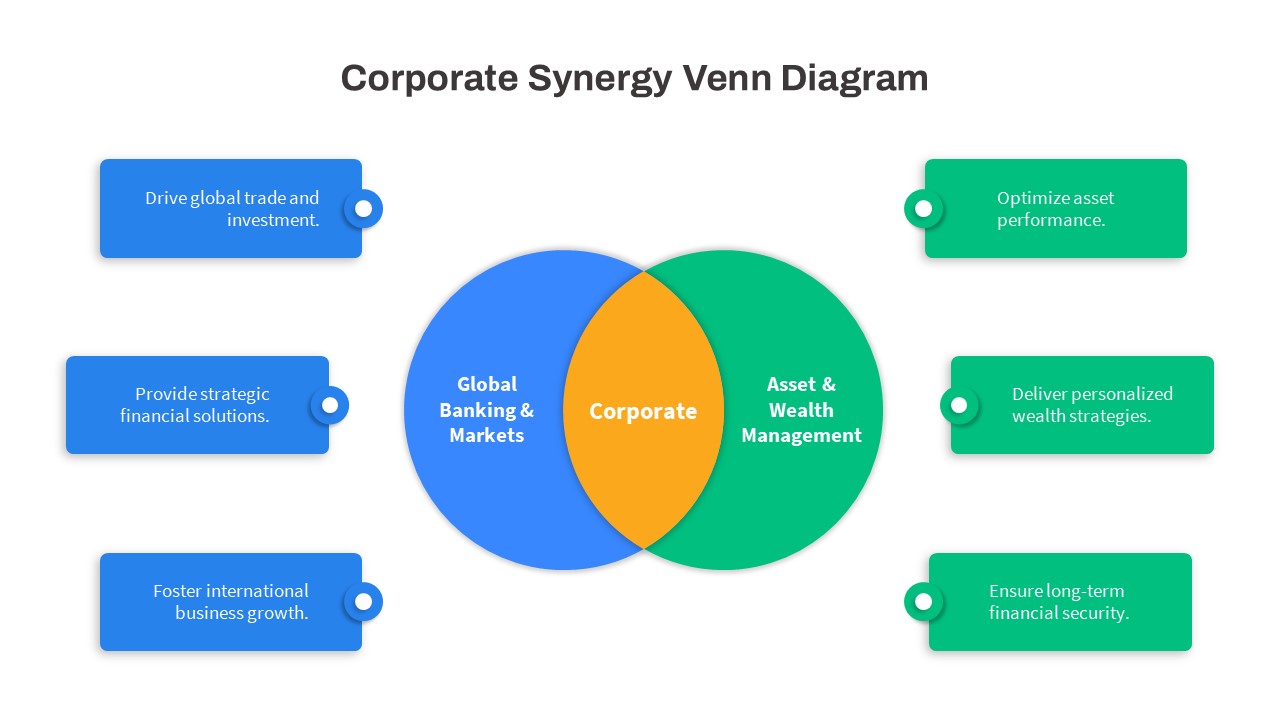
Corporate Synergy Venn Diagram Template for PowerPoint & Google Slides
Comparison
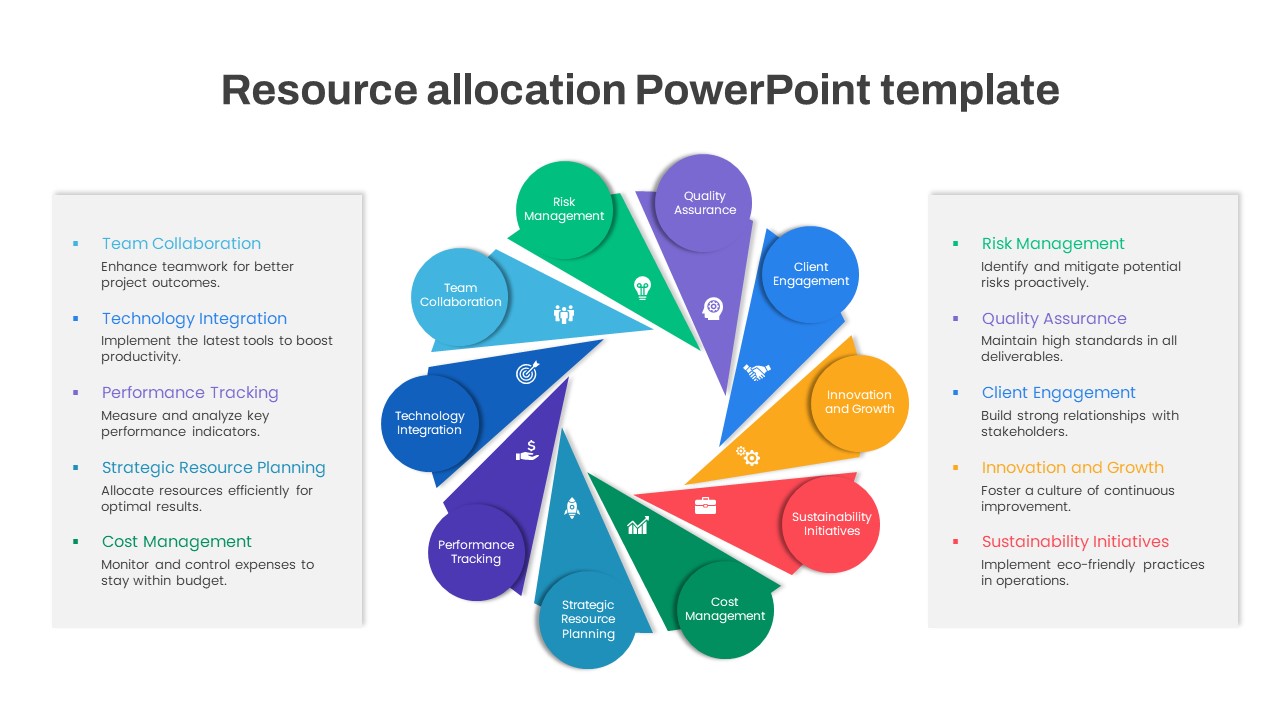
Resource Allocation Wheel Diagram Template for PowerPoint & Google Slides
Circular
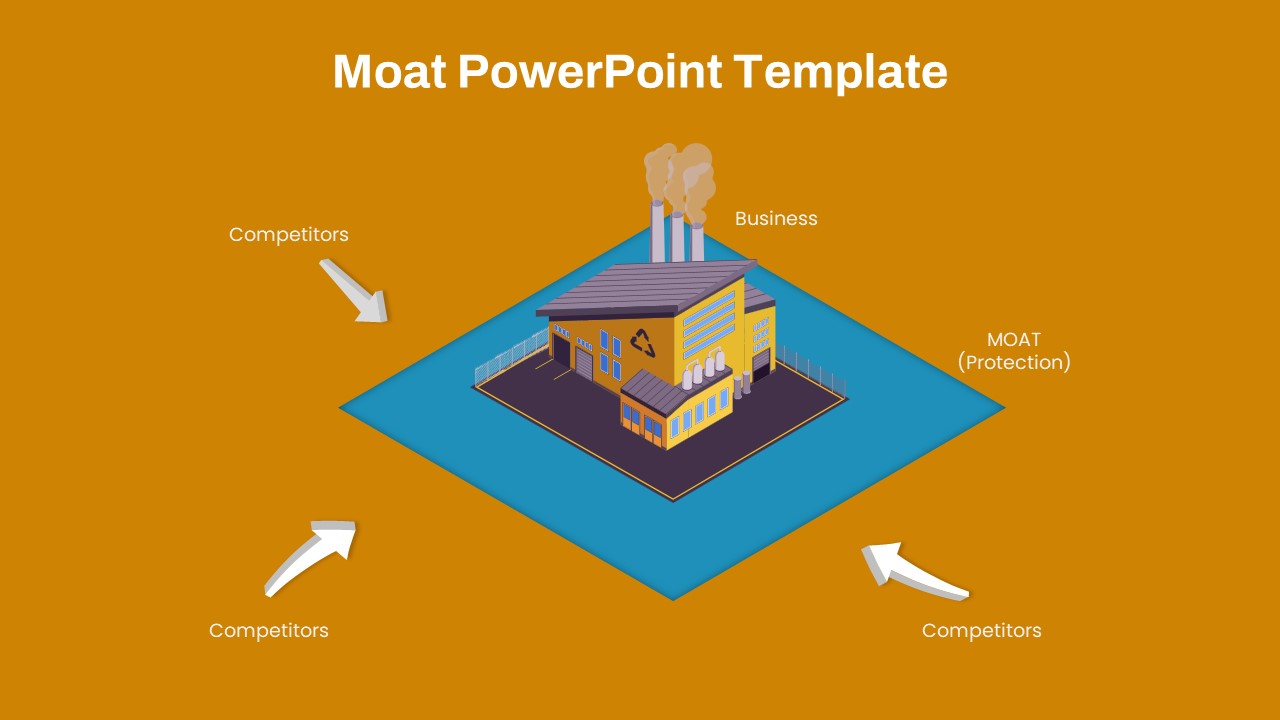
Moat Diagram Business Strategy Template for PowerPoint & Google Slides
Competitor Analysis
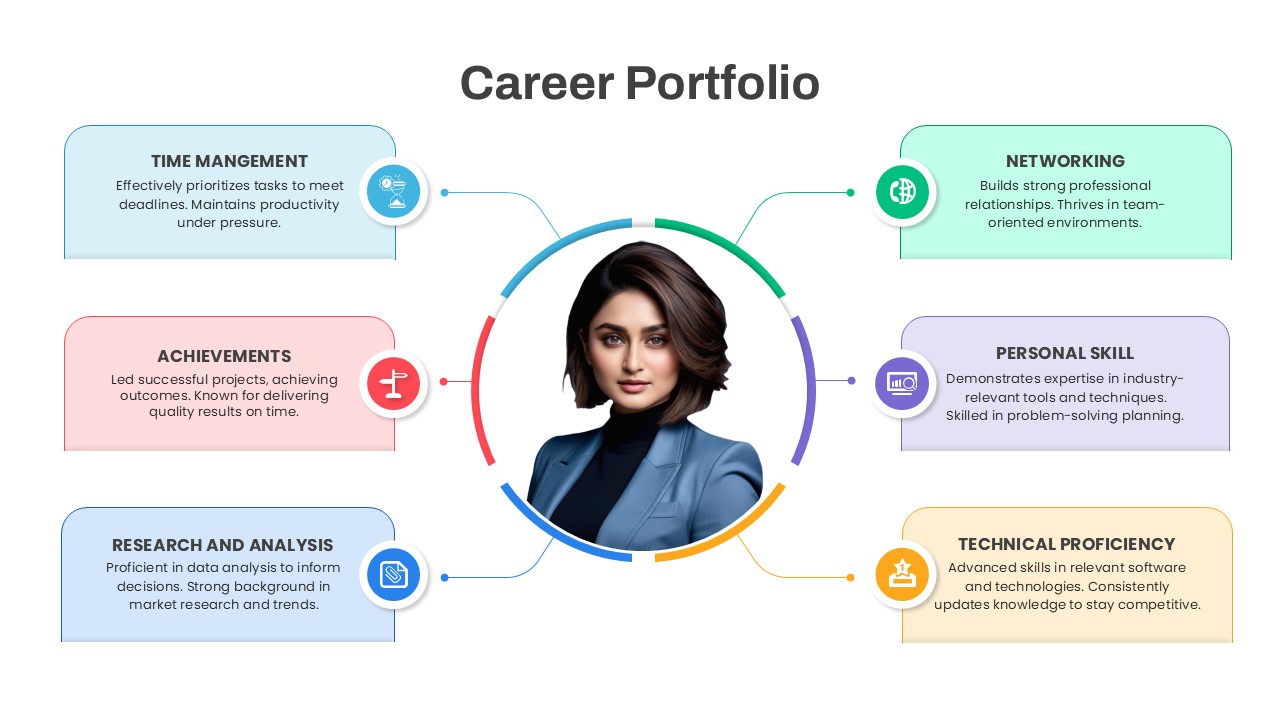
Career Portfolio Hub-and-Spoke Diagram Template for PowerPoint & Google Slides
Circular
5Cs of Network Effect Circular Diagram Template for PowerPoint & Google Slides
Circular
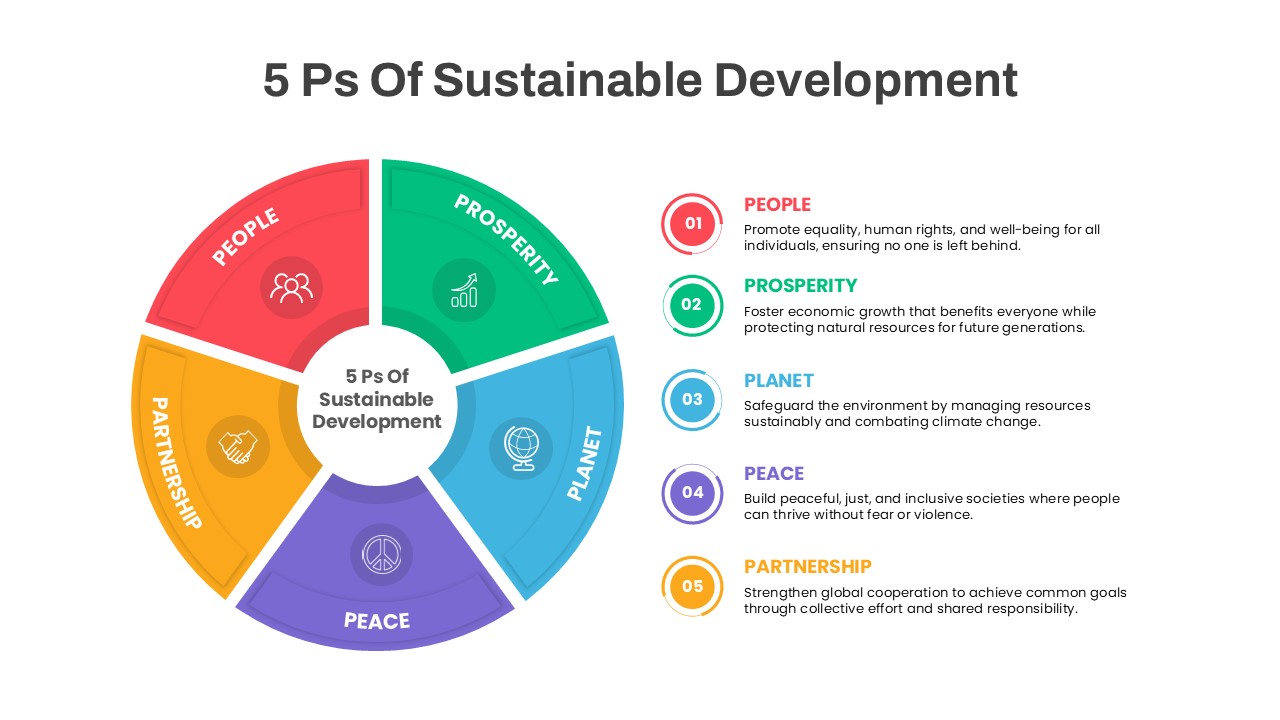
5 Ps Sustainable Development Diagram Template for PowerPoint & Google Slides
Circular
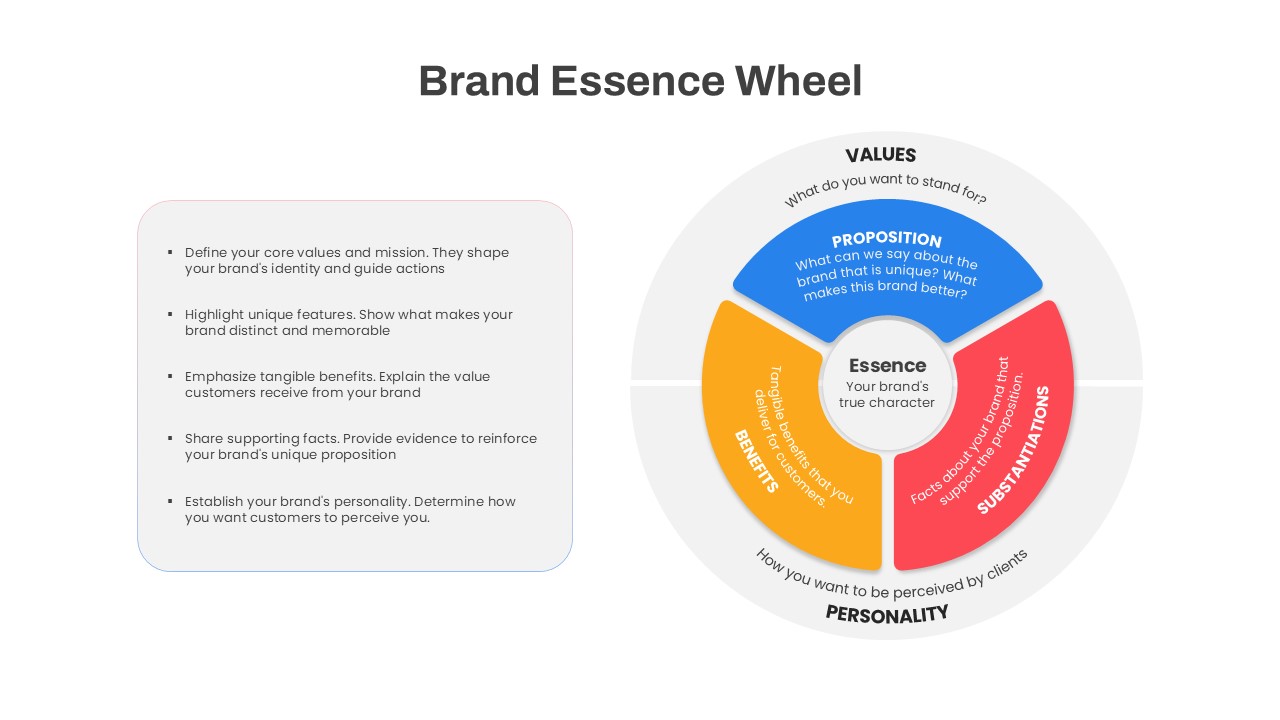
Brand Essence Wheel Strategy Diagram Template for PowerPoint & Google Slides
Circular
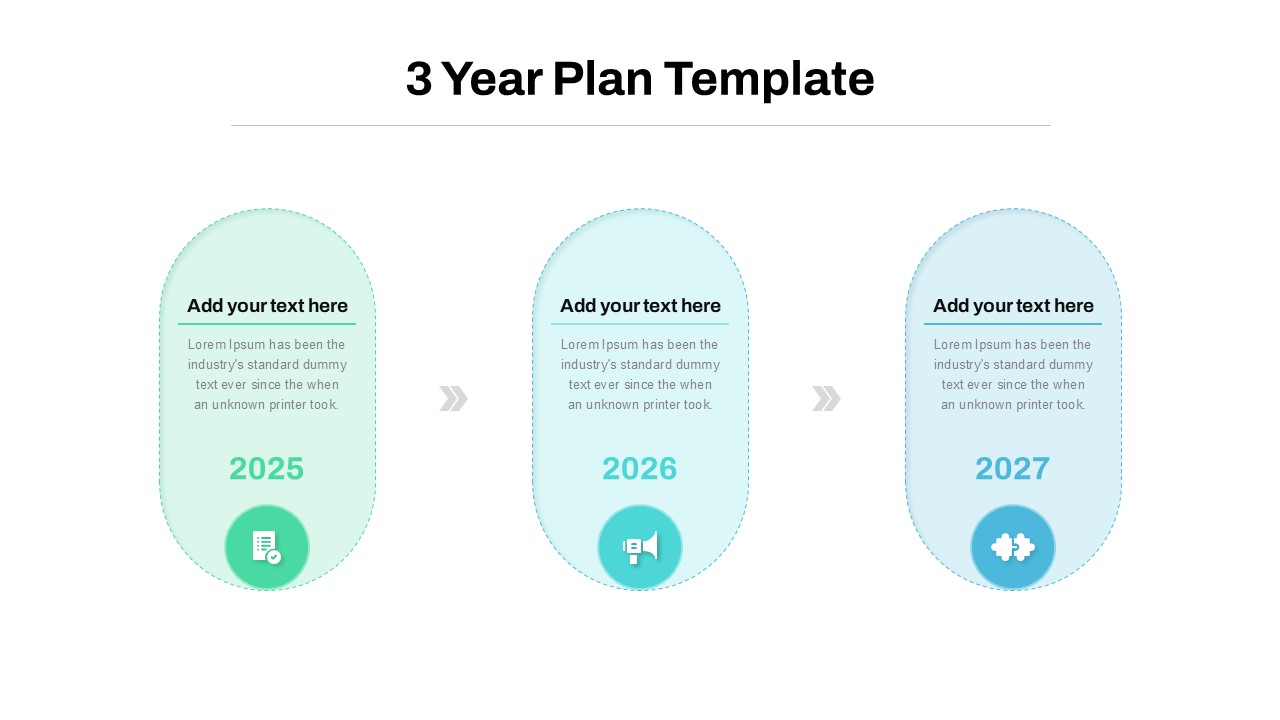
Three-Year Plan Timeline Diagram Template for PowerPoint & Google Slides
Timeline
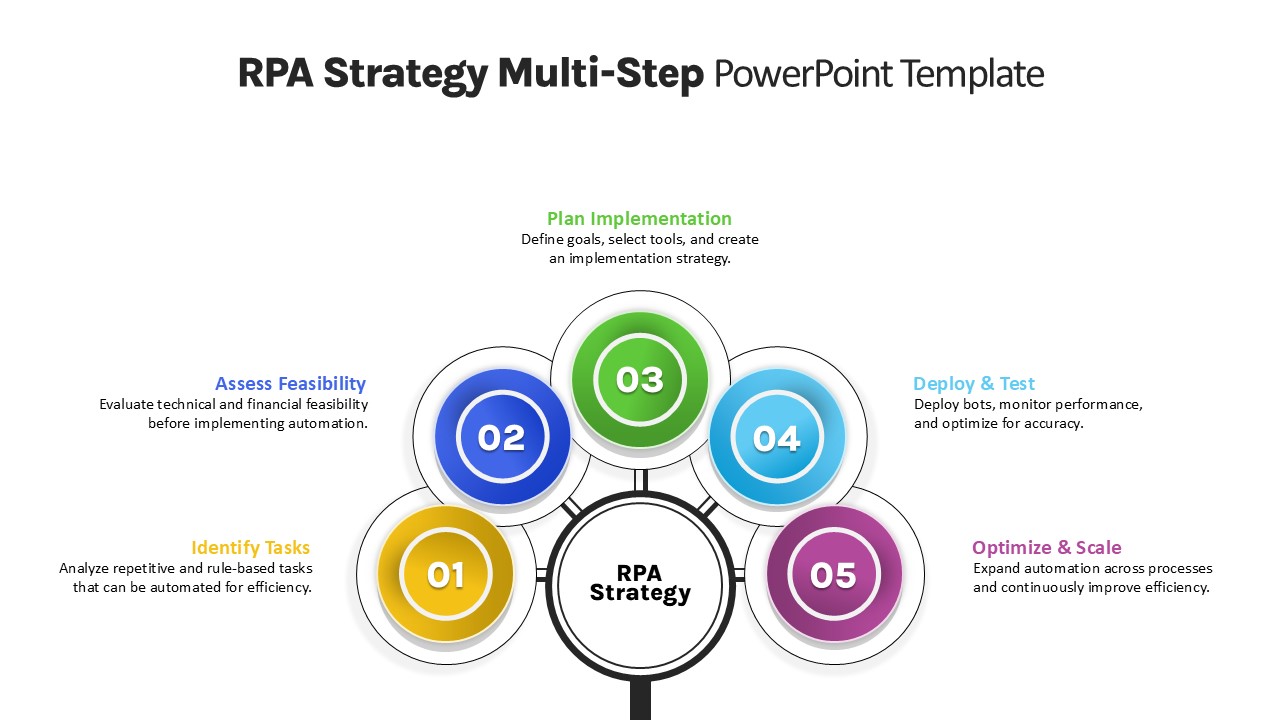
RPA Strategy Multi-Step Diagram Template for PowerPoint & Google Slides
Process
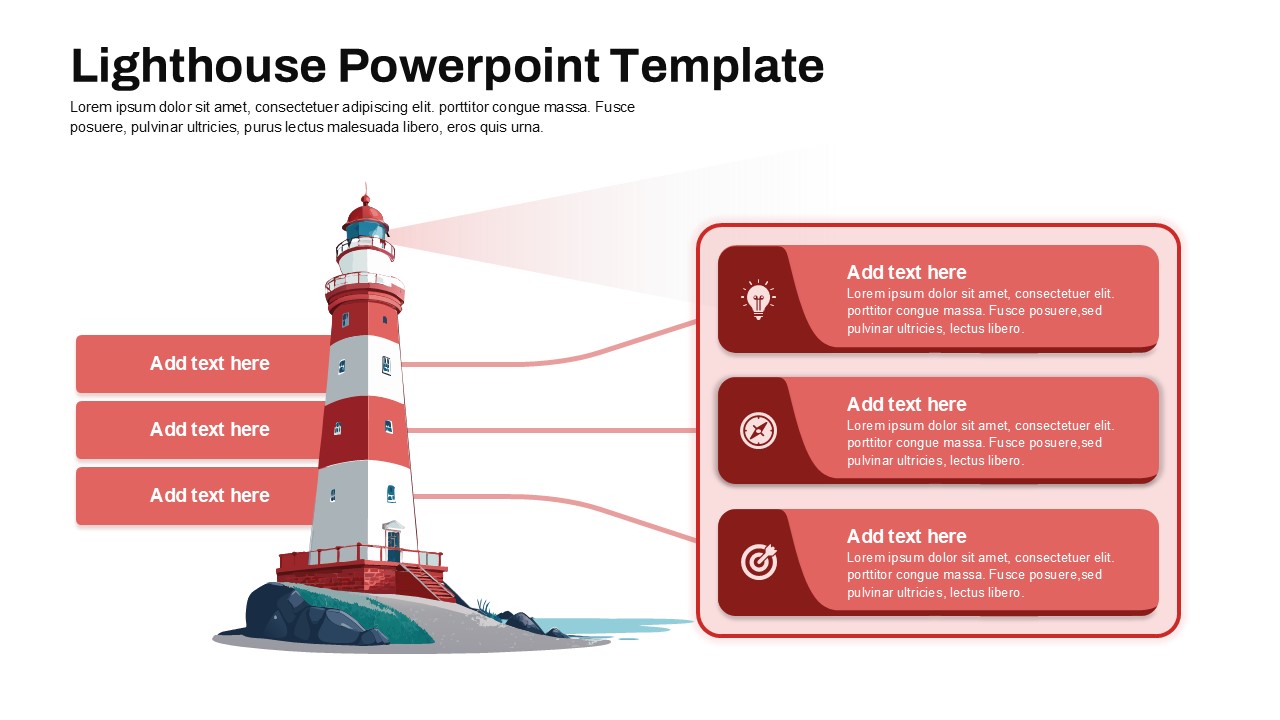
Lighthouse Three-Step Guidance Diagram Template for PowerPoint & Google Slides
Process
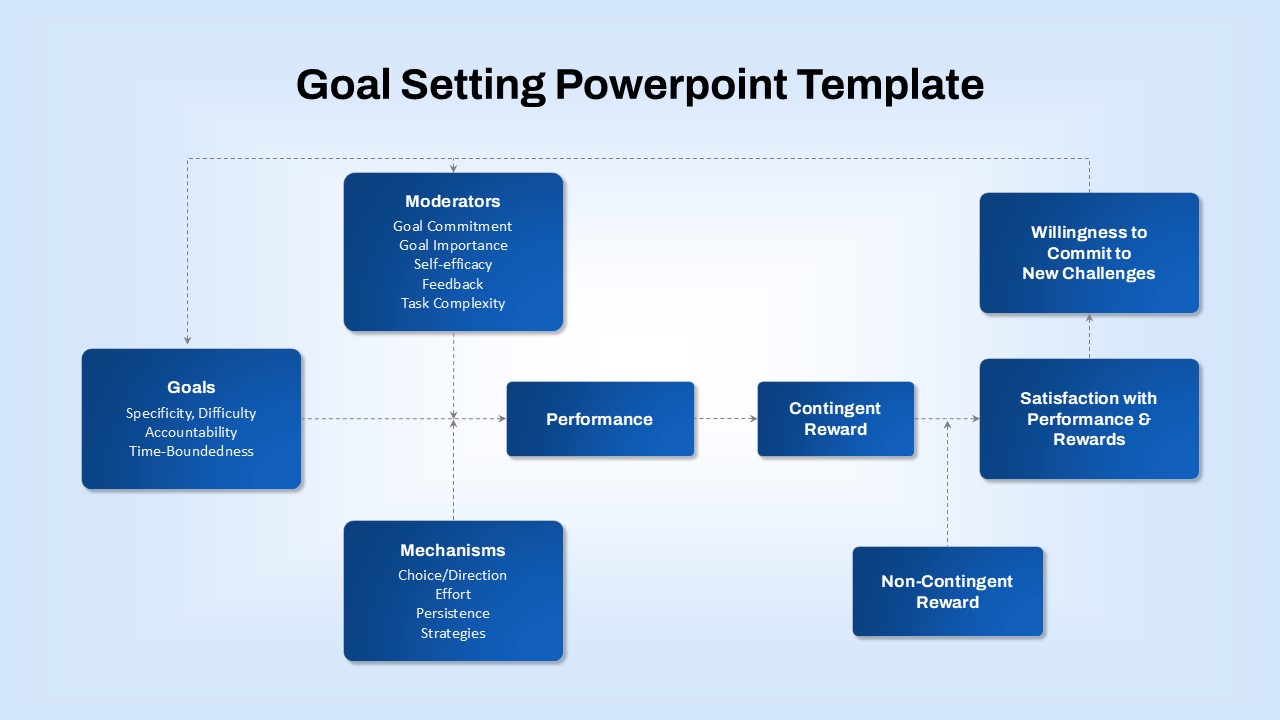
Goal-Setting Process Flow Diagram Template for PowerPoint & Google Slides
Goals
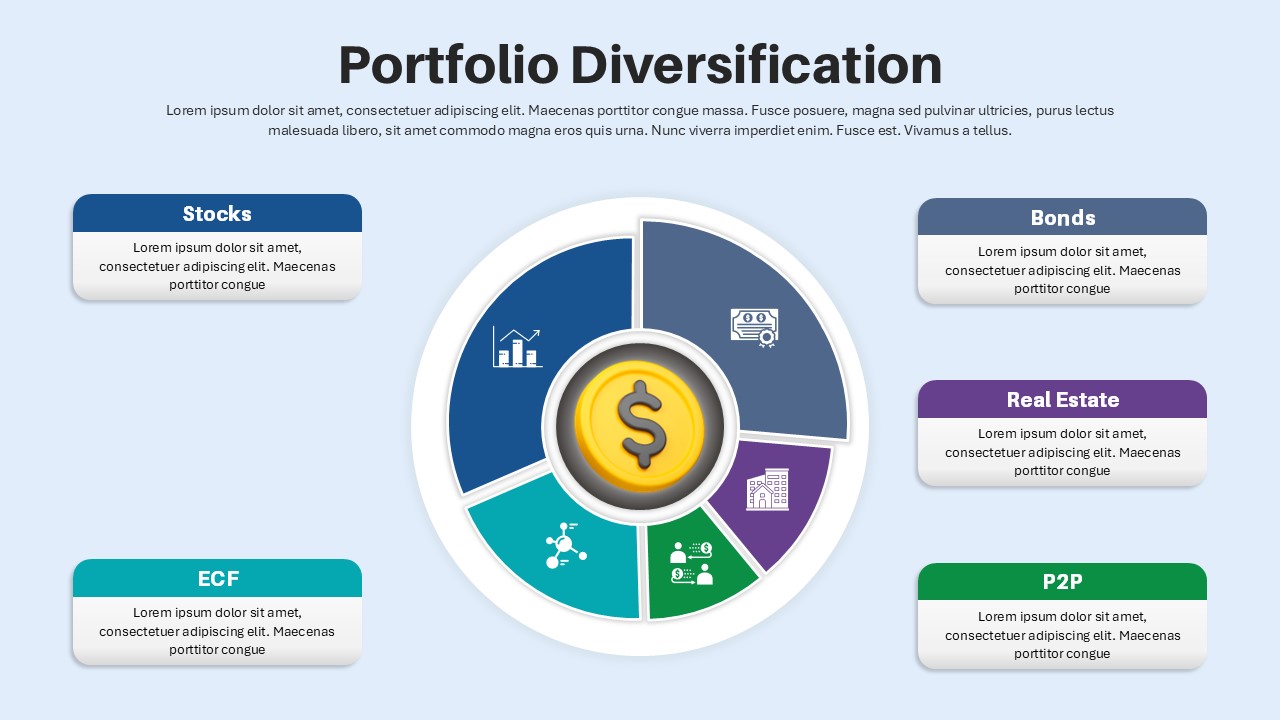
Portfolio Diversification Diagram Template for PowerPoint & Google Slides
Circular
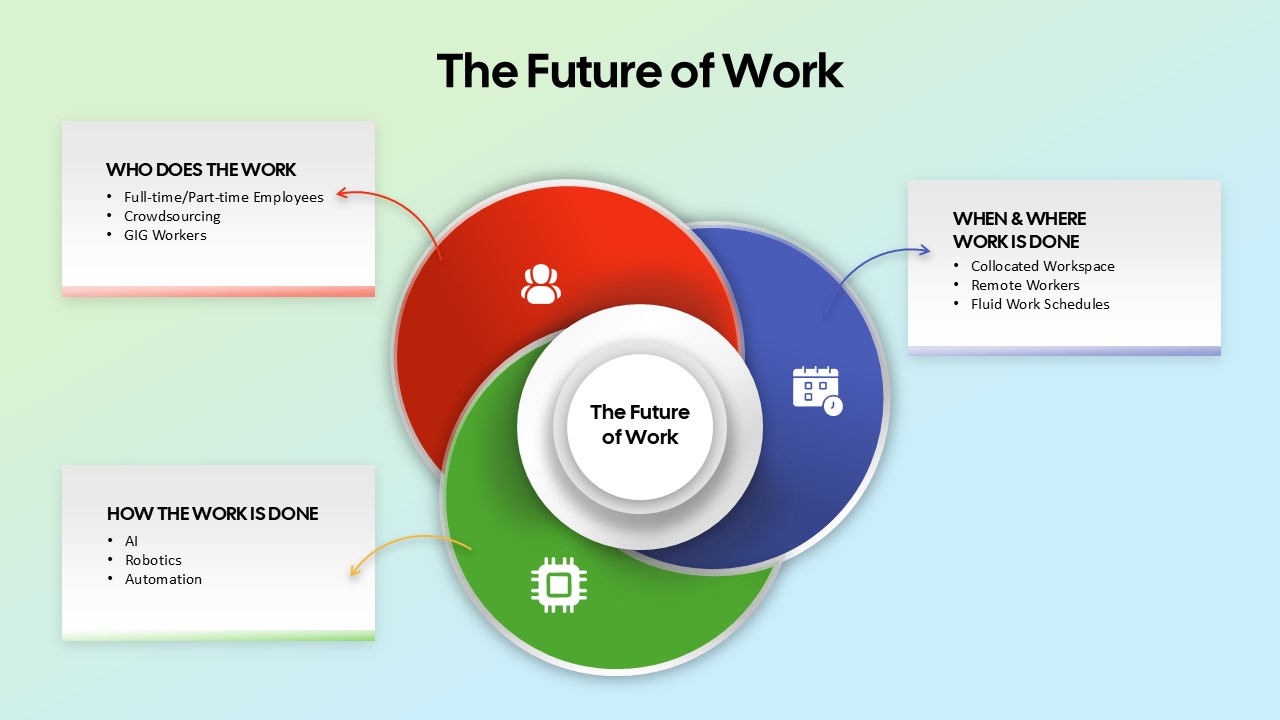
The Future of Work Venn Diagram Template for PowerPoint & Google Slides
Circular
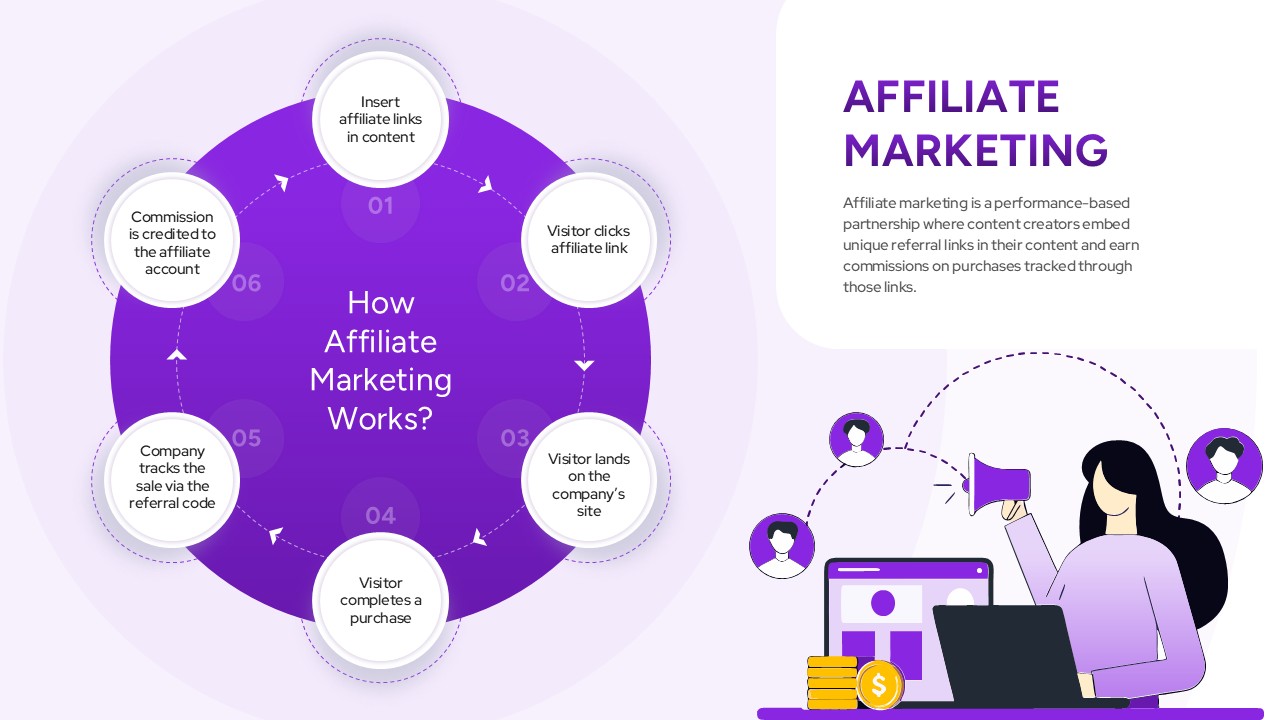
Affiliate Marketing Workflow Diagram Template for PowerPoint & Google Slides
Customer Experience
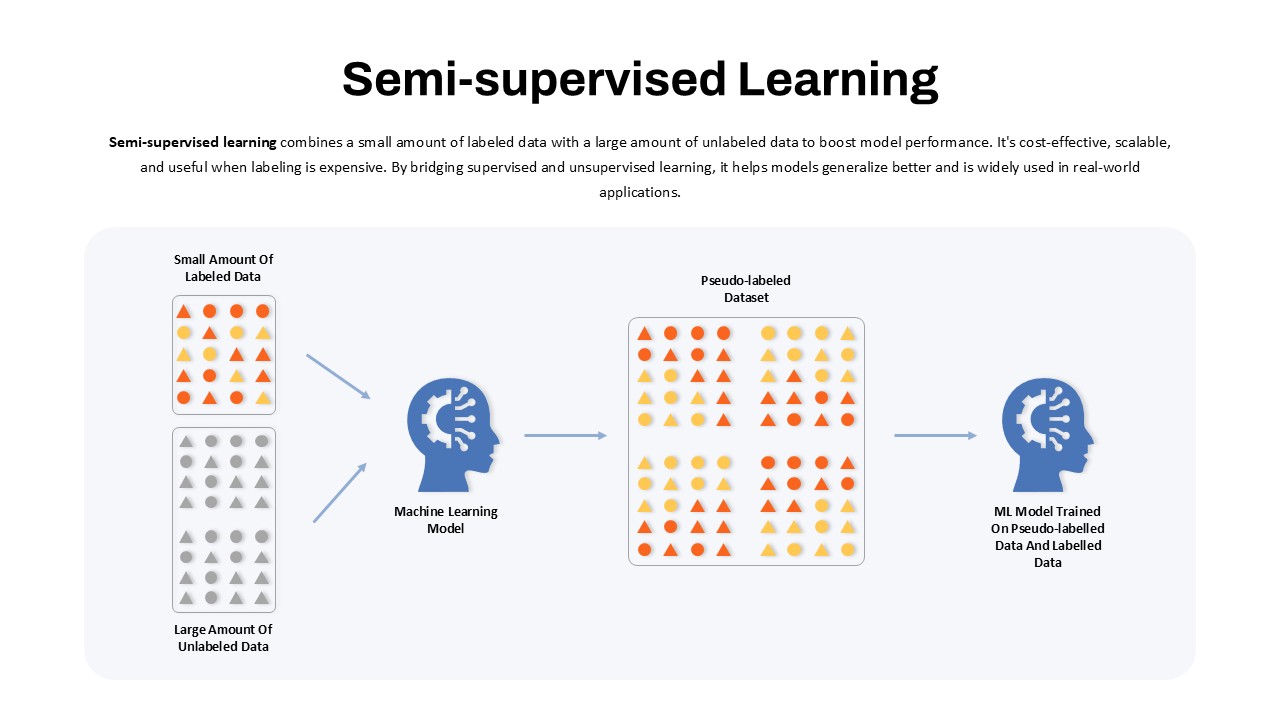
Semi-Supervised Learning Flow Diagram Template for PowerPoint & Google Slides
Machine Learning
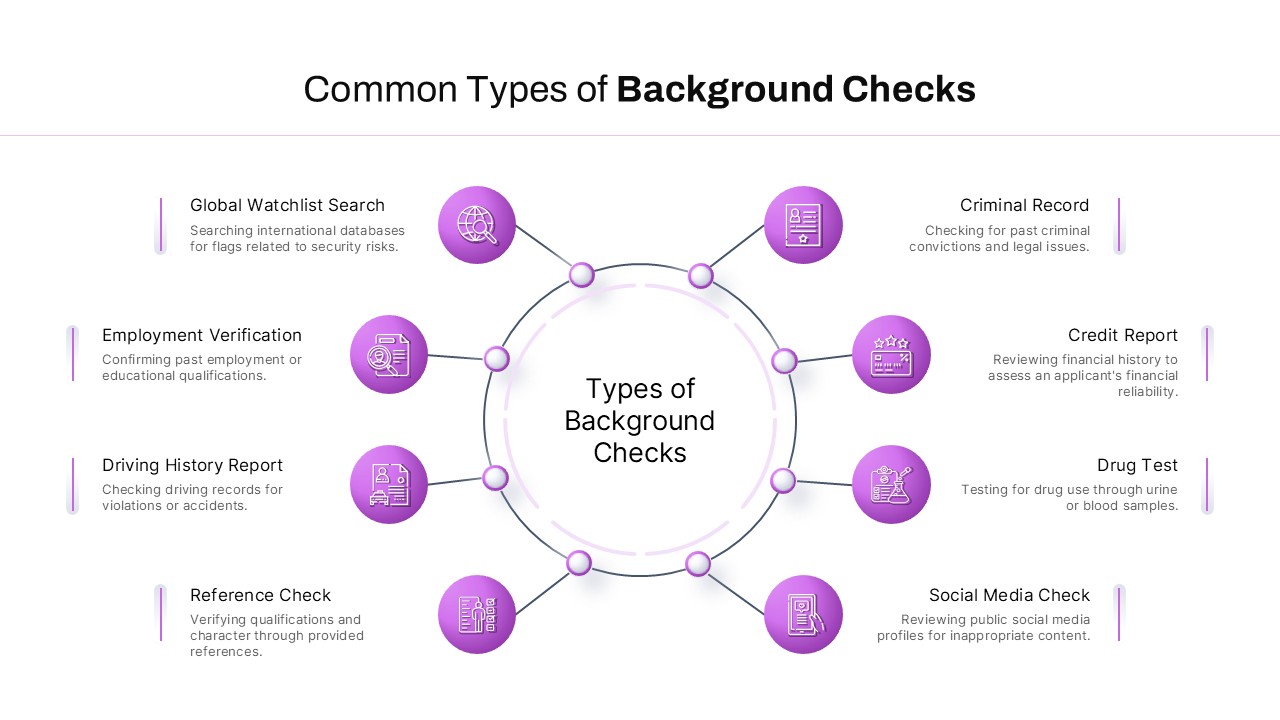
Background Check Types Diagram Template for PowerPoint & Google Slides
Circular
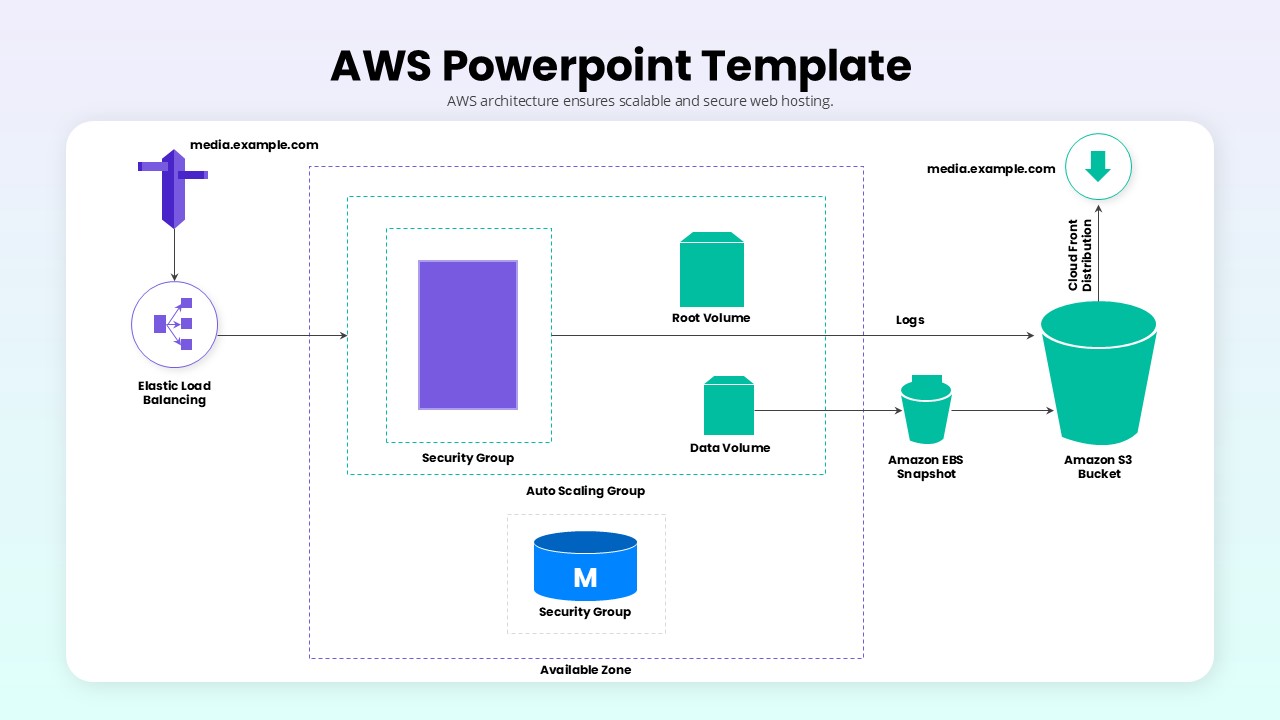
Scalable AWS Architecture Diagram Template for PowerPoint & Google Slides
Cloud Computing
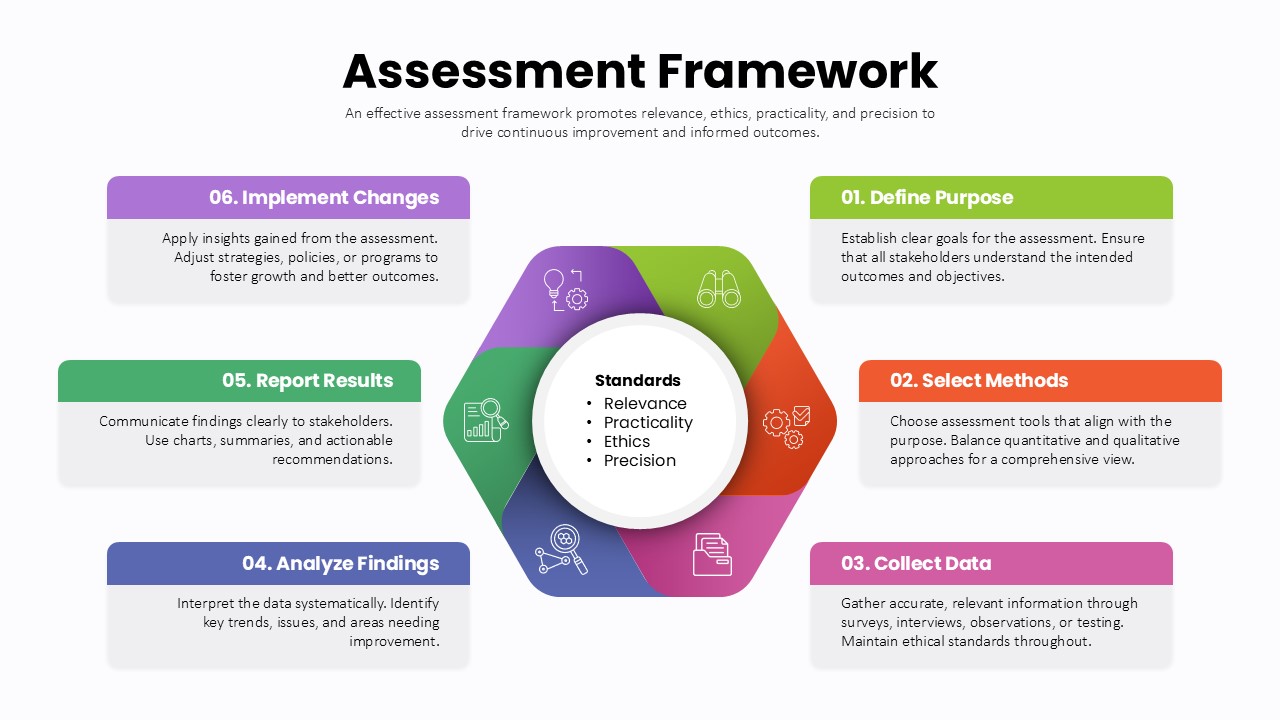
Assessment Framework Circular Diagram Template for PowerPoint & Google Slides
Circular
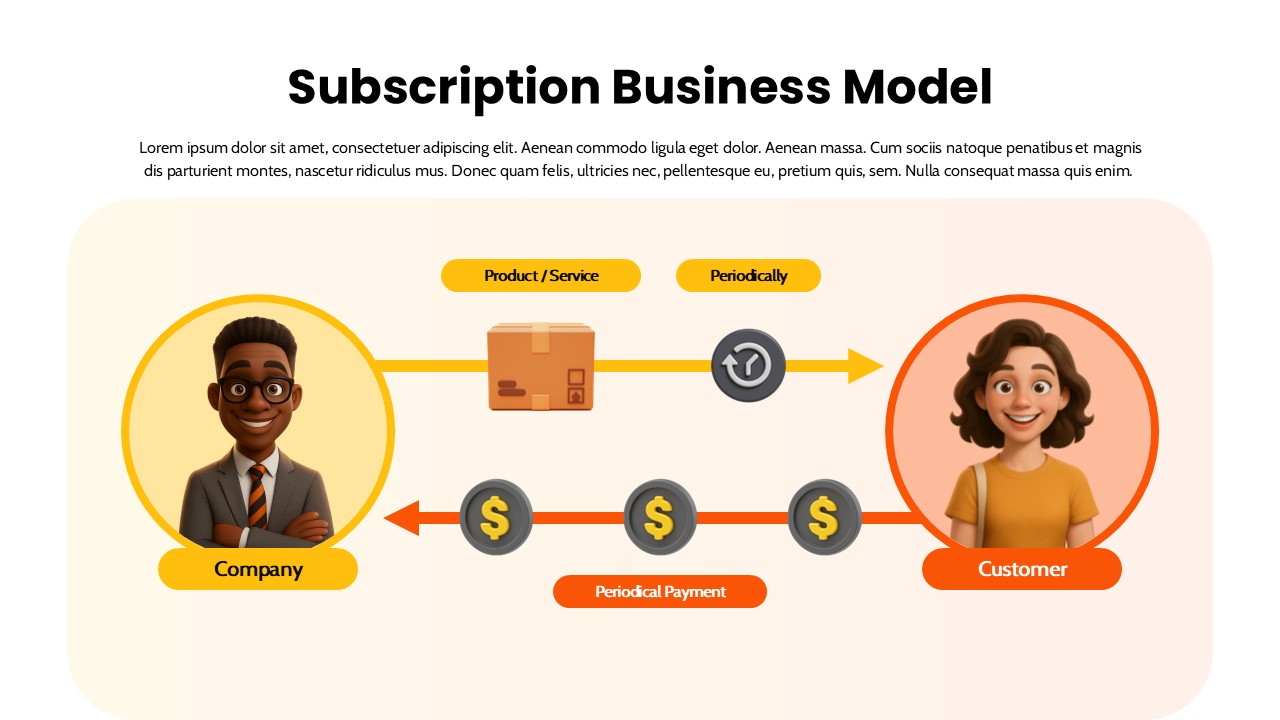
Subscription Business Model Flow Diagram Template for PowerPoint & Google Slides
Business Models
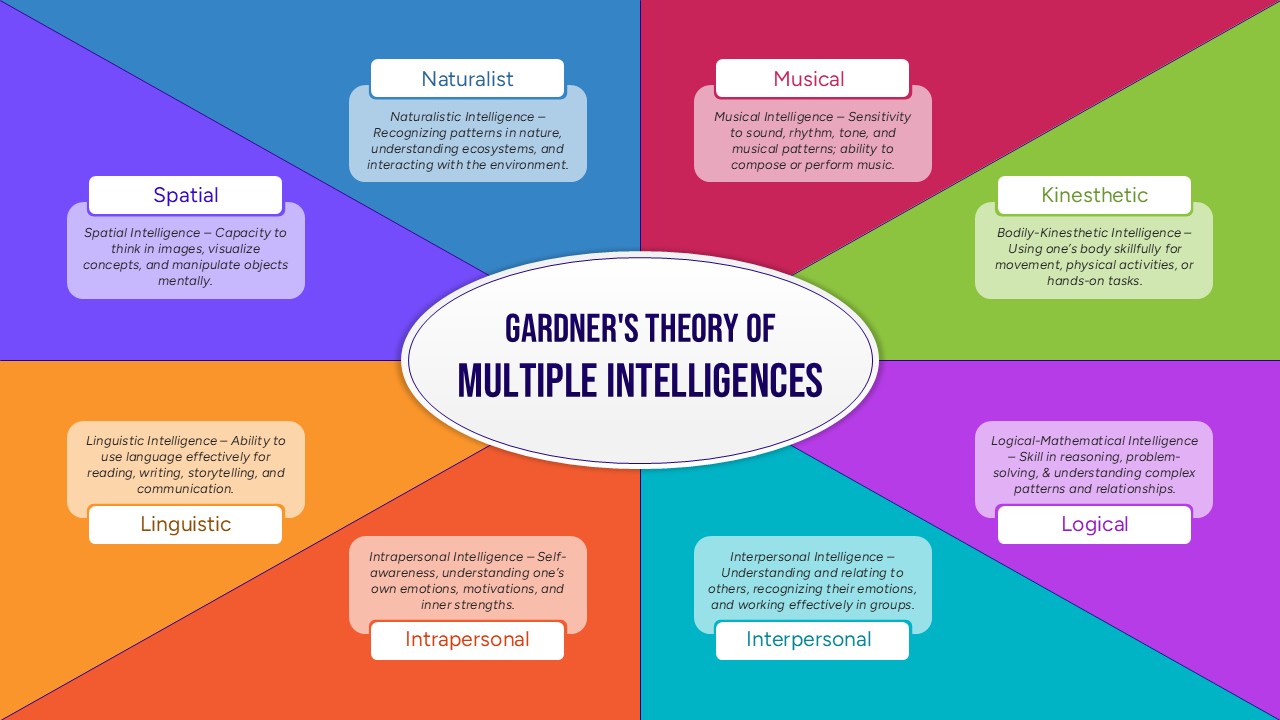
Gardner’s Theory of Multiple Intelligences Diagram Template for PowerPoint & Google Slides
Leadership
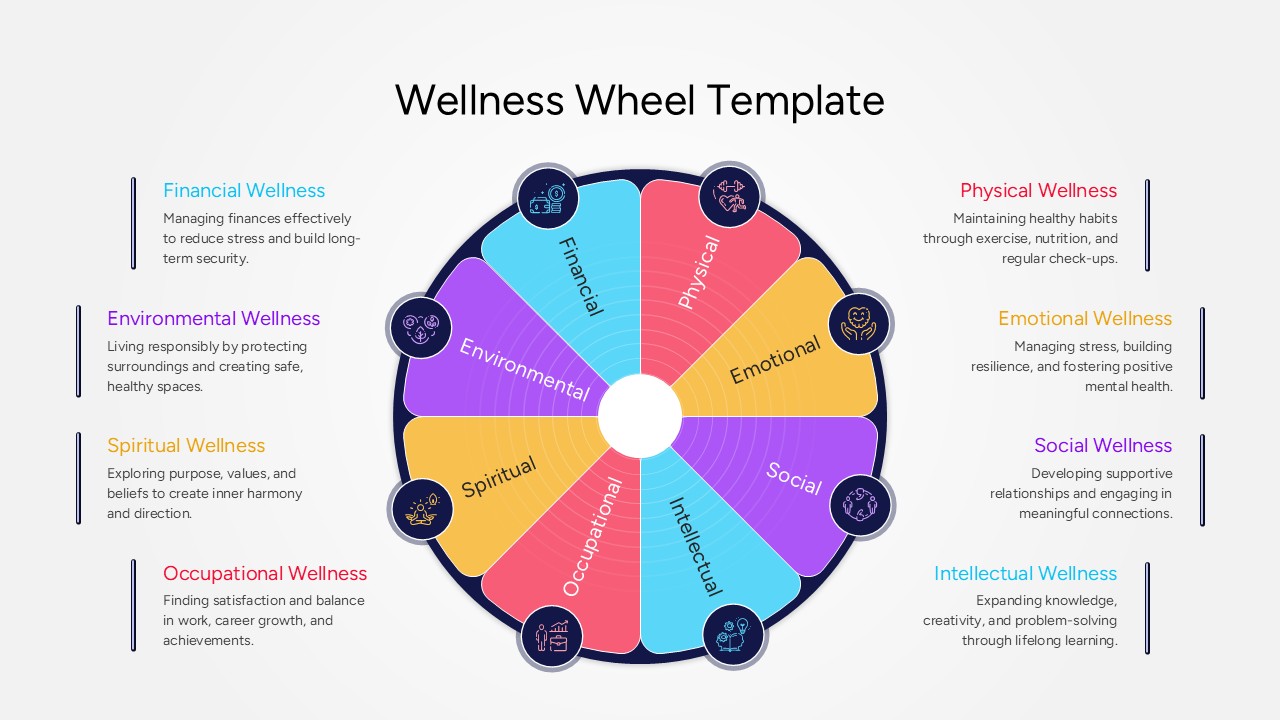
Wellness Wheel Concept Diagram Template for PowerPoint & Google Slides
Health