9 Segment Diagram Infographics for PowerPoint & Google Slides


Description
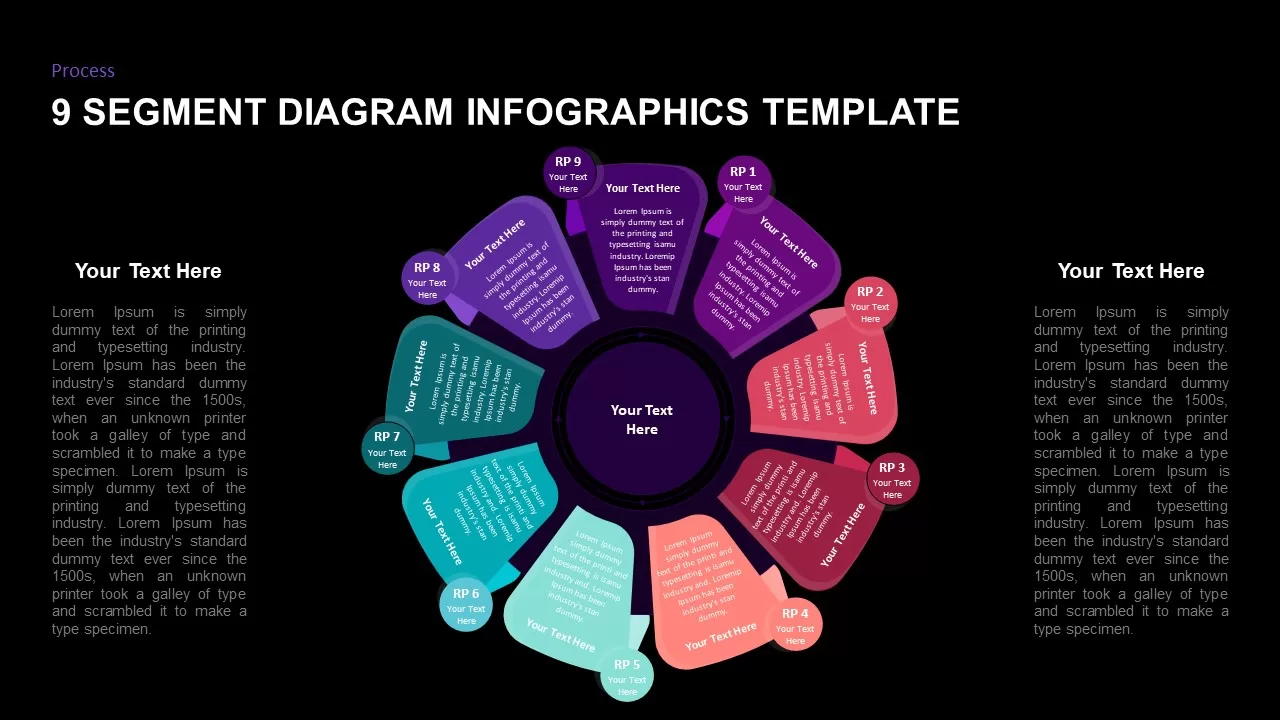
This 9 Segment Diagram Infographics template offers a dynamic and visually appealing way to present complex processes or concepts in a structured format. The diagram consists of nine distinct segments arranged around a central circle, each segment highlighted with vibrant colors and placeholders for text. This layout is ideal for showcasing multi-step processes, workflows, or frameworks that require a comprehensive yet digestible format for audiences.
With its colorful design and clean structure, this template enhances clarity, helping your audience quickly grasp key concepts. It is perfect for presentations that focus on step-by-step guides, strategic planning, or any subject that requires a breakdown of several key elements or phases. The central space can be used for an overview or introduction, while each surrounding segment provides a detailed explanation of individual steps.
Fully editable in both PowerPoint and Google Slides, this template allows you to customize the colors, text, and layout to suit your presentation’s needs. The color-coded segments make the information easier to follow, while the modern design ensures your presentation stays visually engaging throughout.
Who is it for
This template is perfect for business strategists, project managers, educators, and consultants who need to explain complex processes or frameworks. It’s ideal for marketing professionals, product managers, and corporate trainers who need to break down a series of steps or stages for their audience.
Other Uses
Beyond typical process and workflow presentations, this slide can be used for visualizing strategic models, key performance indicators, or project milestones. It’s also useful for illustrating processes in education, explaining methodologies, or mapping out customer journey stages.
Login to download this file

Item ID
SB01879
Related Templates

Eight-Segment 3D Arrow Infographics Template for PowerPoint & Google Slides
Arrow
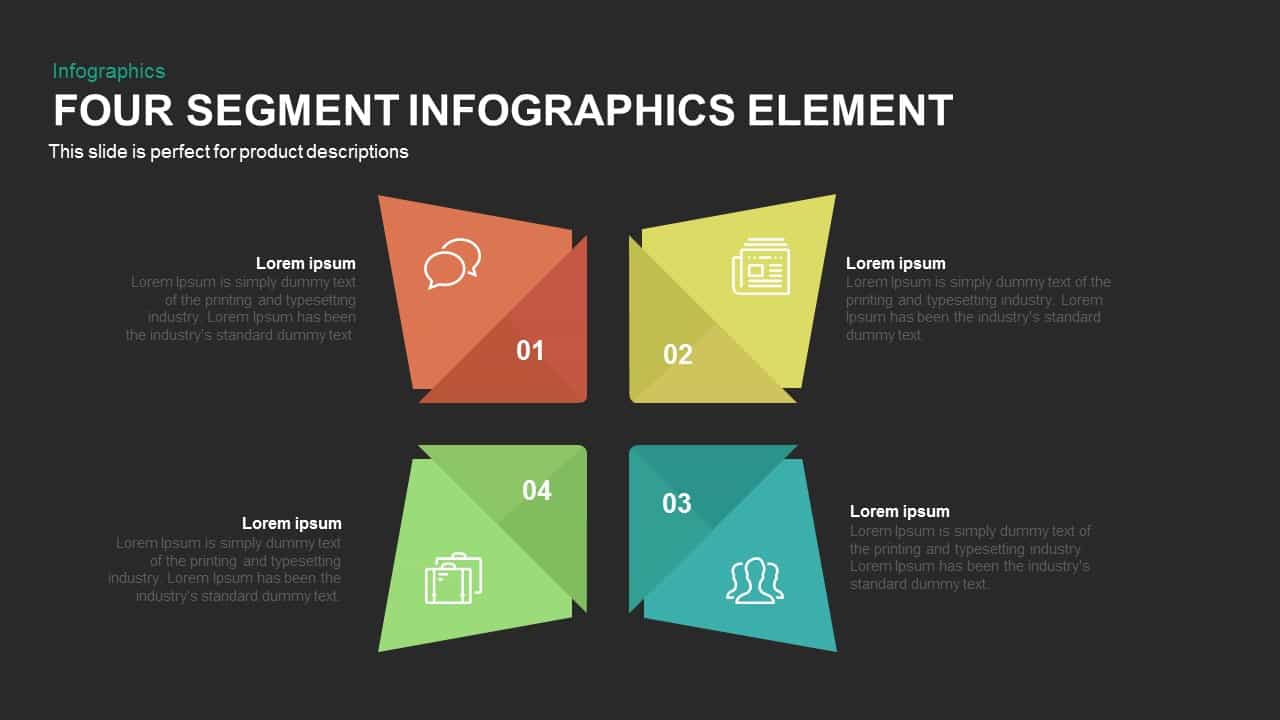
Four Segment Infographics Element Template for PowerPoint & Google Slides
Comparison
Multi-Segment Circle Split Diagram template for PowerPoint & Google Slides
Circular

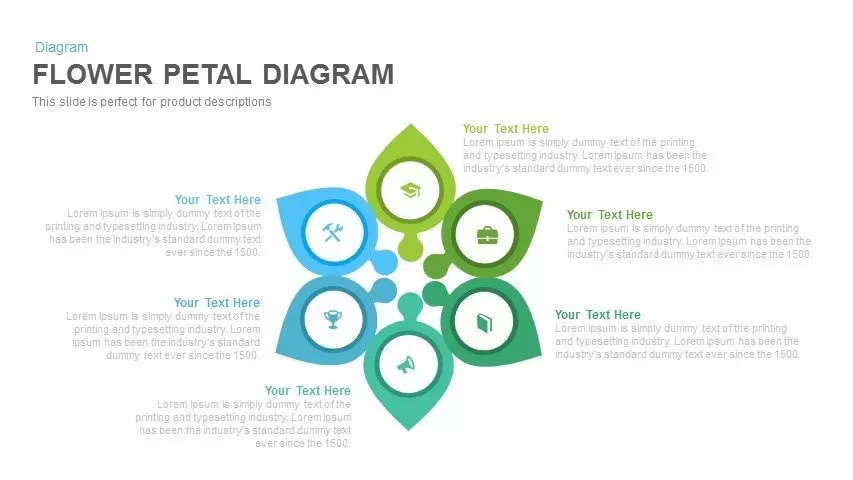
Six-Segment Flower Petal Diagram Template for PowerPoint & Google Slides
Circular

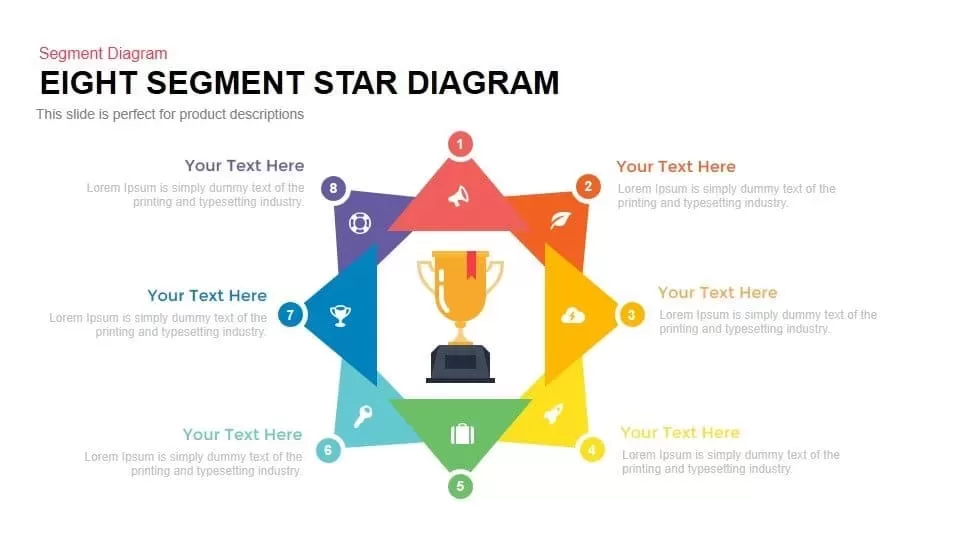
Eight Segment Star Diagram Infographic Template for PowerPoint & Google Slides
Process
Pie Segment Diagram Four-Step Process Template for PowerPoint & Google Slides
Pie/Donut
Seven-Segment Circular Arrow Diagram Template for PowerPoint & Google Slides
Arrow
Six Segment Hexagon Circular Diagram Template for PowerPoint & Google Slides
Circular
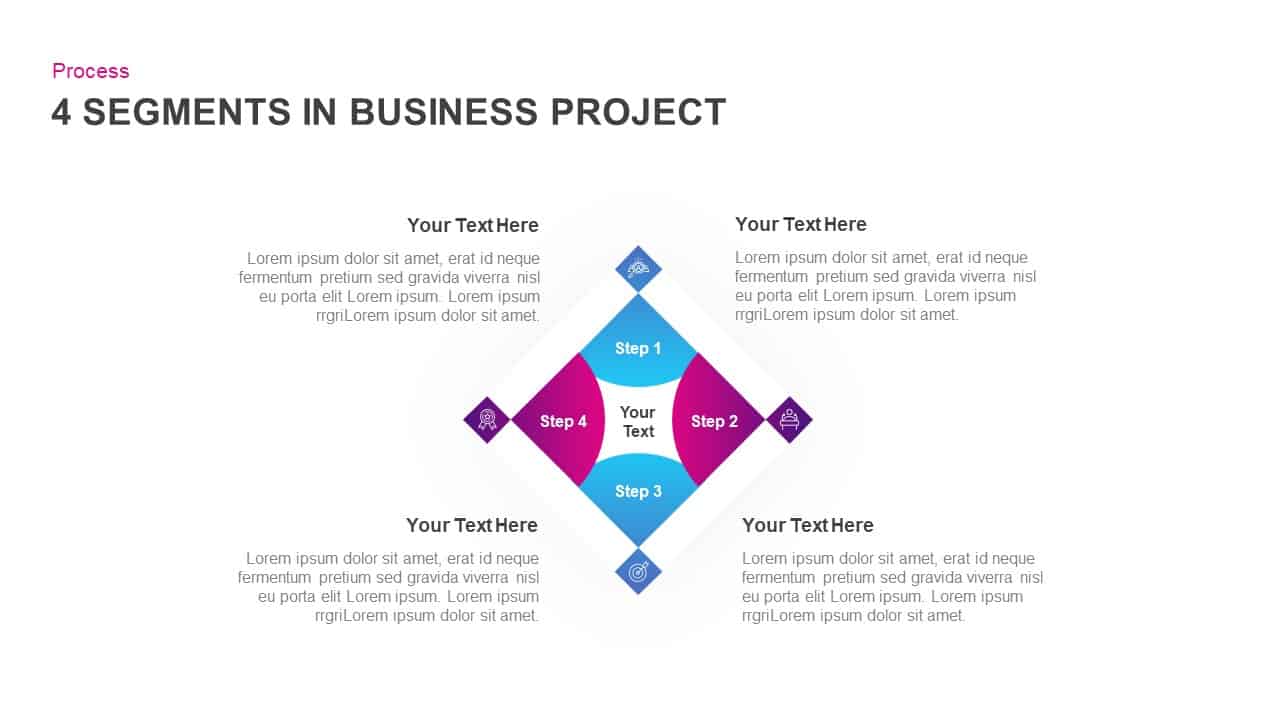
4-Segment Business Project Diamond Diagram Template for PowerPoint & Google Slides
Process
Circular 3D Cube Six-Segment Diagram Template for PowerPoint & Google Slides
Infographics
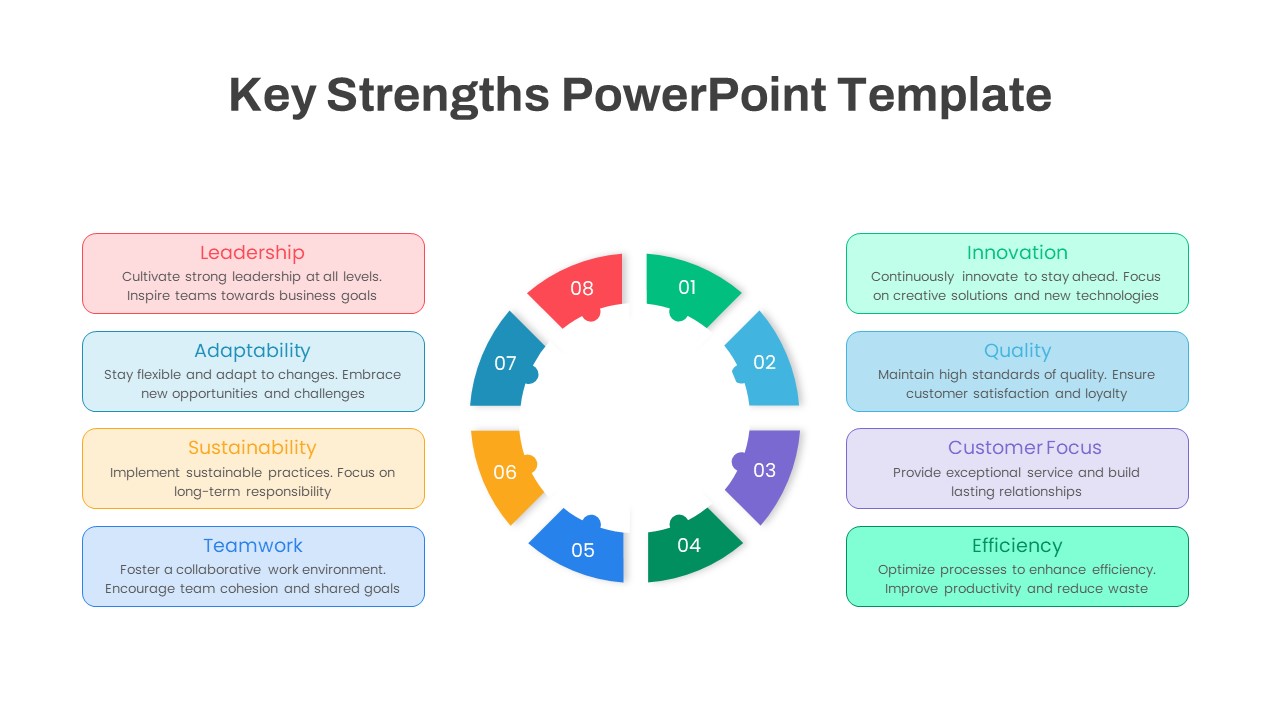
Eight-Segment Key Strengths Diagram Template for PowerPoint & Google Slides
Circular
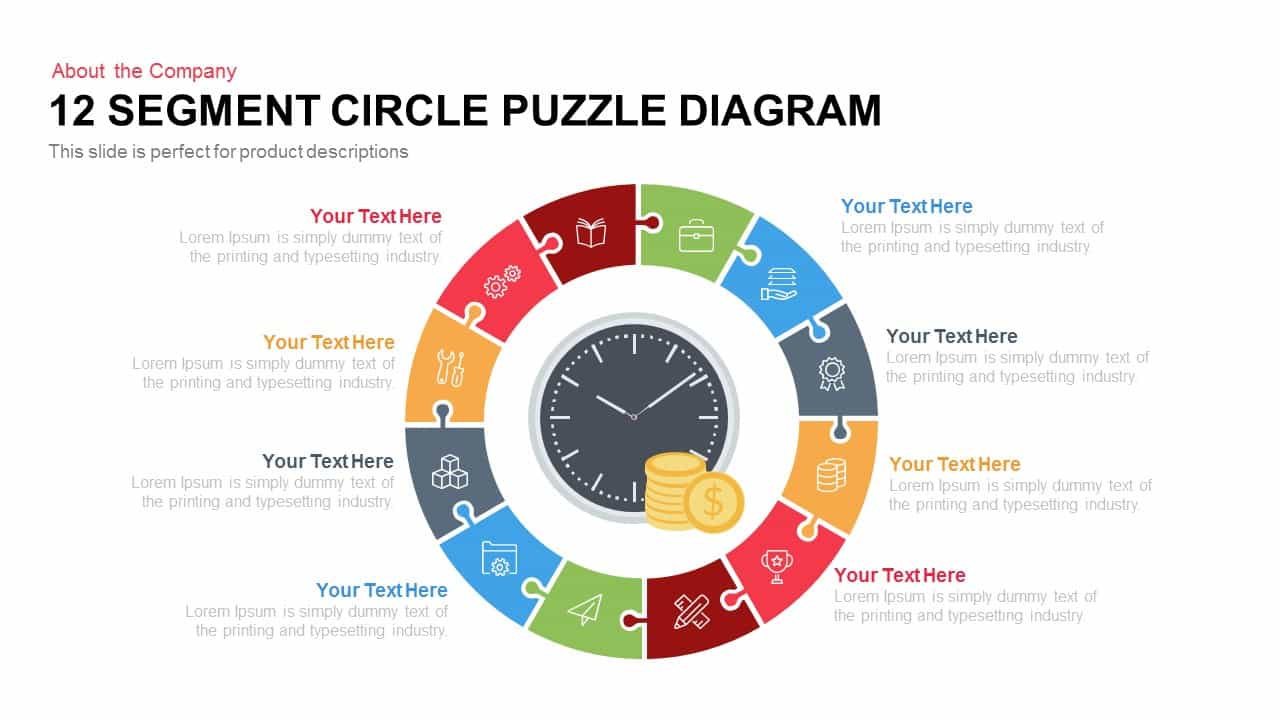
12 Segment Circle Puzzle Diagram Template for PowerPoint and Keynote
Circular
Circle Segment Sales Metrics Infographic Template for PowerPoint & Google Slides
Circular
Six-Segment Circular Hub Infographic Template for PowerPoint & Google Slides
Circular
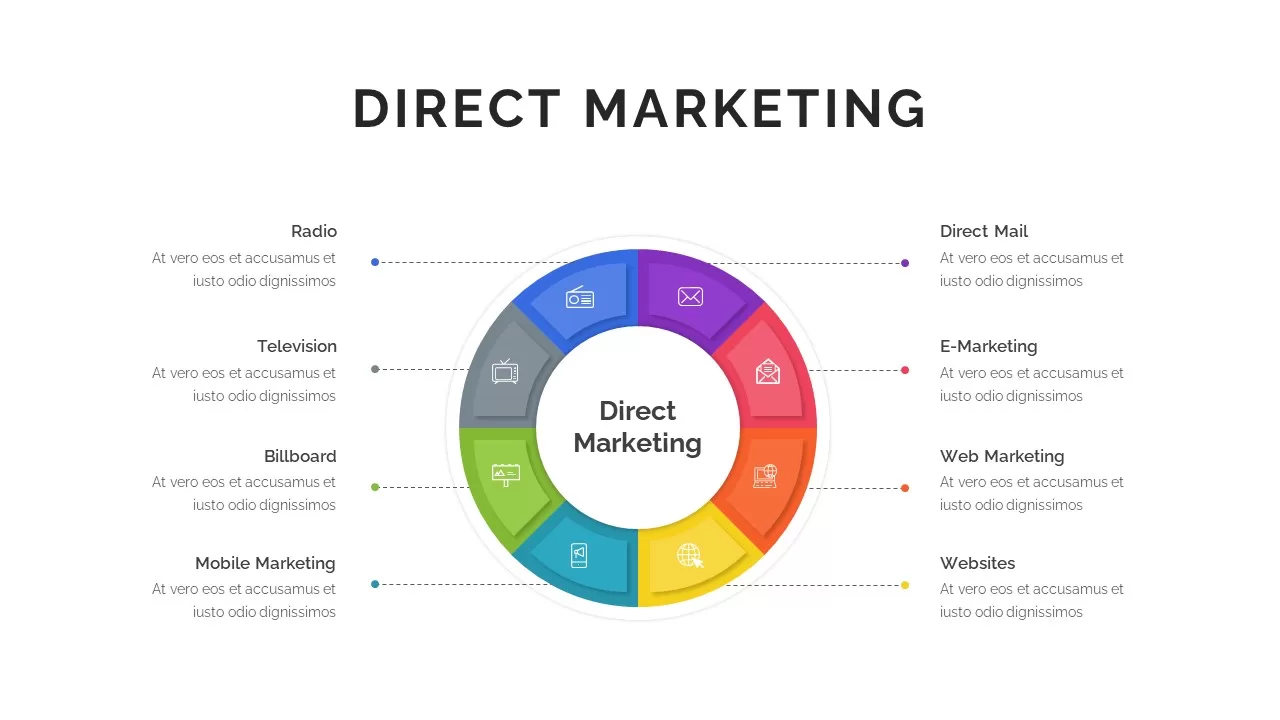
Eight-Segment Direct Marketing Wheel Template for PowerPoint & Google Slides
Circular
Three-Segment Circular Arrow Cycle Template for PowerPoint & Google Slides
Circular
Four-Segment Circular Arrow Cycle Template for PowerPoint & Google Slides
Circular
Six-Segment Circular Arrow Cycle Template for PowerPoint & Google Slides
Circular
Six-Segment Circular Arrow Infographic Template for PowerPoint & Google Slides
Circular
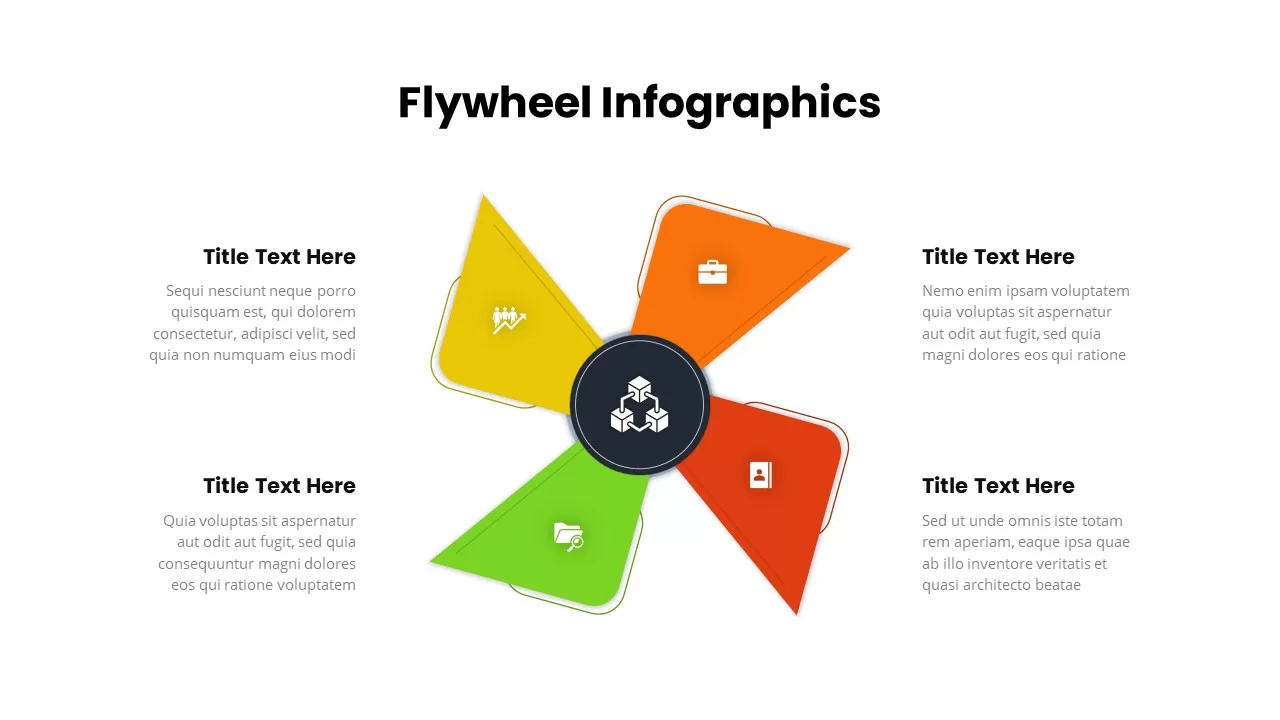
Four-Segment Flywheel Infographic Model Template for PowerPoint & Google Slides
Process
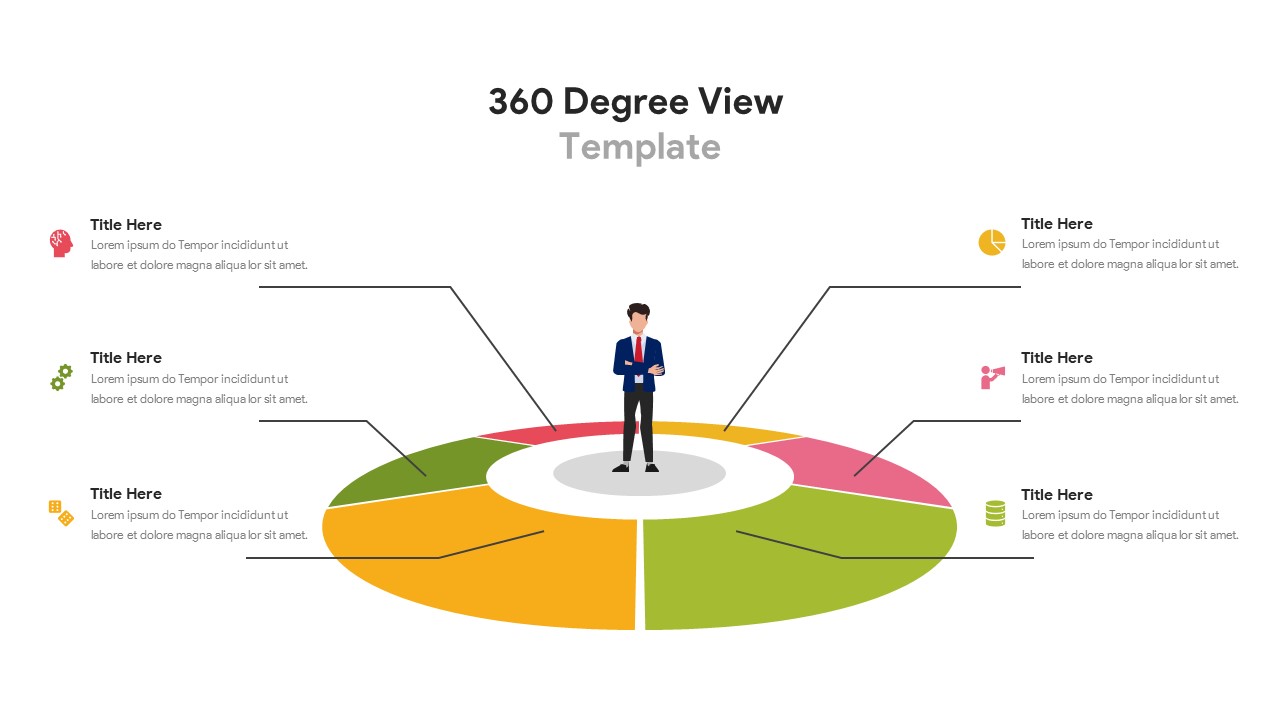
Six-Segment 360 Degree View Infographic Template for PowerPoint & Google Slides
Circular
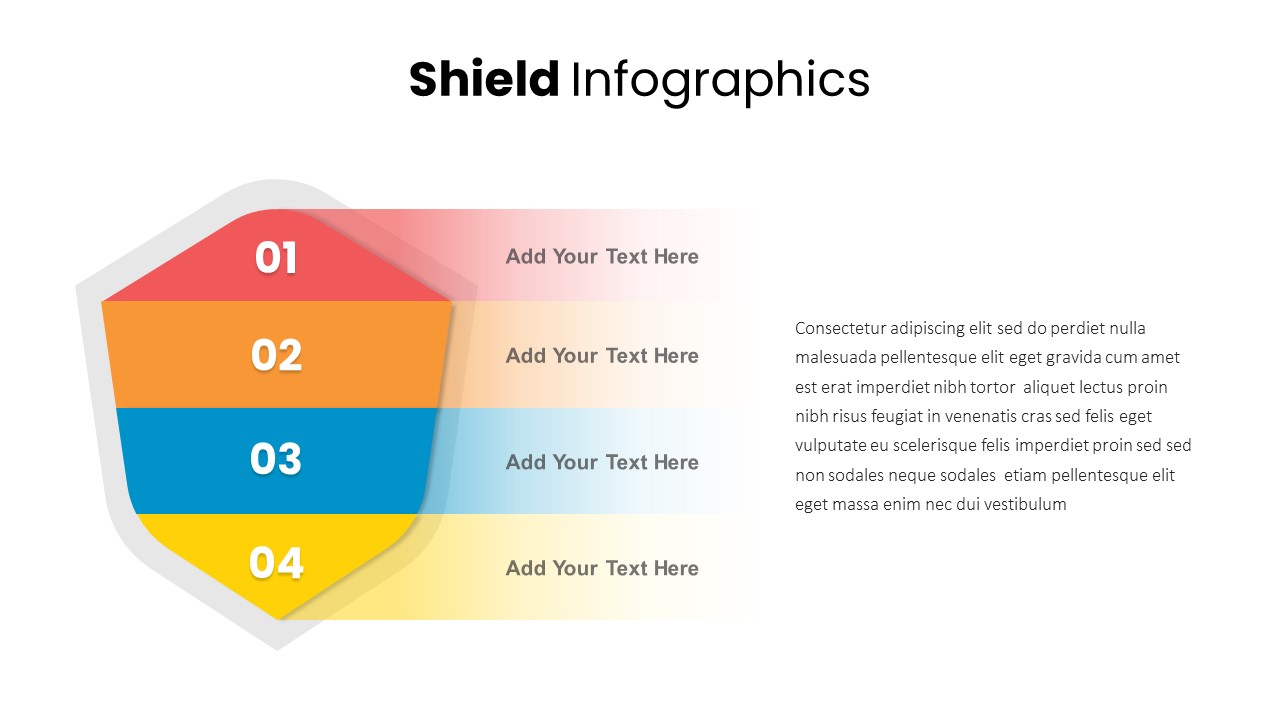
Shield Four-Segment Infographic Template for PowerPoint & Google Slides
Process
Colorful Four-Segment Wheel Chart Template for PowerPoint & Google Slides
Circular
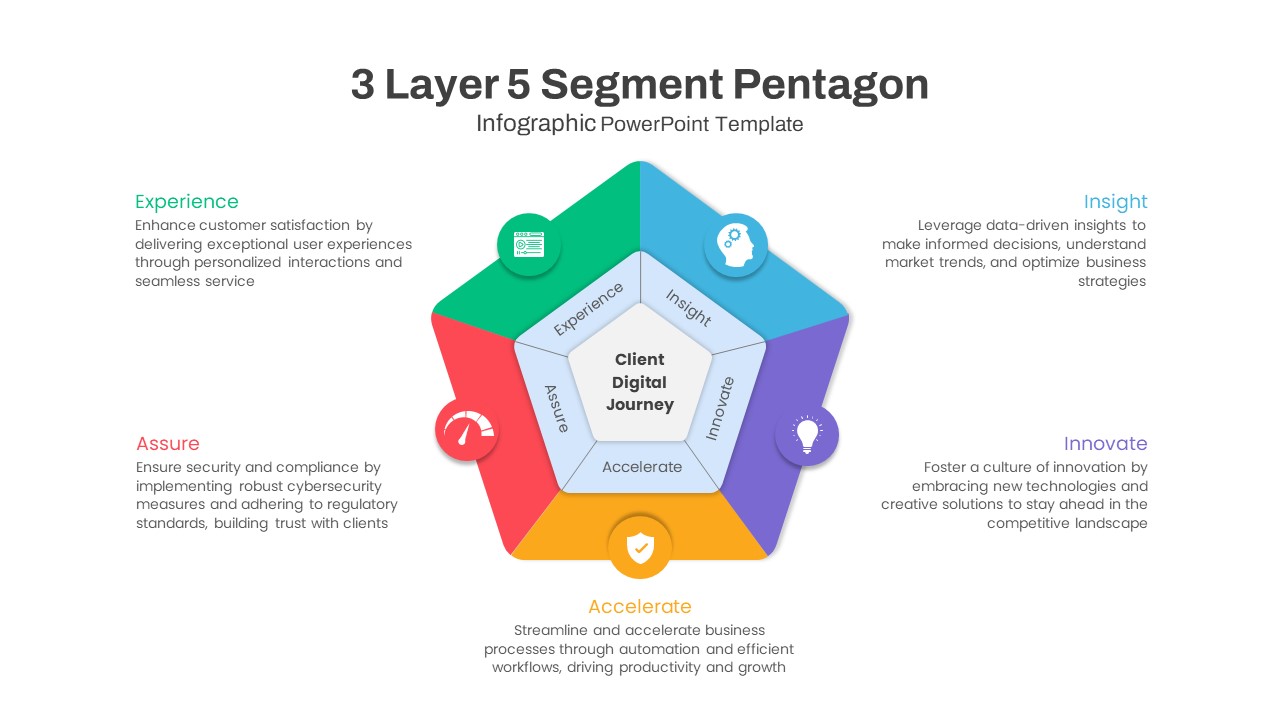
Five-Segment Pentagon Digital Journey Template for PowerPoint & Google Slides
Process
Three Segment Donut Chart KPI Infographic Template for PowerPoint & Google Slides
Pie/Donut
3D Four Arrow Infographics Diagram Template for PowerPoint & Google Slides
Arrow
Five Arrow Infographics Diagram Template for PowerPoint & Google Slides
Arrow
Five-Stage Pyramid Infographics Diagram Template for PowerPoint & Google Slides
Pyramid
Timeline Arrow Infographics Diagram Template for PowerPoint & Google Slides
Timeline
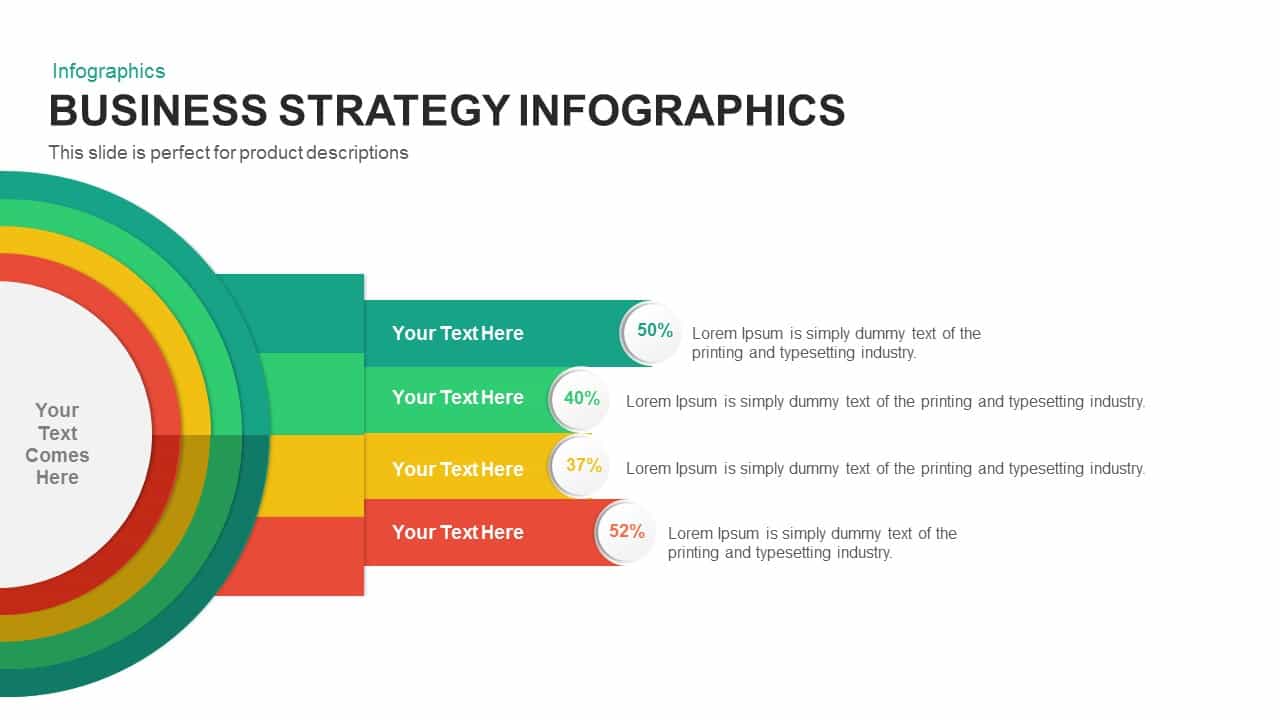
Business Strategy Infographics Diagram Template for PowerPoint & Google Slides
Business Strategy
Free Bulb Puzzle Infographics Diagram Template for PowerPoint & Google Slides
Process
Free
Pipe Water Infographics Flow Diagram Template for PowerPoint & Google Slides
Process
Venn Diagram Infographics Pack Template for PowerPoint & Google Slides
Circular
3D 6-Step Infographics Process Diagram Template for PowerPoint & Google Slides
Infographics
Colorful Venn Diagram Infographics Template for PowerPoint & Google Slides
Circular
8-Step Circular Gear Infographics Diagram for PowerPoint & Google Slides
Process
Box Diagram Infographics template for PowerPoint & Google Slides
Business
Four Section Diagram Infographics template for PowerPoint & Google Slides
Process
Rainbow Cloud Infographics Diagram Template for PowerPoint & Google Slides
Process
4 Business Data Infographics Diagram for PowerPoint & Google Slides
Process
Four Step Infographics Diagram for PowerPoint & Google Slides
Process
Six-Step Circular Diagram Infographics Template for PowerPoint & Google Slides
Circular
8-Step Circular Diagram Infographics Template for PowerPoint & Google Slides
Circular
Dynamic Gear Diagram Infographics Template for PowerPoint & Google Slides
Process
Versatile Creative Diagram Infographics Template for PowerPoint & Google Slides
Process
3D Funnel Diagram Infographics for PowerPoint & Google Slides
Funnel
See Saw Diagram Infographics for PowerPoint & Google Slides
Business
Network Diagram Infographics for PowerPoint & Google Slides
Technology
Turtle Diagram Infographics Template for PowerPoint & Google Slides
Process
Circle Timeline Infographics template for PowerPoint & Google Slides
Timeline
Six-Stage Process Infographics Template for PowerPoint & Google Slides
Process
3D Bar Chart Data Infographics Template for PowerPoint & Google Slides
Bar/Column
Dynamic Creative Head Infographics Template for PowerPoint & Google Slides
Circular
Puzzle Pipe Infographics Process Flow Template for PowerPoint & Google Slides
Process
Cloud Computing Infographics template for PowerPoint & Google Slides
Cloud Computing
Brain Gear Hub-and-Spoke Infographics template for PowerPoint & Google Slides
Org Chart
8-Step 3D Stair Infographics Slide template for PowerPoint & Google Slides
Process
Multi-Stage Timeline Infographics Template for PowerPoint & Google Slides
Timeline
Five-Stage Hexagon Process Infographics template for PowerPoint & Google Slides
Process
Six-Stage Time Arrow Infographics Template for PowerPoint & Google Slides
Arrow
Six Stage Timeline Infographics Template for PowerPoint & Google Slides
Timeline
3D Arrow Infographics template for PowerPoint & Google Slides
Arrow
Triangle Process Infographics template for PowerPoint & Google Slides
Process
Linear Chain Link Infographics Template for PowerPoint & Google Slides
Process
Mobile Infographics Data Visualization Template for PowerPoint & Google Slides
Infographics
Scrum Process & Roles Infographics Template for PowerPoint & Google Slides
Scrum
Canada Population Infographics Template for PowerPoint & Google Slides
World Maps
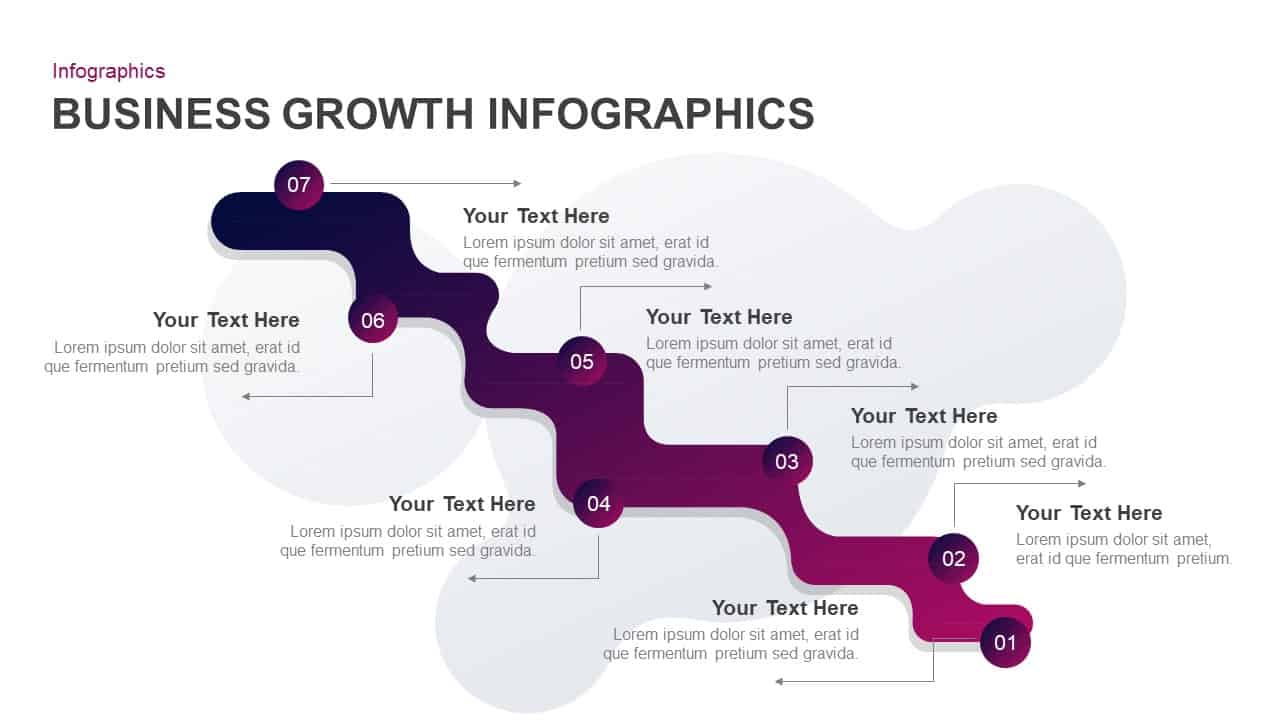
Business Growth Infographics Template for PowerPoint & Google Slides
Roadmap
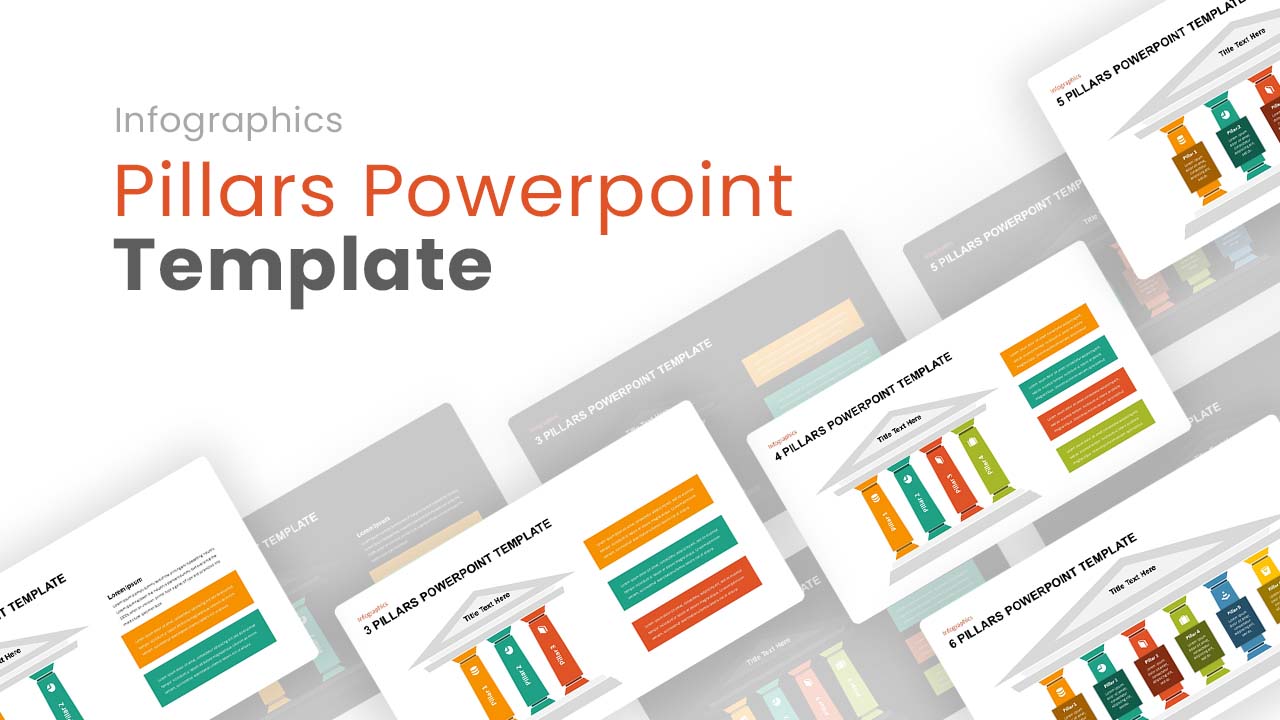
Editable Pillars Infographics Pack Template for PowerPoint & Google Slides
Infographics
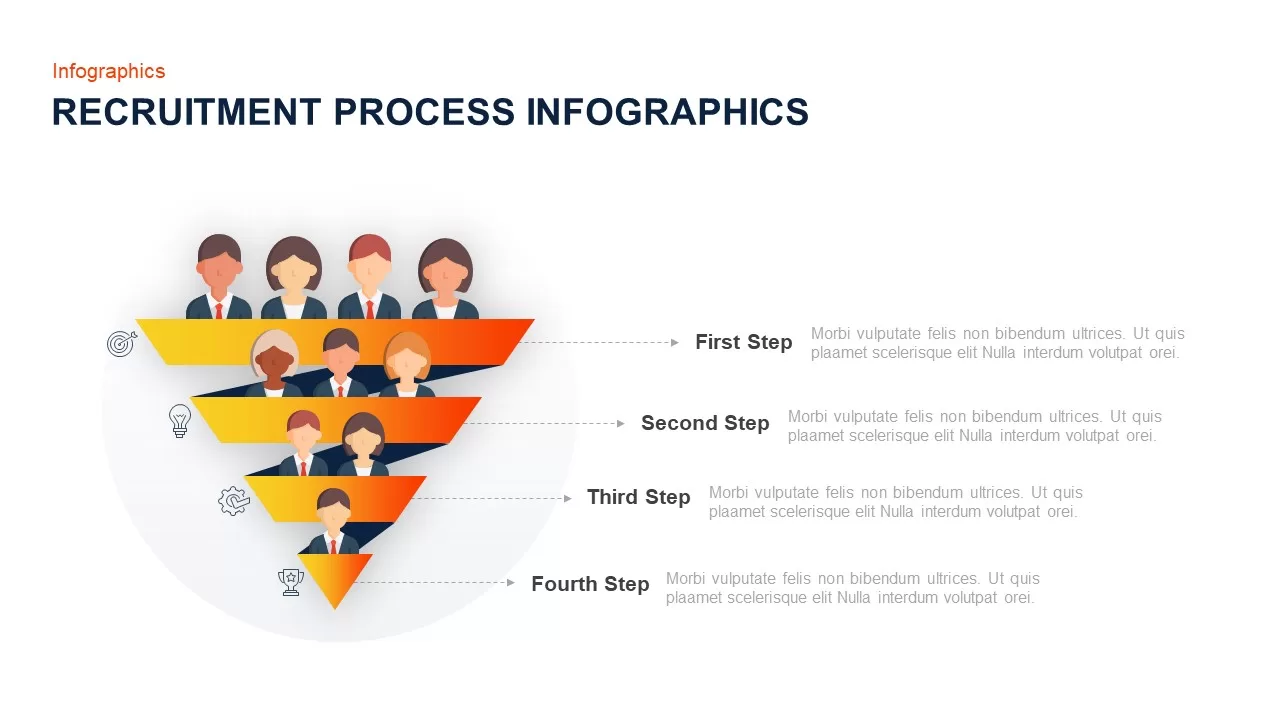
Recruitment Process Funnel Infographics Template for PowerPoint & Google Slides
Recruitment
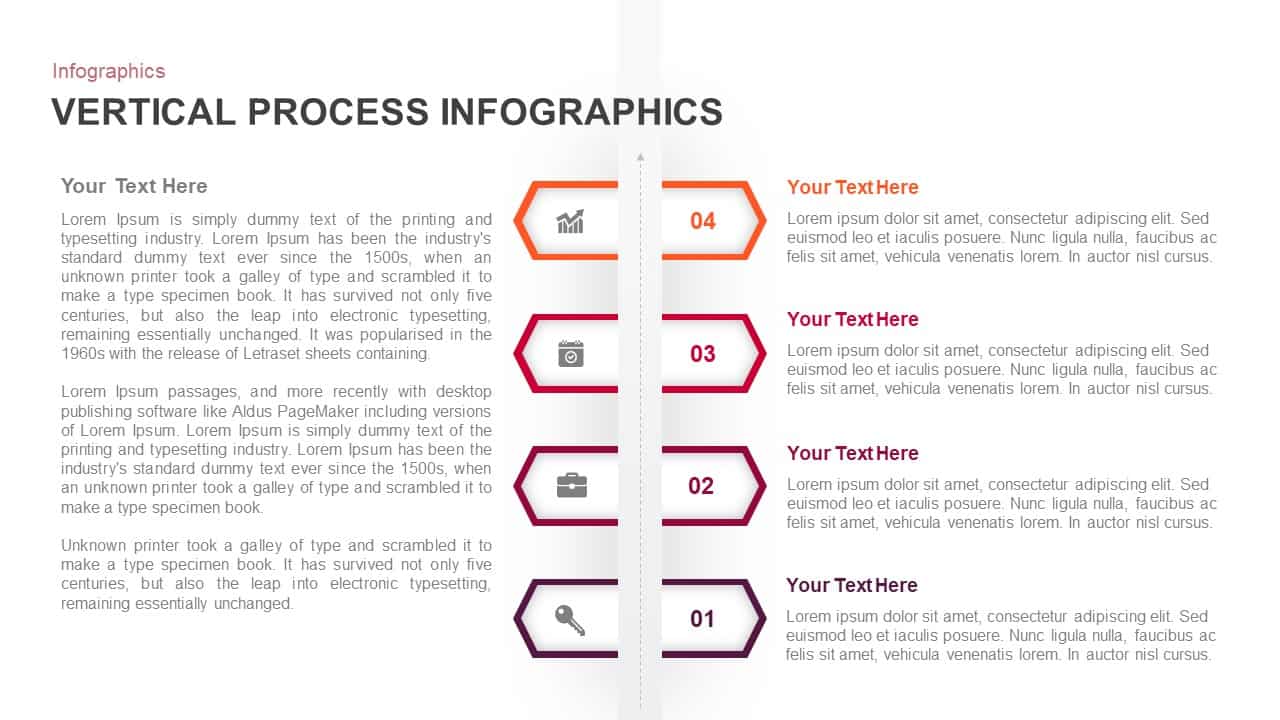
Vertical Process Infographics Template for PowerPoint & Google Slides
Process
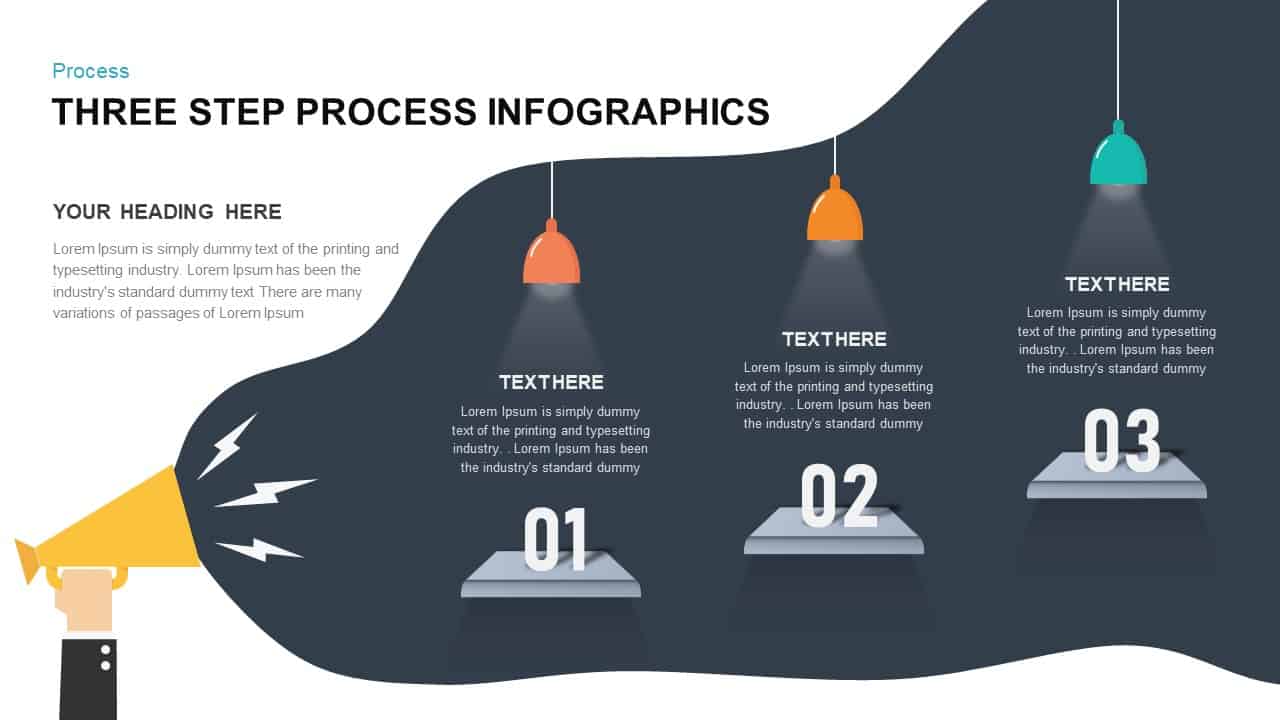
Three-Step Process Infographics Template for PowerPoint & Google Slides
Process
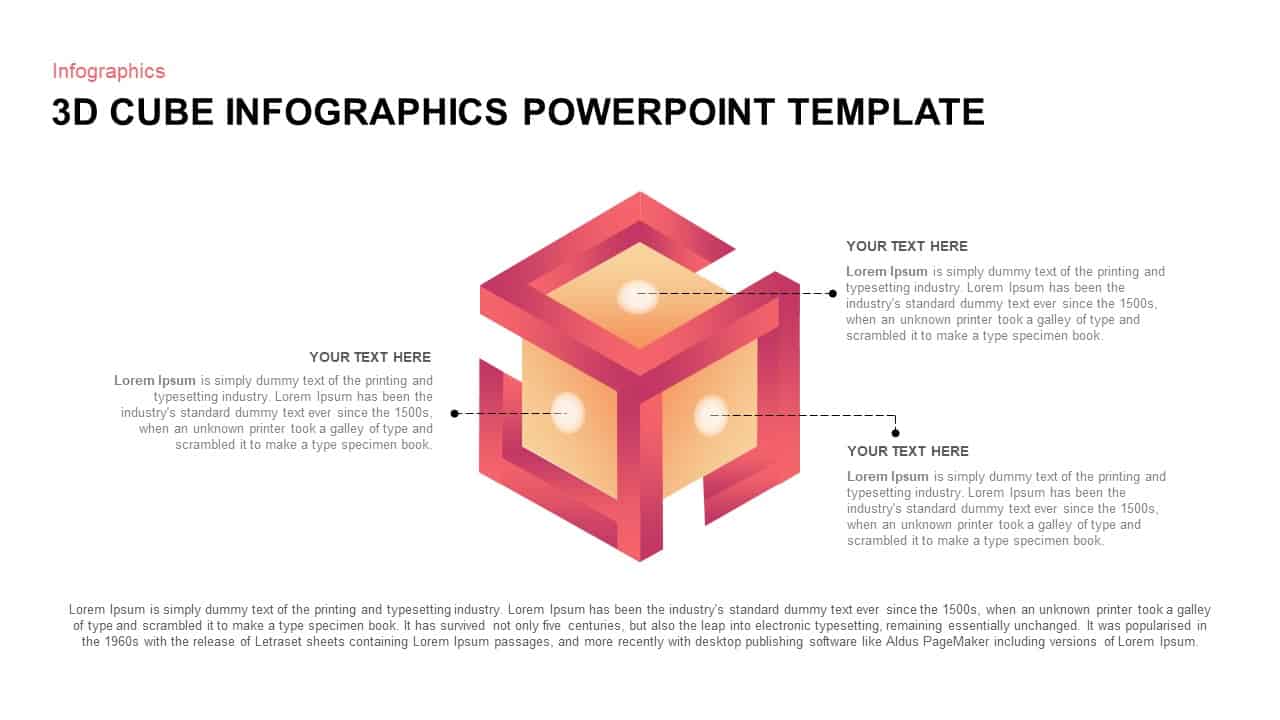
3D Cube Infographics template for PowerPoint & Google Slides
Process
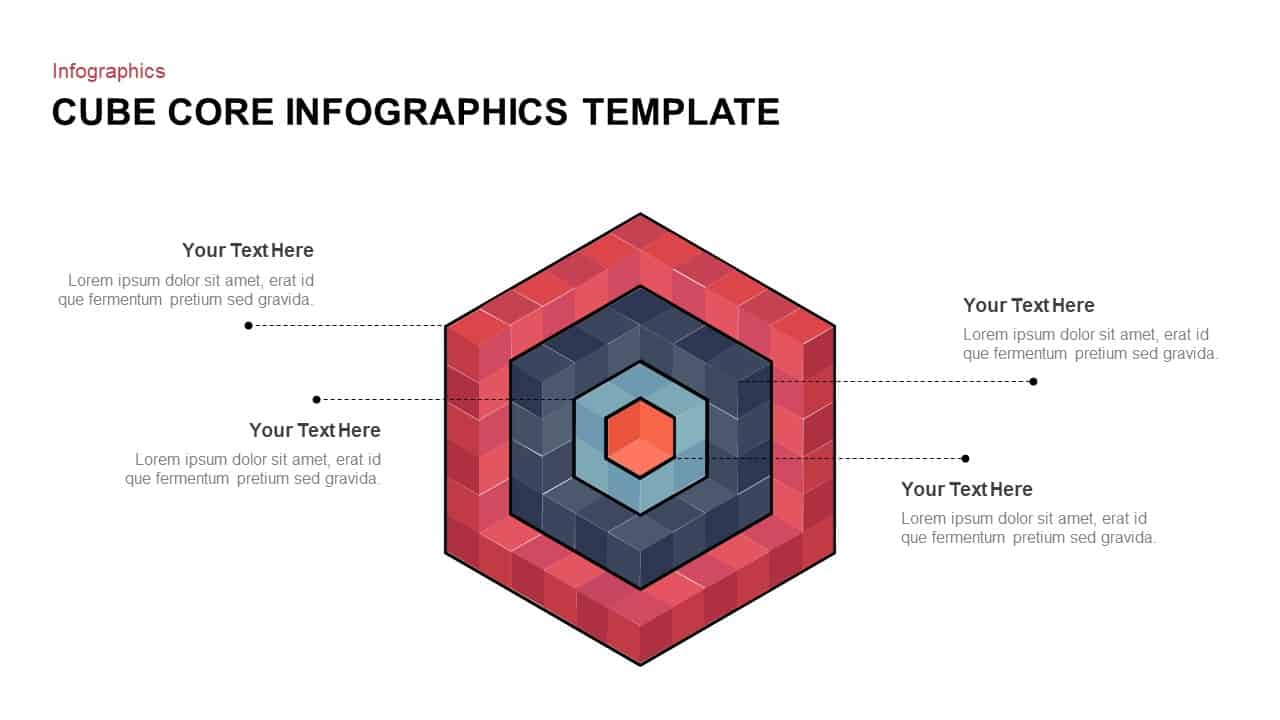
Cube Core Infographics Template for PowerPoint & Google Slides
Process
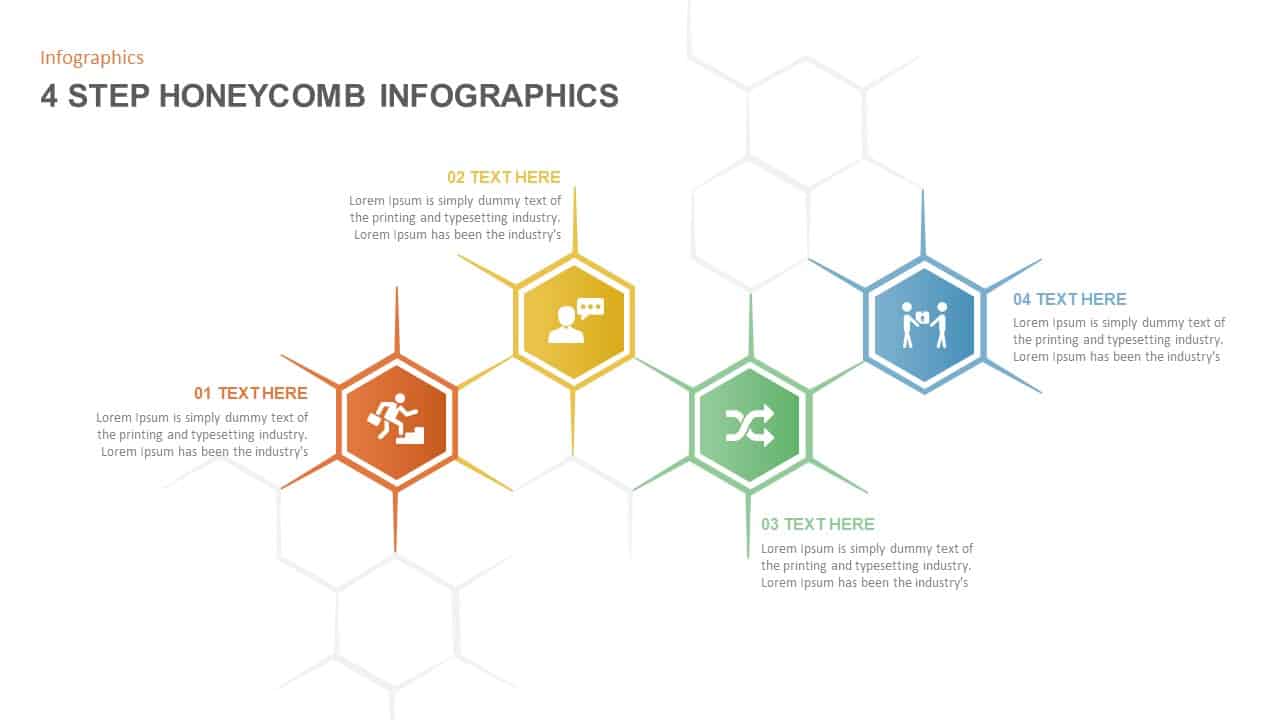
4 and 5 Step Honeycomb Infographics for PowerPoint & Google Slides
Process

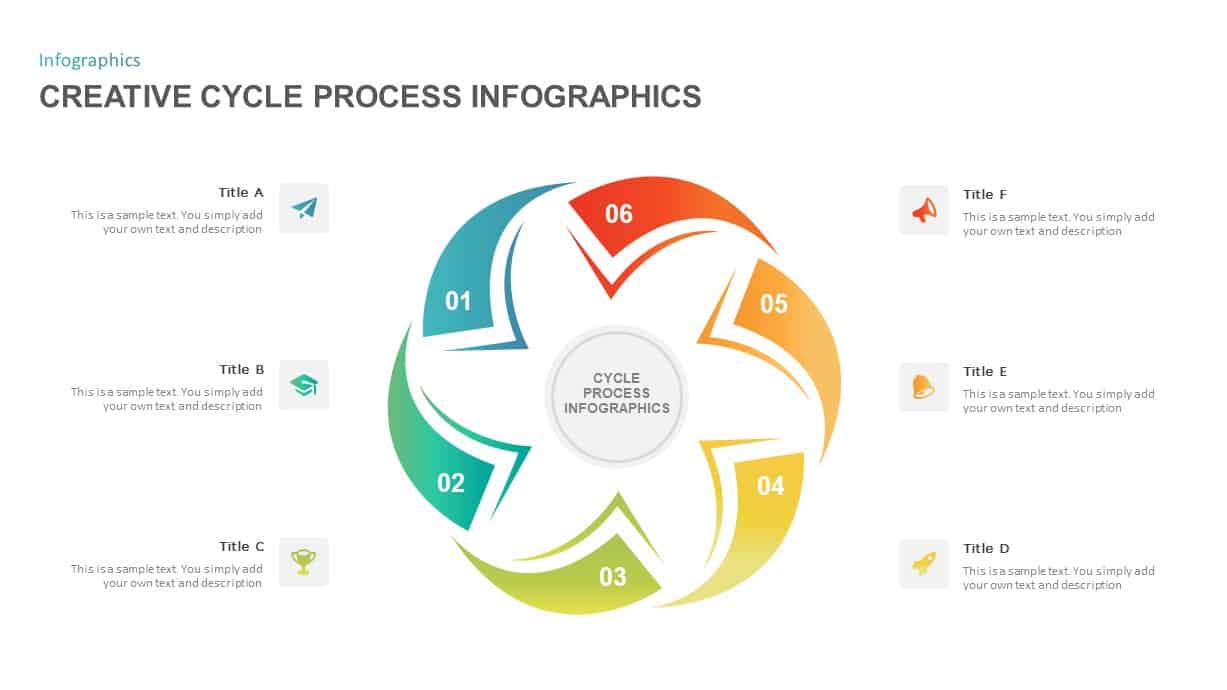
Creative Cycle Process Infographics Template for PowerPoint & Google Slides
Process
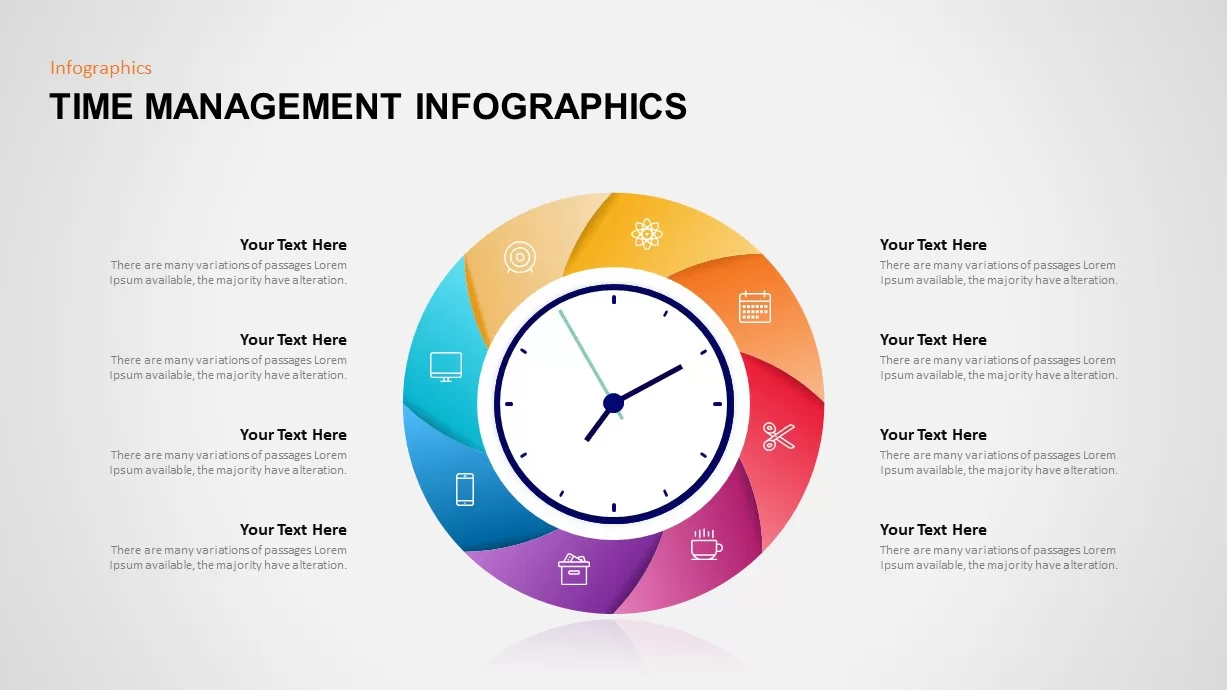
Time Management Infographics Template for PowerPoint & Google Slides
Process
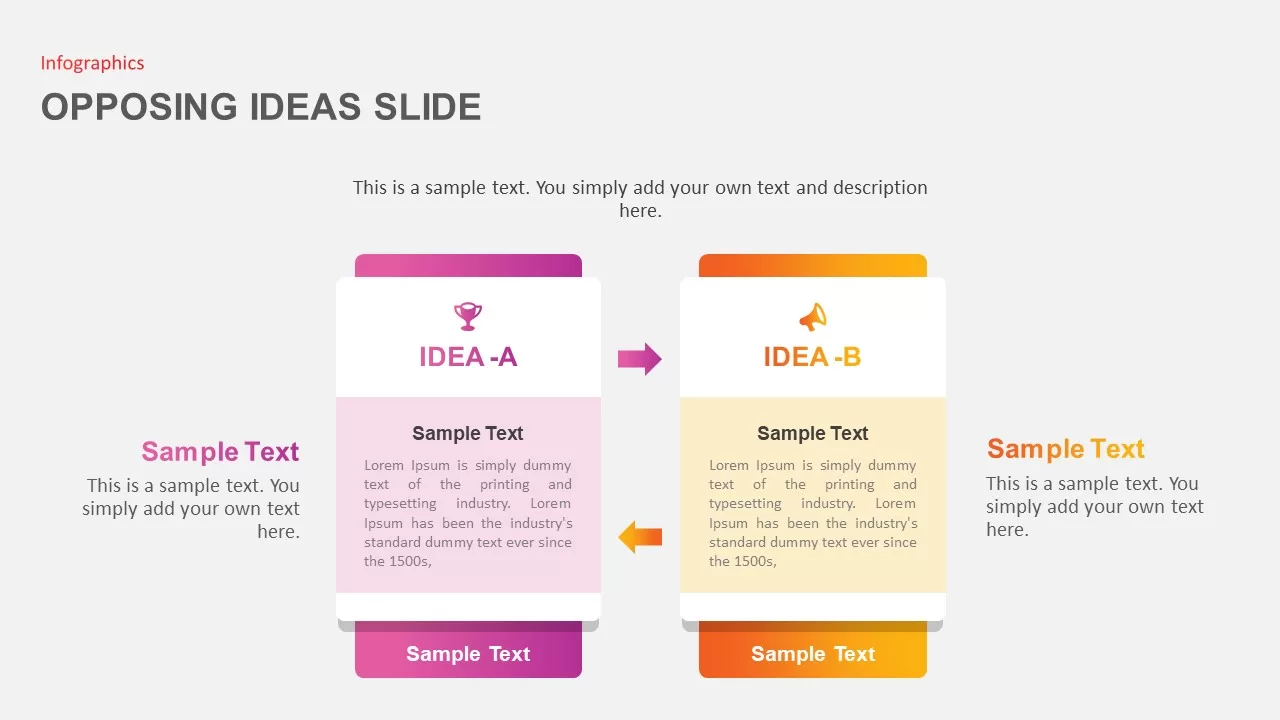
Opposing Ideas Infographics Pack Template for PowerPoint & Google Slides
Comparison
Medical Infographics Data Visualization Template for PowerPoint & Google Slides
Health
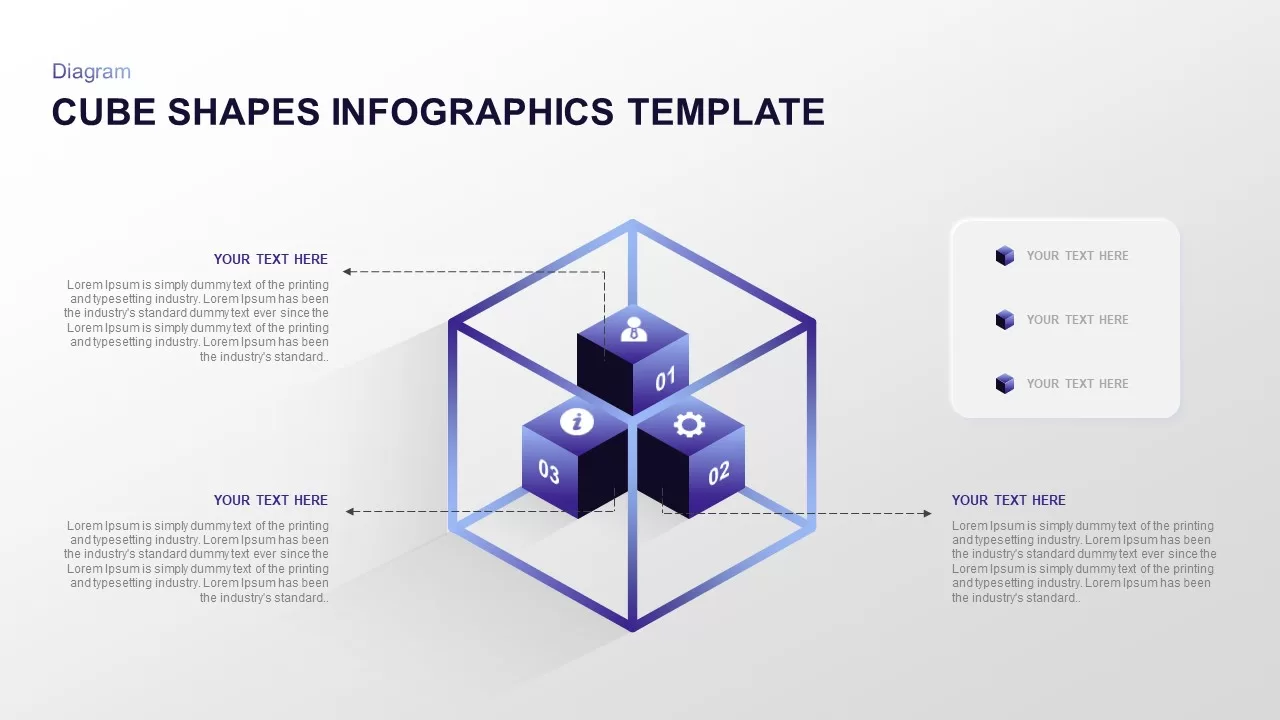
Isometric 3D Cube Shapes Infographics Template for PowerPoint & Google Slides
Infographics
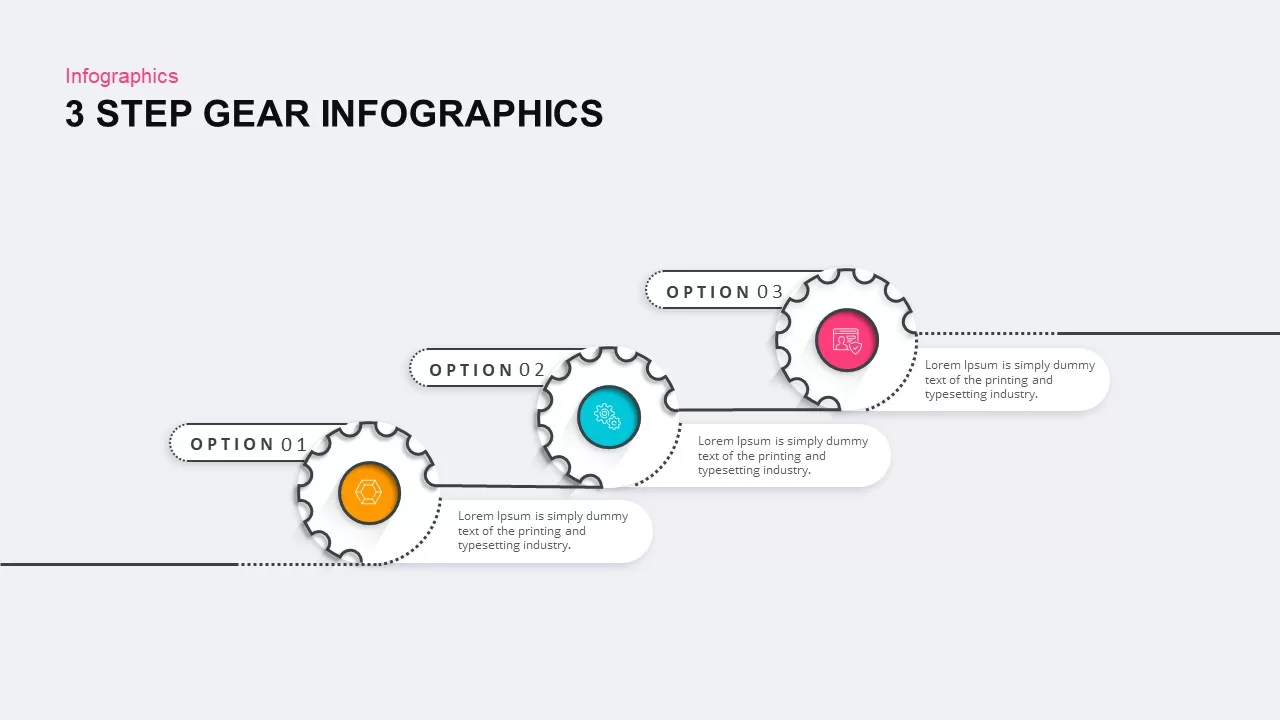
3, 4, and 5 Step Gear Infographics Template for PowerPoint & Google Slides
Process
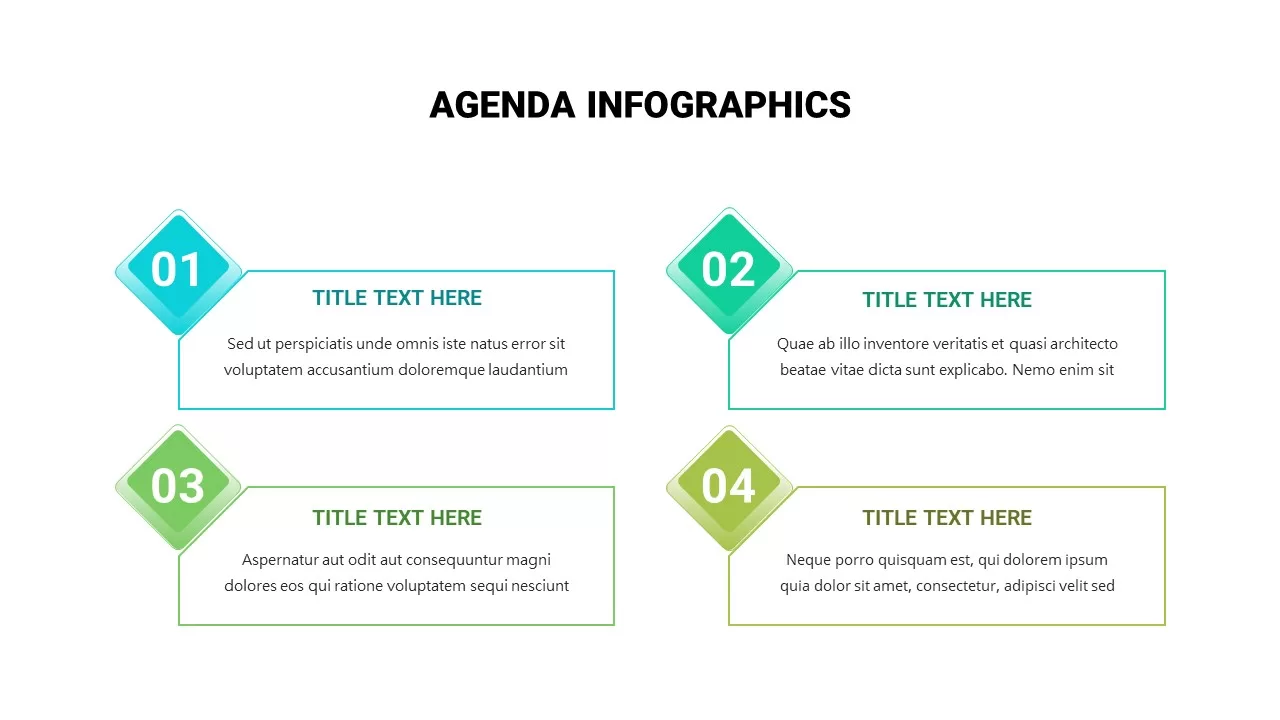
Agenda Infographics Diamond template for PowerPoint & Google Slides
Business Plan
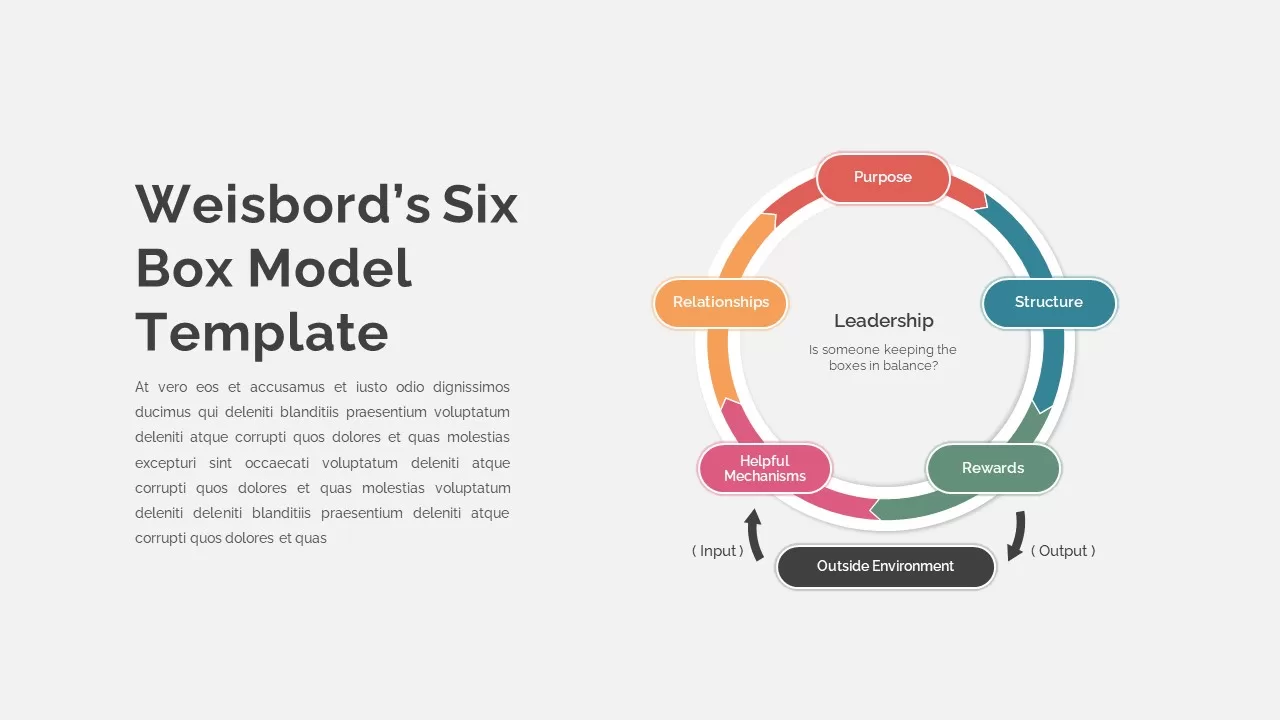
Weisbord’s Six Box Model Infographics Template for PowerPoint & Google Slides
Circular
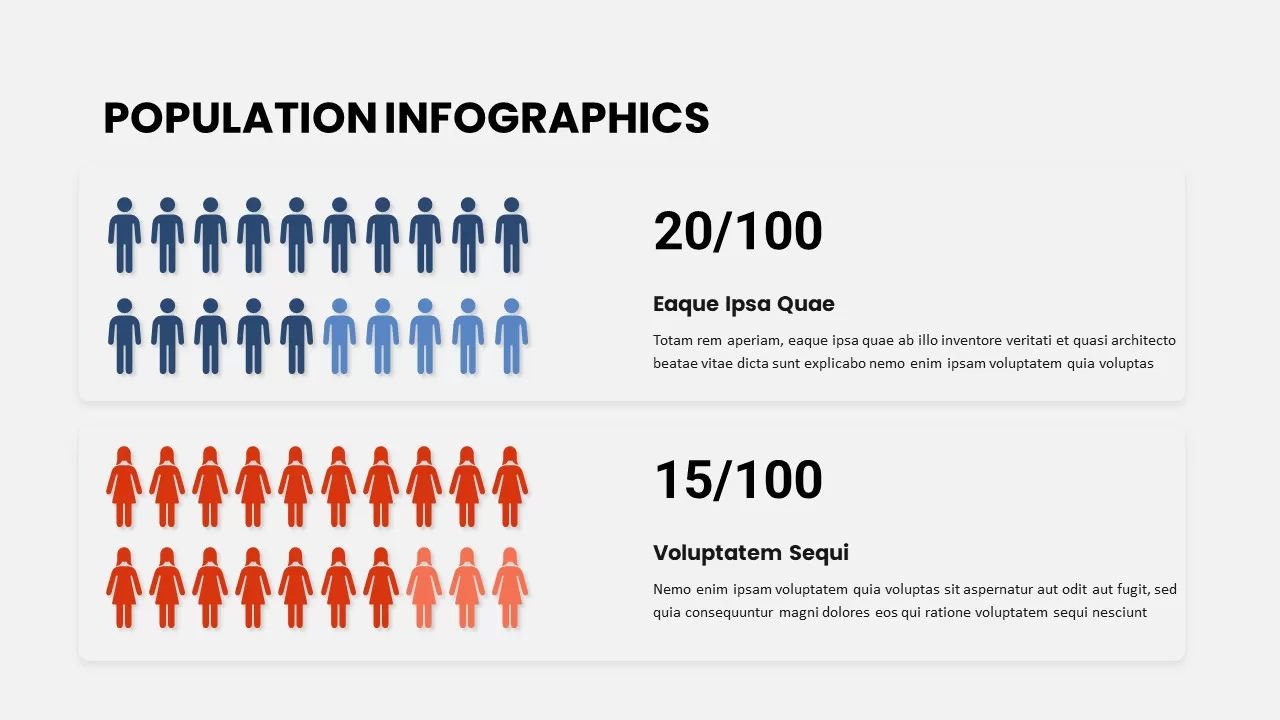
Population Infographics template for PowerPoint & Google Slides
Comparison
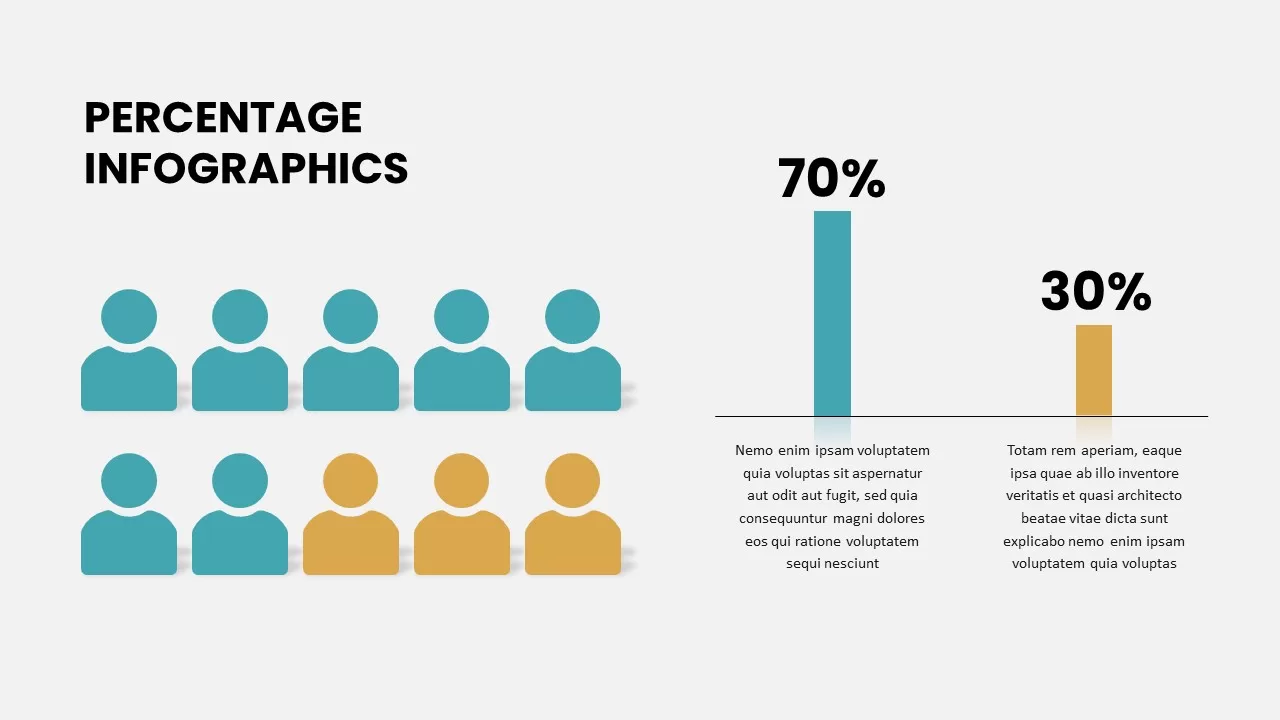
Free Percentage Infographics template for PowerPoint & Google Slides
Comparison
Free
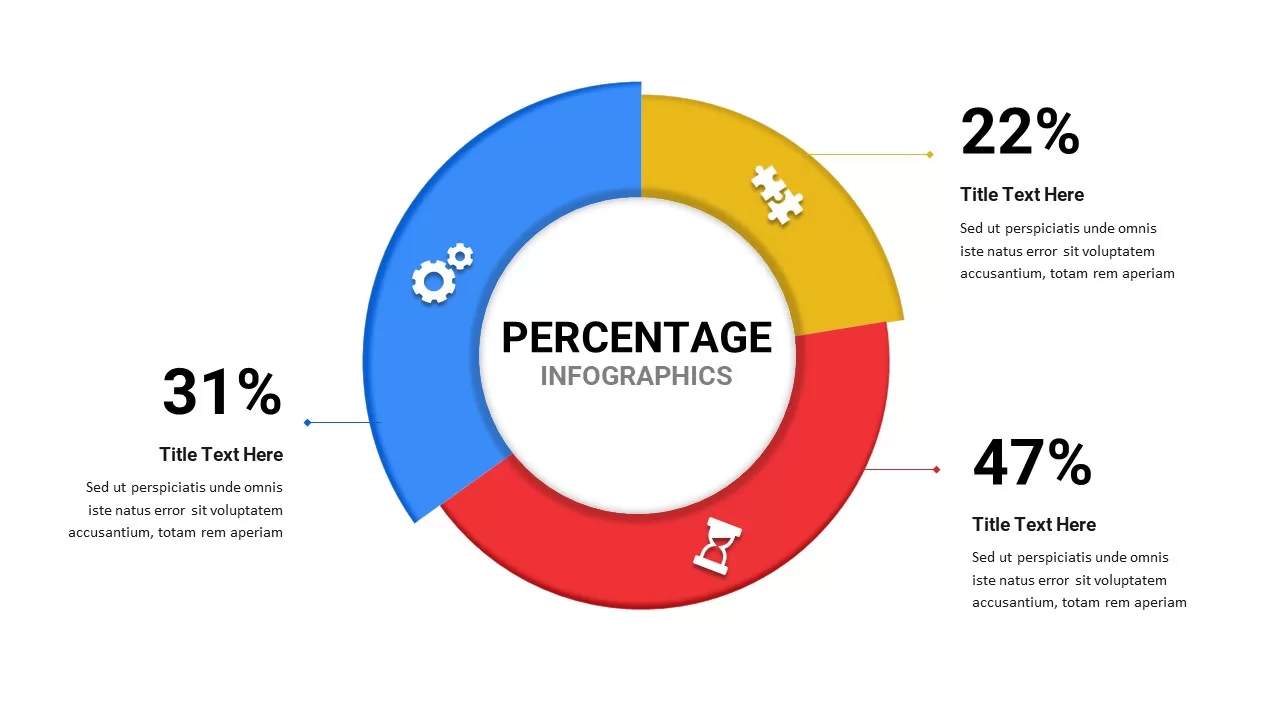
Percentage Infographics template for PowerPoint & Google Slides
Comparison
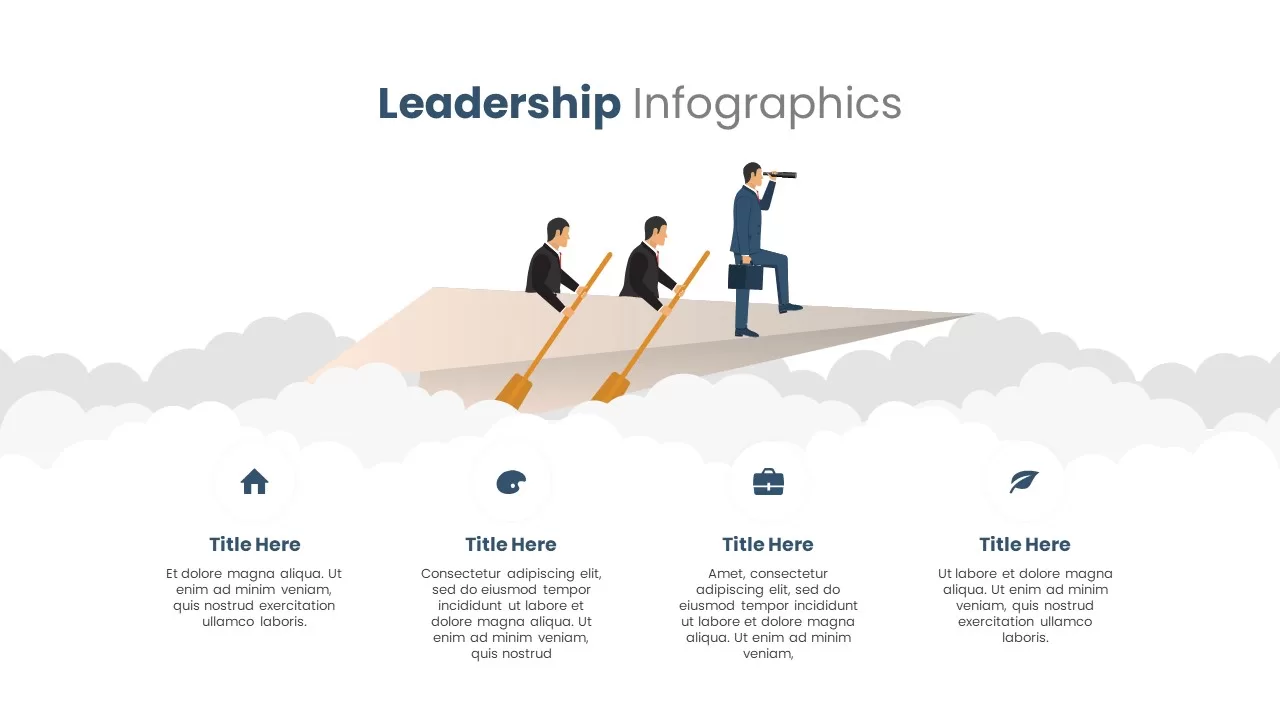
Versatile Leadership Infographics Template for PowerPoint & Google Slides
Infographics
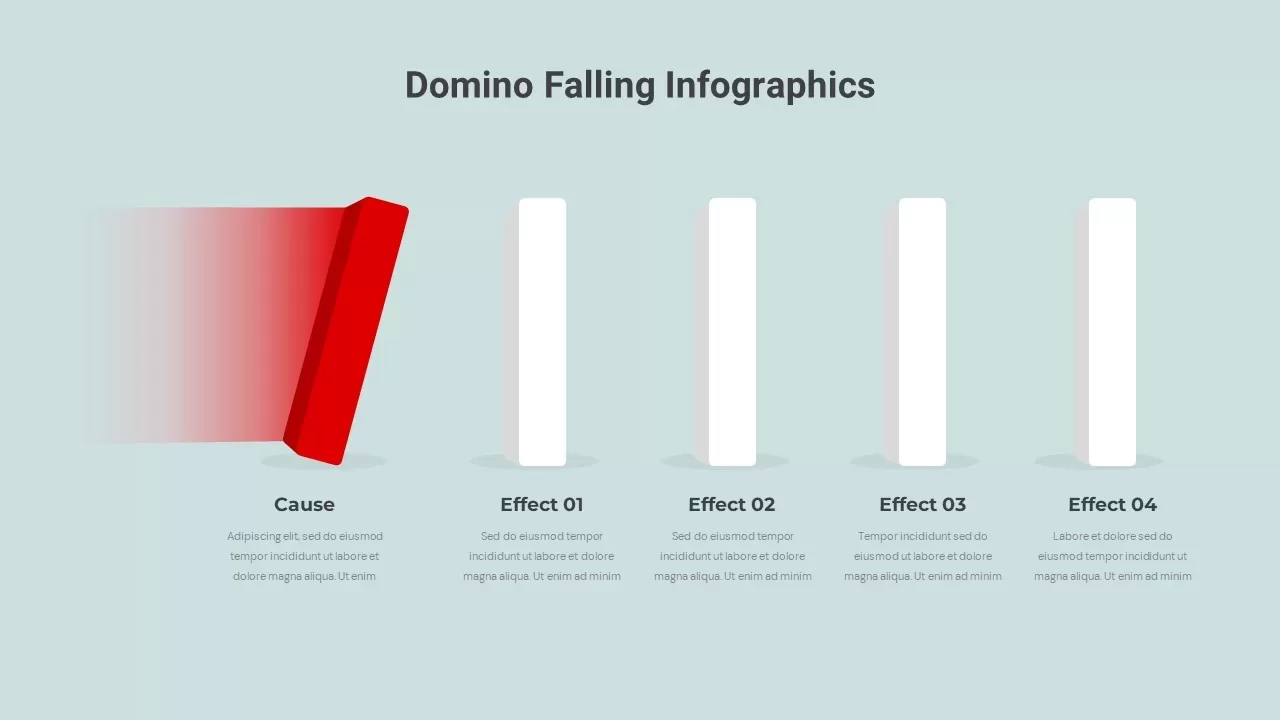
Domino Effect Sequential Infographics Template for PowerPoint & Google Slides
Process
Hiring Process Timeline Infographics Template for PowerPoint & Google Slides
Recruitment
Modern Social Media Infographics Template for PowerPoint & Google Slides
Digital Marketing
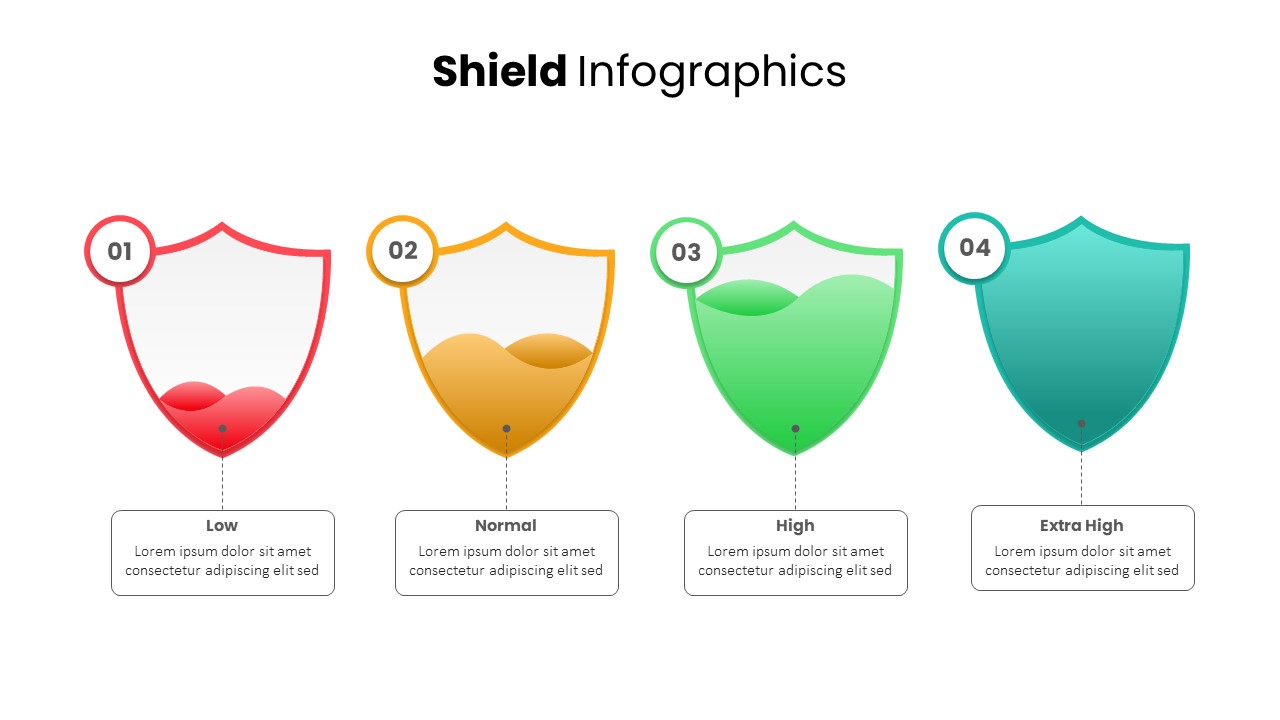
Shield Infographics Four-Part Framework Template for PowerPoint & Google Slides
Process
Three-Part Shield Infographics Template for PowerPoint & Google Slides
Comparison
Shield Infographics Risk Indicators Template for PowerPoint & Google Slides
Infographics

DevOps Infographics & Process Flow Template for PowerPoint & Google Slides
Information Technology
Surgery Infographics Comparison Template for PowerPoint & Google Slides
Health

Free Colorful Timeline Infographics Template for PowerPoint & Google Slides
Timeline
Free
Banking Service & Finance Infographics Template for PowerPoint & Google Slides
Finance
Free
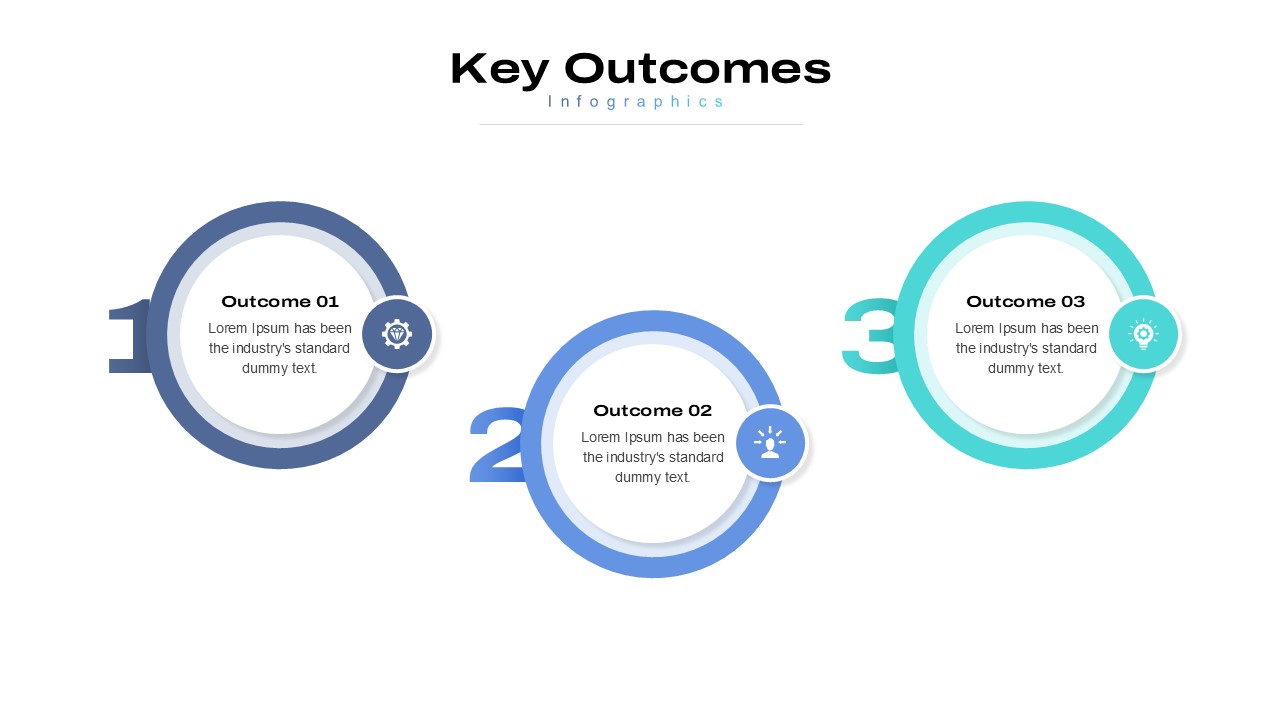
5 Styles Key Outcomes Infographics Pack Template for PowerPoint & Google Slides
Infographics
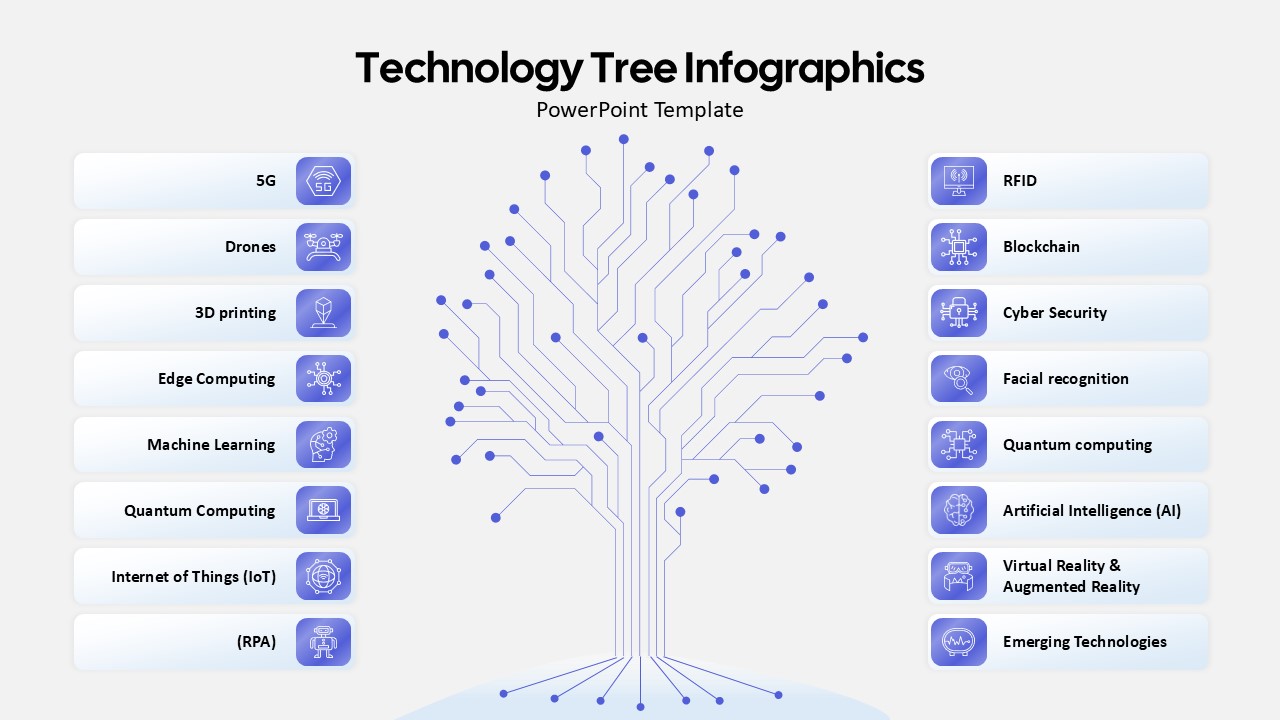
Technology Tree Infographics Template for PowerPoint & Google Slides
AI
Mental Health Infographics Template for PowerPoint & Google Slides
Health