70-20-10 Learning Approach Infographic Template for PowerPoint & Google Slides


Description
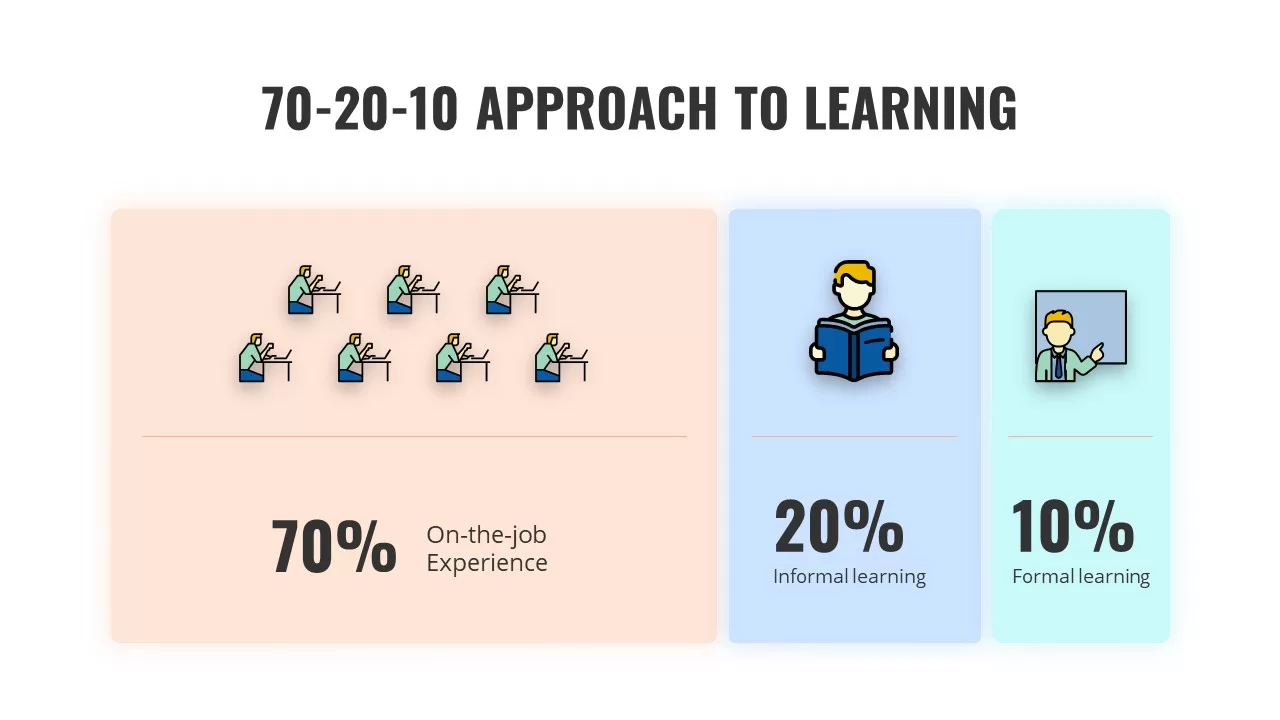
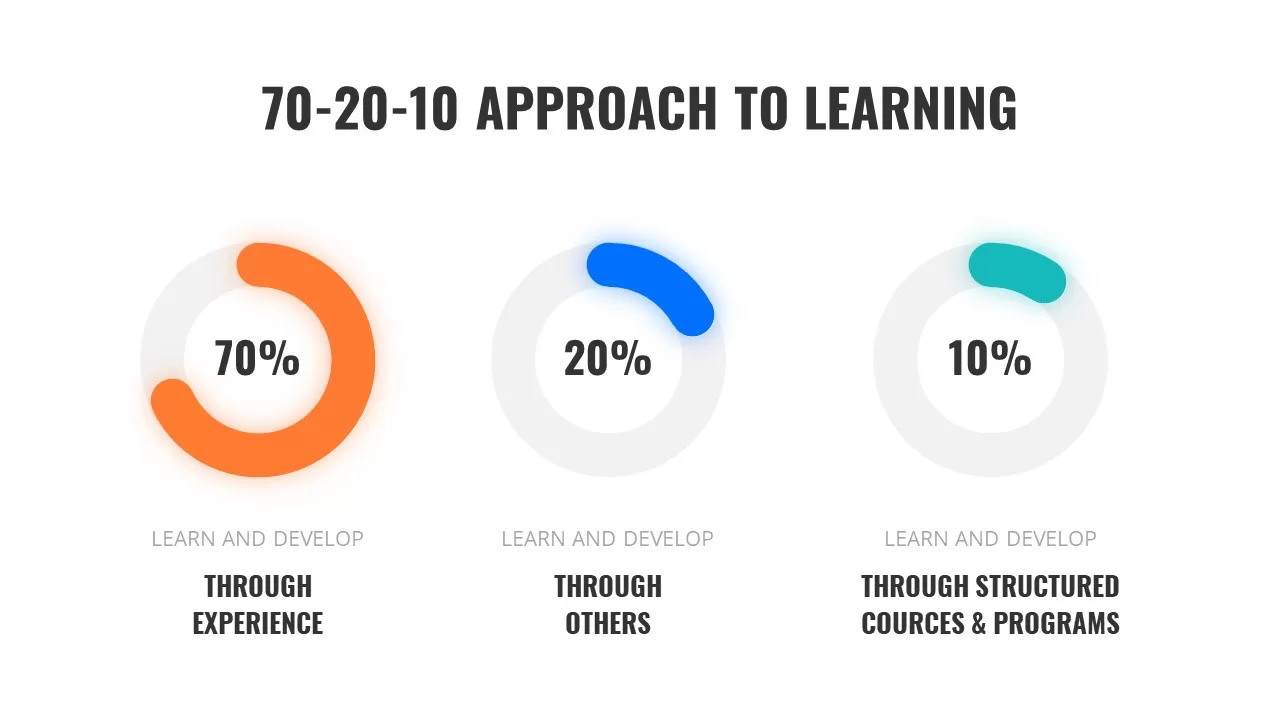
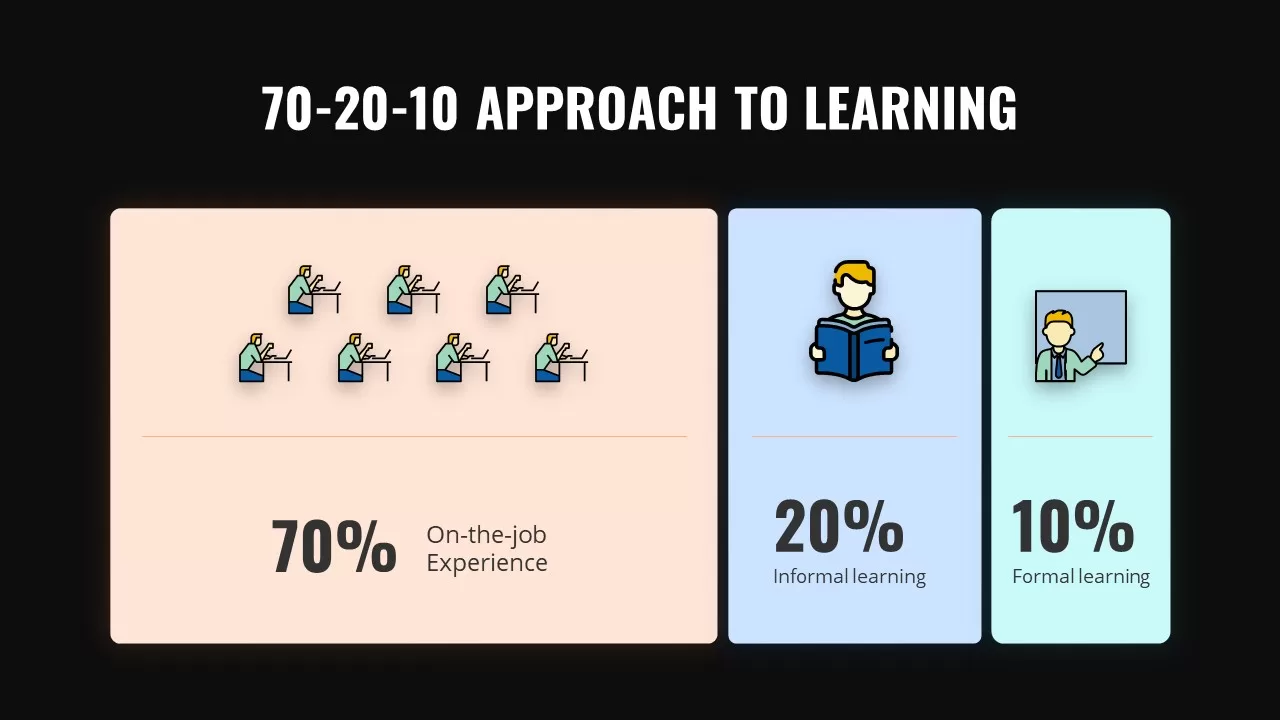
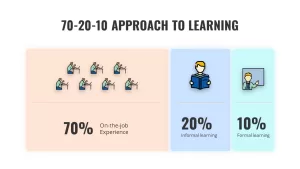
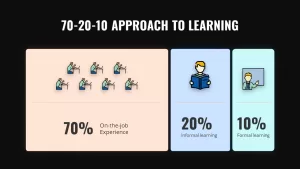
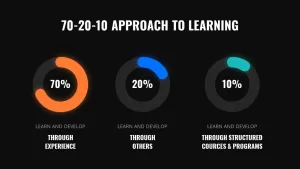
This five-slide infographic pack brings the 70-20-10 learning model to life with dynamic, fully editable layouts. The opening slide features three side-by-side panels—large “70% On-the-Job Experience” with repeated desk-work icons, “20% Informal Learning” with a reading icon, and “10% Formal Learning” with a classroom icon—framed by soft pastel backgrounds and a bold headline. The second slide transforms these ratios into three circular progress charts, each in vibrant orange, blue and teal, paired with concise subheads (“Through Experience,” “Through Others,” “Through Structured Courses & Programs”).
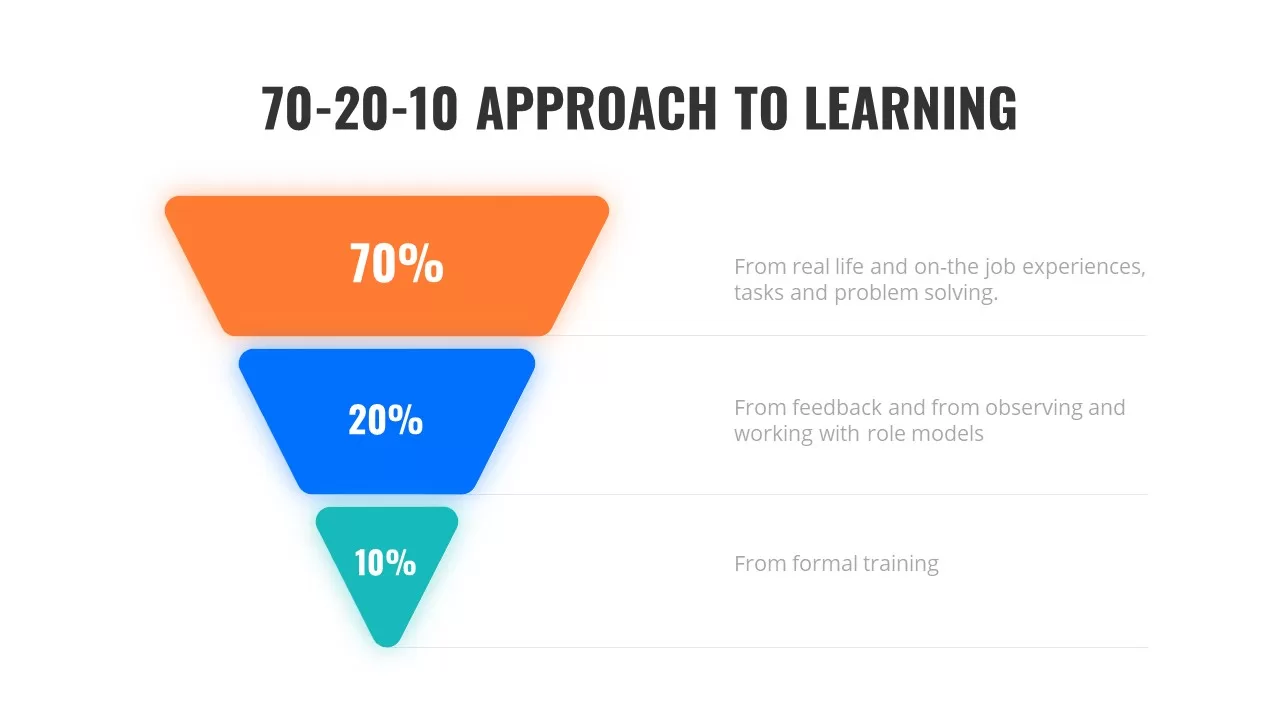
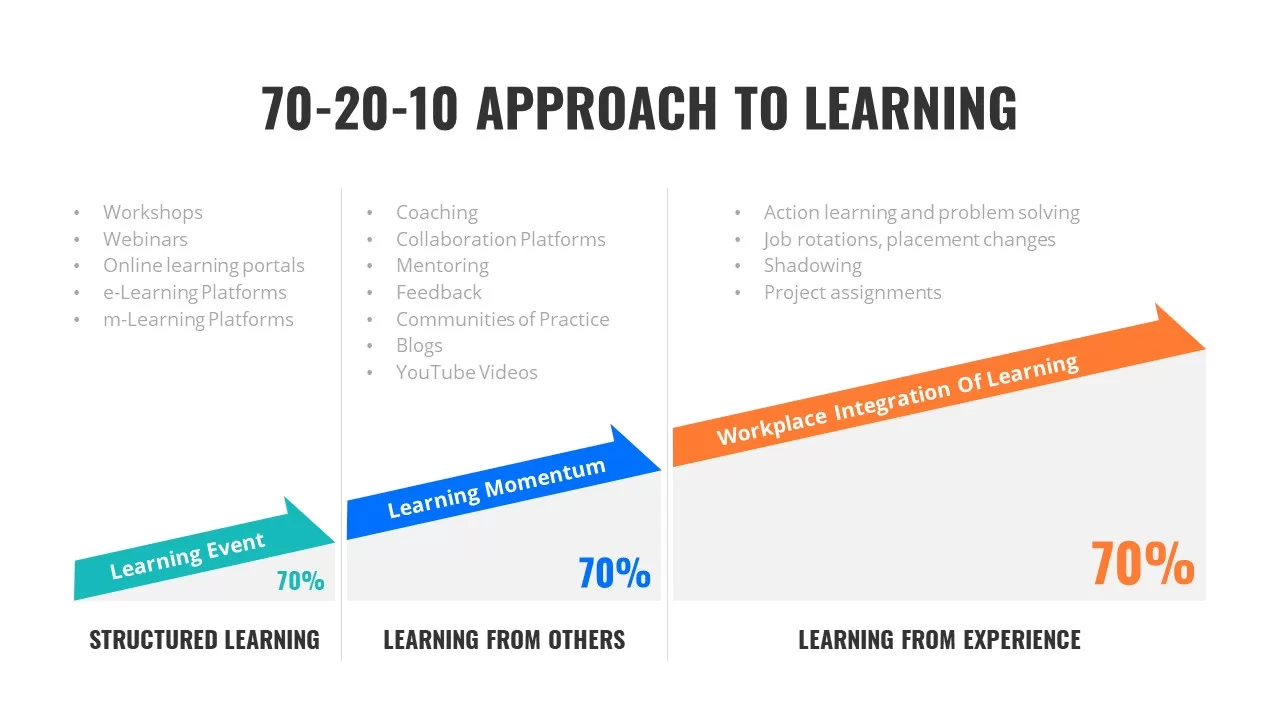
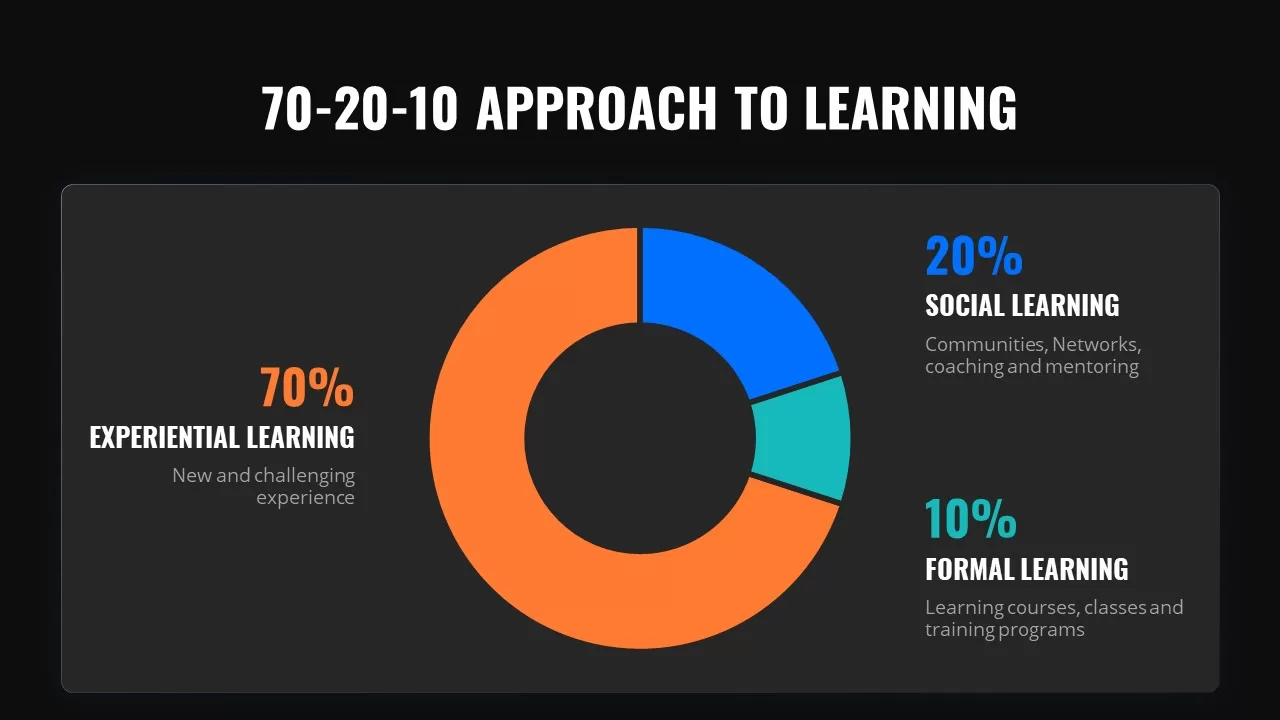
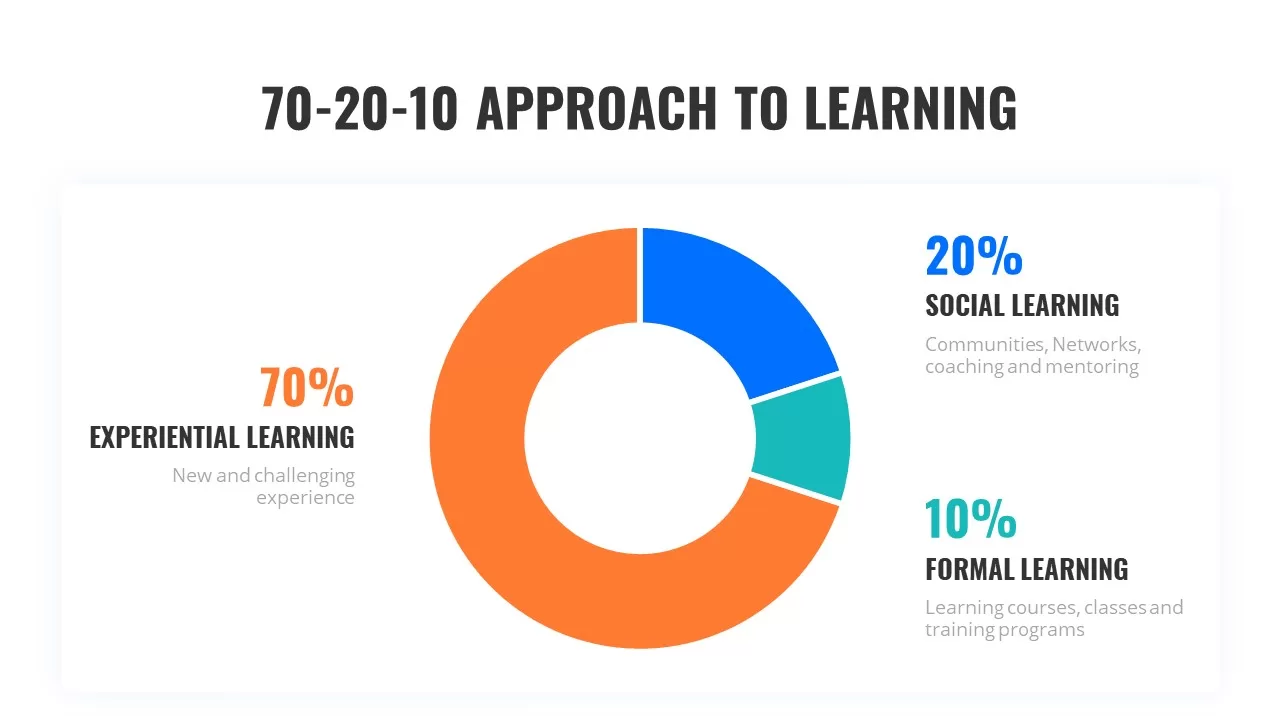
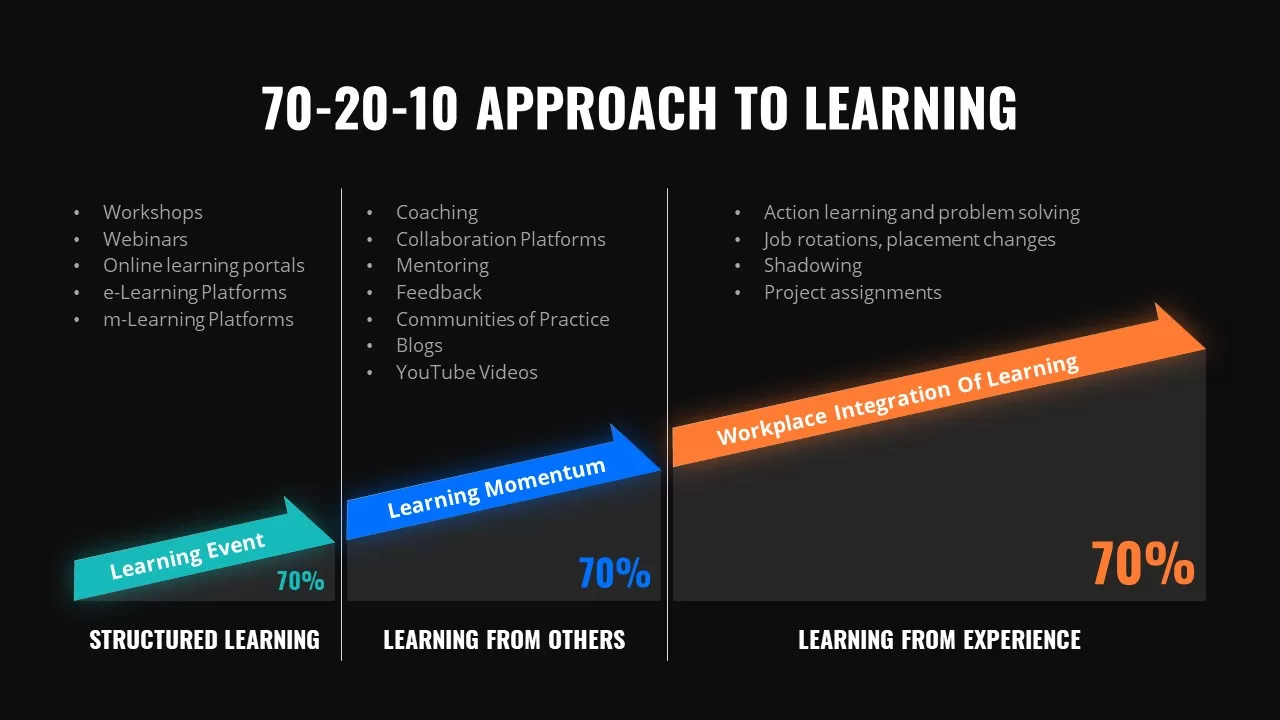
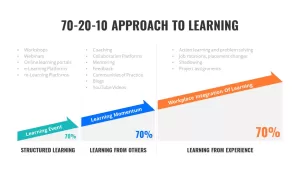
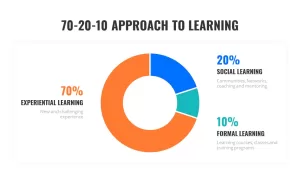
A third layout reimagines the model as an inverted funnel, with descending shapes sized proportionally and labeled with percentages on the left and explanatory text on the right. The fourth slide offers a three-column breakdown of example activities—online workshops, coaching methods and action-learning tasks—topped by angled arrows labeled “Structured Learning,” “Learning from Others” and “Learning from Experience.” Finally, the fifth slide presents a donut chart that visually segments 70%, 20% and 10% rings, with “Experiential,” “Social” and “Formal” learning callouts on either side.
All slides are built on master templates with vector shapes, ensuring you can swap icons, adjust colors, update labels or resize charts in seconds without disturbing alignment. Gradients, drop shadows and generous white space deliver a modern, polished look. Use these slides to step audiences through each dimension of the 70-20-10 framework—sequentially reveal segments, animate progress rings or highlight specific funnel sections—streamlining training sessions, leadership presentations and L&D workshops.
Who is it for
Learning & development professionals, corporate trainers, HR leaders and instructional designers will leverage these infographics to introduce blended learning strategies, corporate coaching programs and skill-development roadmaps.
Other Uses
Beyond the 70-20-10 model, repurpose these layouts for any proportional breakdown—such as budget allocations, resource distributions or performance metrics—by relabeling segments and adjusting percentages.
Login to download this file

Item ID
SB01705
Related Templates

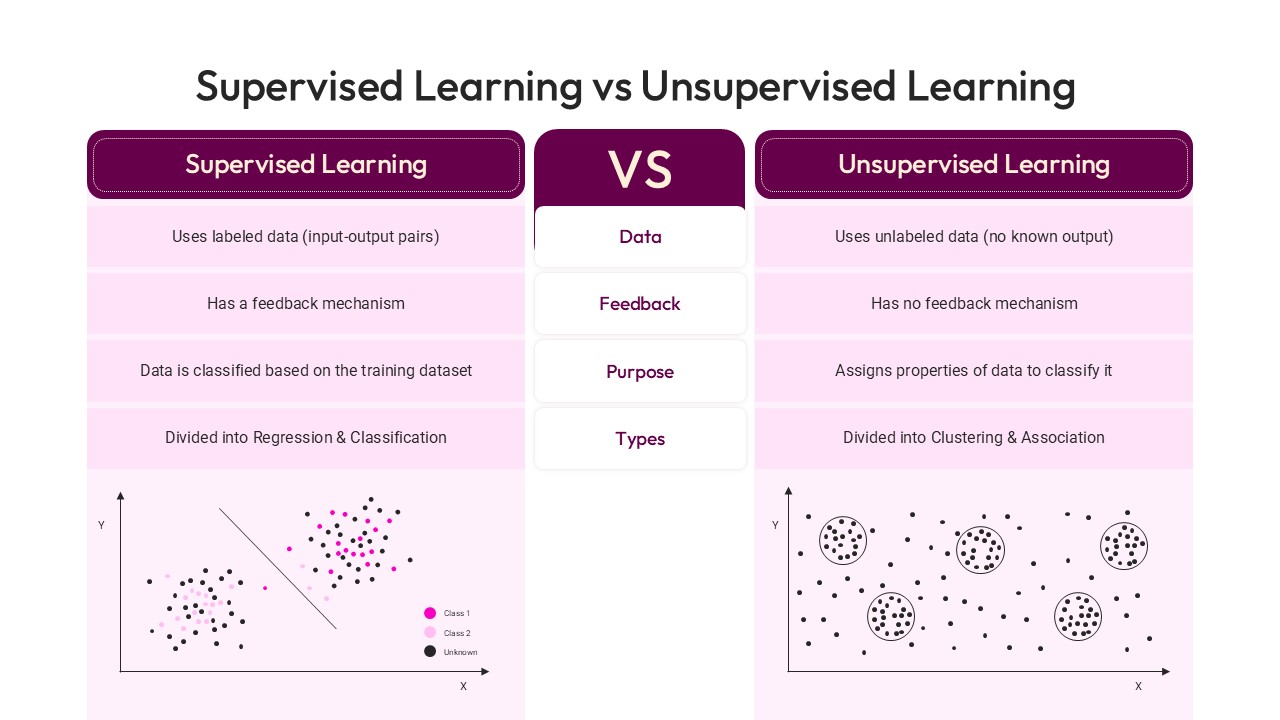
Supervised Learning vs Unsupervised Learning template for PowerPoint & Google Slides
Technology
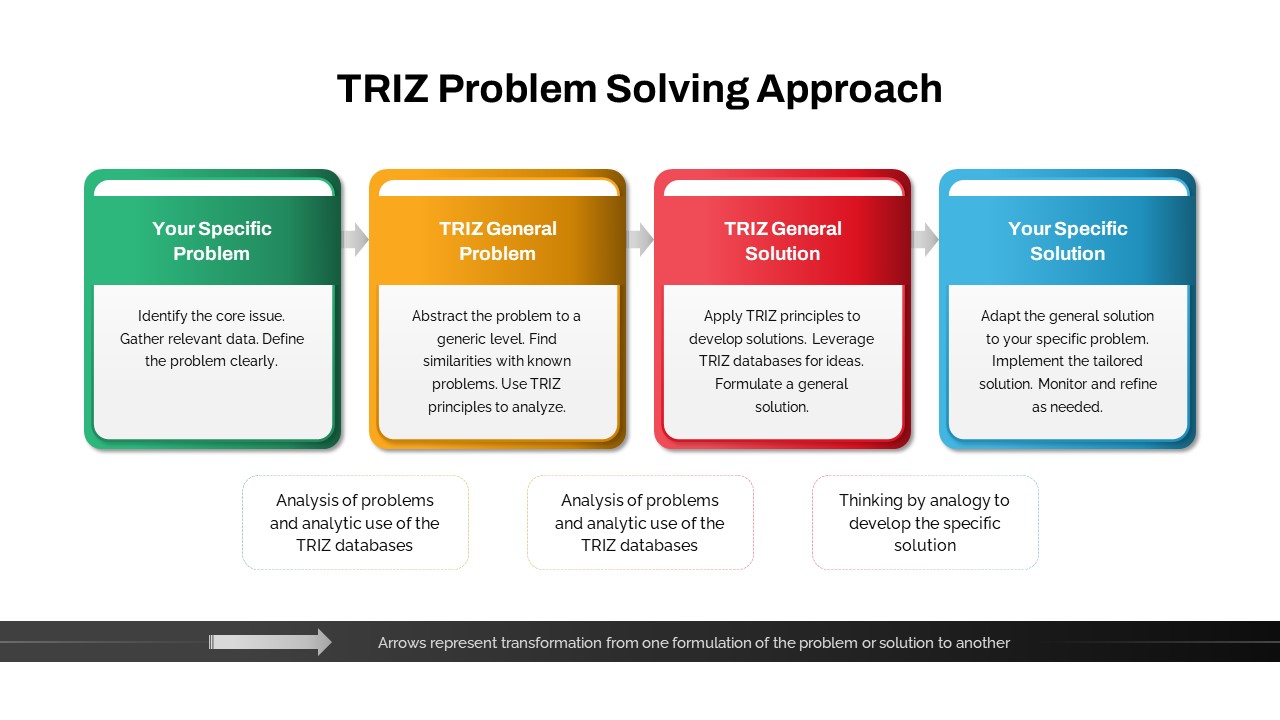
TRIZ Four-Stage Problem Solving Approach Template for PowerPoint & Google Slides
Process
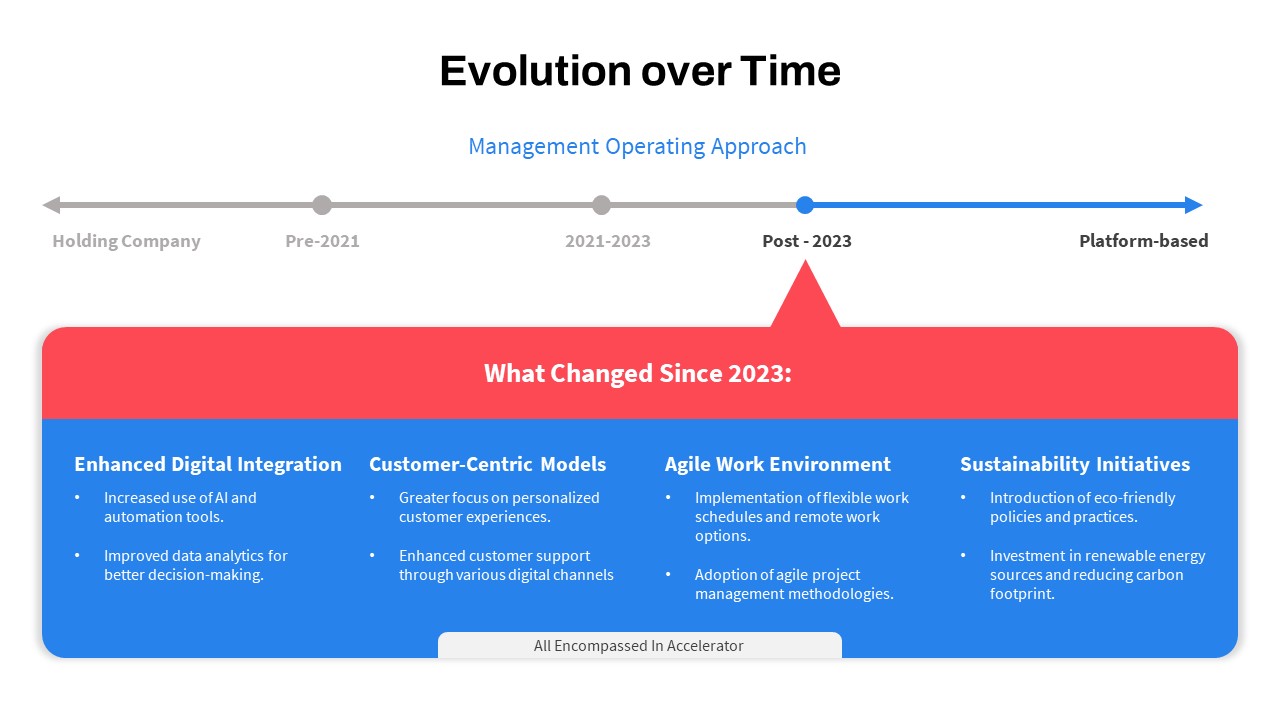
Operating Approach Evolution Timeline Template for PowerPoint & Google Slides
Timeline
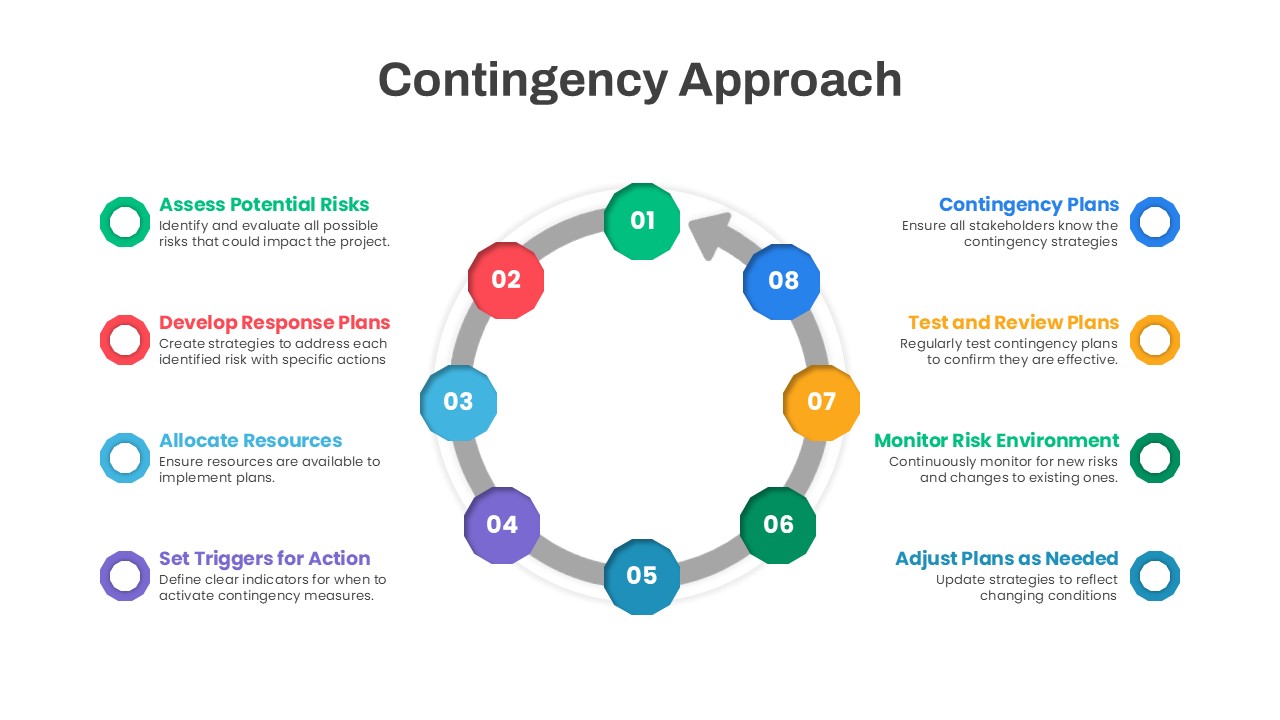
Contingency Approach for PowerPoint & Google Slides
Business
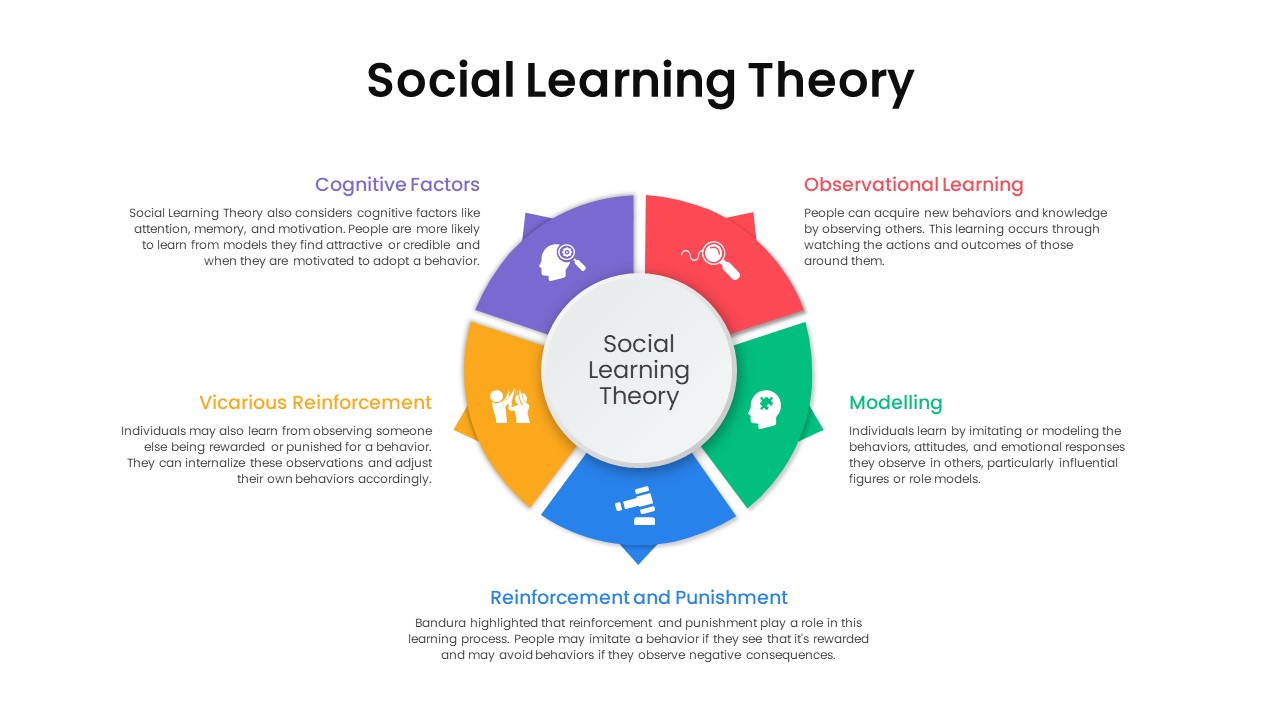
Social Learning Theory Infographic Template for PowerPoint & Google Slides
Circular
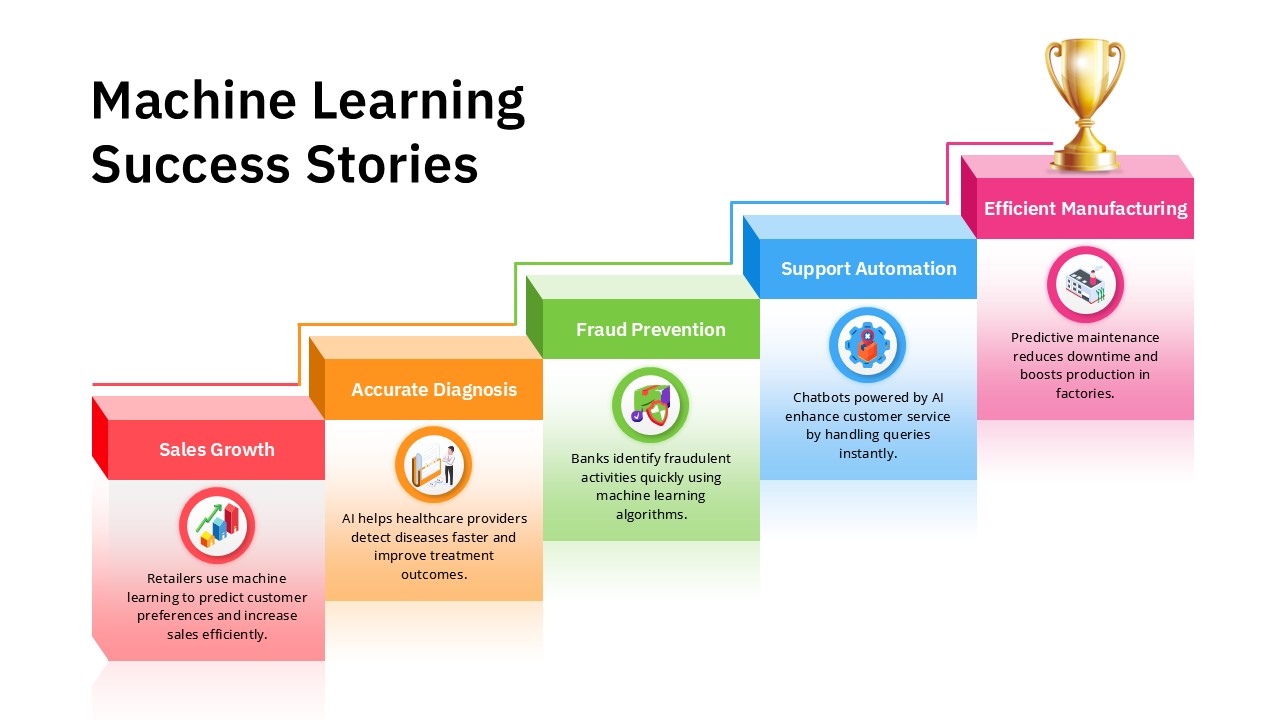
Machine Learning Success Stories Infographic Template for PowerPoint & Google Slides
Process
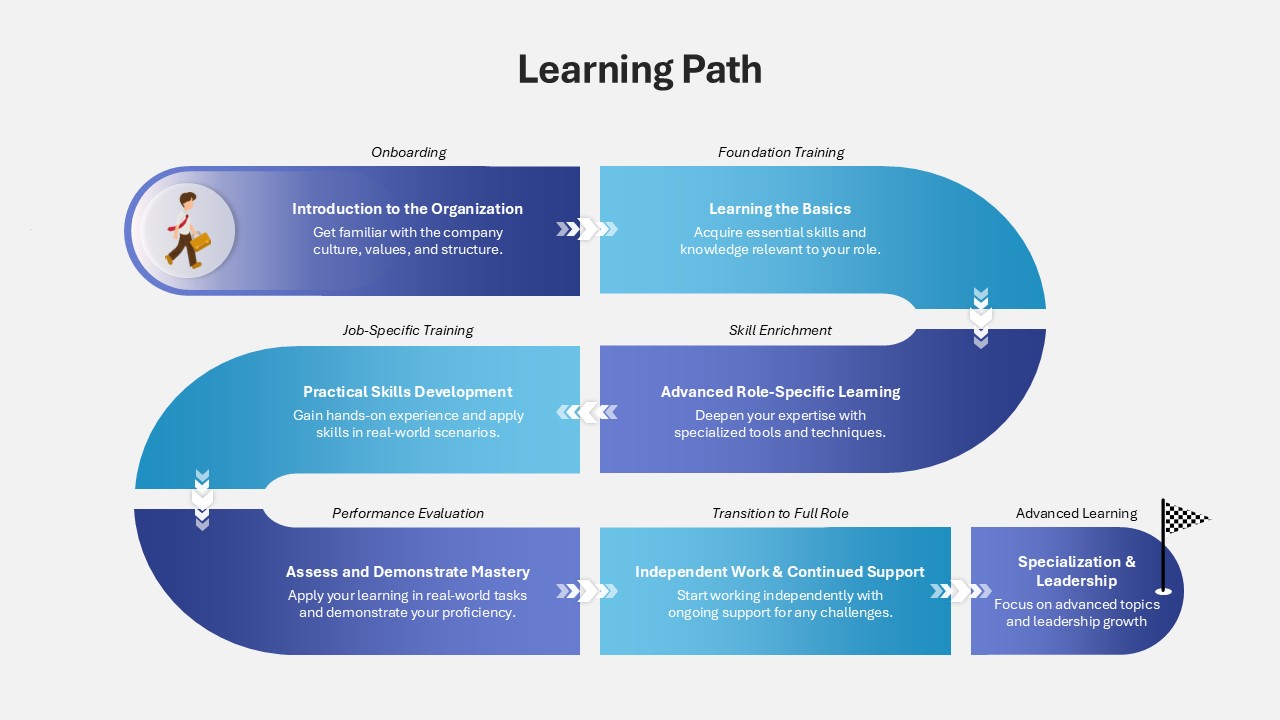
Learning Path Infographic Template for PowerPoint & Google Slides
Process
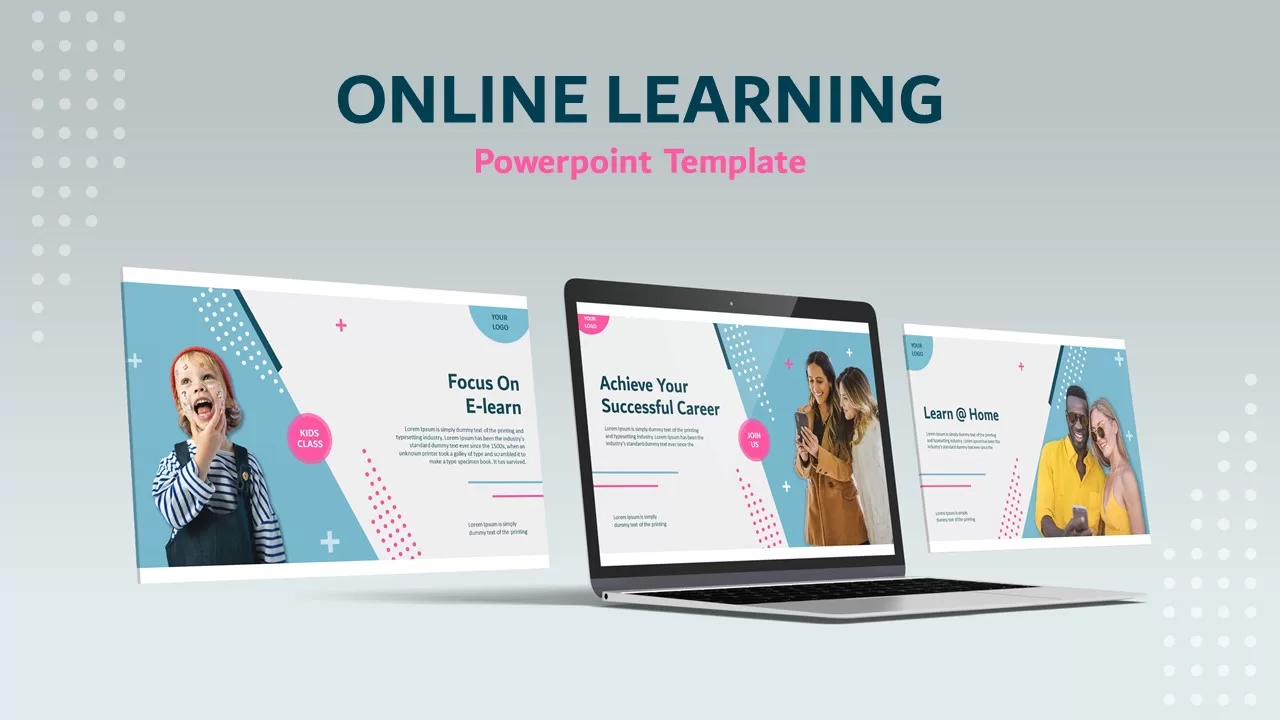
Online Learning PowerPoint Template for PowerPoint & Google Slides
Customer Journey
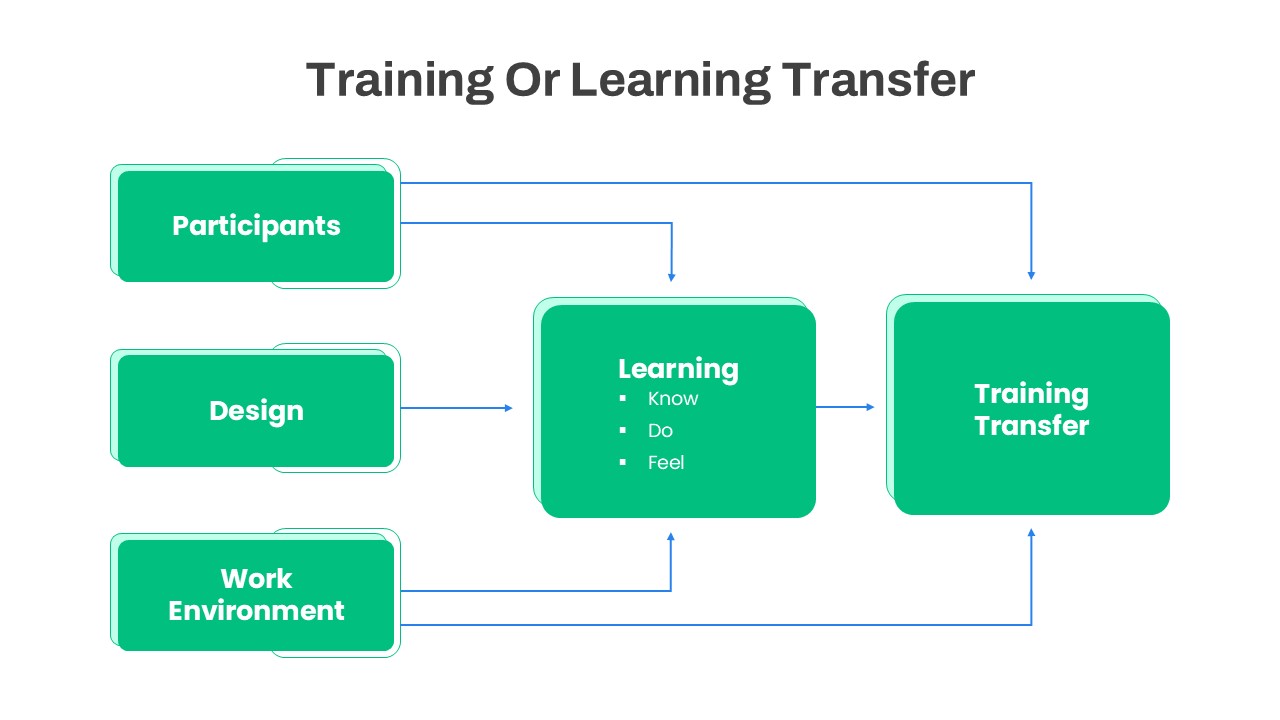
Training or Learning Transfer PowerPoint Template for PowerPoint & Google Slides
Business Proposal
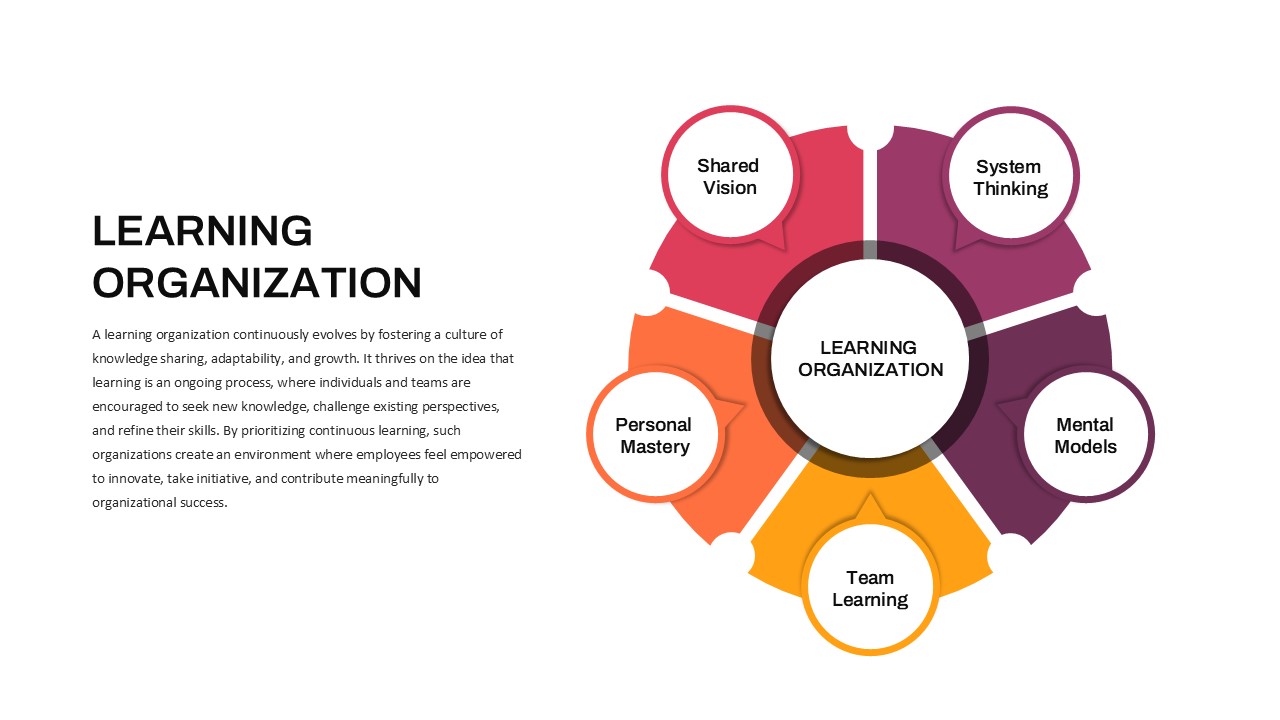
Learning Organization PowerPoint Template for PowerPoint & Google Slides
Business Strategy
E-Learning Report Analysis Template for PowerPoint & Google Slides
Infographics
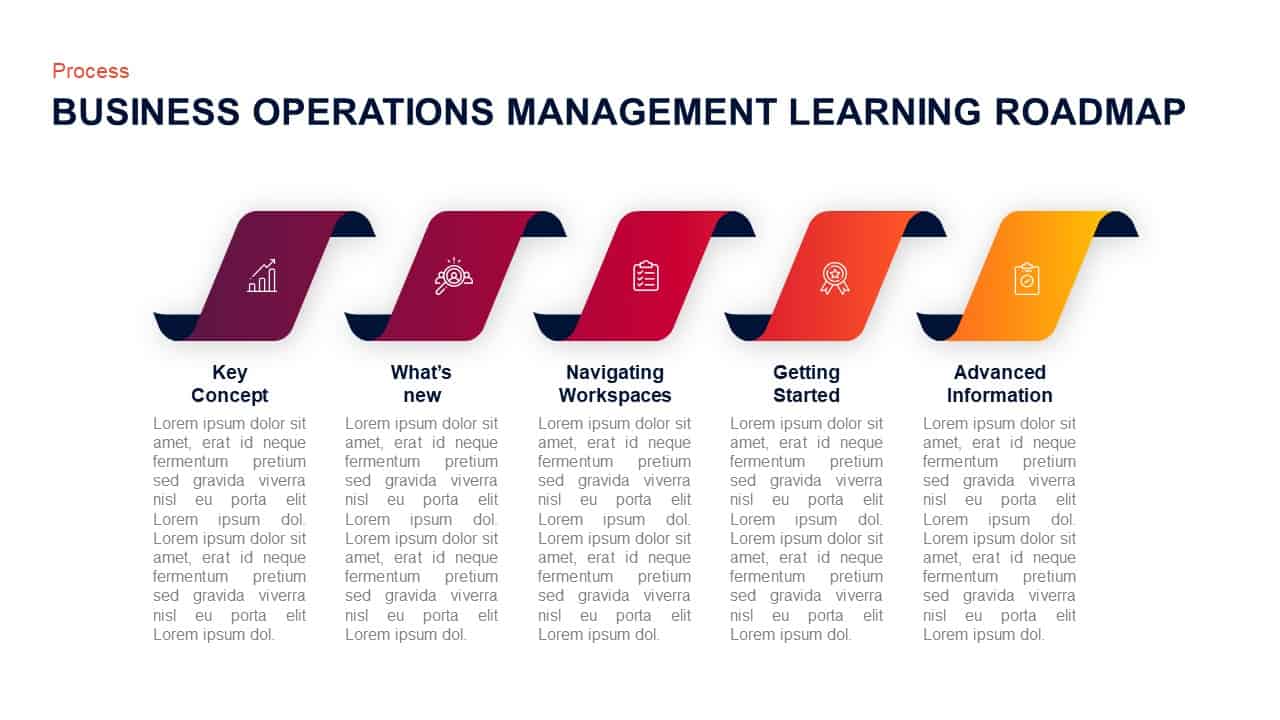
Operations Management Learning Roadmap Template for PowerPoint & Google Slides
Roadmap

4MAT Learning Cycle Circular Diagram Template for PowerPoint & Google Slides
Circular
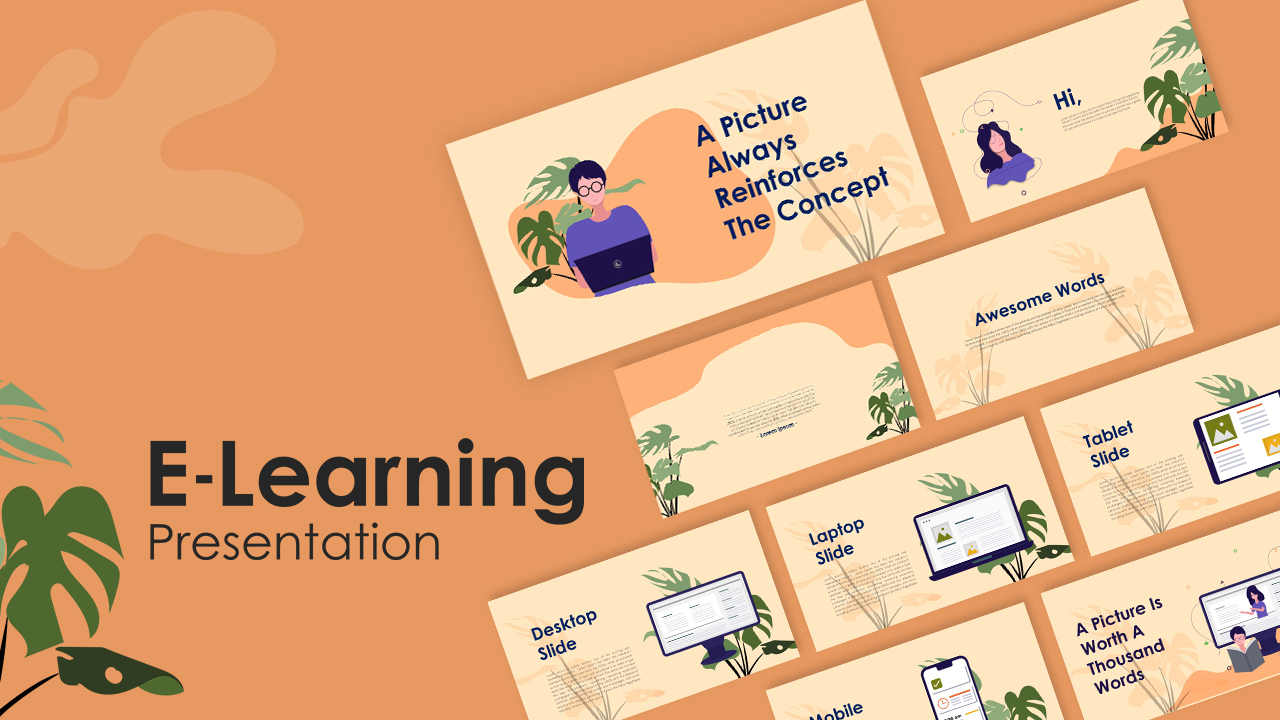
Free Stylish E-Learning Presentation Template for PowerPoint & Google Slides
Pitch Deck
Free
E-Learning Education Presentation Deck Template for PowerPoint & Google Slides
Decks
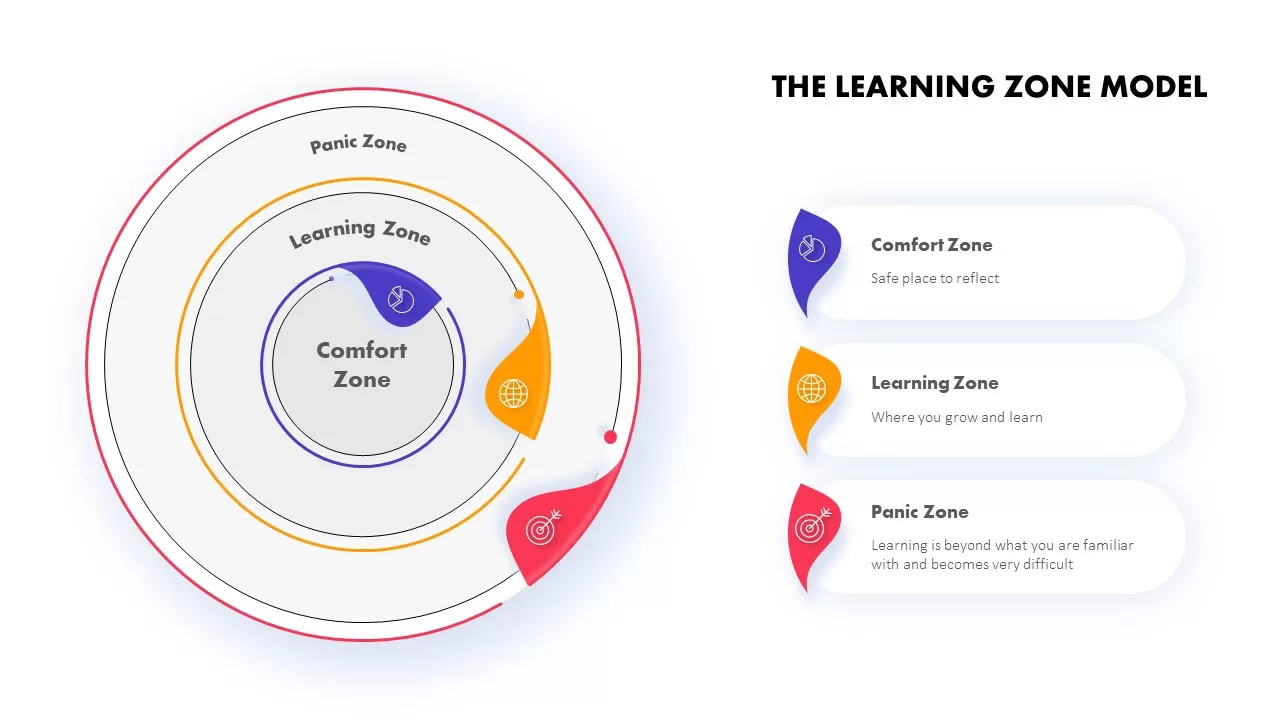
The Learning Zone Model Template for PowerPoint & Google Slides
Process
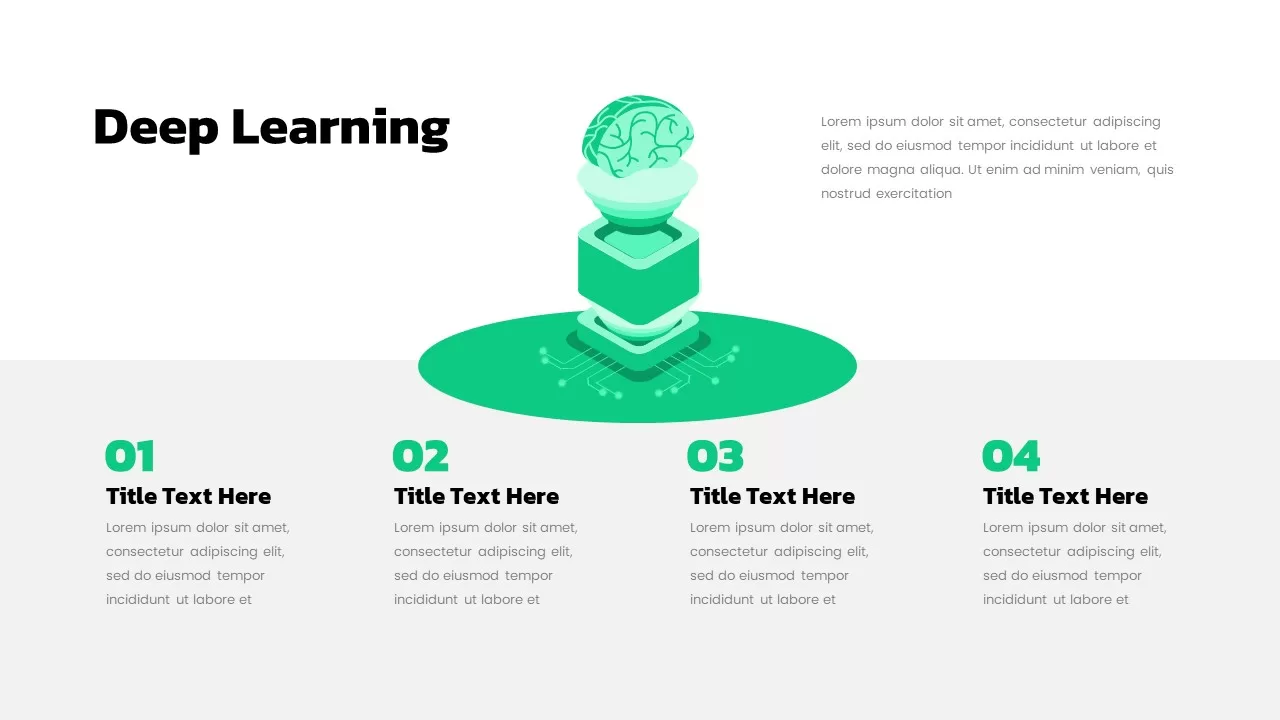
Deep Learning Concept Illustration Template for PowerPoint & Google Slides
Machine Learning
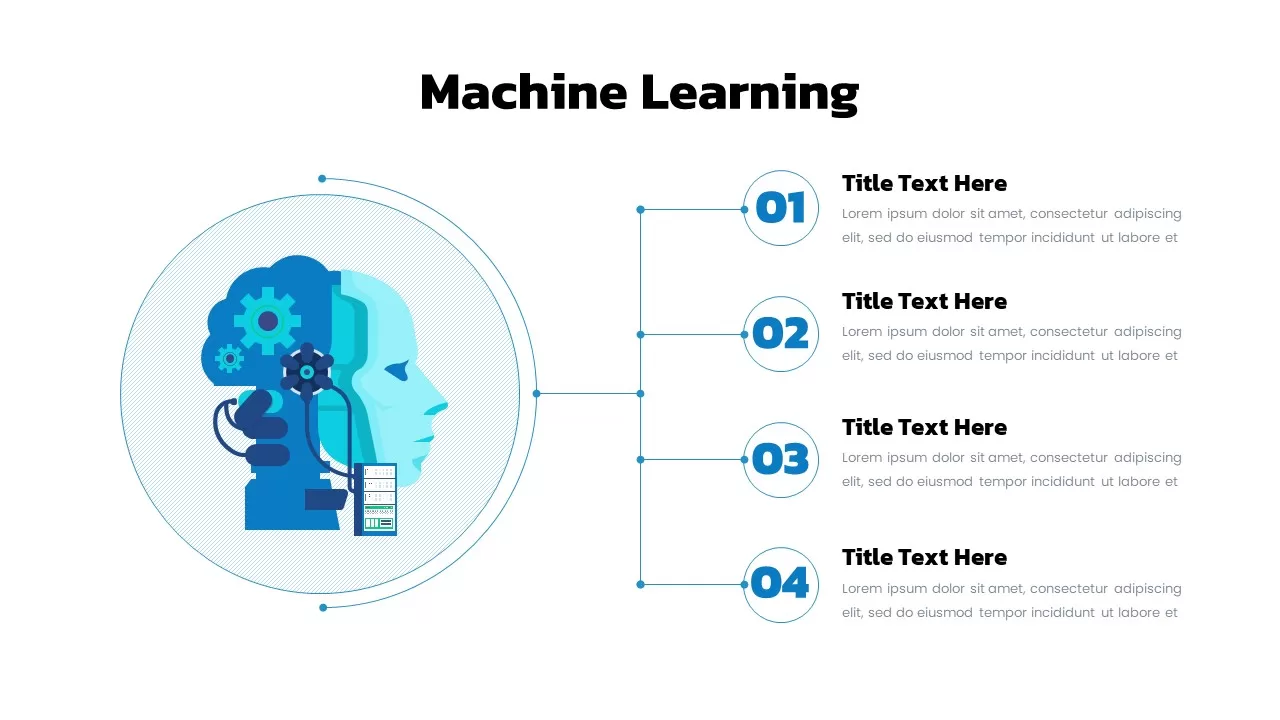
Machine Learning Diagram Template for PowerPoint & Google Slides
Process
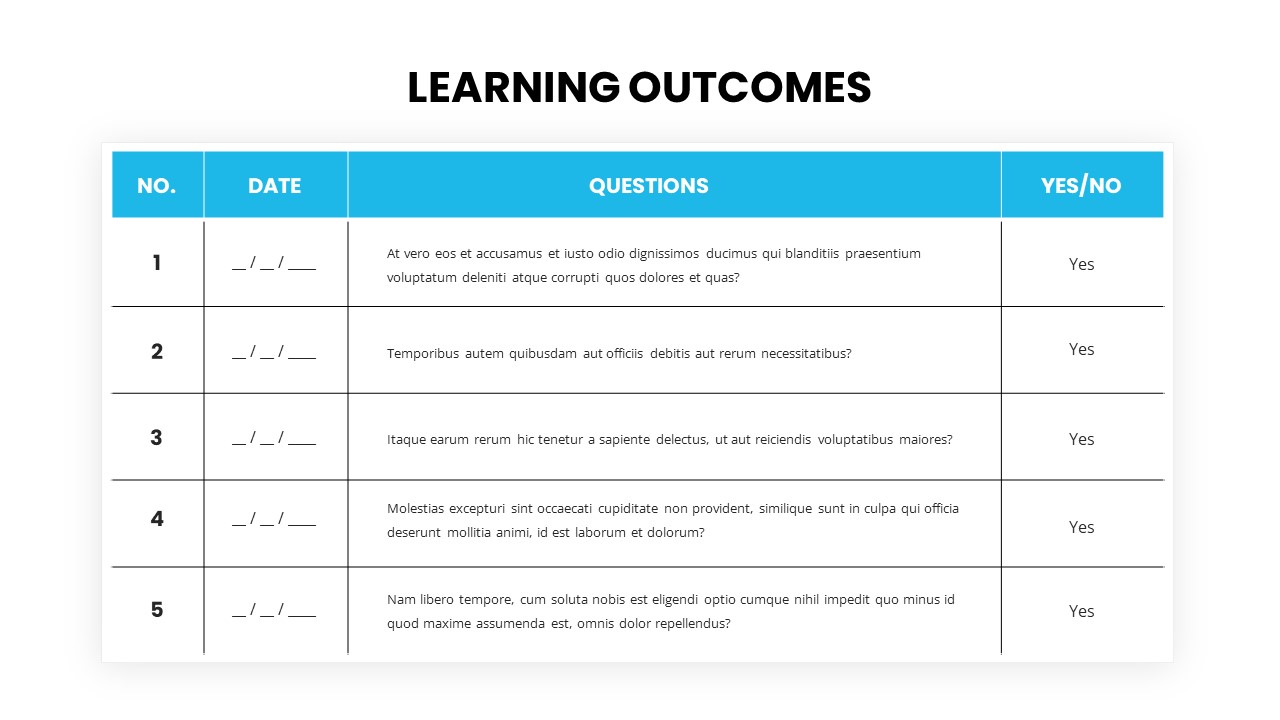
Learning Outcomes table template for PowerPoint & Google Slides
Charts

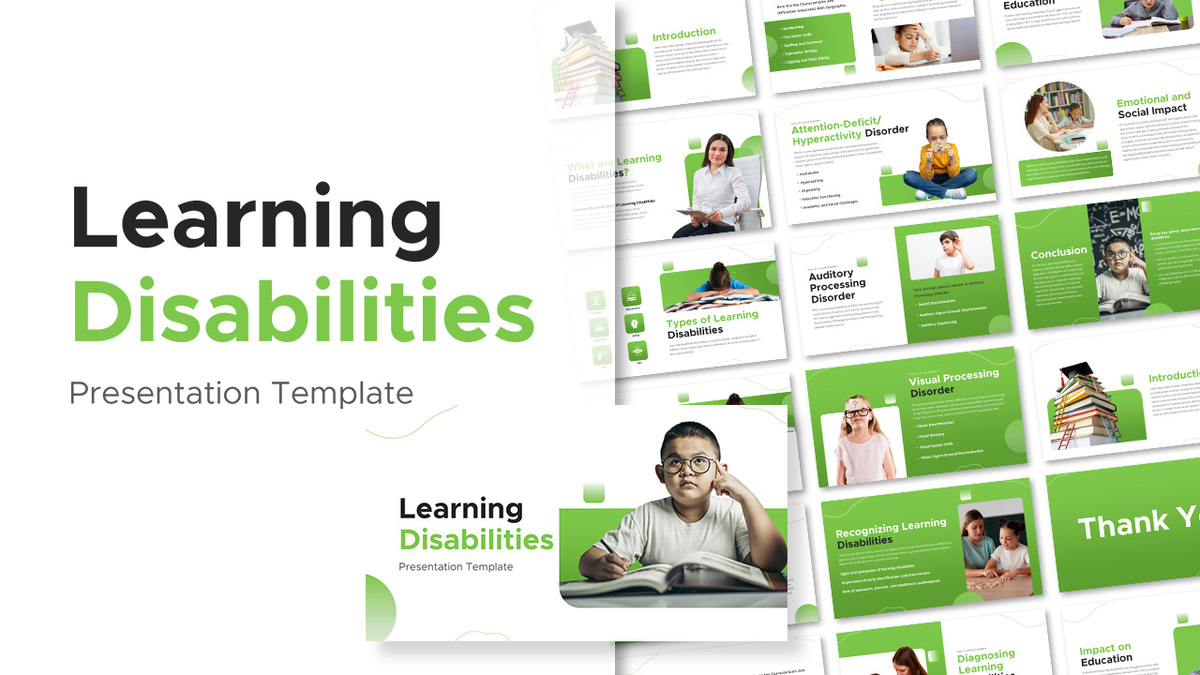
Learning Disabilities Presentation Template for PowerPoint & Google Slides
Company Profile
Free Learning Retention Pyramid Chart Template for PowerPoint & Google Slides
Pyramid
Free
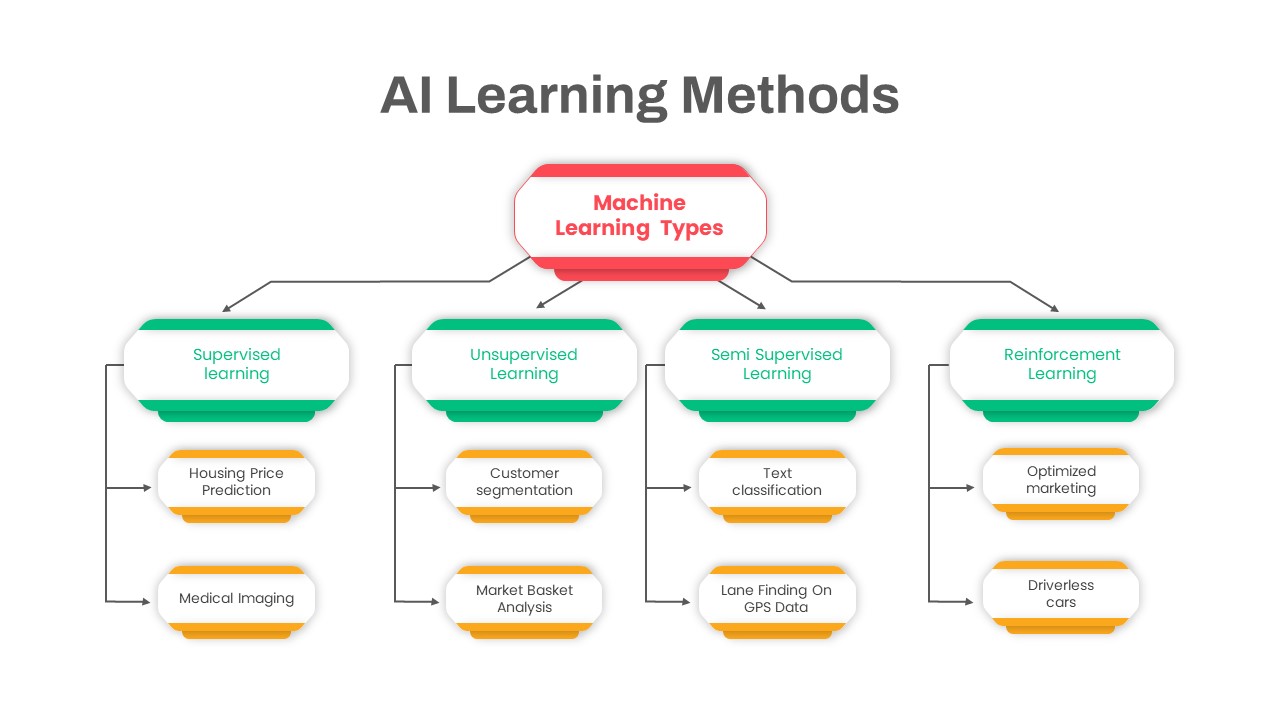
AI Learning Methods Flowchart Diagram Template for PowerPoint & Google Slides
Flow Charts
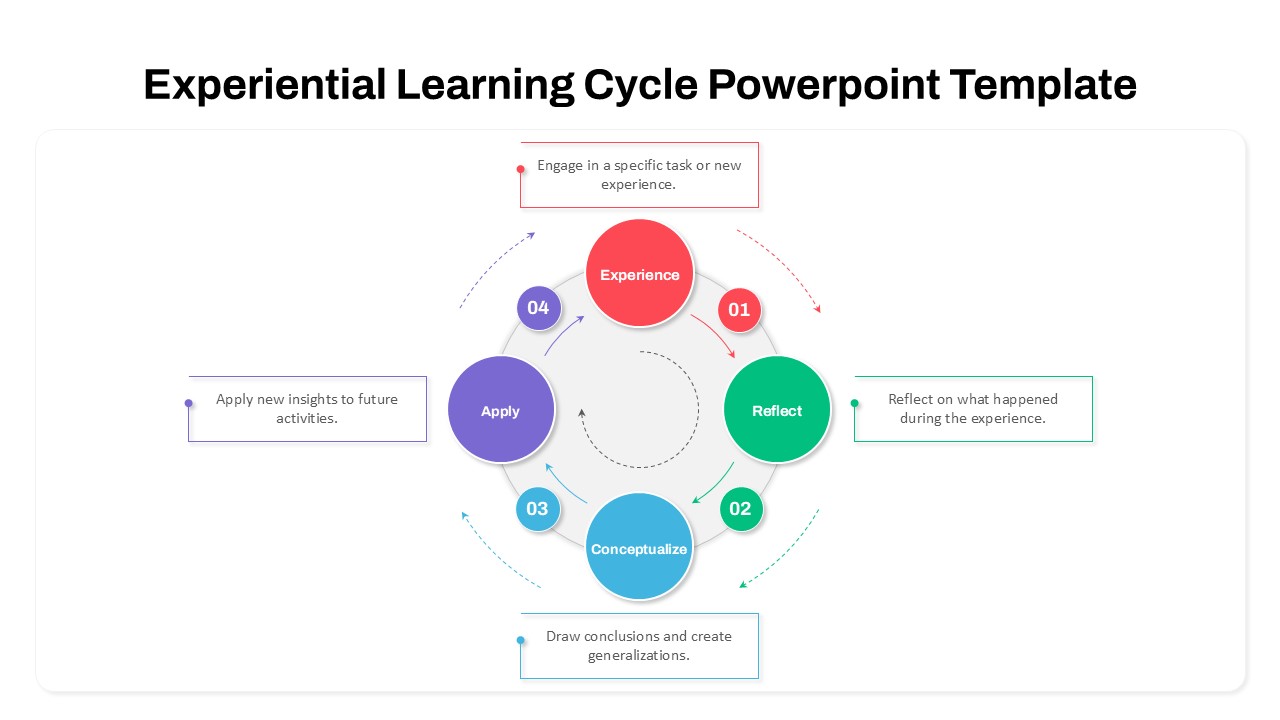
Experiential Learning Cycle Diagram Template for PowerPoint & Google Slides
Circular
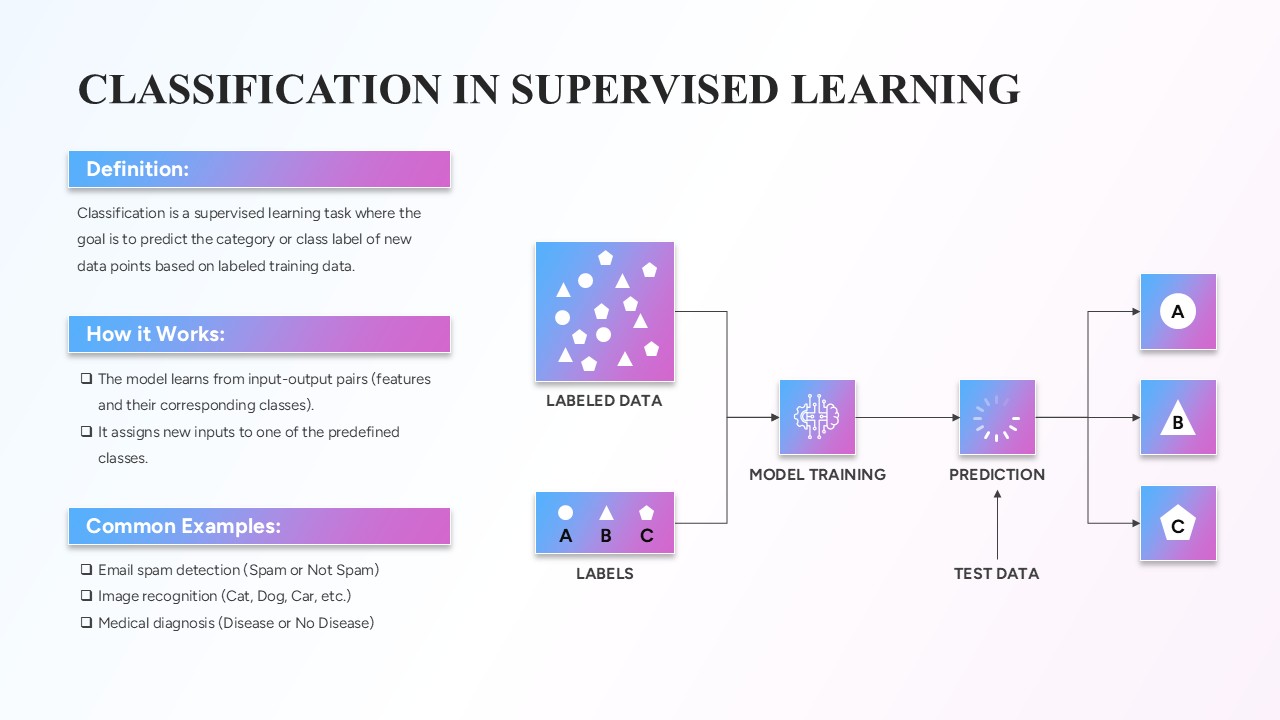
Classification in Supervised Learning template for PowerPoint & Google Slides
Infographics
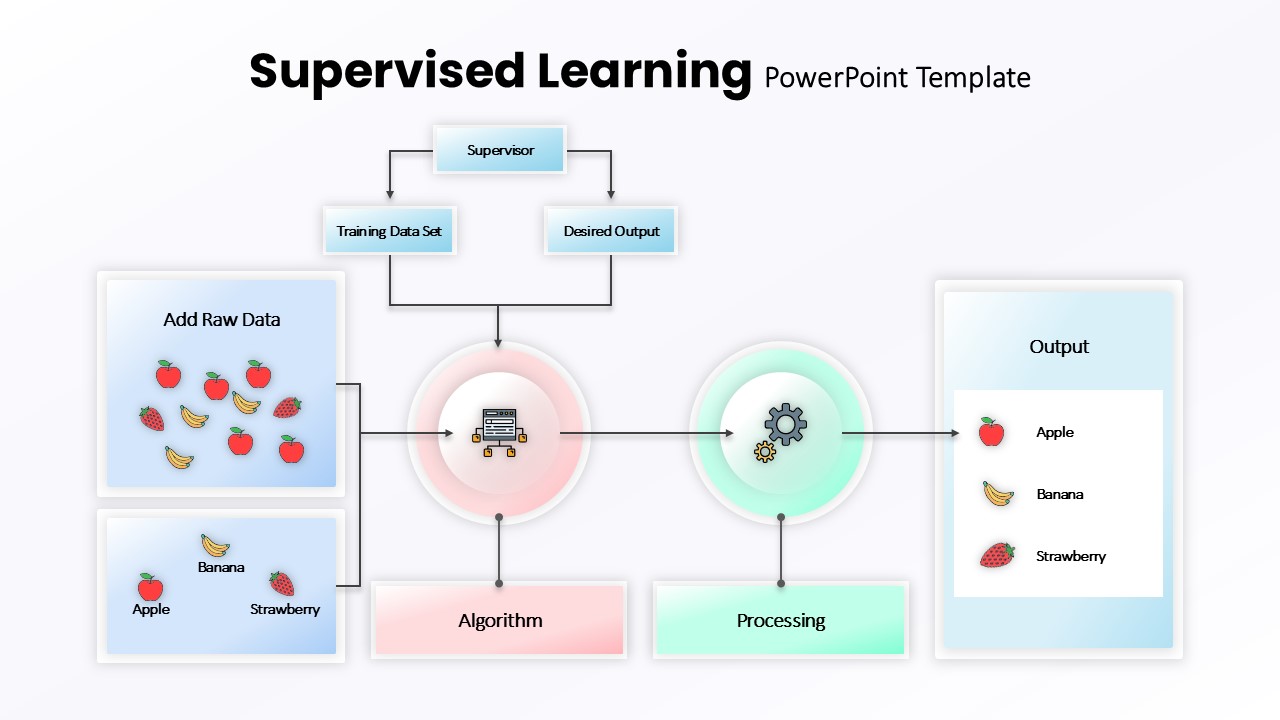
Supervised Learning Overview template for PowerPoint & Google Slides
Technology
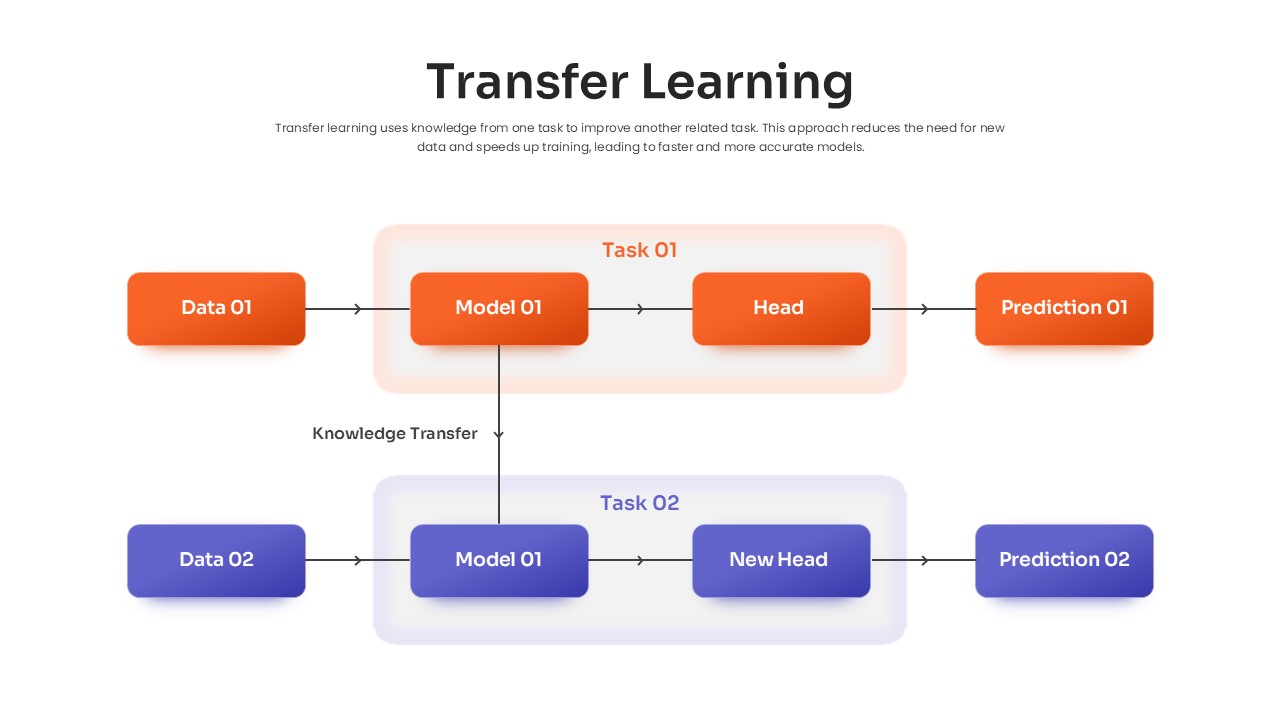
Transfer Learning Process template for PowerPoint & Google Slides
Technology
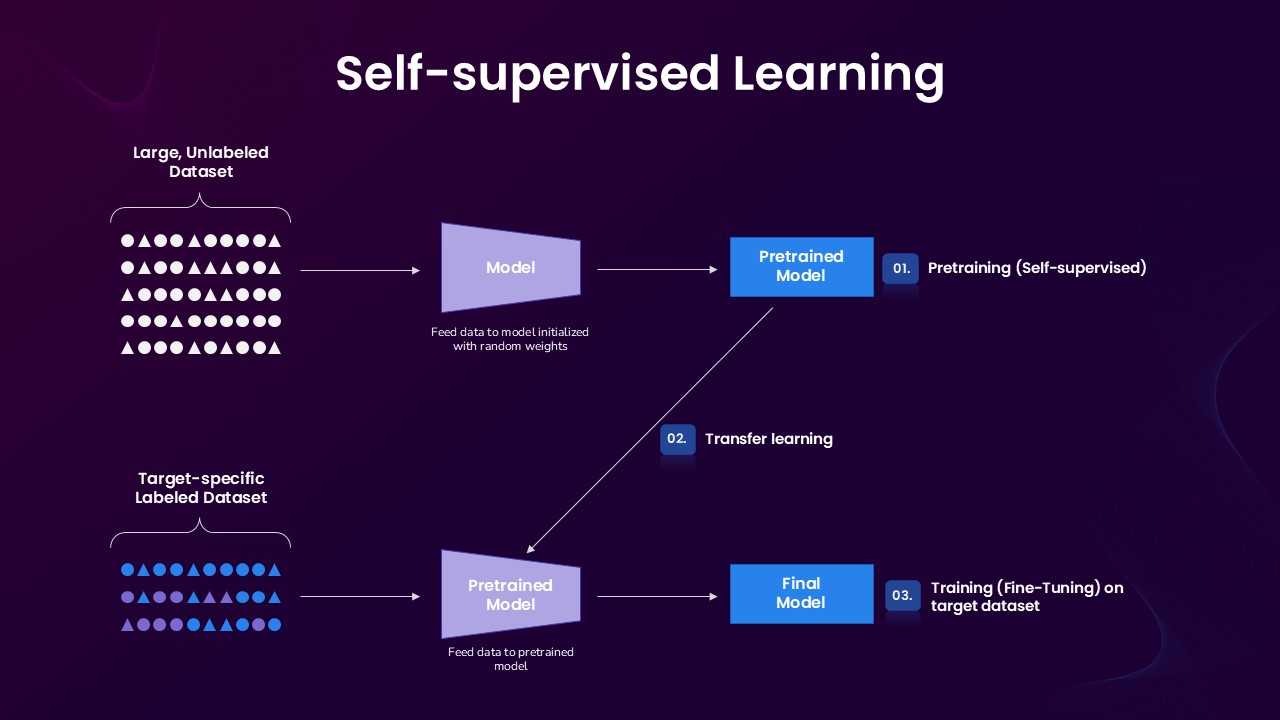
Self-supervised Learning Process template for PowerPoint & Google Slides
Technology
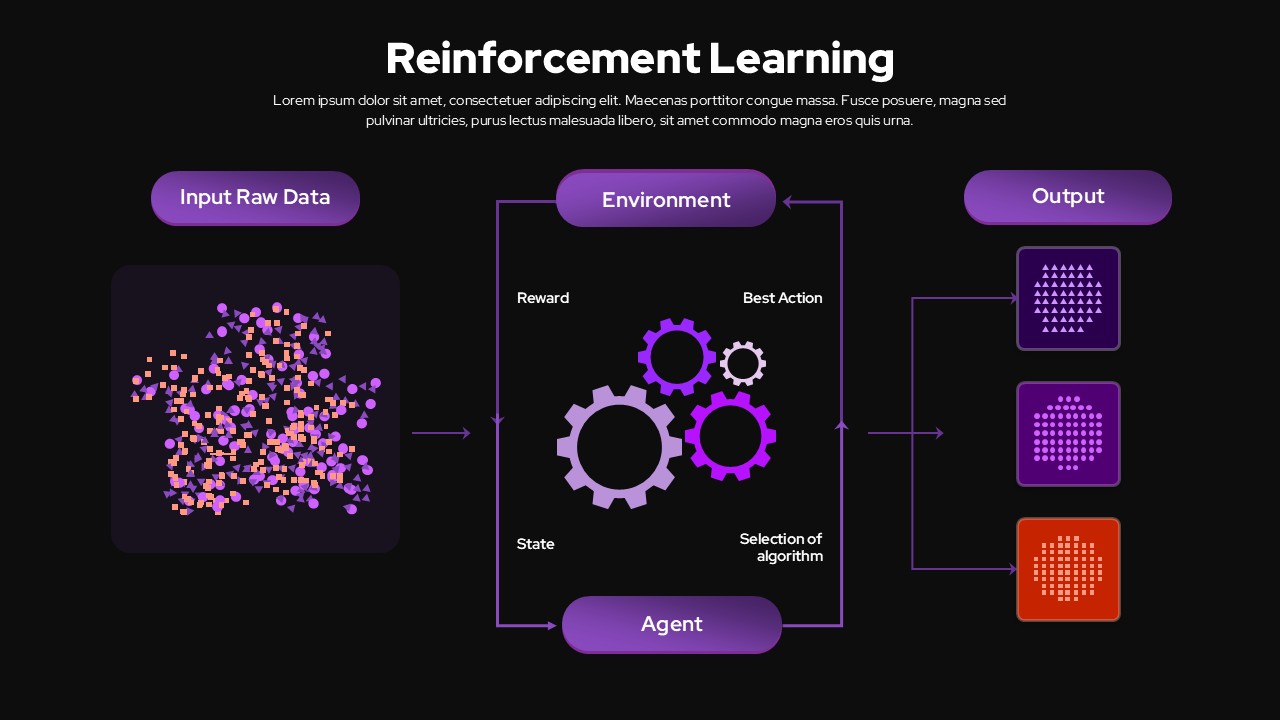
Reinforcement Learning Diagram Dark Template for PowerPoint & Google Slides
Machine Learning
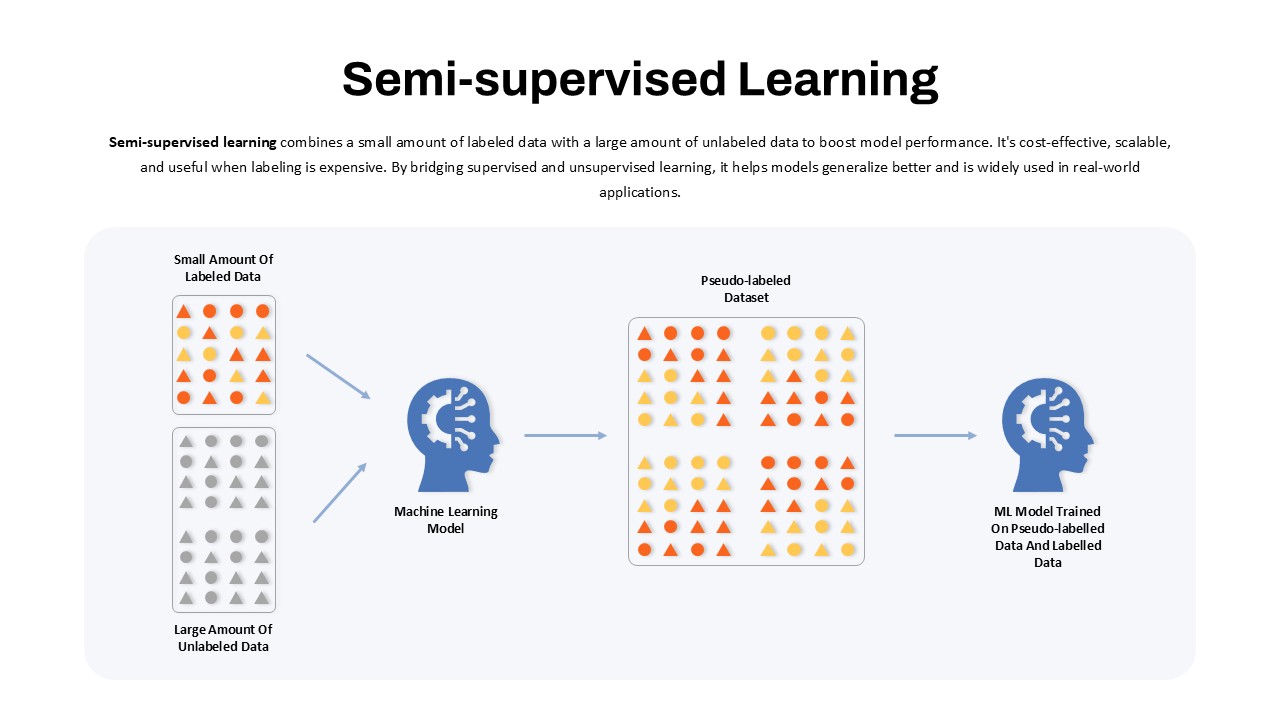
Semi-Supervised Learning Flow Diagram Template for PowerPoint & Google Slides
Machine Learning
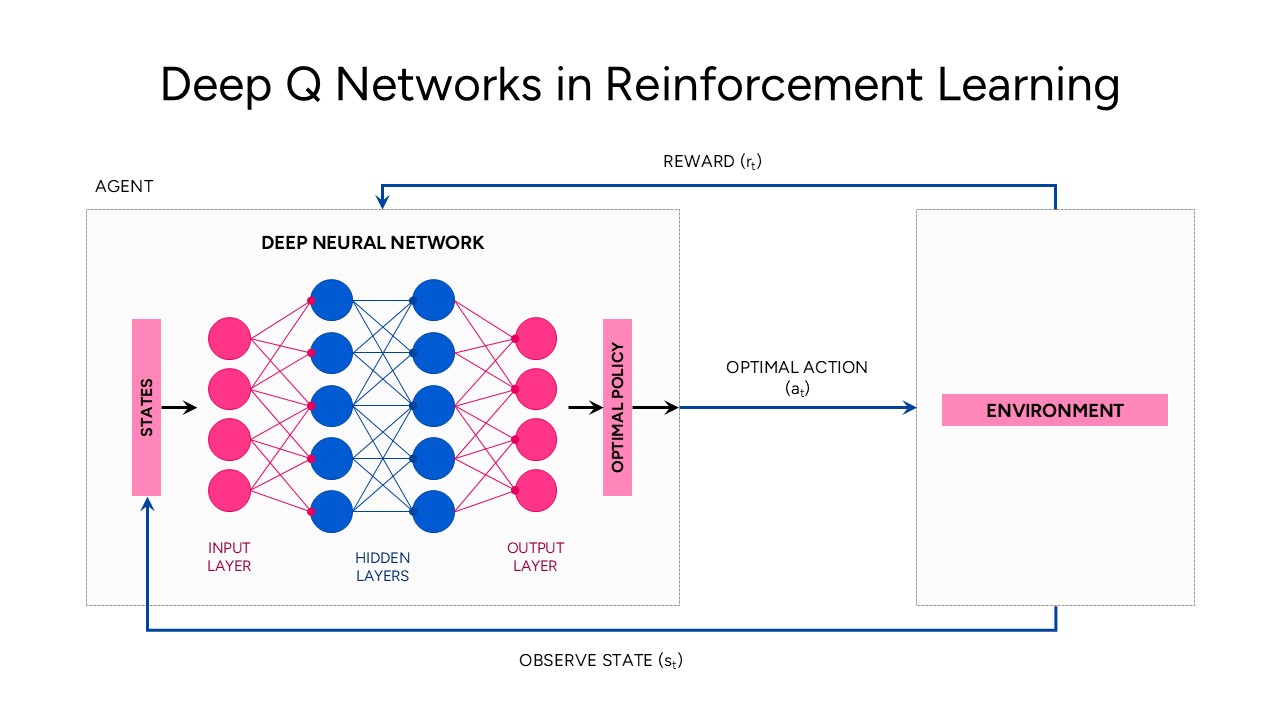
Deep Q Networks in Reinforcement Learning template for PowerPoint & Google Slides
Technology
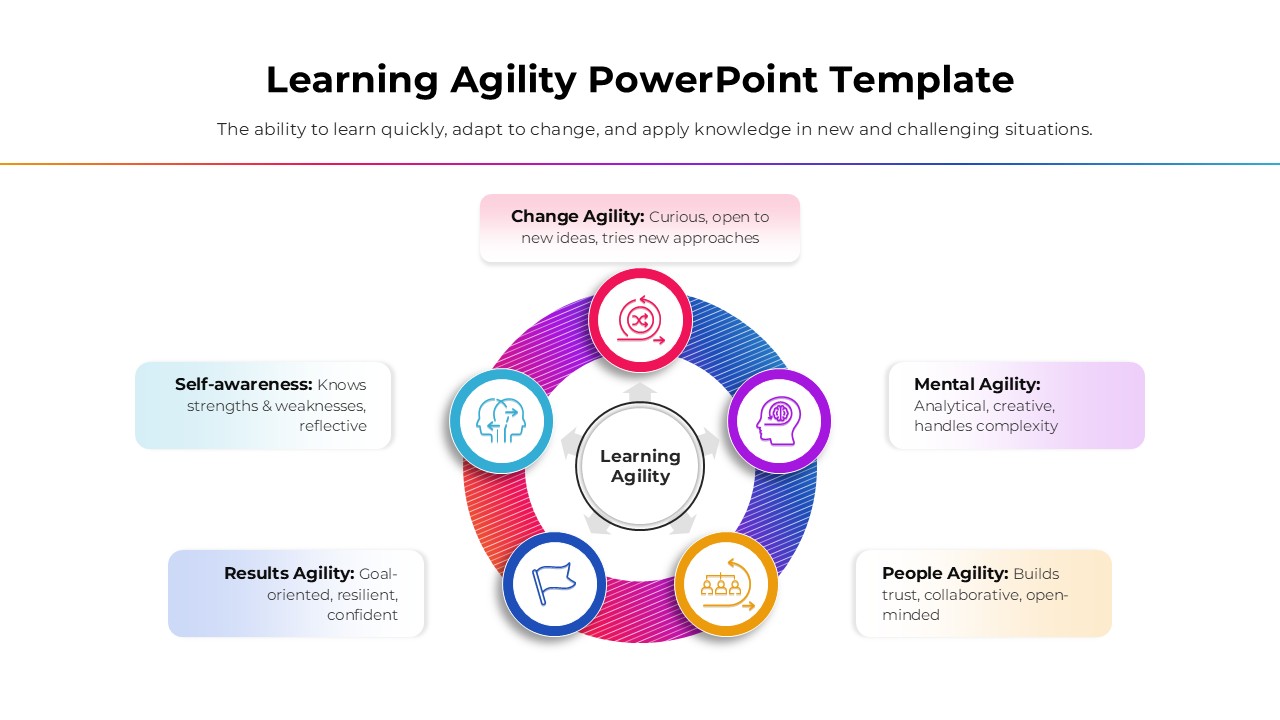
Learning Agility template for PowerPoint & Google Slides
Business
Machine Learning Pipeline Framework Template for PowerPoint & Google Slides
Charts
Machine Learning Innovation Overview template for PowerPoint & Google Slides
AI
Machine Learning Types template for PowerPoint & Google Slides
Technology
Regression in Supervised Learning Overview template for PowerPoint & Google Slides
Process
Machine Learning Applications template for PowerPoint & Google Slides
Technology
Contingency Matrix in Machine Learning template for PowerPoint & Google Slides
Technology
Q-Learning Process Flow Diagram Template for PowerPoint & Google Slides
Process
Decision Trees in Supervised Learning Template for PowerPoint & Google Slides
Machine Learning
Machine Learning Overview Slide Template for PowerPoint & Google Slides
Machine Learning
Machine Learning Four-Step Process Template for PowerPoint & Google Slides
Machine Learning
Machine Learning Three-Step Process Template for PowerPoint & Google Slides
Machine Learning
Free Machine Learning Concept Slide Template for PowerPoint & Google Slides
Machine Learning
Free
Futuristic Machine Learning Workflow Template for PowerPoint & Google Slides
Machine Learning
Futuristic Machine Learning Types Overview Template for PowerPoint & Google Slides
AI
Machine Learning Pipeline Overview Template for PowerPoint & Google Slides
Machine Learning
Machine Learning Presentation Use Cases Template for PowerPoint & Google Slides
Machine Learning
Machine Learning 4-Step Workflow Template for PowerPoint & Google Slides
Machine Learning
Machine Learning Model Management Template for PowerPoint & Google Slides
Machine Learning
Machine Learning Pipeline & MLOps Flow Template for PowerPoint & Google Slides
Machine Learning
Machine Learning Process Template for PowerPoint & Google Slides
Machine Learning
Seven Stage Machine Learning Pipeline Template for PowerPoint & Google Slides
Machine Learning
Machine Learning Model Training Template for PowerPoint & Google Slides
Machine Learning
Learning Curve Performance Growth Chart Template for PowerPoint & Google Slides
Employee Performance
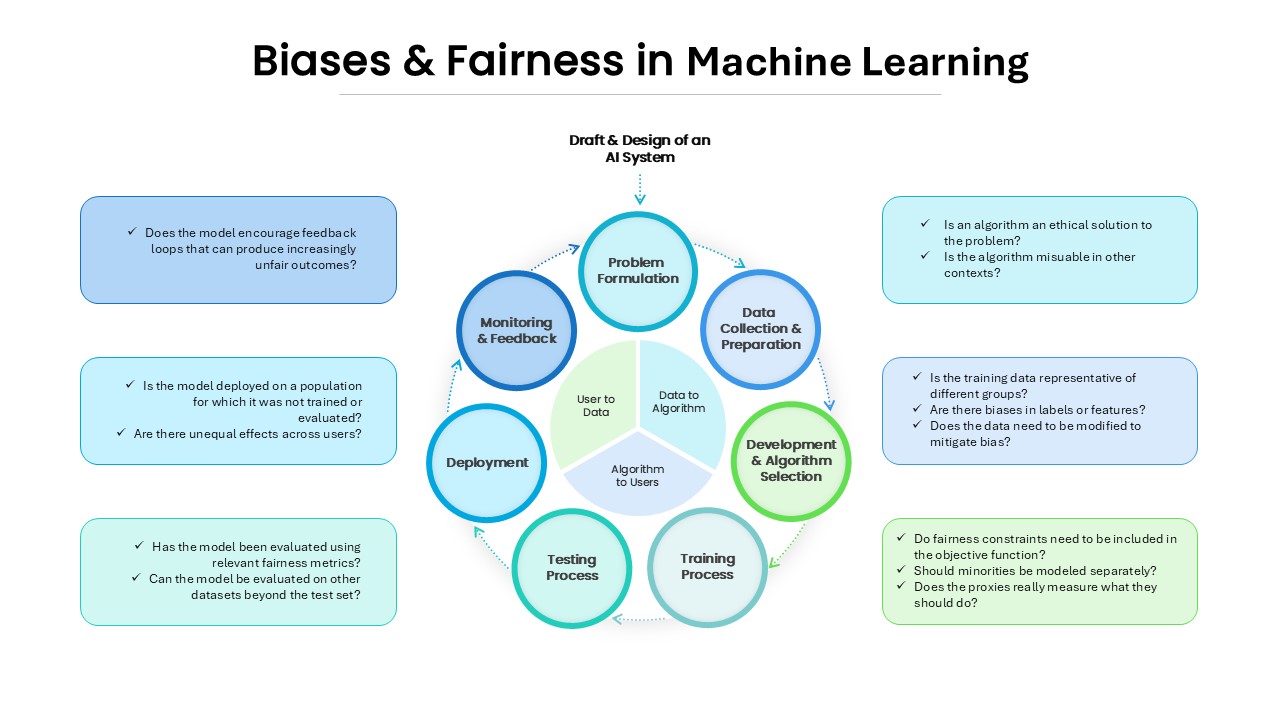
Biases and Fairness in Machine Learning for PowerPoint & Google Slides
Information Technology
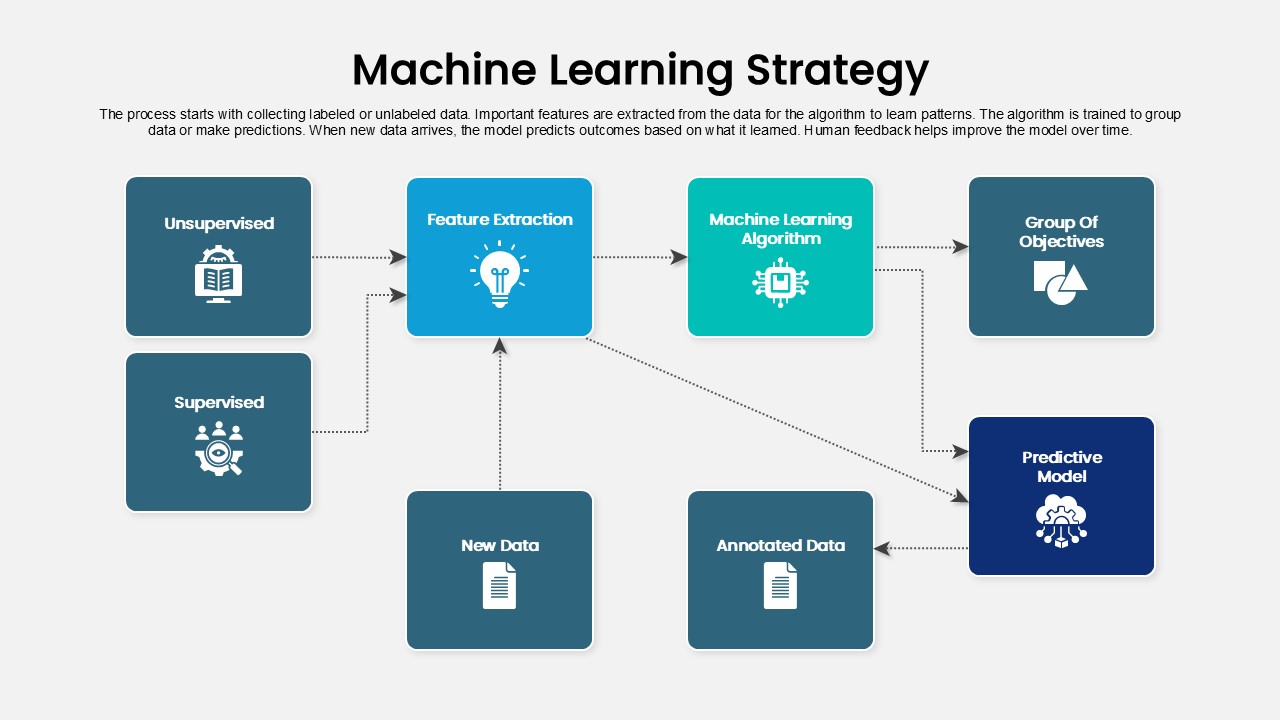
Machine Learning Strategy Flowchart
Machine Learning
Google Ads Optimization & Performance Infographic Template for PowerPoint & Google Slides
Digital Marketing
SQ3R Study Strategy Infographic Slides Template for PowerPoint & Google Slides
Business Strategy
Six Double Diamond Infographic Slides Template for PowerPoint & Google Slides
Process

Sales Process Infographic Slides Pack Template for PowerPoint & Google Slides
Process
Casino/Poker Chips Infographic Slides template for PowerPoint & Google Slides
Business Strategy
Agenda Infographic Pack of 2 Slides Template for PowerPoint & Google Slides
Agenda
Quad Chart Infographic Pack of 8 Slides Template for PowerPoint & Google Slides
Comparison Chart
Four Options Infographic Slides Template for PowerPoint & Google Slides
Comparison
Game Plan Infographic Slides Pack Template for PowerPoint & Google Slides
Infographics
Teamwork PowerPoint Infographic Template for PowerPoint & Google Slides
Leadership
Kite Infographic PowerPoint Template for PowerPoint & Google Slides
Process
Cladogram Infographic Di Template for PowerPoint & Google Slides Template
Decision Tree
Workflow PowerPoint Process infographic for PowerPoint & Google Slides
Process
Free Infographic Deck PowerPoint Pack for PowerPoint & Google Slides
Infographics
Free
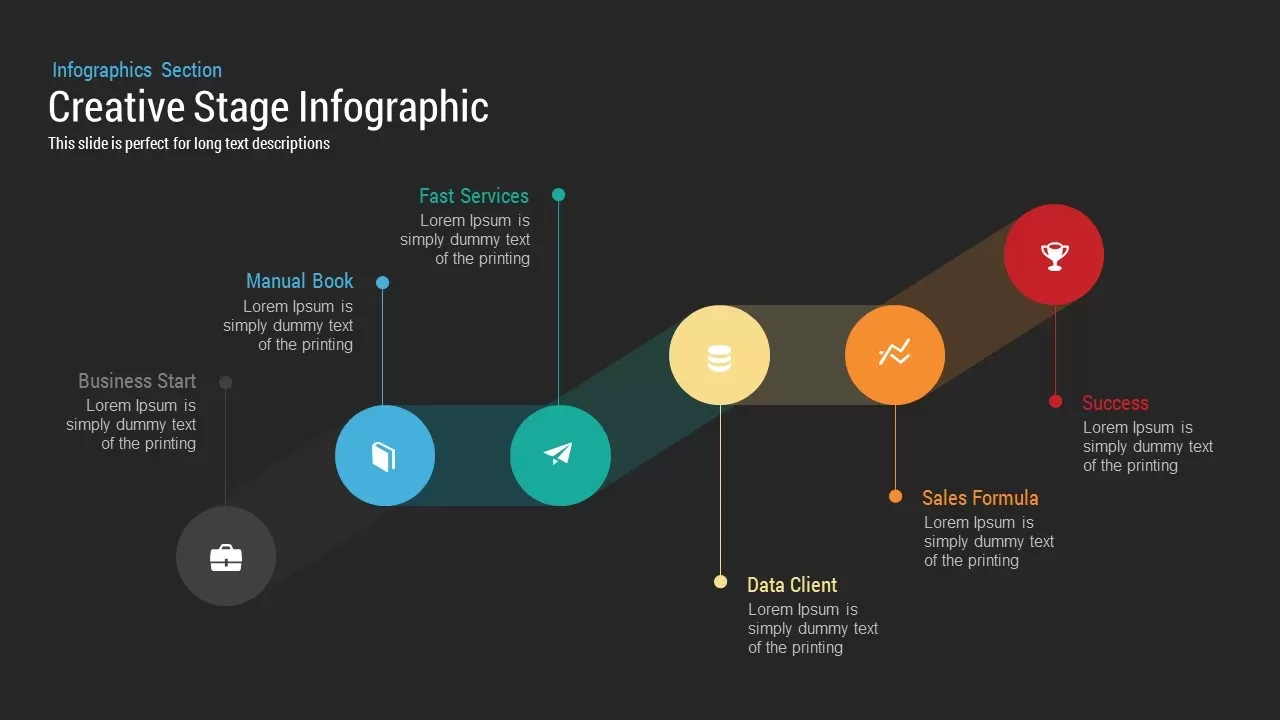
Stage Infographic template for PowerPoint & Google Slides
Process
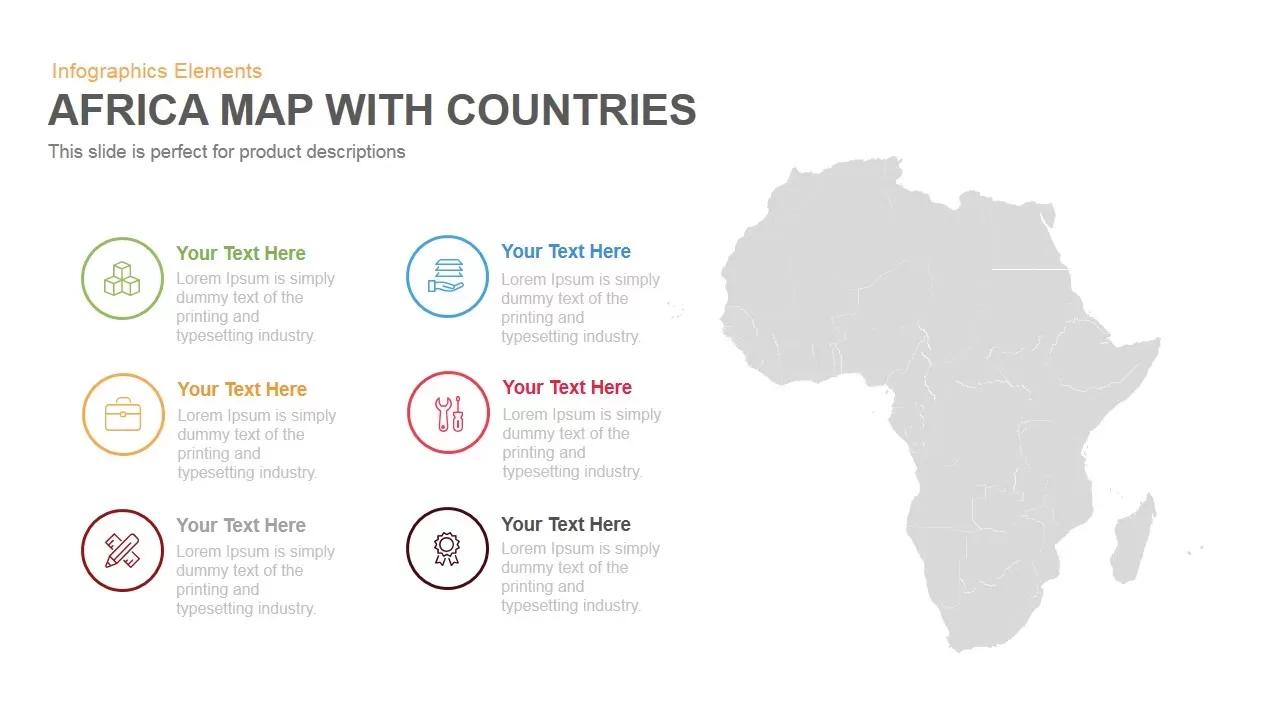
Africa Country Map Infographic Template for PowerPoint & Google Slides
World Maps
7-Level 3D Pyramid Infographic Diagram Template for PowerPoint & Google Slides
Pyramid
Three-Circle Diagram Infographic Template for PowerPoint & Google Slides
Circular
30 60 90-Day Plan Infographic Slide Template for PowerPoint & Google Slides
Business

Nepal Map with Zones Infographic Template for PowerPoint & Google Slides
Maps
Social Network Infographic Diagram Template for PowerPoint & Google Slides
Digital Marketing
4-Step Circular Roadmap Infographic Template for PowerPoint & Google Slides
Roadmap
6 Stage Service Process Infographic Template for PowerPoint & Google Slides
Process
VUCA World Infographic Presentation Template for PowerPoint & Google Slides
Pitch Deck
Effective Business Plan Infographic Template for PowerPoint & Google Slides
Pitch Deck
3D Triangle Diagram Infographic Template for PowerPoint & Google Slides
Pyramid
Upward Arrow infographic template for PowerPoint & Google Slides
Infographics
Run Grow Transform Model Infographic Template for PowerPoint & Google Slides
Business
SWOT Analysis Grid Infographic Template for PowerPoint & Google Slides
SWOT
Data-driven GDP Growth Infographic Pack Template for PowerPoint & Google Slides
Infographics
5-Step Curved Arrow Infographic Template for PowerPoint & Google Slides
Arrow
PDCA Cycle Infographic with Four Stages Template for PowerPoint & Google Slides
Process
Accomplishment Circular Infographic Template for PowerPoint & Google Slides
Accomplishment
Six-Part Hexagon Infographic Layout Template for PowerPoint & Google Slides
Infographics
Three-Step Hexagon Infographic Process Template for PowerPoint & Google Slides
Process
Statistics Infographic Template for PowerPoint & Google Slides
Infographics
Chain Link Process Infographic Diagram Template for PowerPoint & Google Slides
Process
4 Step Methodology Infographic Template for PowerPoint & Google Slides
Process
Creative Block List Infographic Template for PowerPoint & Google Slides
Agenda
Free Goal Setting Target Infographic Slide Template for PowerPoint & Google Slides
Goals
Free
Editable Ireland Map Infographic Slide Template for PowerPoint & Google Slides
World Maps
Free
Multimodal AI Modalities Infographic Template for PowerPoint & Google Slides
AI
Four Level Pyramid Infographic Template for PowerPoint & Google Slides
Pyramid
Three Segment Donut Chart KPI Infographic Template for PowerPoint & Google Slides
Pie/Donut