5 Why Fishbone Diagram for Root Cause Analysis in PowerPoint & Google Slides

Description
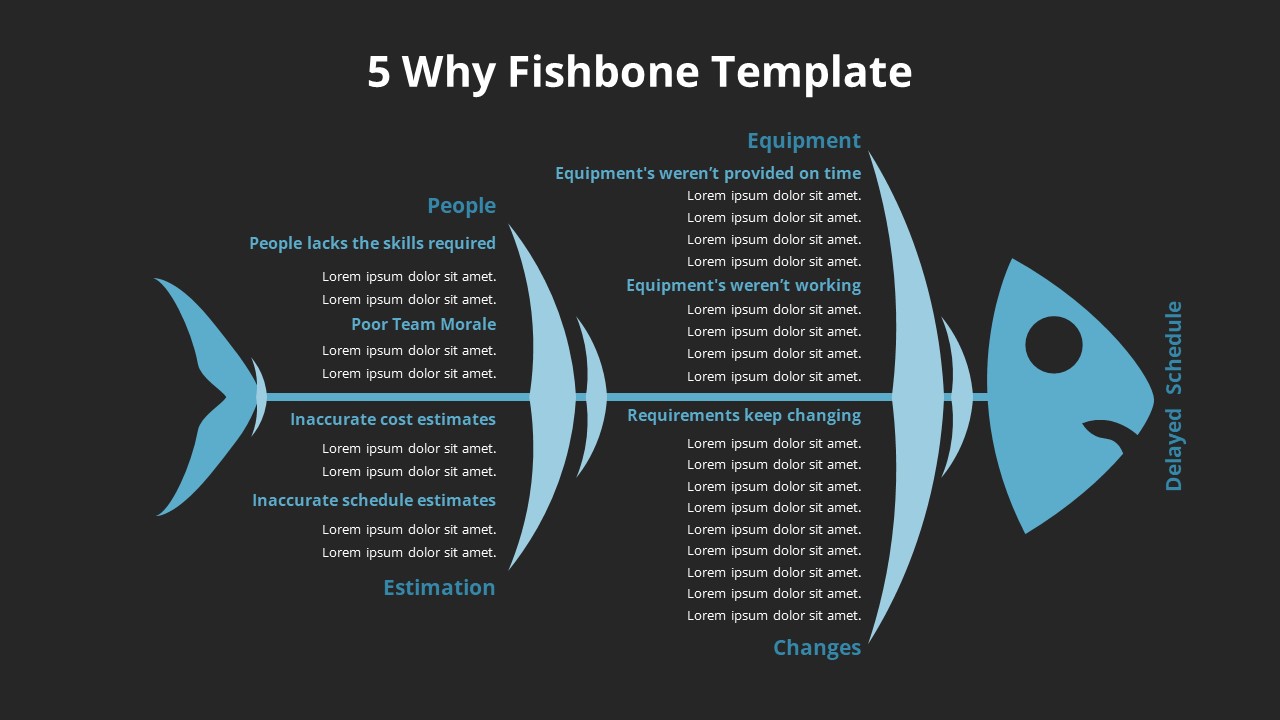
Streamline problem-solving with this 5 Why Fishbone Diagram slide, ideal for uncovering root causes in business or project challenges. Featuring a stylized fishbone layout, the template visually separates categories such as People, Equipment, Estimation, and Changes—each leading into a central spine that culminates in the core issue: Delayed Schedule. This structure encourages teams to explore contributing factors in a clear, methodical way.
Designed for quick comprehension, the diagram employs a consistent blue color scheme and legible fonts, making it presentation-ready for workshops, team reviews, and strategic planning meetings. Fully editable in both PowerPoint and Google Slides, the layout supports step-by-step analysis and can be adapted to various issues beyond time management.
Who is it for
Project managers, quality control teams, operations leads, business analysts, and consultants who need to illustrate root cause analysis processes effectively.
Other Uses
Can be repurposed for Six Sigma discussions, incident debriefs, product defect tracing, software issue mapping, or any scenario requiring visual cause-effect breakdowns.
Login to download this file

Item ID
SB04100
Related Templates

Free Root Cause Analysis Fishbone Diagram Template for PowerPoint & Google Slides
Process
Free
Fishbone Cause Analysis Diagram Template for PowerPoint & Google Slides
Process
Root Cause Analysis PowerPoint & Google Slides Template for Presentations
Business Strategy
Sky and Tree Root Cause Analysis Deck Template for PowerPoint & Google Slides
Opportunities Challenges
Root Cause Analysis Infographic Pack Template for PowerPoint & Google Slides
Process
Fishbone Diagram Cause-and-Effect Template for PowerPoint & Google Slides
Process
Fishbone Cause and Effect Diagram Template for PowerPoint & Google Slides
Process
Underwater Fishbone Cause-Effect Diagram Template for PowerPoint & Google Slides
Process
Fishbone Cause and Effect Infographic Template for PowerPoint & Google Slides
Infographics
Fishbone Diagram Analysis Template for PowerPoint & Google Slides
Flow Charts
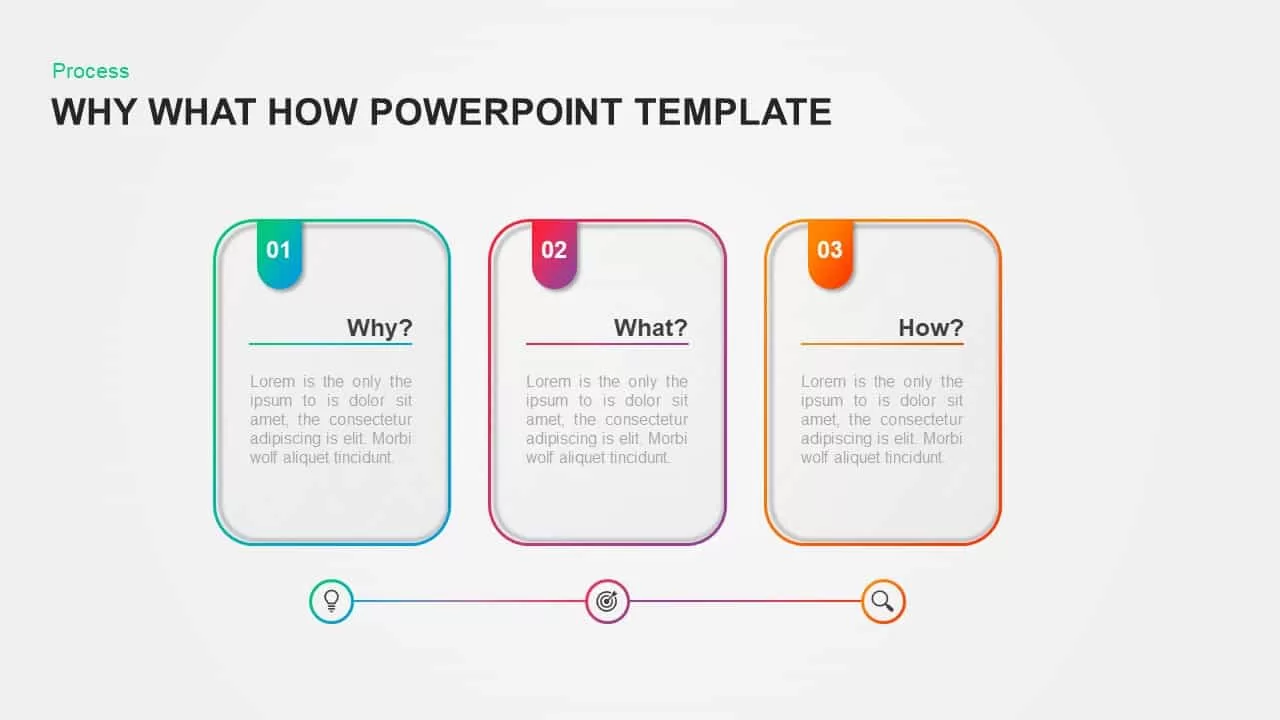
Why What How Process Diagram Template for PowerPoint & Google Slides
Process
Three-Section Fishbone Process Diagram template for PowerPoint & Google Slides
Process
Fishbone RCA Diagram Template for PowerPoint & Google Slides
Business Strategy
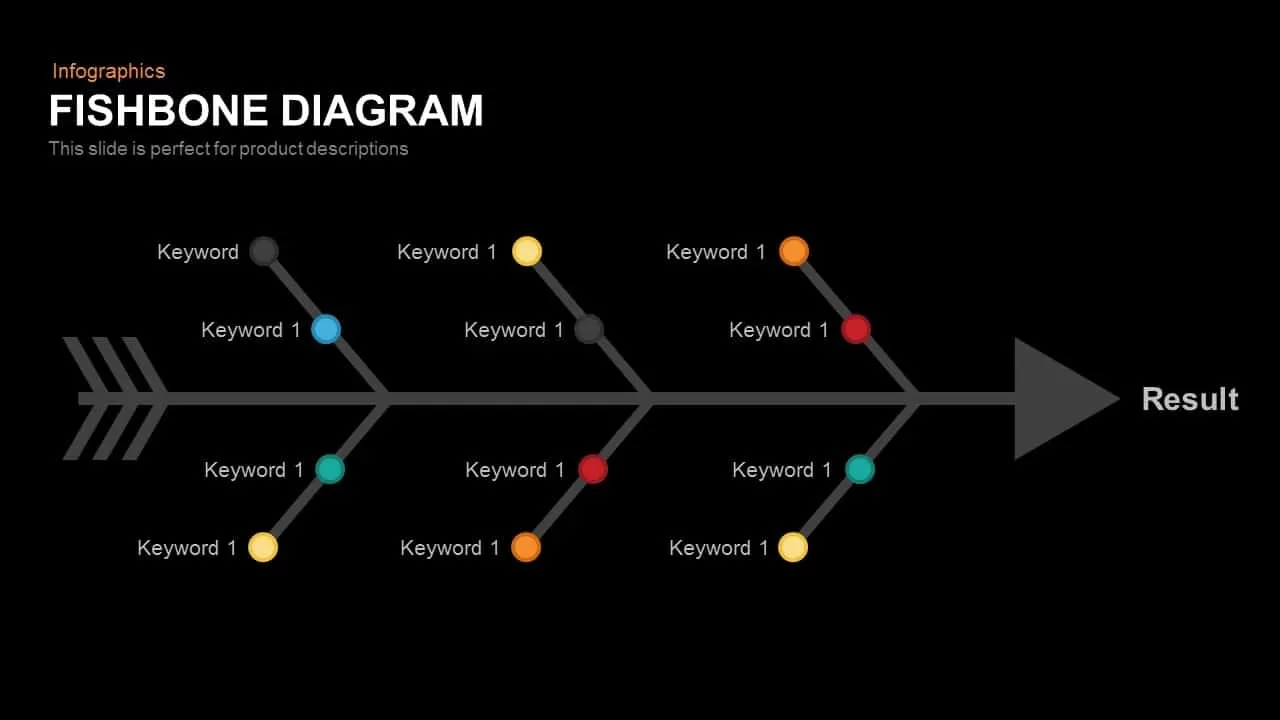
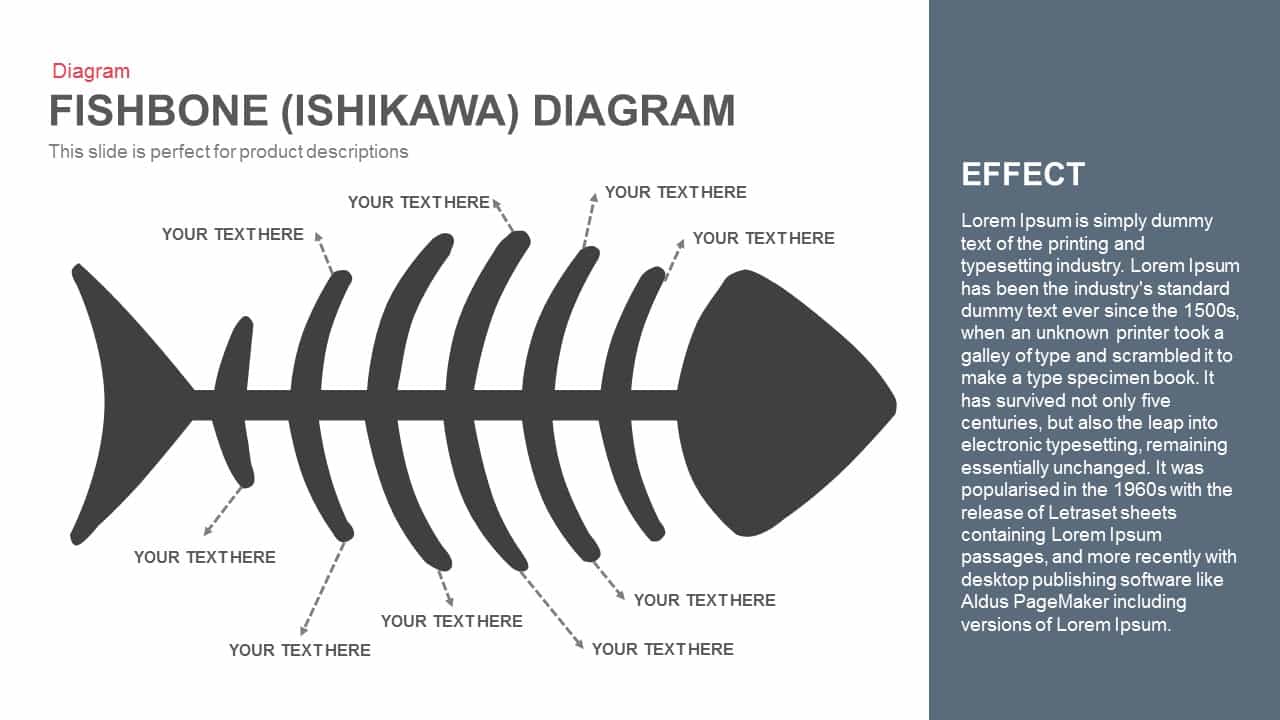
Fishbone (Ishikawa) Diagram for PowerPoint & Google Slides
Process
Fishbone Diagram Overview template for PowerPoint & Google Slides
Infographics
Free Color-Coded Fishbone Diagram Template for PowerPoint & Google Slides
Project
Free
Fishbone Process Diagram template for PowerPoint & Google Slides
Infographics

Cause and Effect Diagram Infographic Template for PowerPoint & Google Slides
Bar/Column
Five-Input Cause and Effect Diagram Template for PowerPoint & Google Slides
Arrow
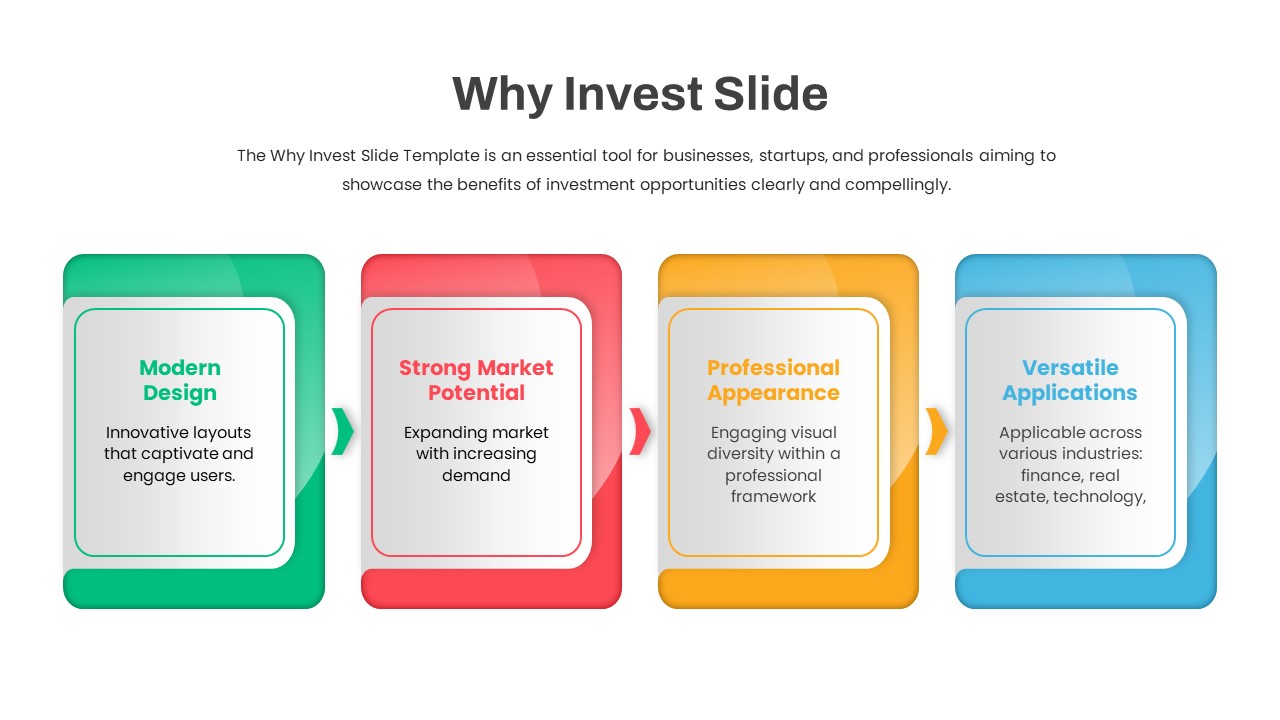
Why Invest Slide Four-Step Benefits Flow Template for PowerPoint & Google Slides
Business Plan
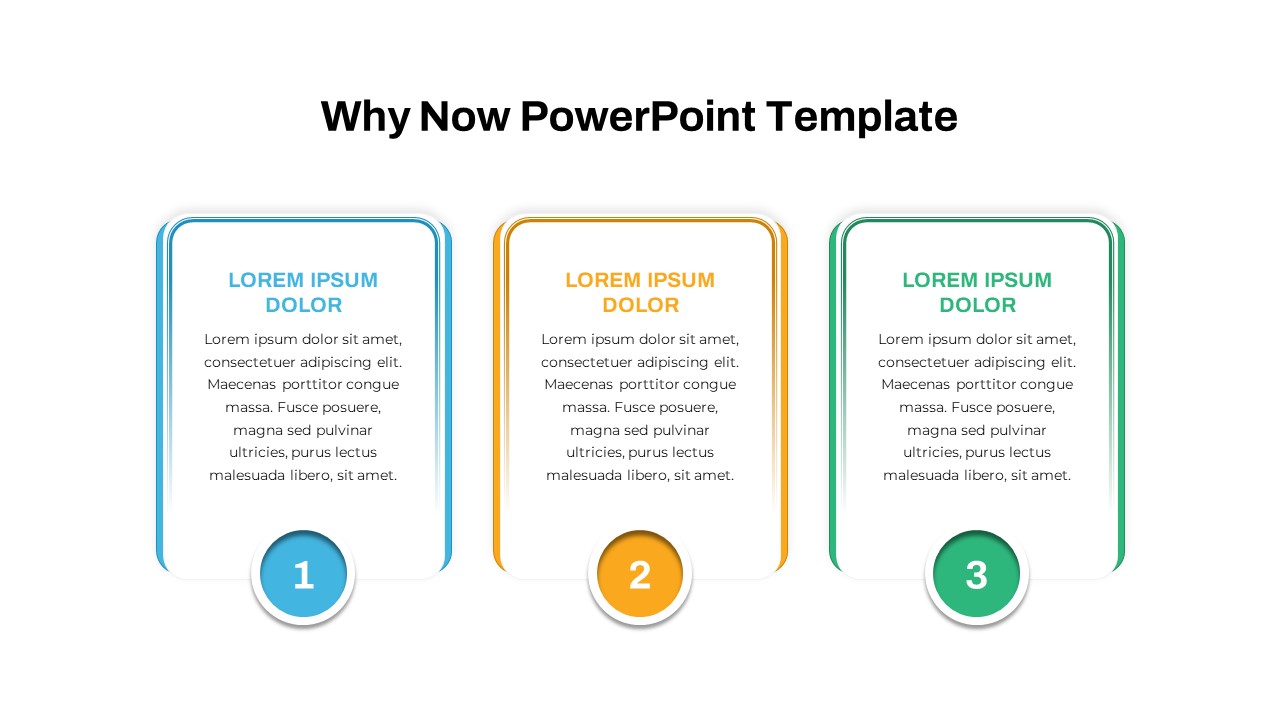
Why Now Numbered Cards Presentation Template for PowerPoint & Google Slides
Process
Fishbone Timeline Infographic Series Template for PowerPoint & Google Slides
Manufacturing
Modern Circle SWOT Analysis Diagram Template for PowerPoint & Google Slides
SWOT
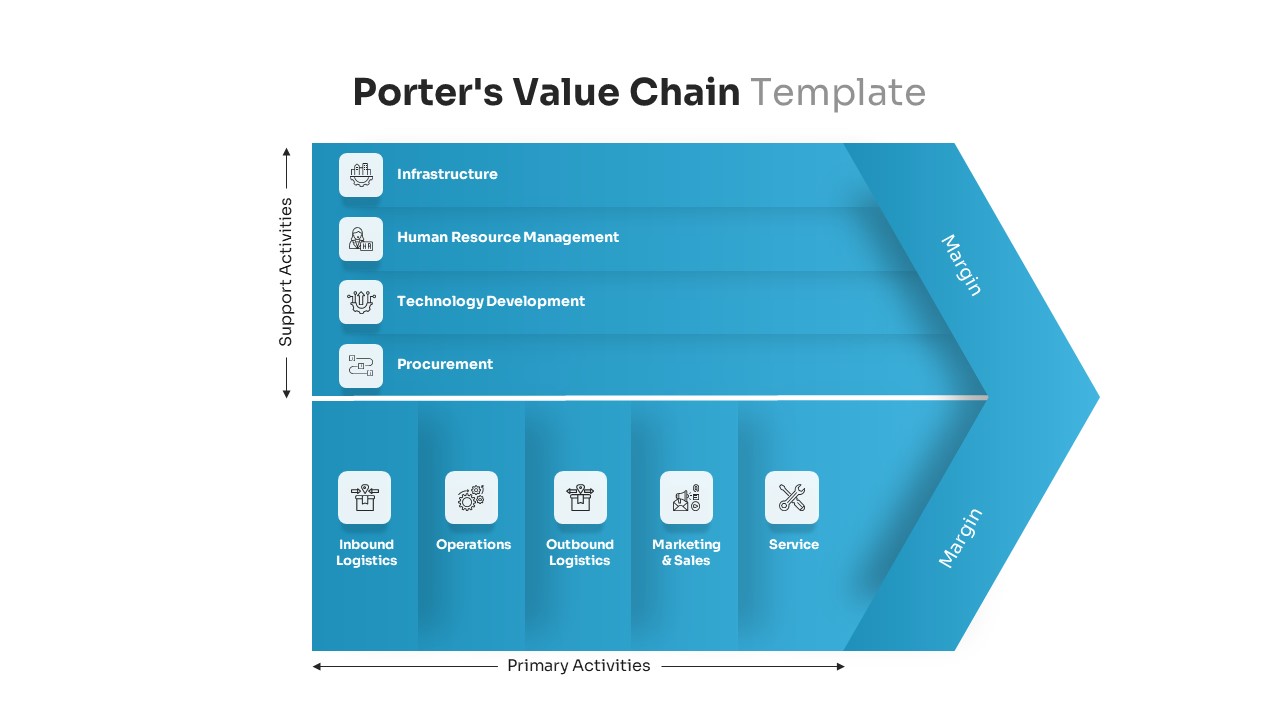
Porter’s Value Chain Analysis Diagram Template for PowerPoint & Google Slides
Business Strategy
Editable Force Field Analysis Diagram Template for PowerPoint & Google Slides
Business Plan
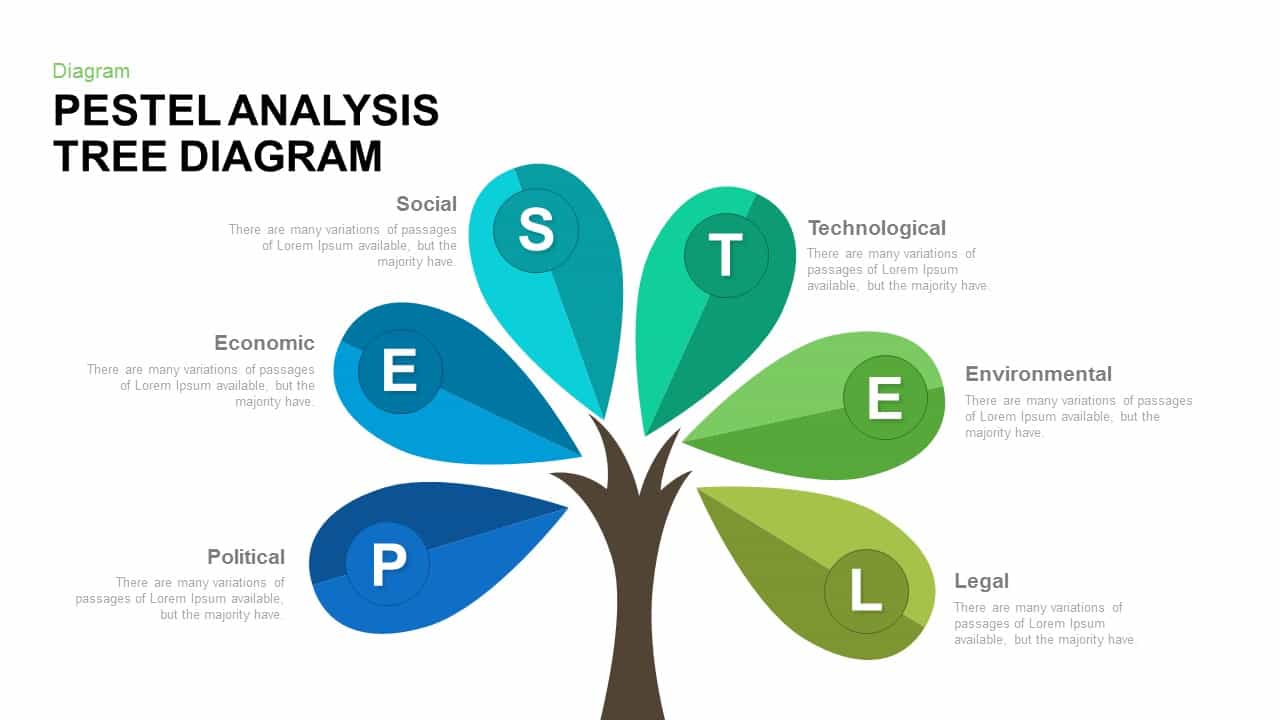
PESTEL Analysis Tree Diagram for PowerPoint & Google Slides
Process
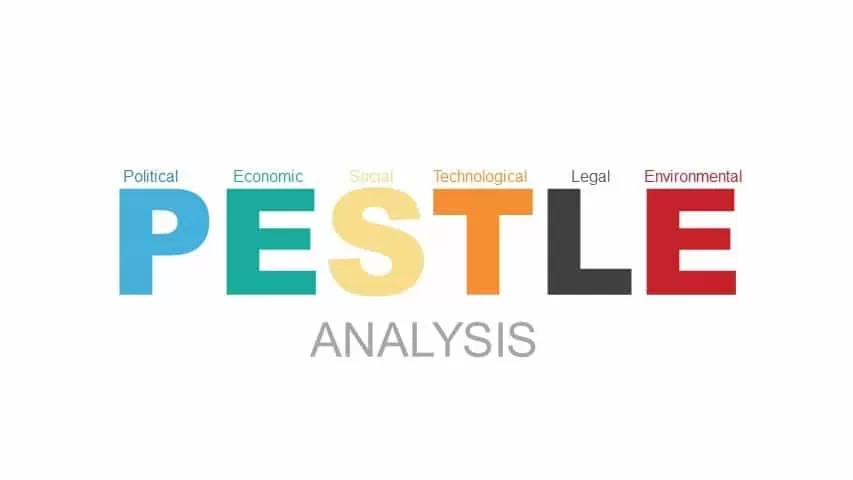
Professional PESTEL Analysis Diagram Template for PowerPoint & Google Slides
PEST
Puzzle-Style SWOT Analysis Table Diagram Template for PowerPoint & Google Slides
SWOT
PEST Analysis Circular Diagram Template for PowerPoint & Google Slides
PEST
PESTLE Analysis Table Layout Diagram Template for PowerPoint & Google Slides
PEST
SWOT Analysis Gear Diagram Slide Template for PowerPoint & Google Slides
SWOT

Interactive Gap Analysis Puzzle Diagram Template for PowerPoint & Google Slides
Gap
Cluster Analysis Infographic Diagram Template for PowerPoint & Google Slides
Business
Four-Quadrant SWOT Analysis Diagram Template for PowerPoint & Google Slides
SWOT
Business Target Analysis Diagram Template for PowerPoint & Google Slides
Circular
Butterfly SWOT Analysis Diagram Template for PowerPoint & Google Slides
SWOT
Four-Part SWOT Analysis Diagram Template for PowerPoint & Google Slides
SWOT

SWOT Analysis Infographic Diagram Template for PowerPoint & Google Slides
SWOT
IQ Scale Analysis Diagram template for PowerPoint & Google Slides
Employee Performance
Puzzle Piece SWOT Analysis Diagram Template for PowerPoint & Google Slides
Opportunities Challenges
Six-Step Business Analysis Diagram template for PowerPoint & Google Slides
Circular
Business Process Analysis Cycle Diagram Template for PowerPoint & Google Slides
Business Strategy
Experience Curve Analysis Diagram Template for PowerPoint & Google Slides
Business Strategy
Cost-Volume-Profit Analysis Diagram Template for PowerPoint & Google Slides
Finance

Colorful SWOT Analysis Diagram Template for PowerPoint & Google Slides
SWOT
Bottleneck Process Analysis Diagram Template for PowerPoint & Google Slides
Process
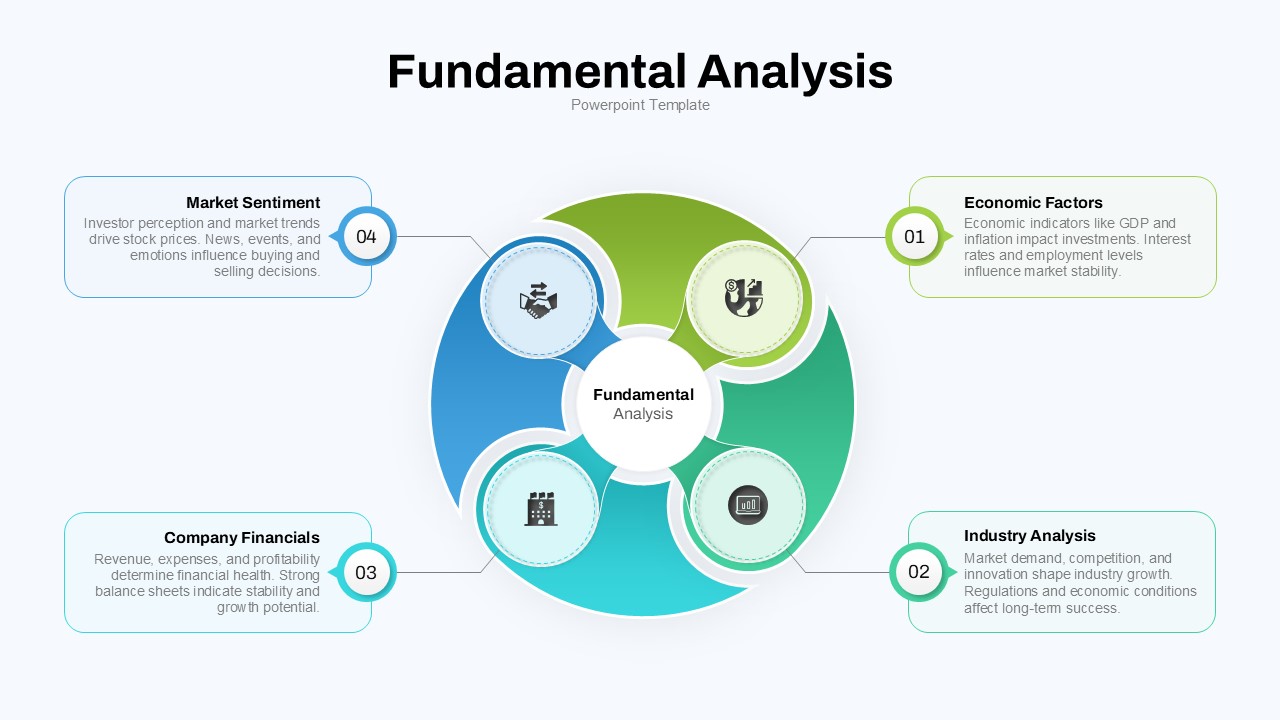
Fundamental Analysis Circular Diagram Template for PowerPoint & Google Slides
Circular
Cultural Web Analysis Circular Diagram Template for PowerPoint & Google Slides
Circular
DESTEP Marketing Analysis Diagram Template for PowerPoint & Google Slides
Circular
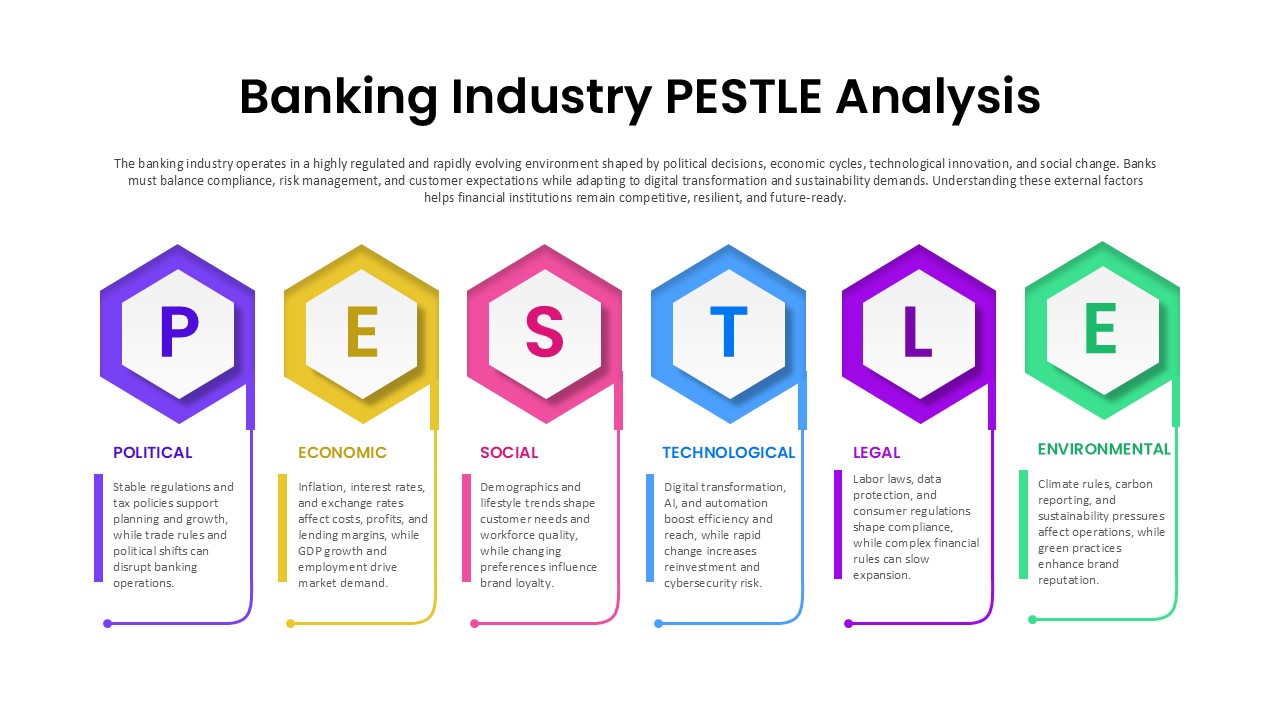
Banking Industry PESTLE Analysis Diagram Template for PowerPoint & Google Slides
PEST
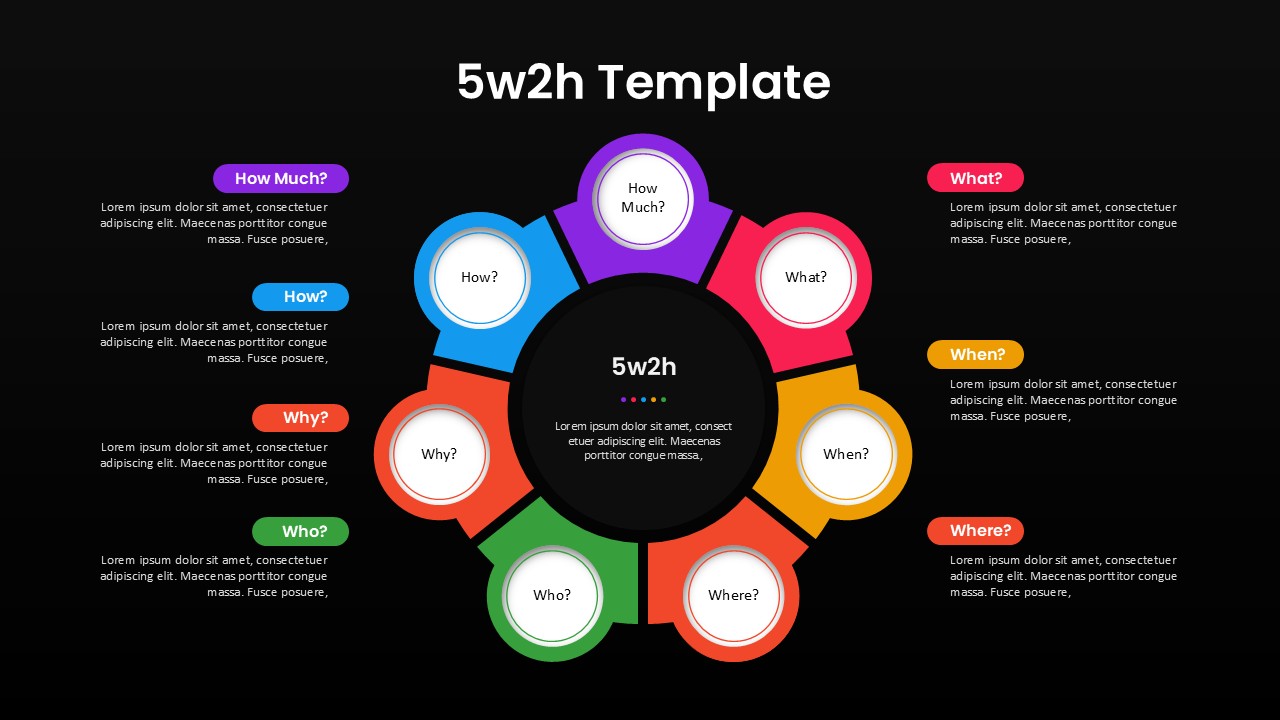
5W2H Analysis Radial Diagram Template for PowerPoint & Google Slides
Decision Tree
PEST Analysis PowerPoint Template for PowerPoint & Google Slides
Business Strategy
Mobile Data Analysis Chart template for PowerPoint & Google Slides
Charts
Donut Split Analysis template for PowerPoint & Google Slides
Pie/Donut
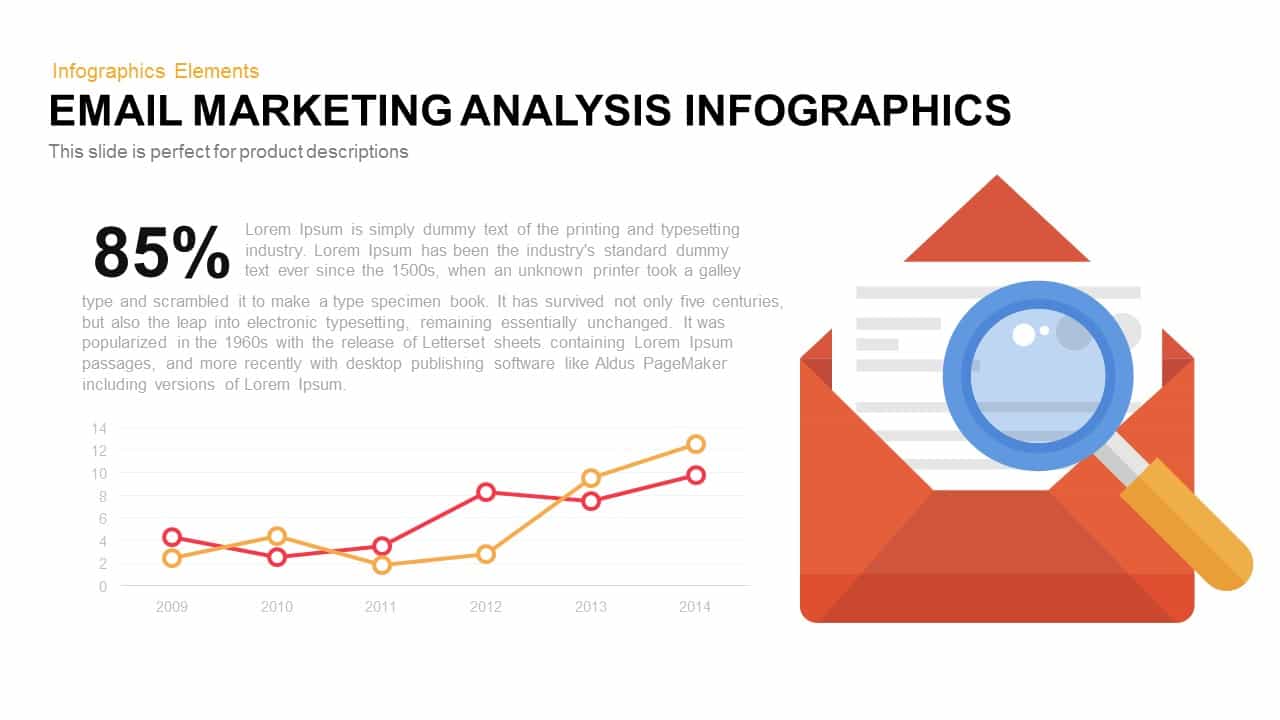
Email Marketing Analysis Infographics Templat for PowerPoint & Google Slides
Marketing
E-Learning Report Analysis Template for PowerPoint & Google Slides
Infographics
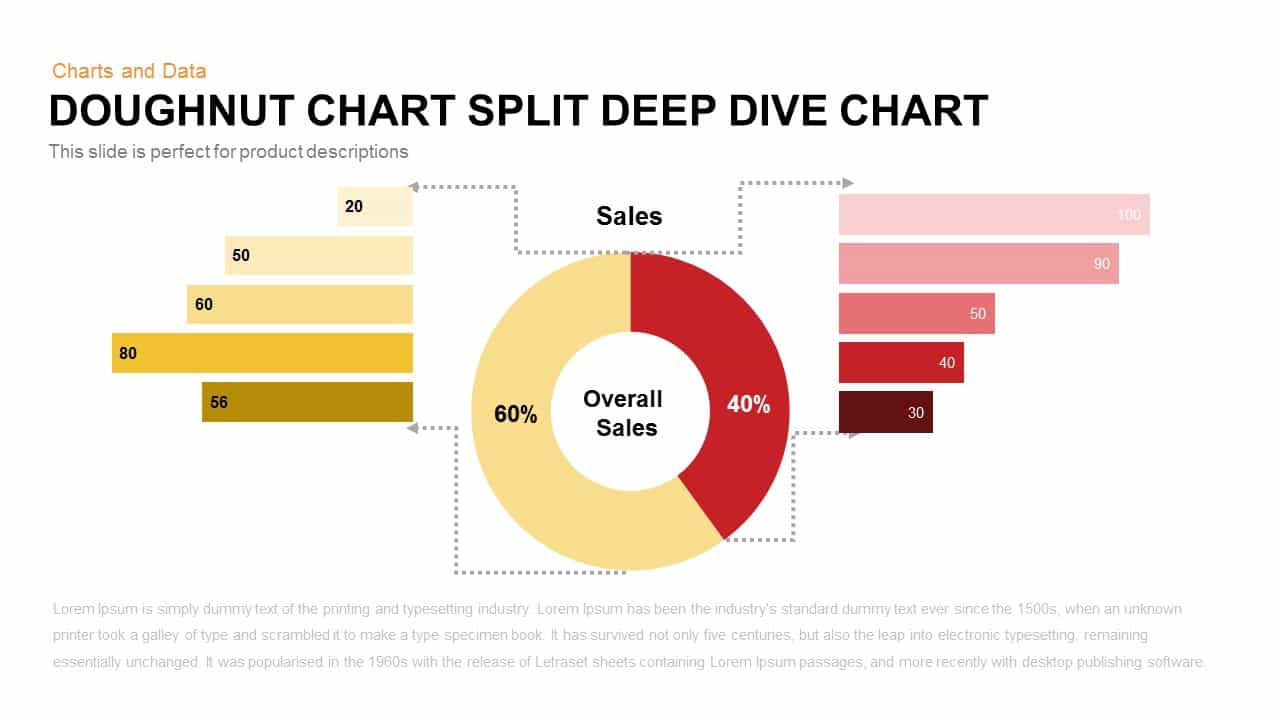
Split Doughnut Deep Dive Sales Analysis Template for PowerPoint & Google Slides
Pie/Donut
PESTLE Analysis Deck Template for PowerPoint & Google Slides
Decks
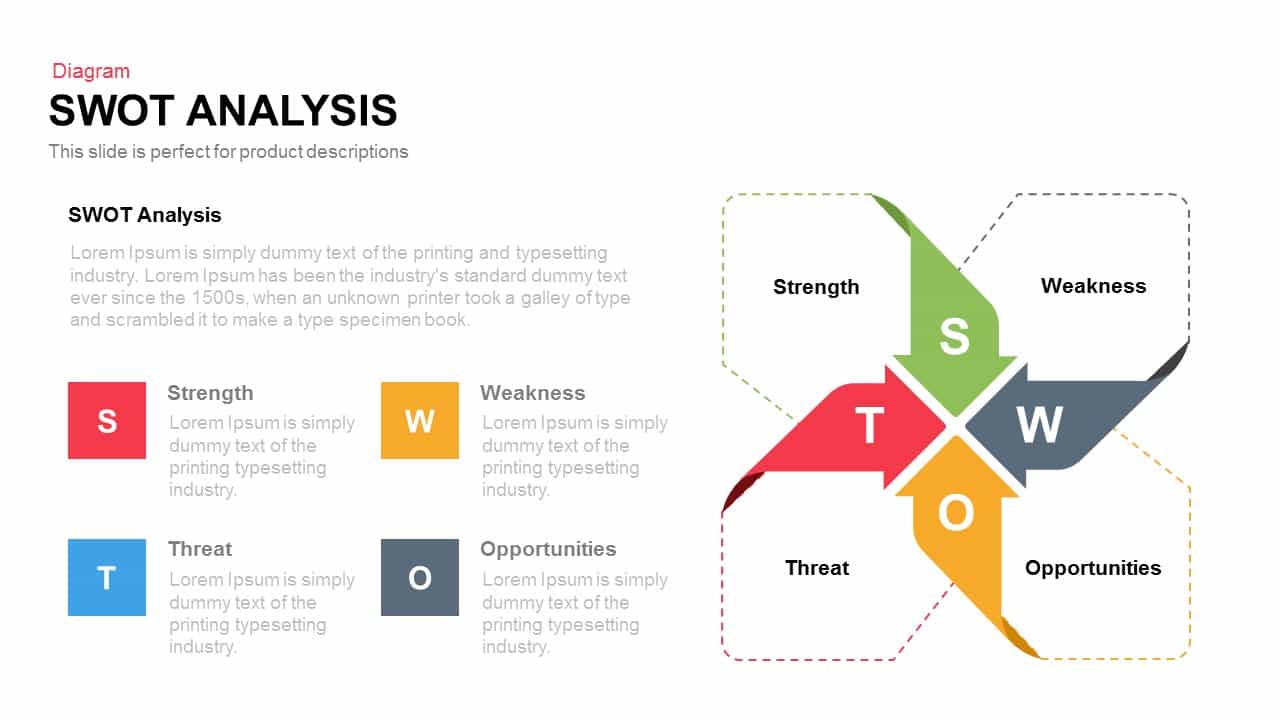
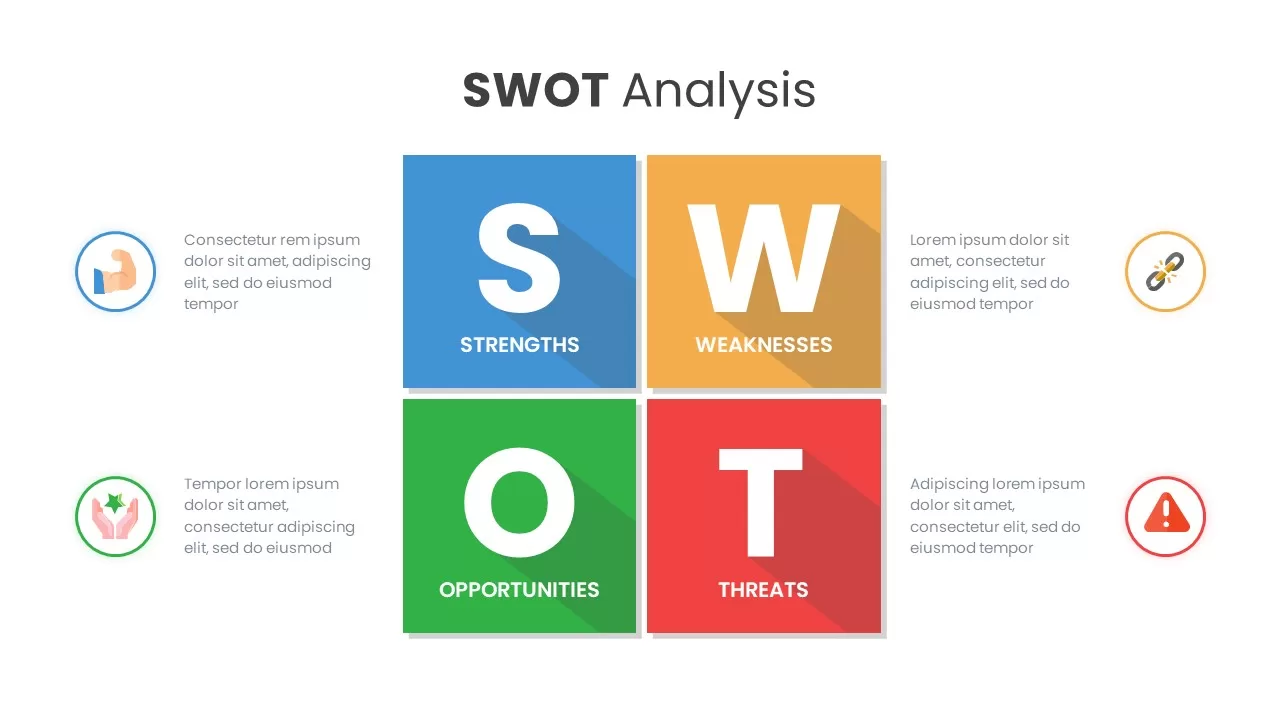
SWOT Analysis for PowerPoint & Google Slides
SWOT
Mobile User Data Analysis Infographic for PowerPoint & Google Slides
Process
Employee Skill Analysis Dashboard Template for PowerPoint & Google Slides
Employee Performance
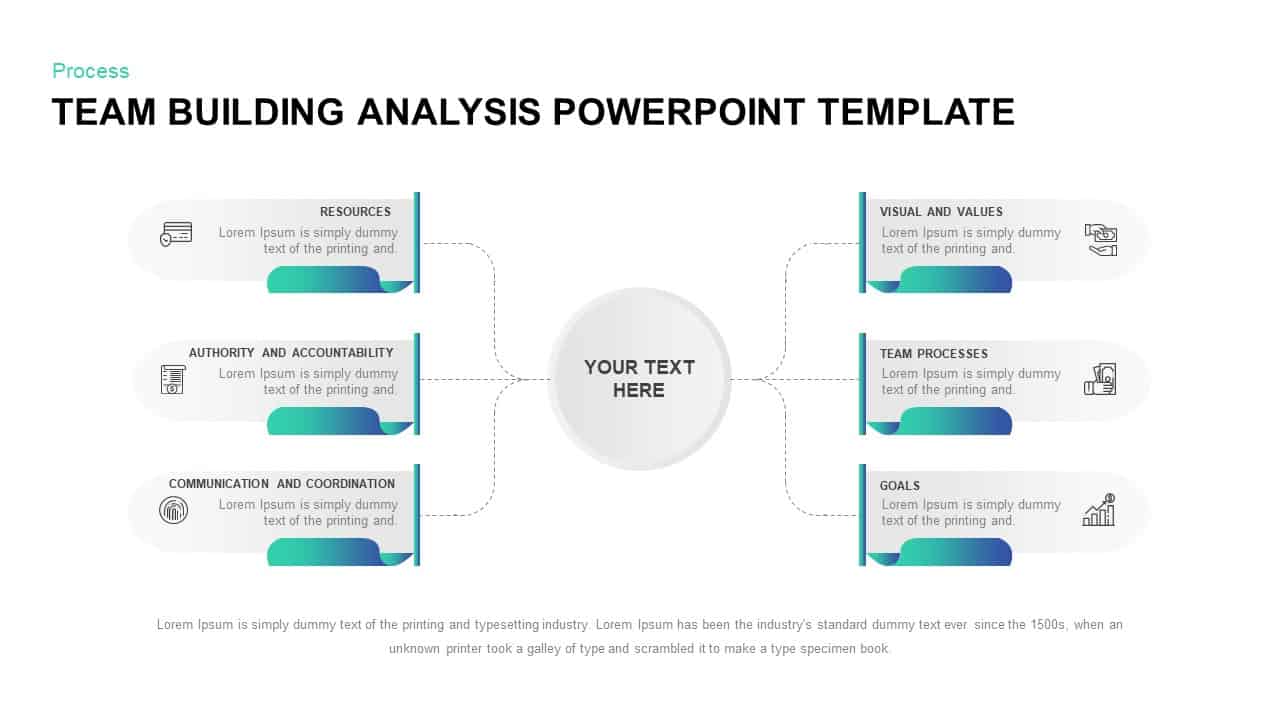
Team Building Hub-and-Spoke Analysis Template for PowerPoint & Google Slides
Process
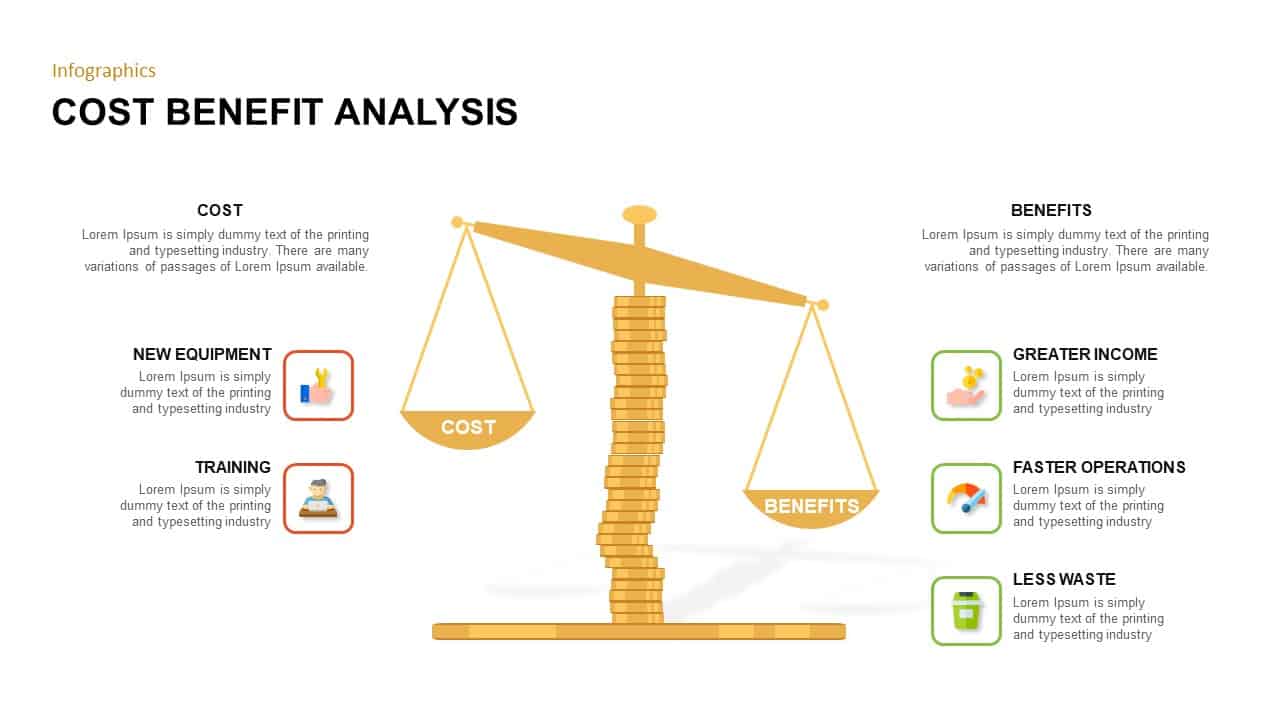
Cost Benefit Analysis infographic for PowerPoint & Google Slides
Comparison
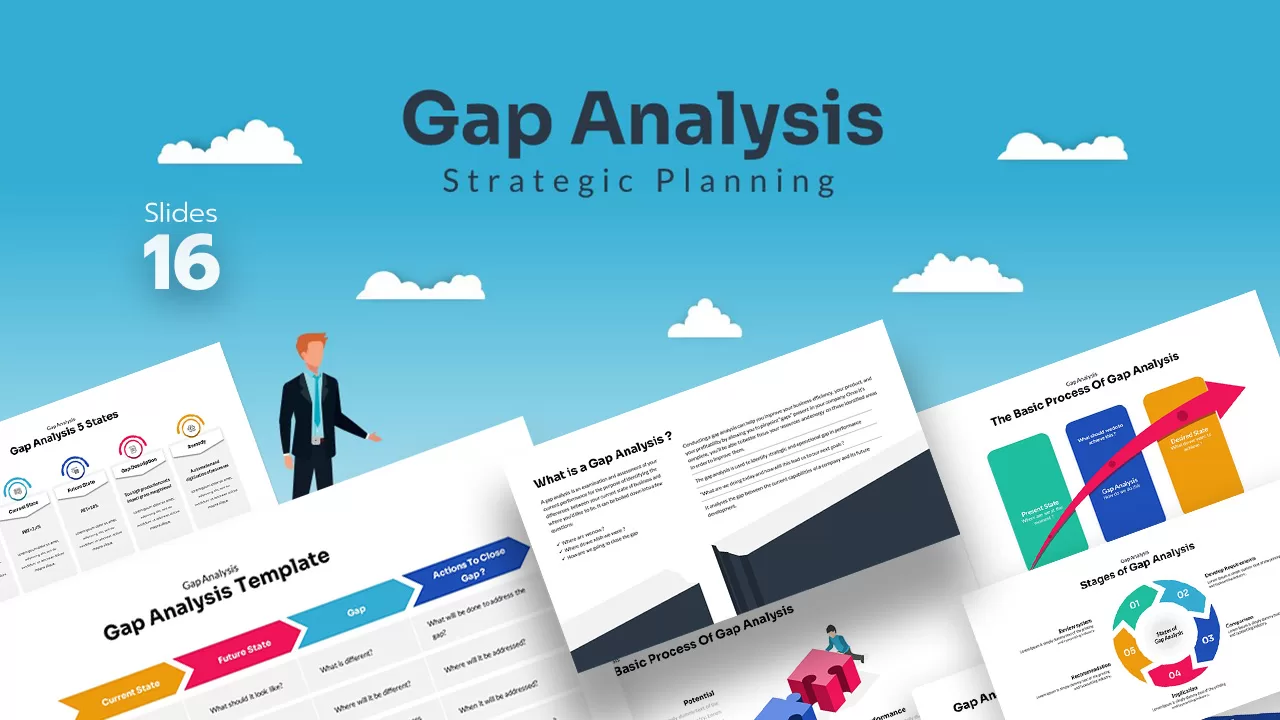
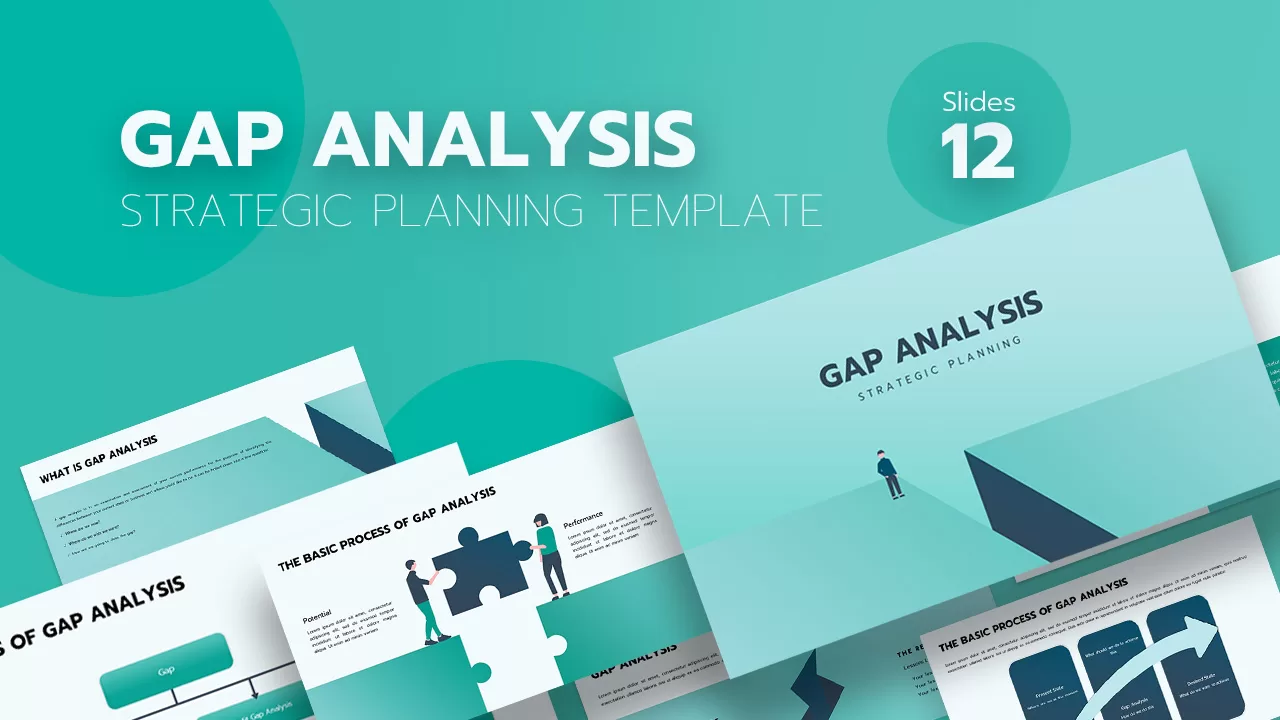
Gap Analysis Strategic Planning for PowerPoint & Google Slides
Business
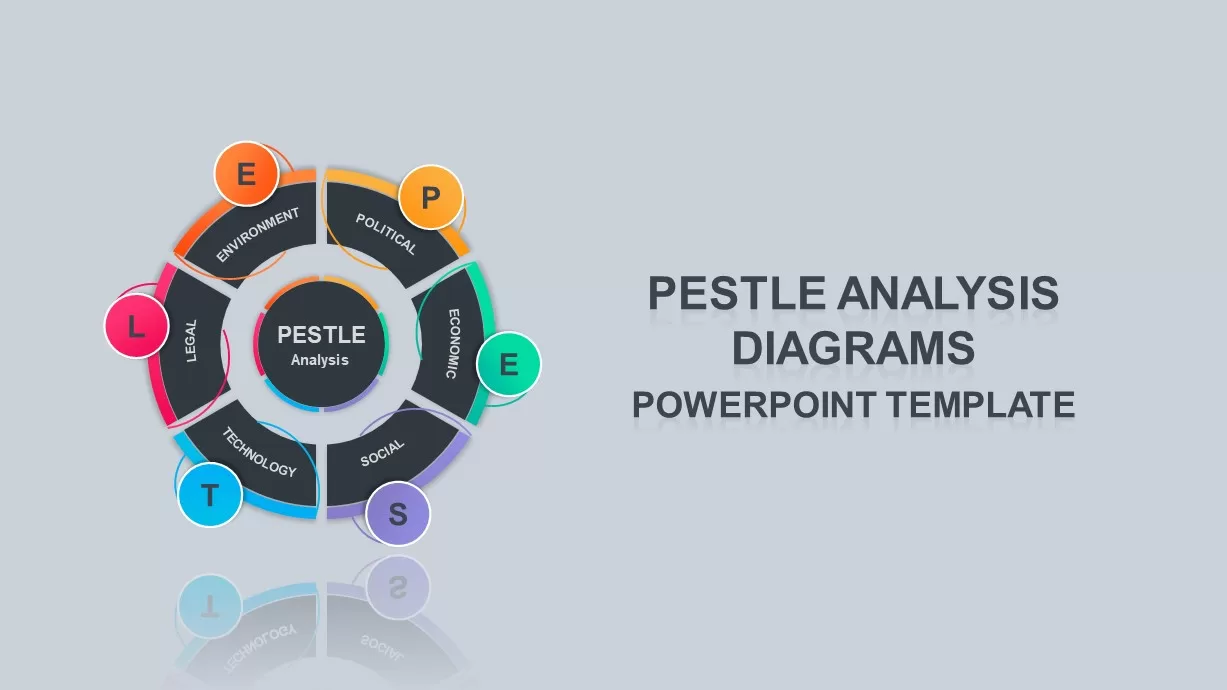
PESTLE and PEST Strategic Analysis Diagrams Template for PowerPoint & Google Slides
Business Strategy
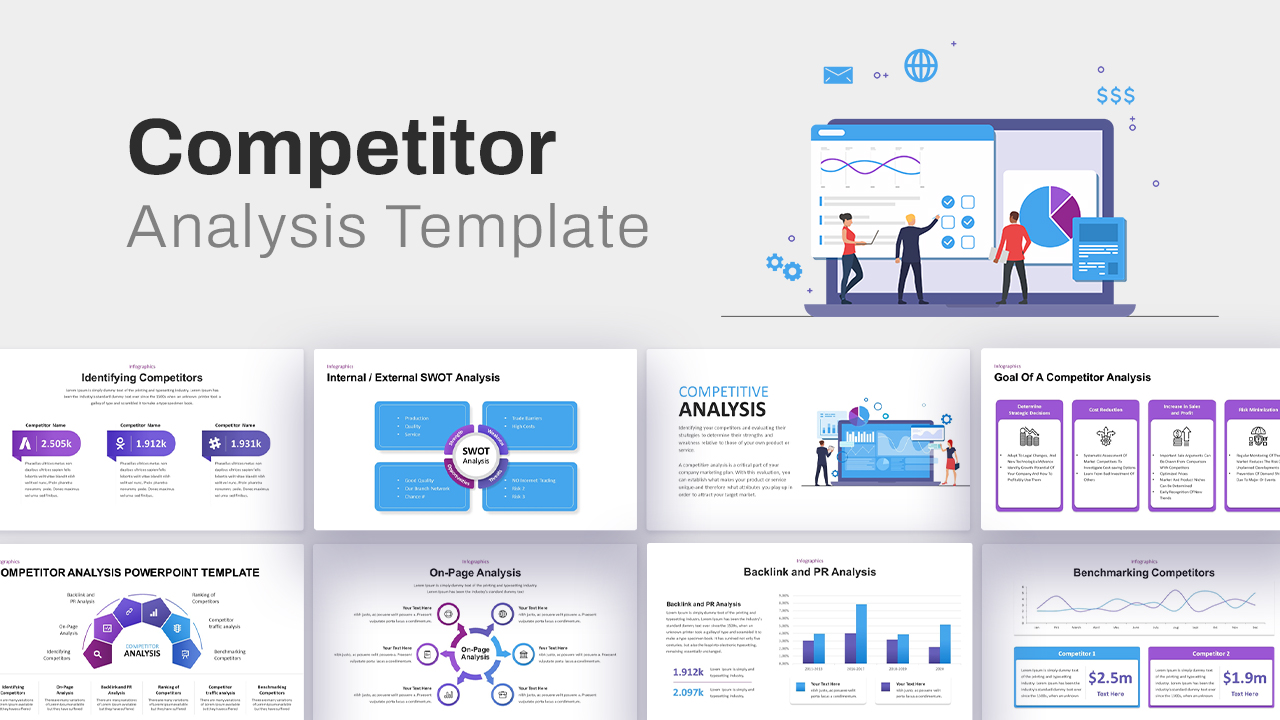
Comprehensive Competitor Analysis Template for PowerPoint & Google Slides
Competitor Analysis
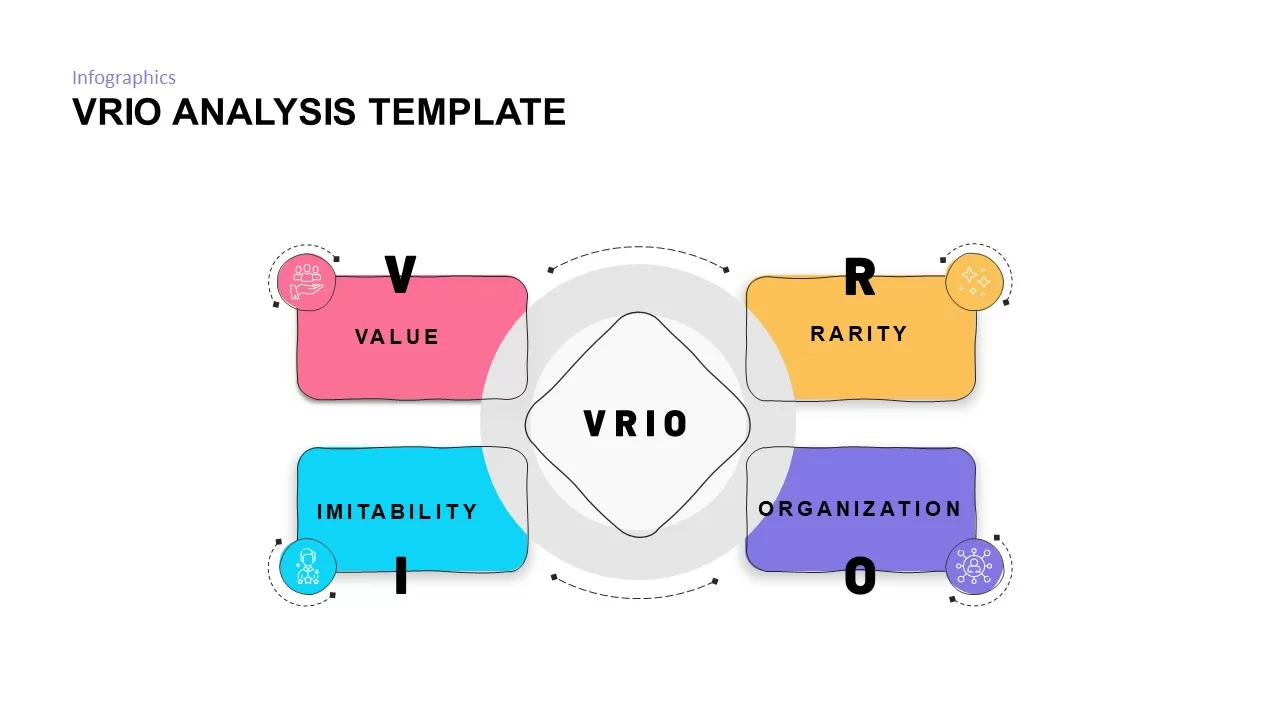
VRIO Analysis Framework template for PowerPoint & Google Slides
Business Strategy
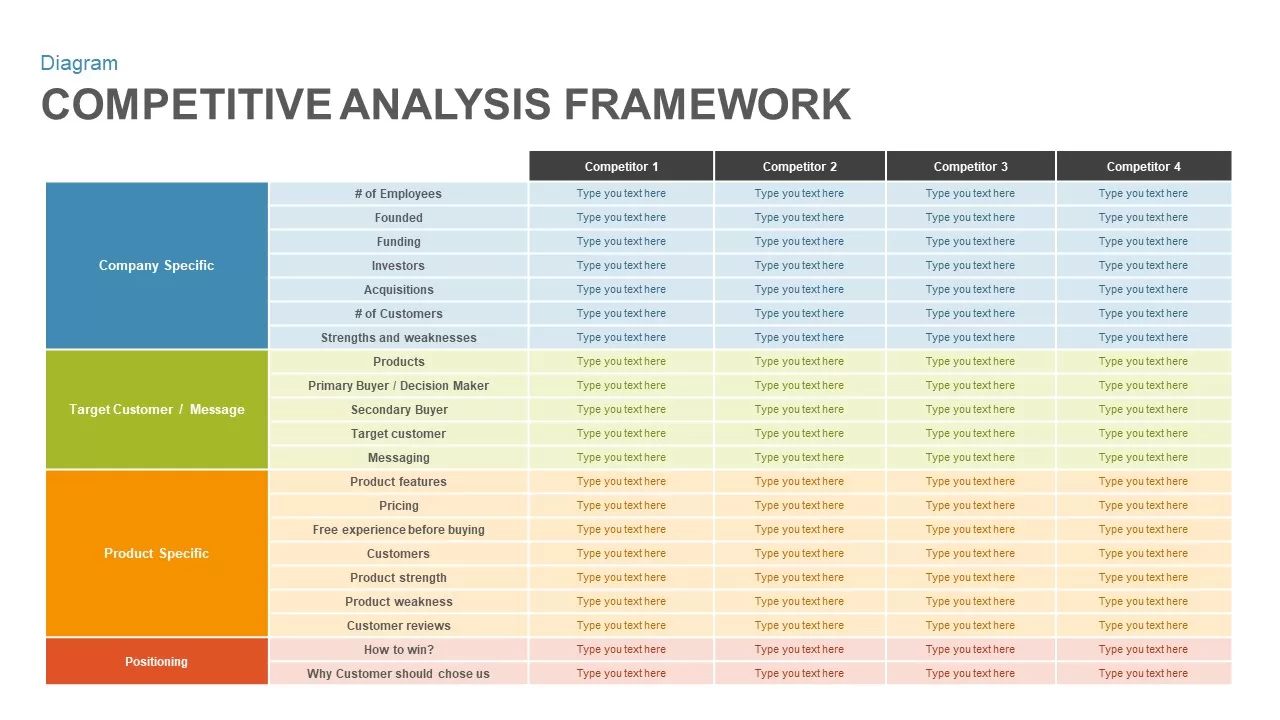
Competitive Analysis Framework template for PowerPoint & Google Slides
Business Report
Gap Analysis Strategic Planning Template for PowerPoint & Google Slides
Gap
SWOT Analysis Grid Infographic Template for PowerPoint & Google Slides
SWOT
Circular SWOT Analysis Infographic Template for PowerPoint & Google Slides
SWOT
Comprehensive Risk Impact Analysis Template for PowerPoint & Google Slides
Risk Management
Modern Colorful SWOT Quadrant Analysis Template for PowerPoint & Google Slides
SWOT
SWOT Analysis Overview template for PowerPoint & Google Slides
Business
SWOT Analysis template for PowerPoint & Google Slides
SWOT
Heat Map Analysis Template for PowerPoint & Google Slides
Risk Management
Six-Step Business Analysis Template for PowerPoint & Google Slides
Process
Comparative Market Analysis Template for PowerPoint & Google Slides
Comparison
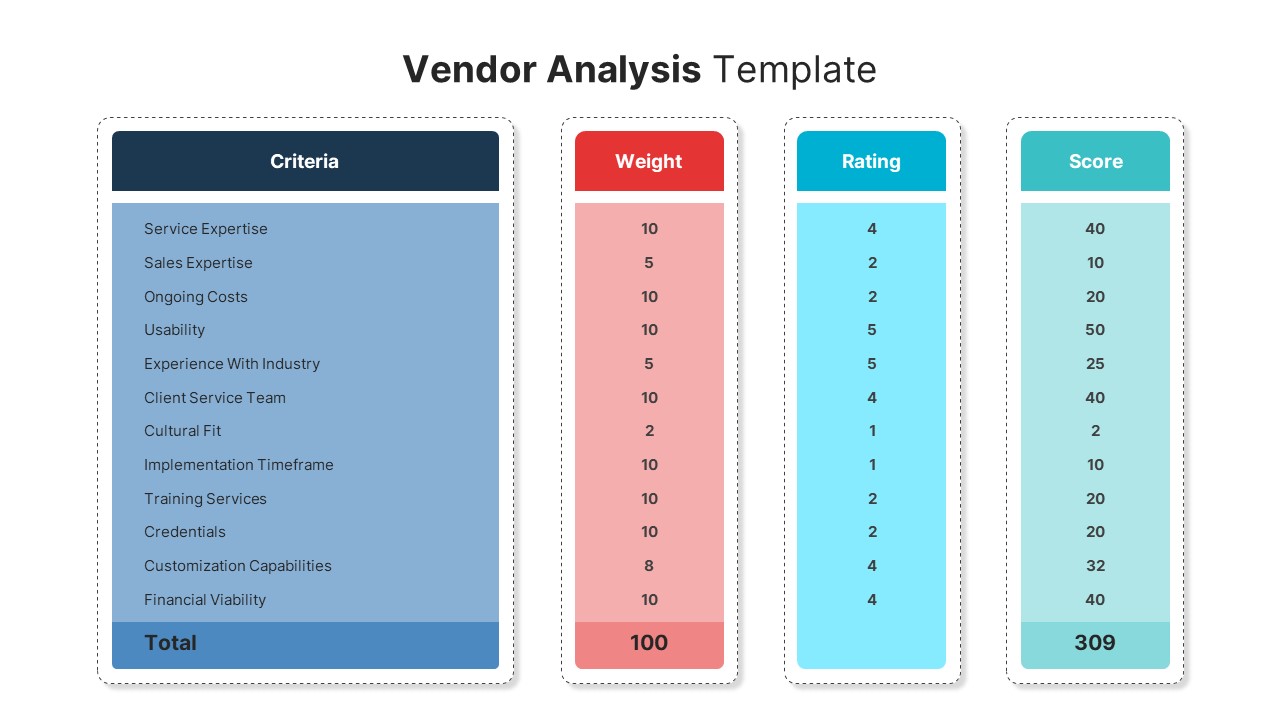
Vendor Analysis Criteria and Scoring template for PowerPoint & Google Slides
Business
Vendor Comparison Analysis template for PowerPoint & Google Slides
Comparison Chart
Social Media Analysis Metrics Slide Deck Template for PowerPoint & Google Slides
Digital Marketing
Simple Scatter Chart Analysis Template for PowerPoint & Google Slides
Comparison Chart
Simple Area Chart Data Trends Analysis Template for PowerPoint & Google Slides
Comparison Chart
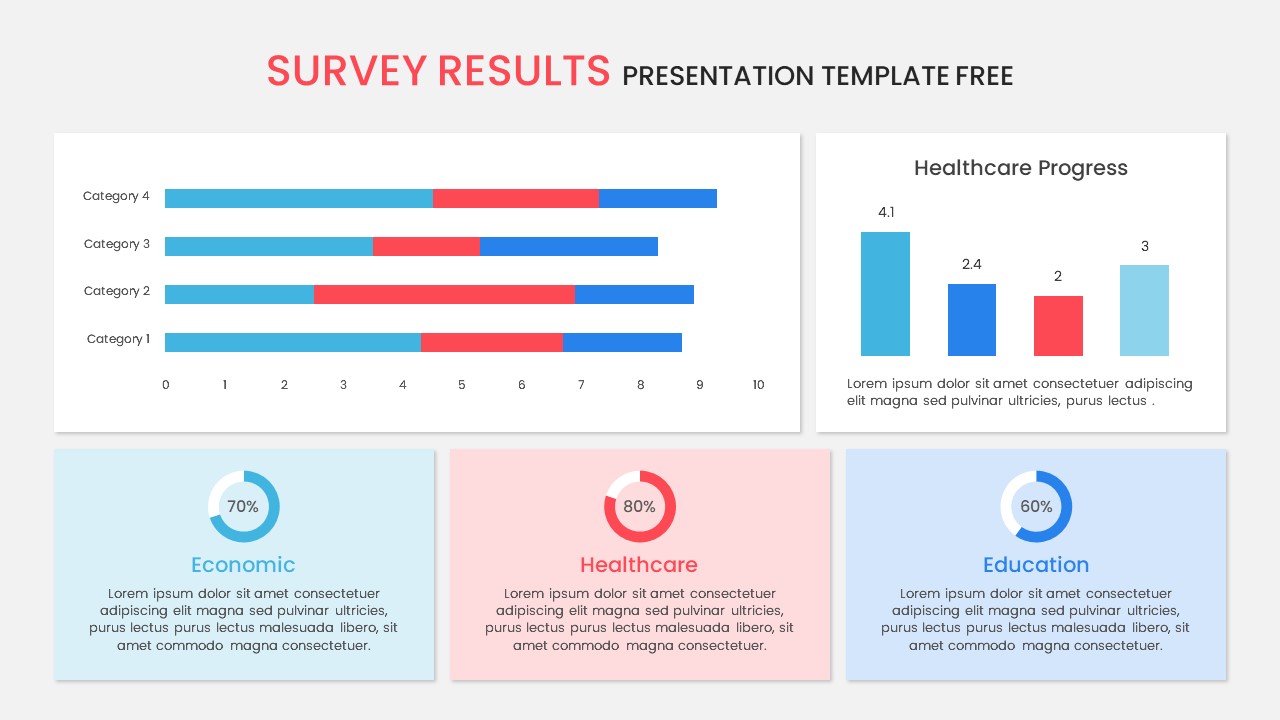
Free Survey Results Analysis Slide for PowerPoint & Google Slides
Business Report
Free
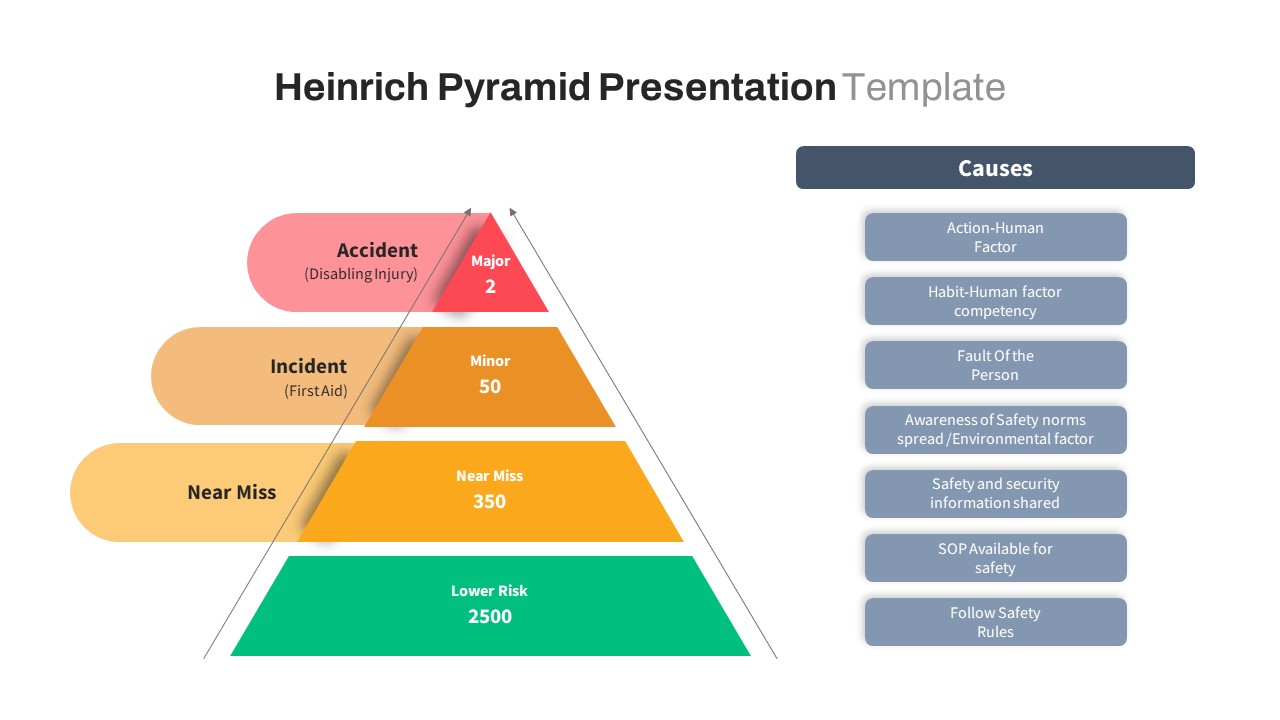
Heinrich Safety Pyramid Analysis Slide for PowerPoint & Google Slides
Pyramid
Proportional Area Chart Analysis Template for PowerPoint & Google Slides
Comparison Chart
Neon Dark Stock Market Analysis Template for PowerPoint & Google Slides
Pitch Deck
Free
Free Competitor Analysis Matrix Template for PowerPoint & Google Slides
Competitor Analysis
Free
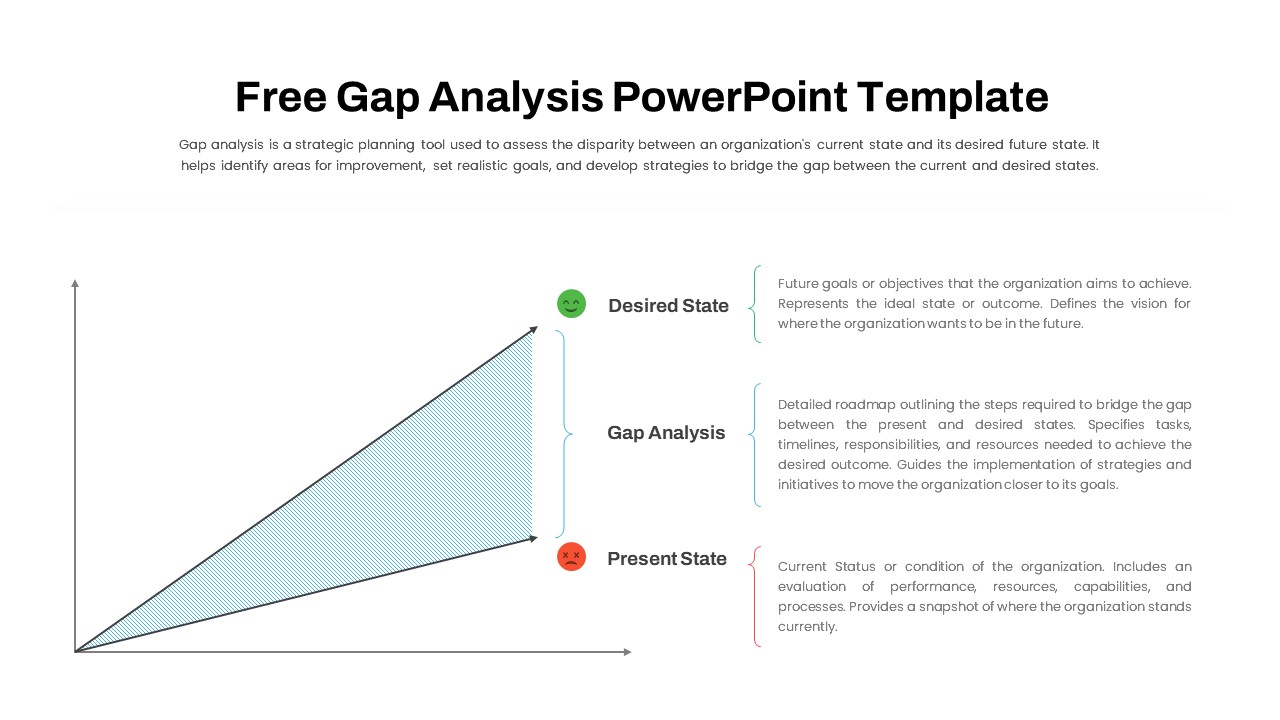
Free Comprehensive Gap Analysis Framework Template for PowerPoint & Google Slides
Opportunities Challenges
Free
Quarterly Network Volume Analysis Template for PowerPoint & Google Slides
Business Report
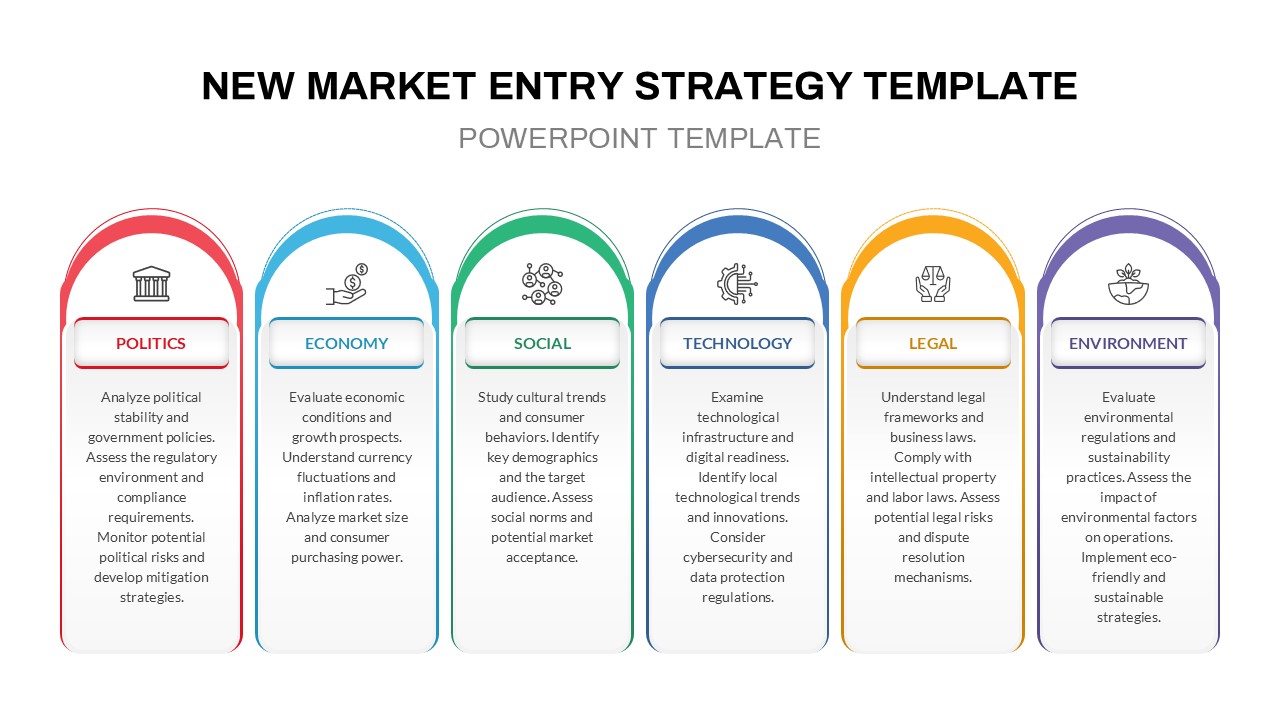
PESTLE Analysis for Market Entry Template for PowerPoint & Google Slides
PEST
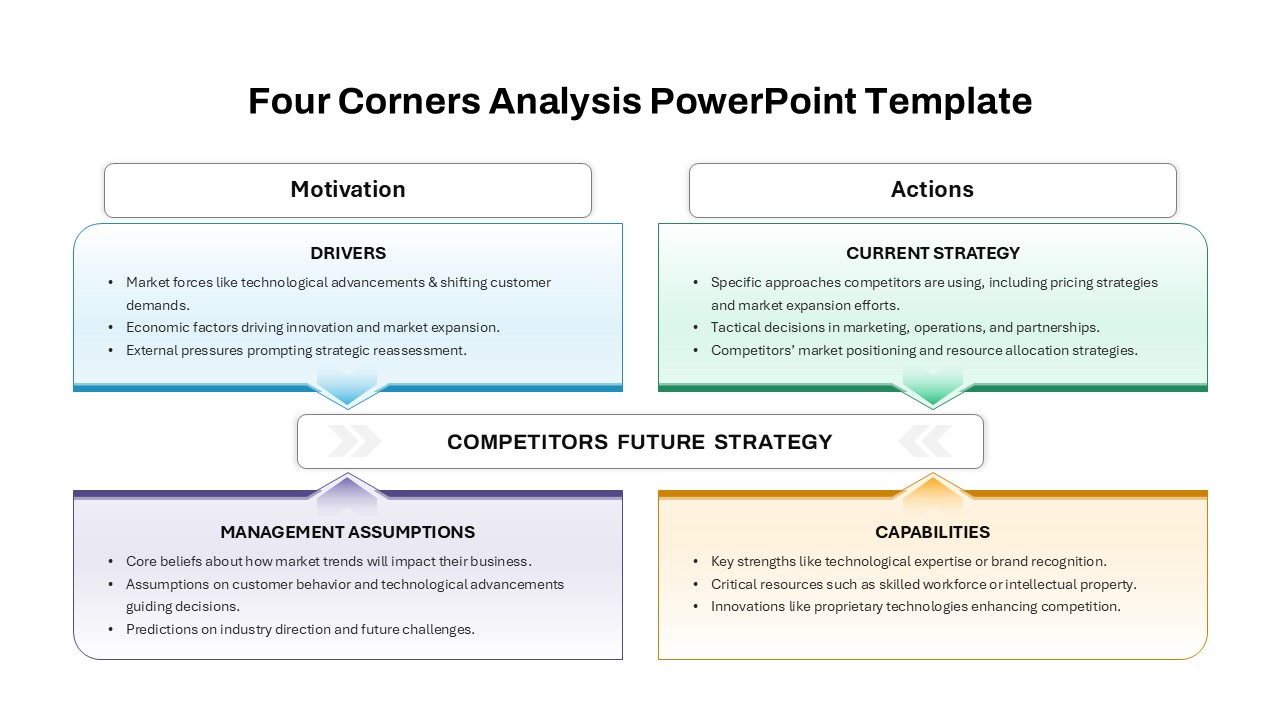
Four-Corners Strategic Analysis Quadrant Template for PowerPoint & Google Slides
SWOT
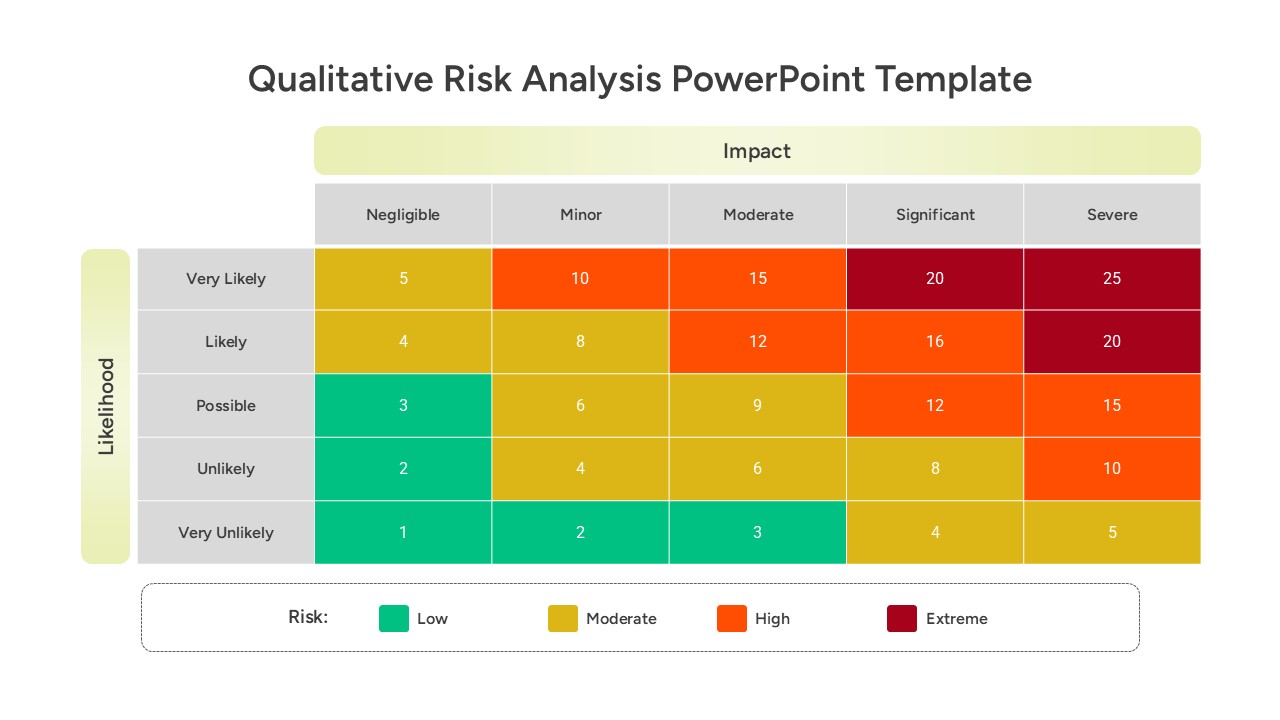
Qualitative Risk Analysis template for PowerPoint & Google Slides
Business
Quantitative Risk Analysis Matrix template for PowerPoint & Google Slides
Risk Management
Colorful SWOT Analysis Quadrant Template for PowerPoint & Google Slides
SWOT
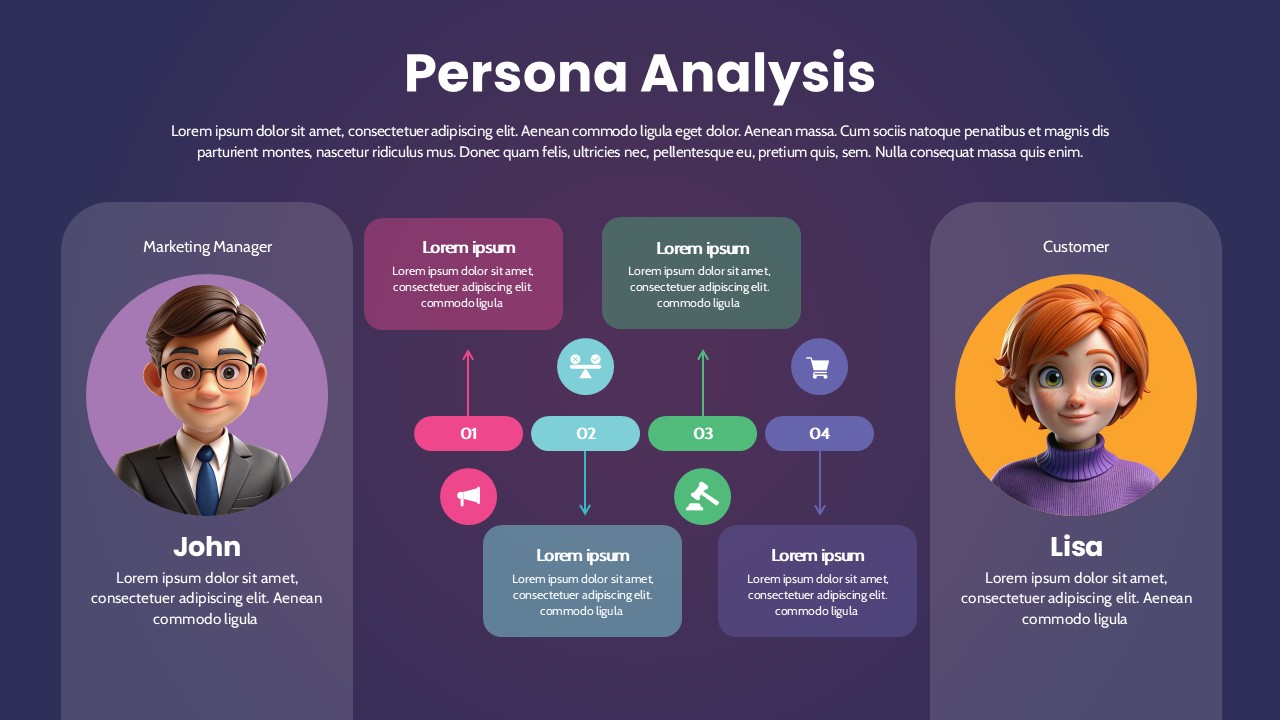
Persona Analysis Template for PowerPoint & Google Slides
Infographics
Personal SWOT Analysis Matrix Cards Template for PowerPoint & Google Slides
SWOT
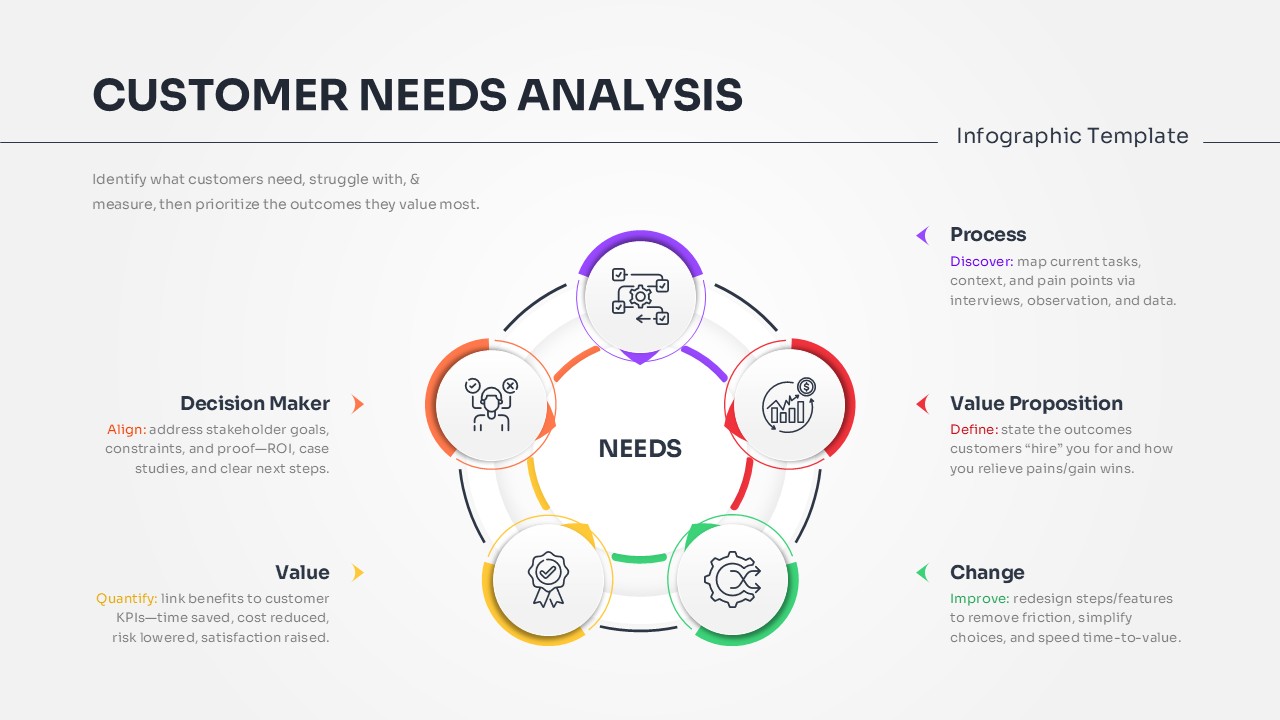
Customer Needs Analysis Template for PowerPoint & Google Slides
Customer Experience
Data Gap Analysis Template for PowerPoint & Google Slides
Business
IT Gap Analysis Assessment Matrix Template for PowerPoint & Google Slides
Information Technology