4 Factors Circular Diagram Infographic Template for PowerPoint & Google Slides


Description
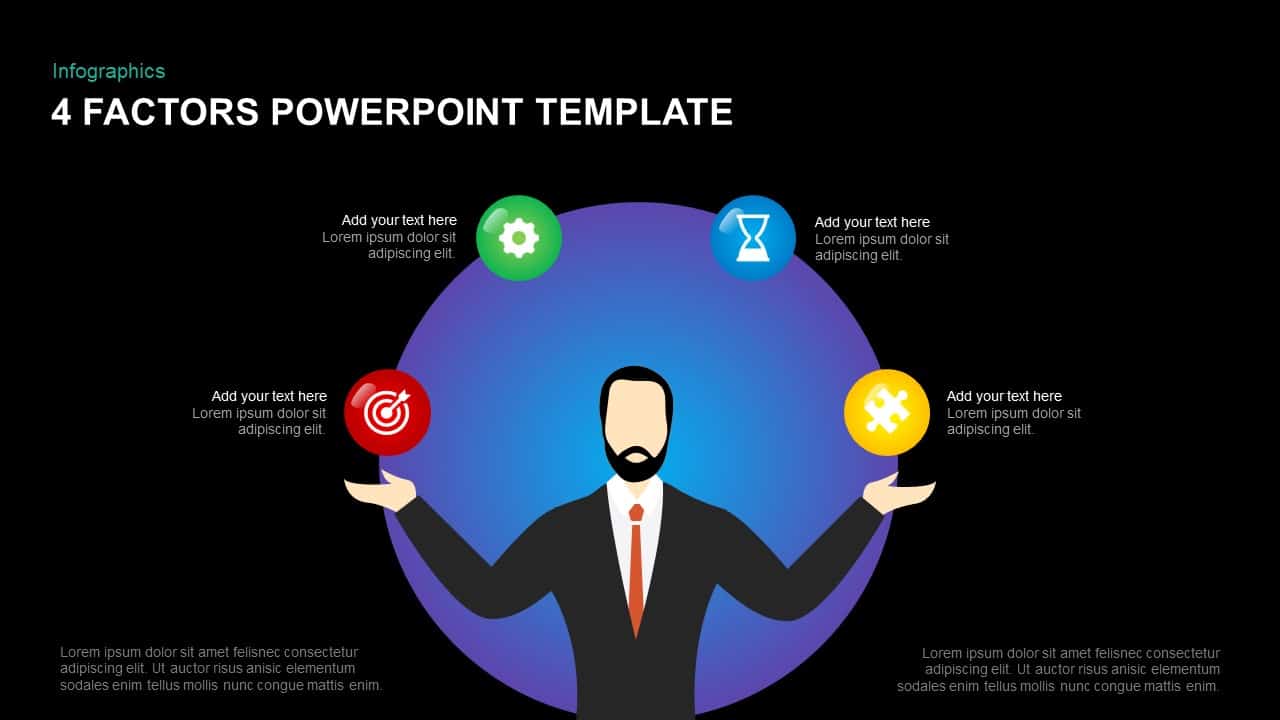
Elevate your presentations with this dynamic four-factor circular diagram slide, designed to highlight key success drivers around a central figure. The infographic features a gradient blue-purple backdrop encircled by four vibrant icons representing Strategy (target), Efficiency (gear), Time Management (hourglass), and Collaboration (puzzle piece). Each icon sits atop a colored circular node, connected to editable text callouts by clean arrow pointers. Subtle drop shadows and smooth gradients lend depth and a polished modern aesthetic, making complex information immediately digestible.
Engineered for seamless editing, the slide harnesses fully editable vector shapes, PowerPoint and Google Slides master layouts, and user-friendly placeholders. Easily swap icons to match your own factors, adjust node colors to reflect brand guidelines, or fine-tune callout positions with drag-and-drop controls. Typography is standardized with theme fonts and size presets for consistent readability across all devices. The clean white slide background ensures compatibility with corporate templates and third-party theme packs, while aspect ratio locking preserves layout integrity during resizing.
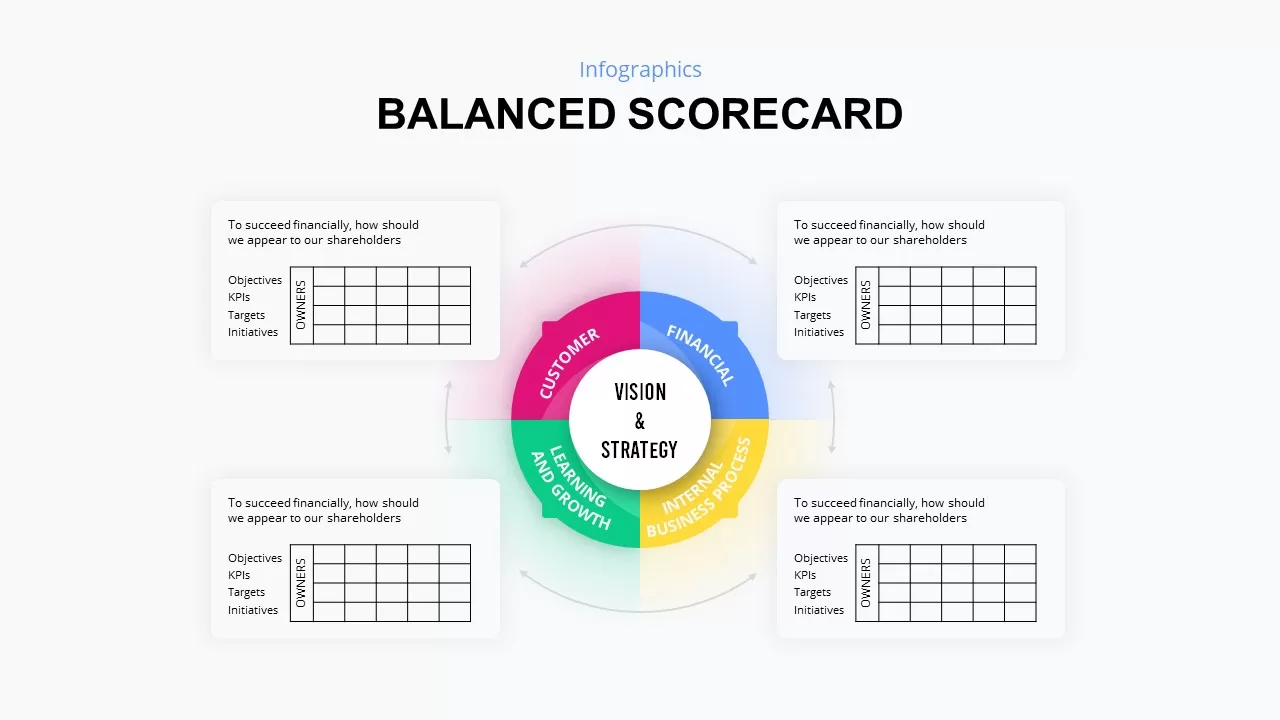
Optimize this asset for leadership briefings, stakeholder workshops, and strategic planning meetings. Use each callout to outline performance metrics, KPI targets, or process improvements. The circular arrangement naturally supports both clockwise and counterclockwise narratives, ideal for illustrating cyclical processes, balanced scorecards, or risk assessments. With the central figure acting as a focal anchor, audiences can quickly associate each factor with leadership roles or departmental responsibilities.
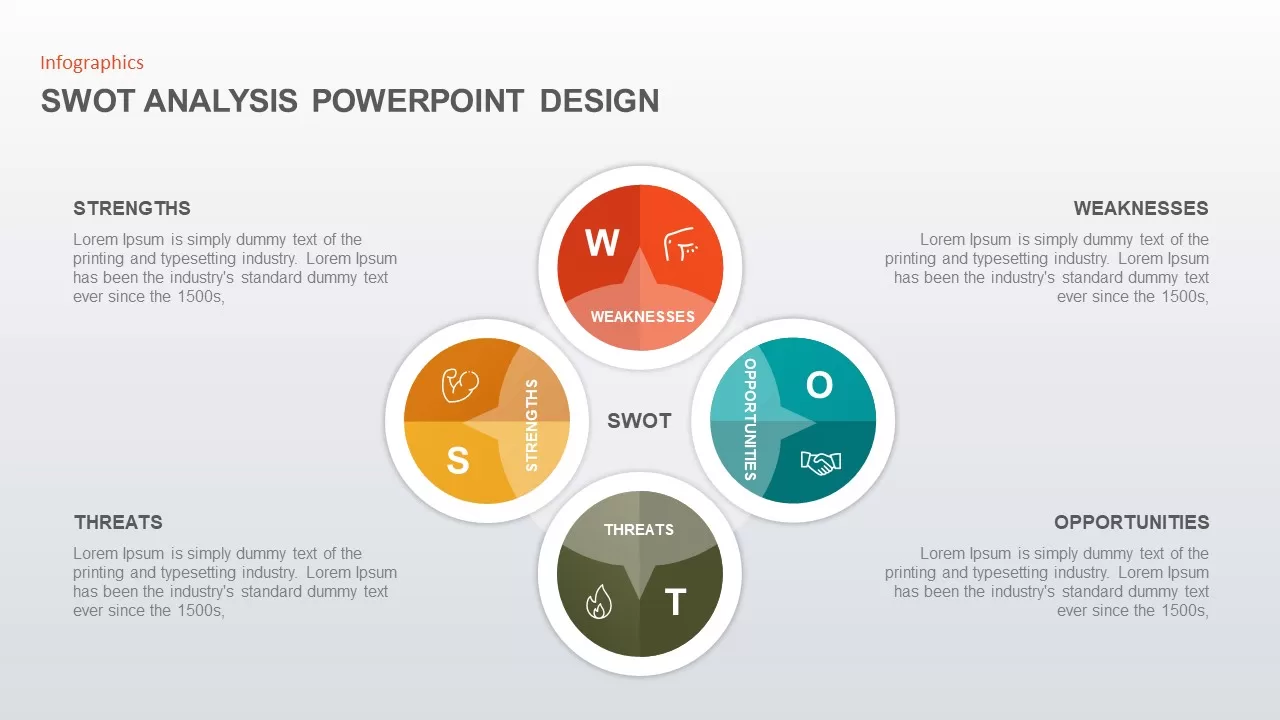
Beyond factor mapping, repurpose the layout for SWOT analyses, four-quadrant comparisons, or pros-and-cons evaluations. Hide unused nodes, duplicate the design for additional factors, or convert the background circle into a ring chart for data visualization. Compatible with custom color themes, slide transitions, and animation placeholders in both PowerPoint and Google Slides, this versatile infographic accelerates deck creation and ensures polished, professional delivery every time.
Who is it for
Business leaders, project managers, strategists, and consultants seeking to illustrate key performance drivers will benefit from this slide. Trainers, HR directors, and marketing teams can also leverage it to present balanced scorecards, process improvements, or departmental KPIs.
Other Uses
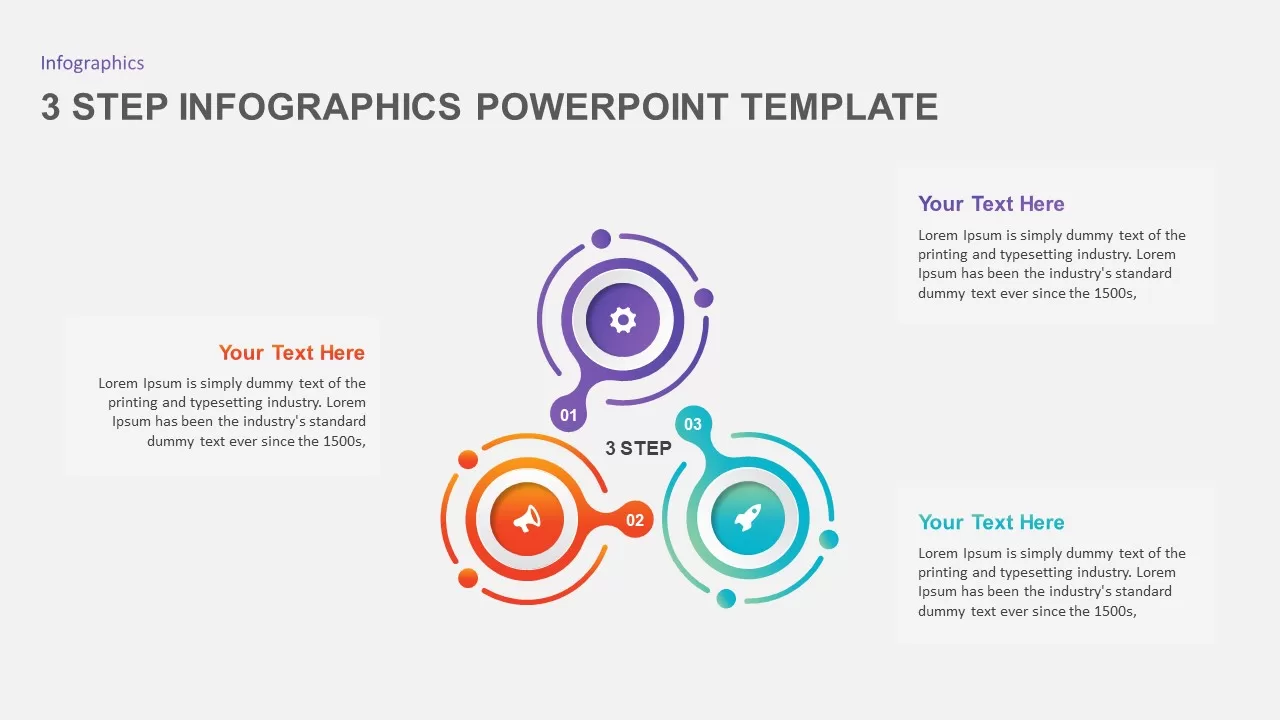
Adapt this layout for four-step roadmaps, pros-and-cons charts, SWOT diagrams, or executive summary overviews. Swap icons, hide nodes, or extend the circle for more factors; apply brand color themes to suit board presentations, workshops, and client pitches seamlessly.
Login to download this file

Item ID
SB01293
Related Templates

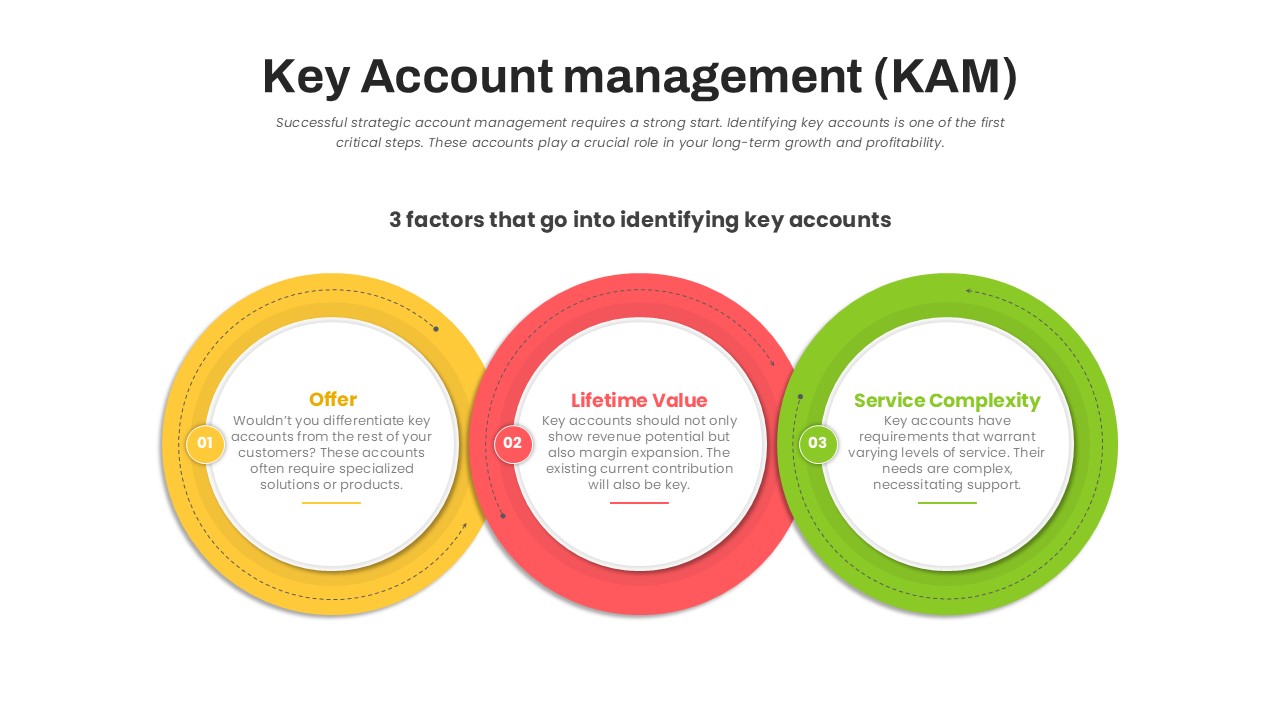
Key Account Management Circular Factors Template for PowerPoint & Google Slides
Circular
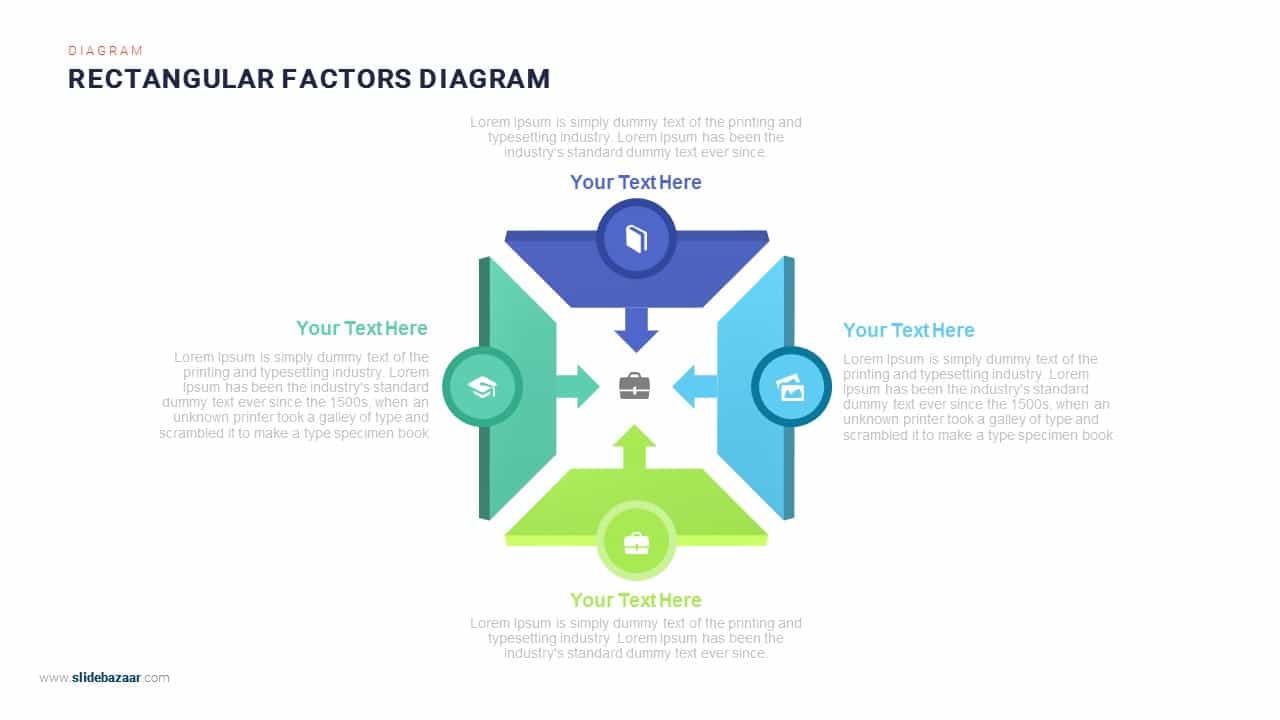
Four-Arrows Rectangular Factors Diagram Template for PowerPoint & Google Slides
Process
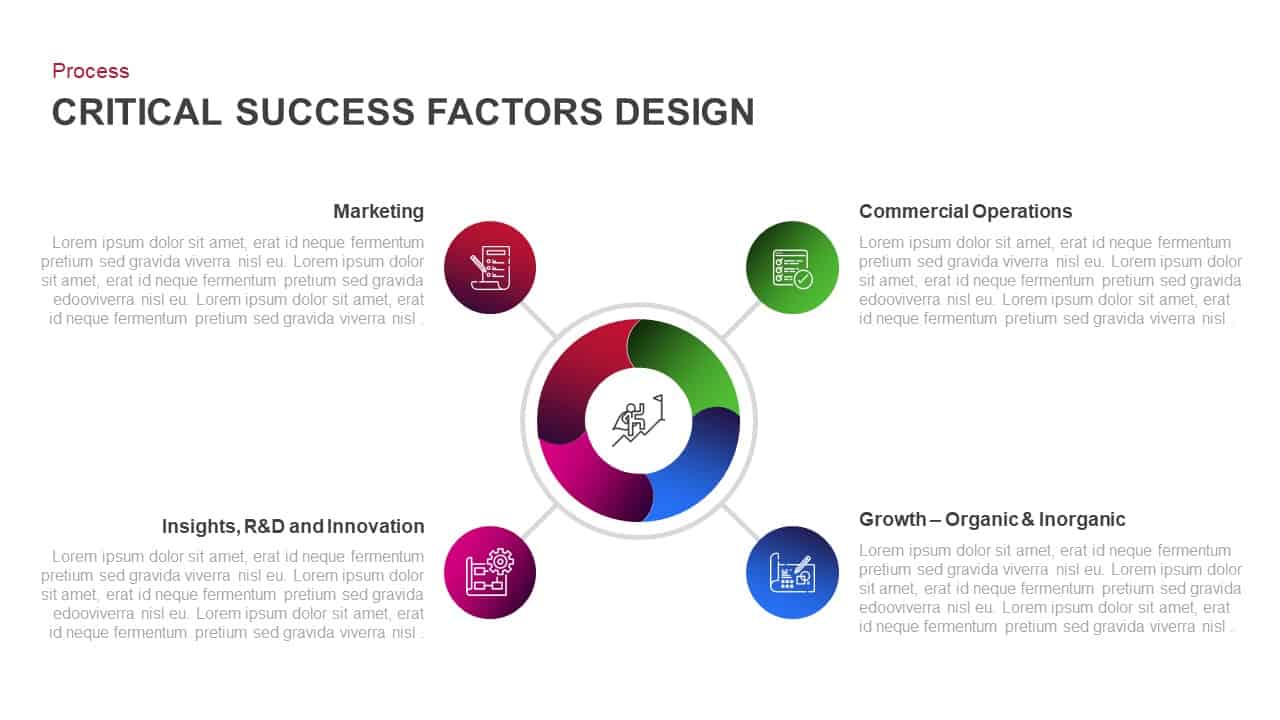
Critical Success Factors Diagram Template for PowerPoint & Google Slides
Infographics
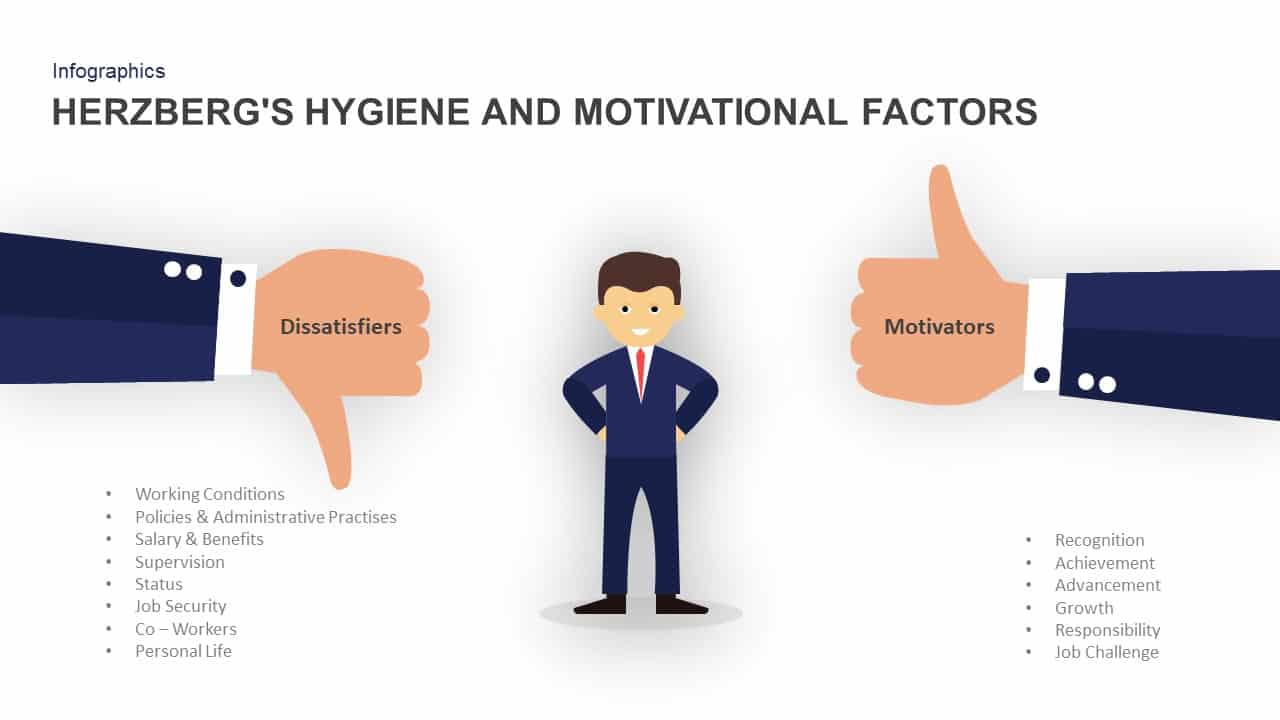
Herzberg’s Hygiene & Motivation Factors Template for PowerPoint & Google Slides
Employee Performance
Distracting Factors at Work Bar Chart Template for PowerPoint & Google Slides
Bar/Column
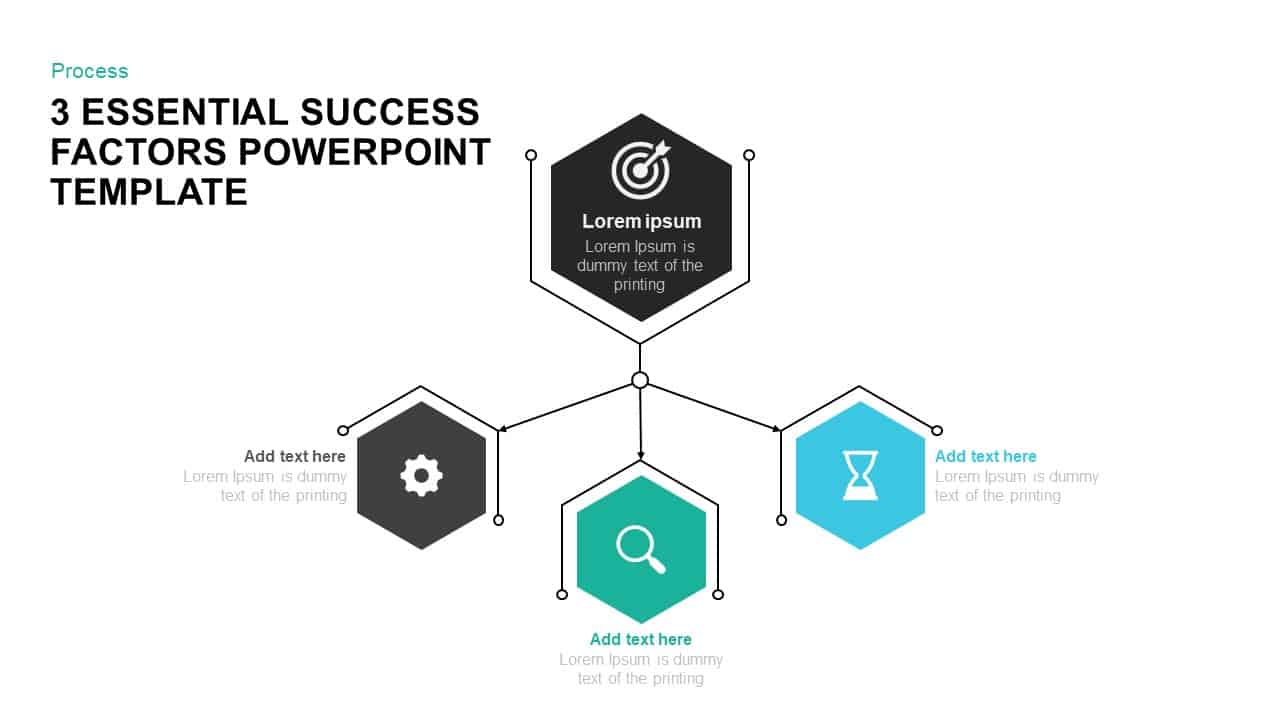
3 Success Factors Hexagon Process Template for PowerPoint & Google Slides
Process
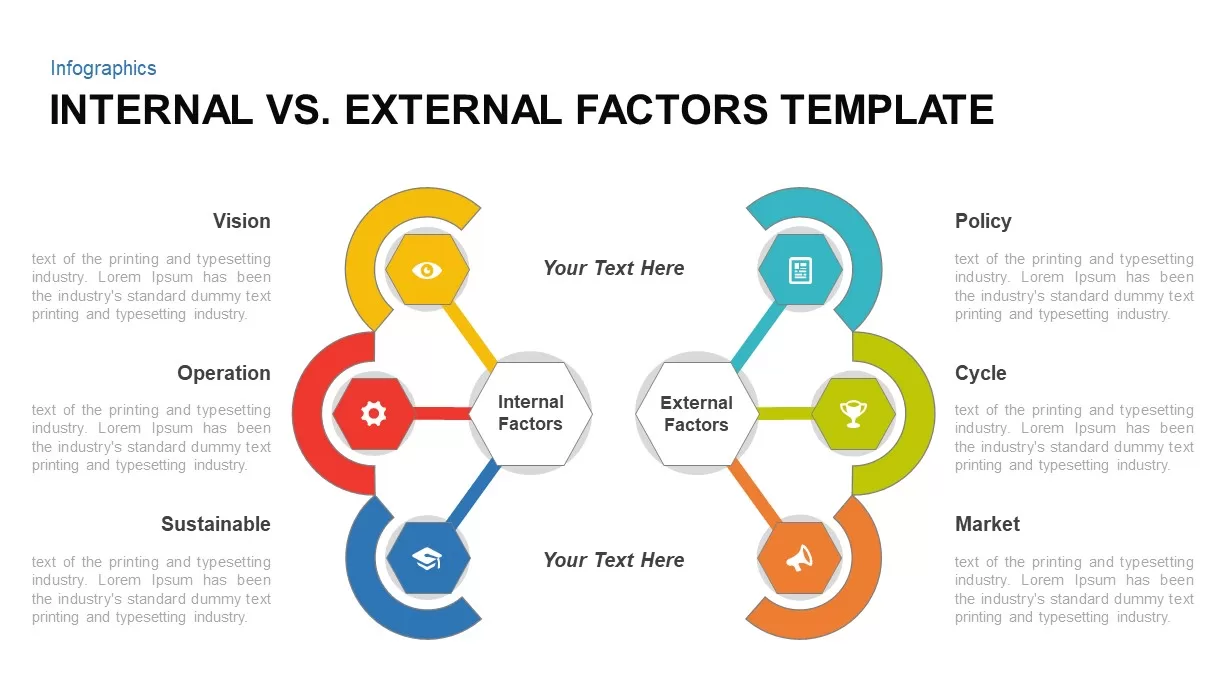
Internal vs External Factors Comparison Template for PowerPoint & Google Slides
Comparison
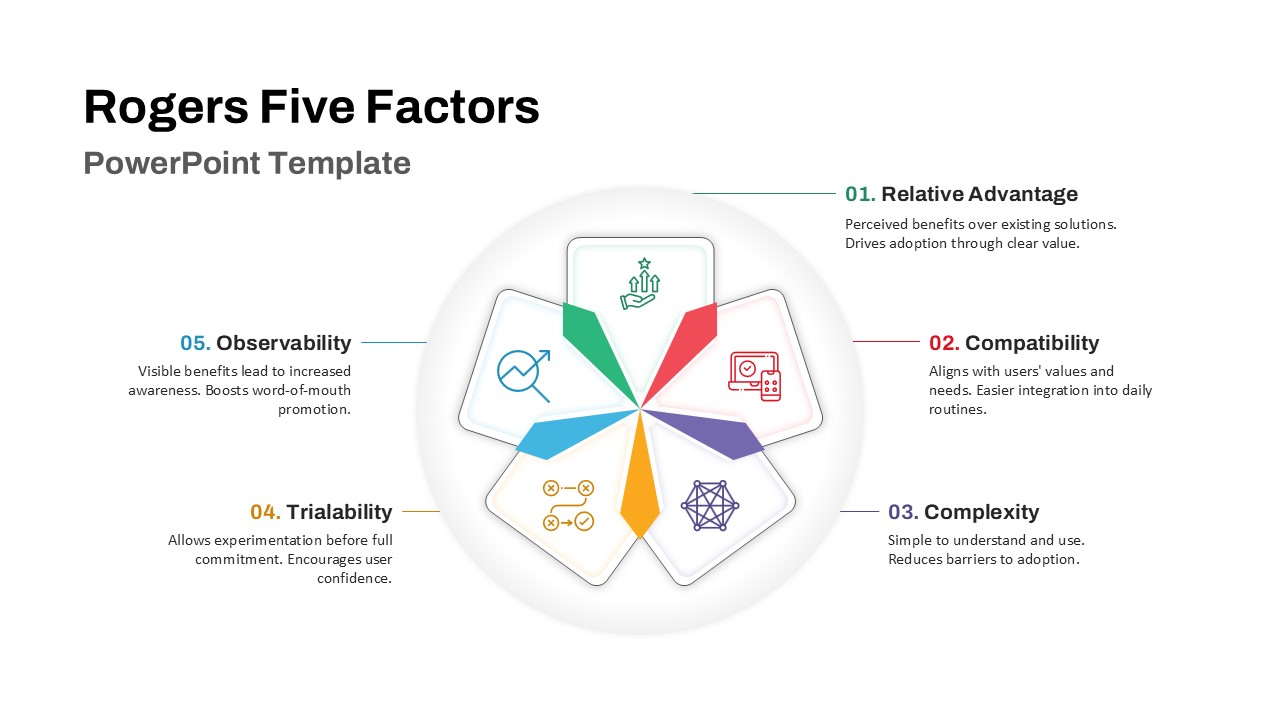
Rogers Five Factors Diffusion Innovation Template for PowerPoint & Google Slides
Process

Internal vs. External Factors for PowerPoint & Google Slides
Infographics
Six Section Circular Infographic Diagram Template for PowerPoint & Google Slides
Circular
Eight-Step Circular Diagram Infographic Template for PowerPoint & Google Slides
Circular
Five-Stage Circular Infographic Diagram Template for PowerPoint & Google Slides
Process
Four-Stage Circular Diagram Infographic Template for PowerPoint & Google Slides
Circular
Circular CRM Process Diagram Infographic Template for PowerPoint & Google Slides
Circular
Circular Three-Step Infographic Diagram Template for PowerPoint & Google Slides
Circular
6-Step Circular Diagram Infographic Template for PowerPoint & Google Slides
Circular
8-Step Circular Gear Infographic Diagram Template for PowerPoint & Google Slides
Circular
6-Part Circular Gear Infographic Diagram Template for PowerPoint & Google Slides
Process
Circular CRM Process Infographic Diagram Template for PowerPoint & Google Slides
Circular
4-Step Circular Infographic Diagram Template for PowerPoint & Google Slides
Circular
Eight-Stage Circular Process Infographic Template for PowerPoint & Google Slides
Circular
Seven-Stage Circular Infographic Template for PowerPoint & Google Slides
Circular
Six-Segment Circular Hub Infographic Template for PowerPoint & Google Slides
Circular
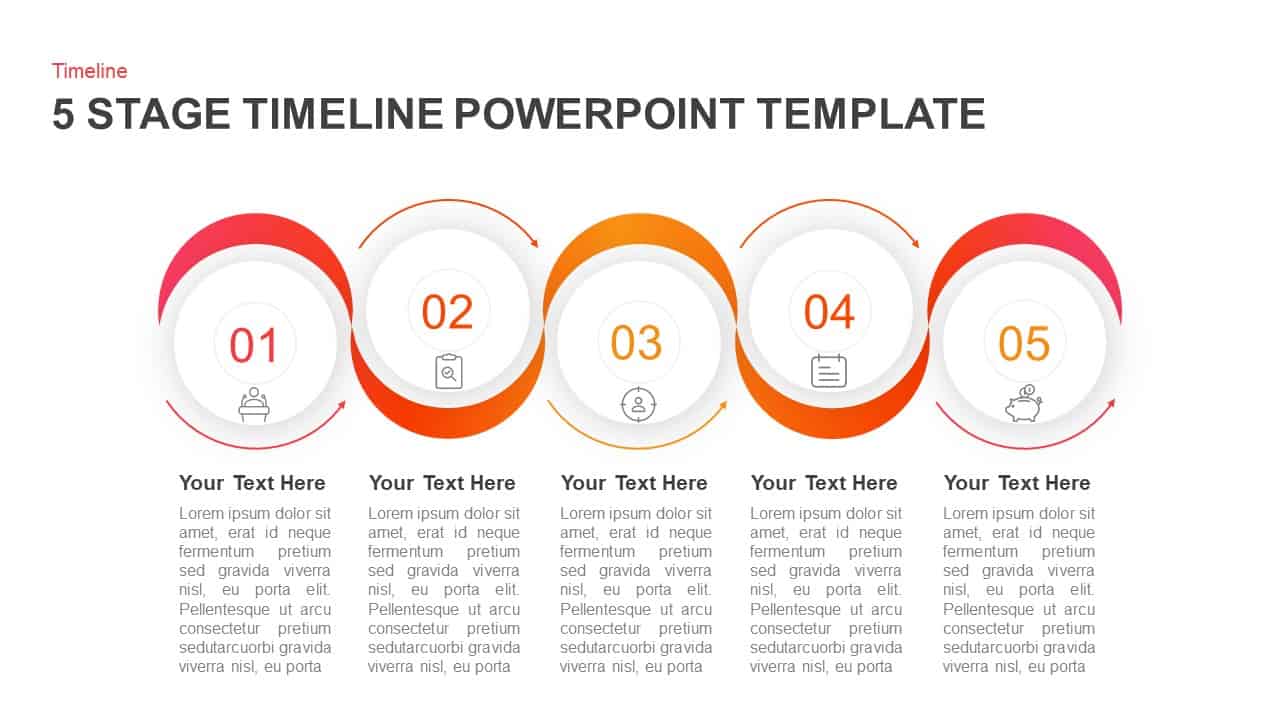
5 Stage Circular Timeline Infographic Template for PowerPoint & Google Slides
Timeline
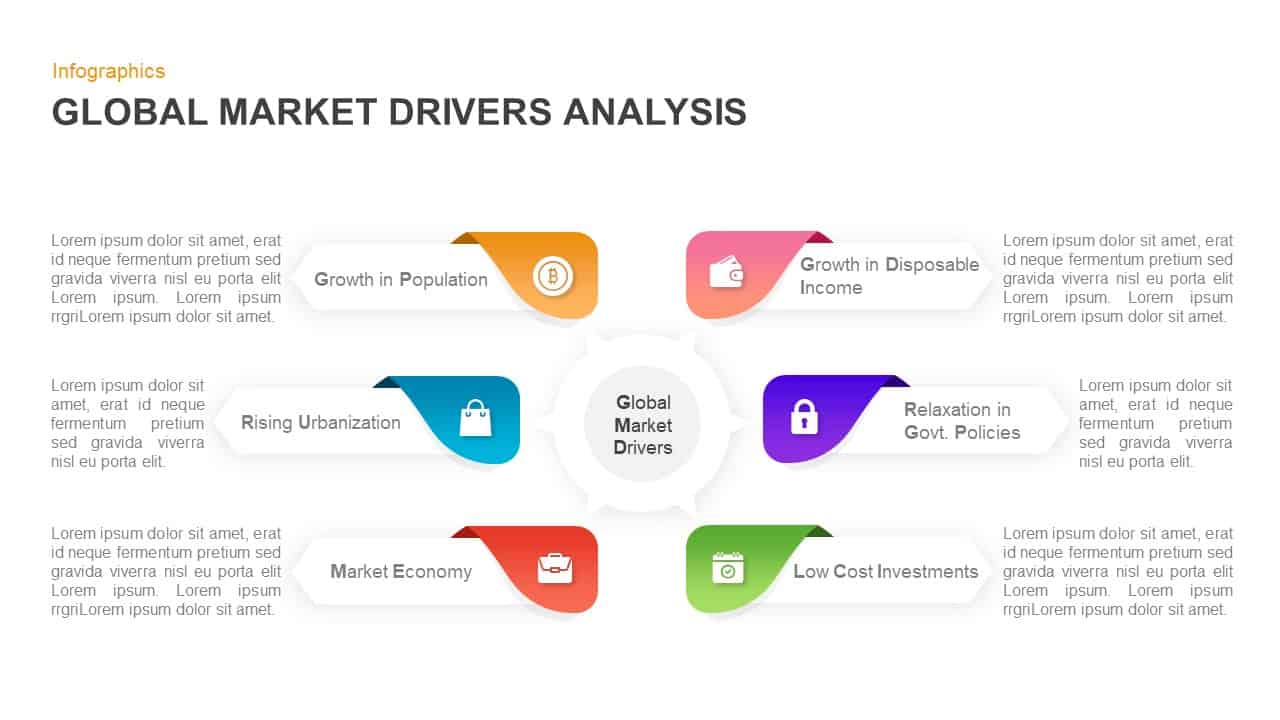
Circular Market Drivers Infographic Template for PowerPoint & Google Slides
Circular
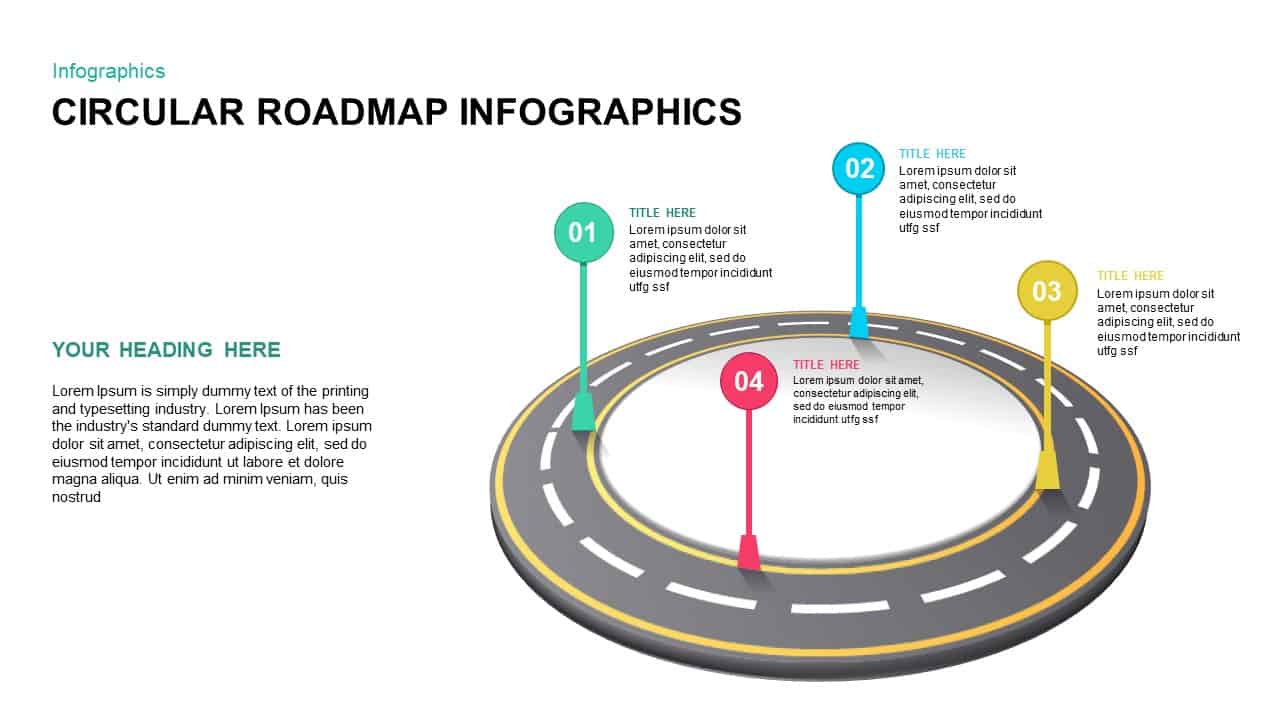
4-Step Circular Roadmap Infographic Template for PowerPoint & Google Slides
Roadmap
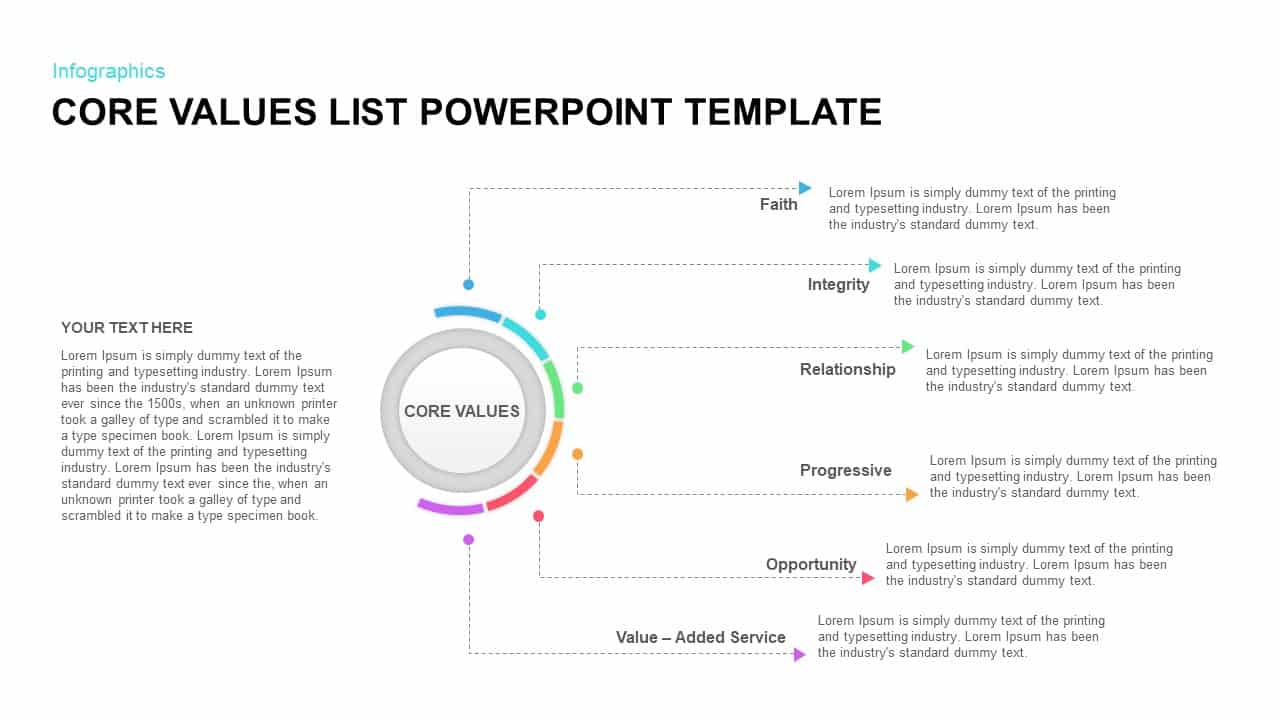
Circular Core Values Infographic List Template for PowerPoint & Google Slides
Circular
SWOT Analysis Circular Infographic Template for PowerPoint & Google Slides
SWOT
3 & 4 Step Circular Process Infographic Template for PowerPoint & Google Slides
Process
Modern Circular OODA Loop Infographic Template for PowerPoint & Google Slides
Circular
Circular Balanced Scorecard Infographic Template for PowerPoint & Google Slides
Business Strategy
Circular Arrows Infographic Template for PowerPoint & Google Slides
Business
Circular SWOT Analysis Infographic Template for PowerPoint & Google Slides
SWOT

Free Five-Step Circular Timeline Infographic Template for PowerPoint & Google Slides
Timeline
Free
Five-Stage Circular Arrow Infographic Template for PowerPoint & Google Slides
Circular
Accomplishment Circular Infographic Template for PowerPoint & Google Slides
Accomplishment
Six-Segment Circular Arrow Infographic Template for PowerPoint & Google Slides
Circular
Healthcare Nursing Circular Infographic Template for PowerPoint & Google Slides
Nursing
Ten Step Circular Process Infographic Template for PowerPoint & Google Slides
Process
Ten-Step Circular Process Infographic Template for PowerPoint & Google Slides
Circular
Dynamic Circular Hub-and-Spoke Infographic Template for PowerPoint & Google Slides
Circular
Circular Sustainability Infographic Template for PowerPoint & Google Slides
Process
Circular Timeline Infographic Template for PowerPoint & Google Slides
Timeline
Sustainable Business Model Circular Infographic Template for PowerPoint & Google Slides
Business Strategy
Circular Financial Ratios Infographic Template for PowerPoint & Google Slides
Finance
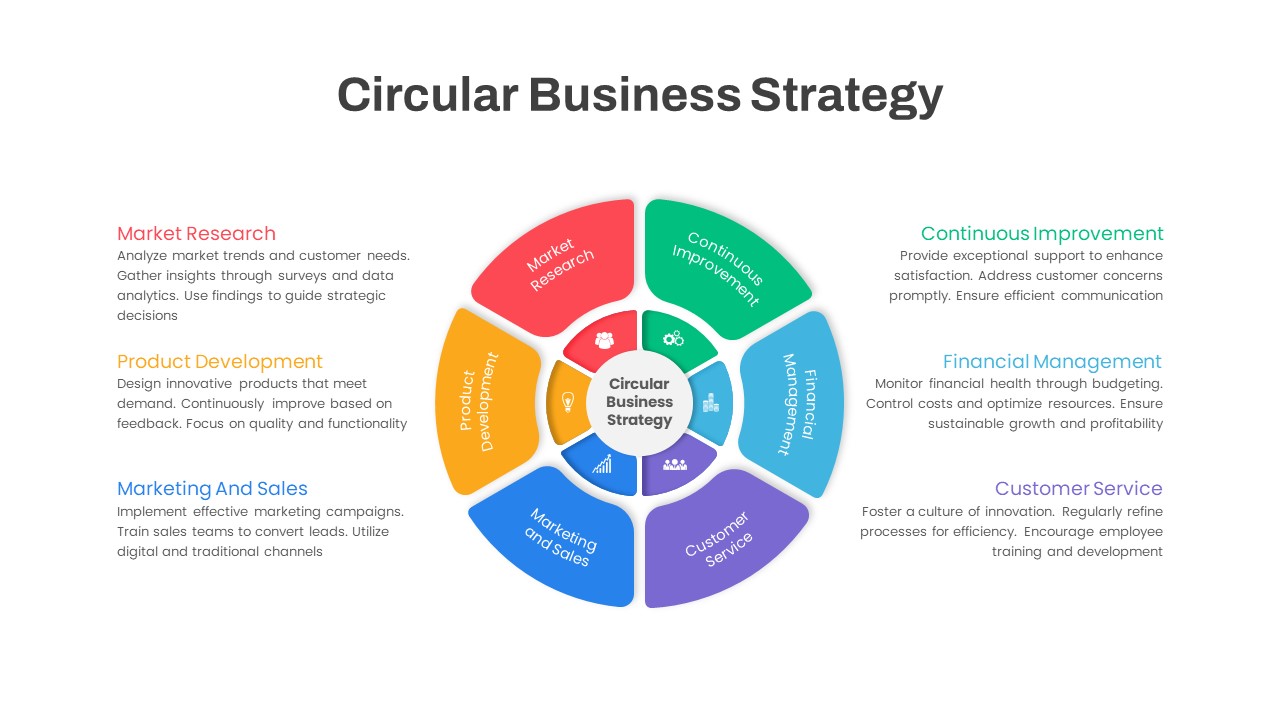
Circular Business Strategy Infographic Template for PowerPoint & Google Slides
Circular
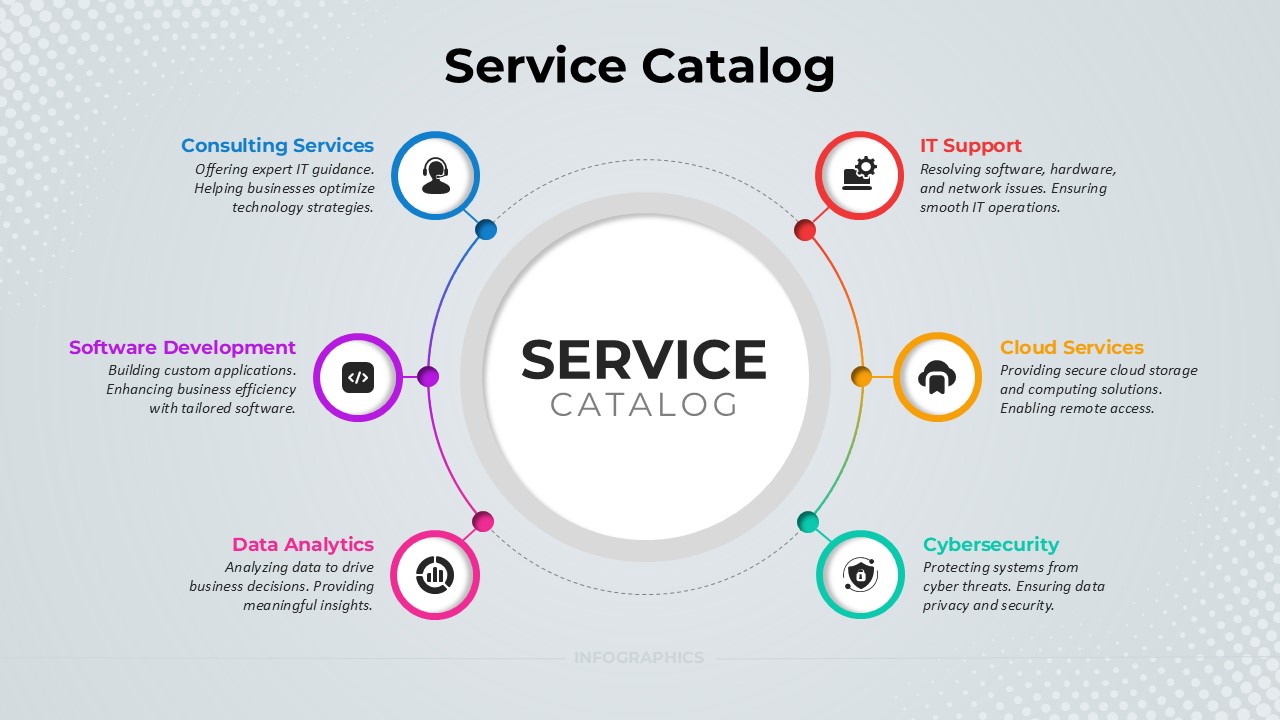
Service Catalog Circular Infographic Template for PowerPoint & Google Slides
Circular
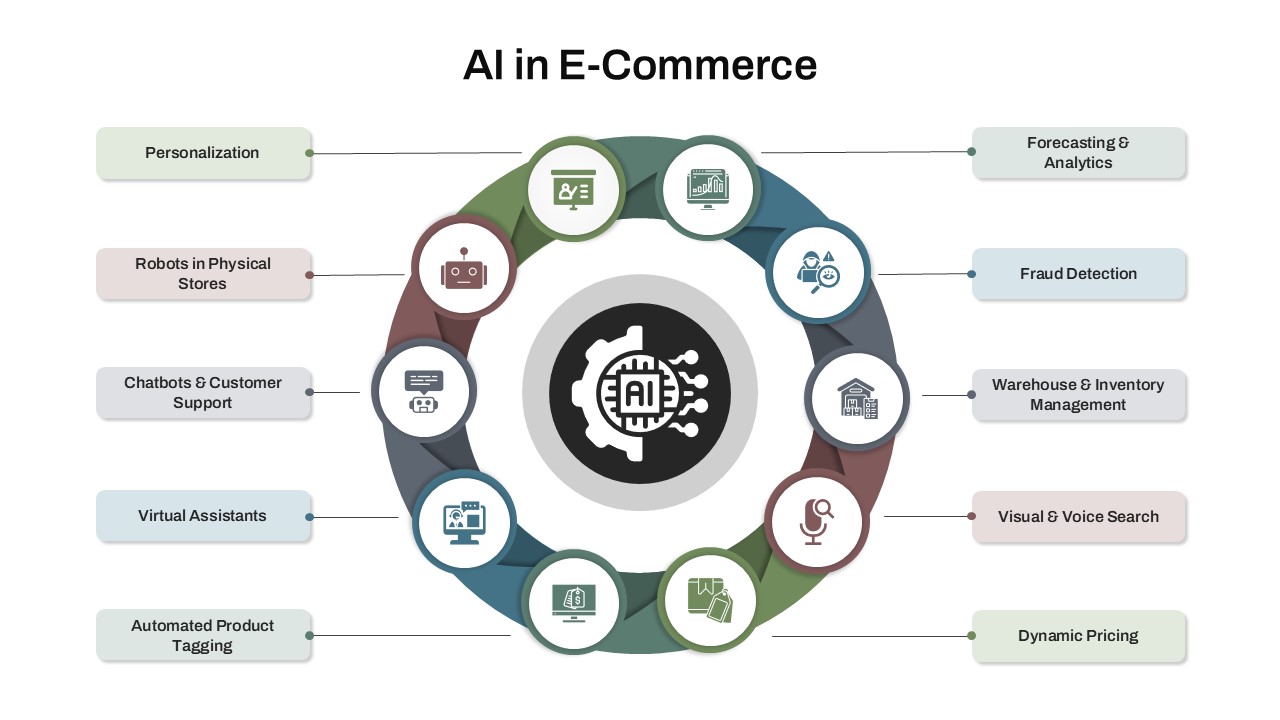
AI in E-Commerce Circular Infographic Template for PowerPoint & Google Slides
AI
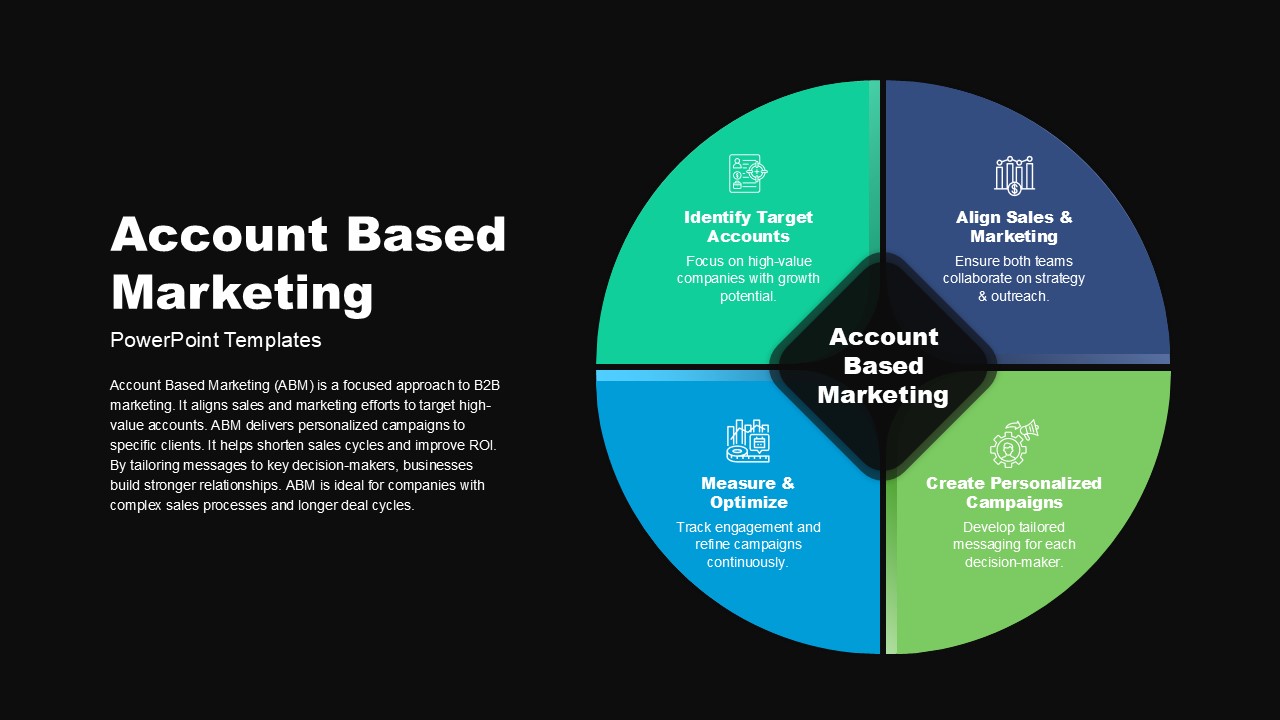
Account Based Marketing Circular Infographic Template for PowerPoint & Google Slides
Marketing
SWOT Analysis Infographic with Circular Icons Template for PowerPoint & Google Slides
SWOT

8 Circular Ring Diagram template for PowerPoint & Google Slides
Infographics
Eight Section Circular Diagram Template for PowerPoint & Google Slides
Circular
Six-Part Core Values Circular Diagram Template for PowerPoint & Google Slides
Circular
Bubble Circular Process Diagram Template for PowerPoint & Google Slides
Process
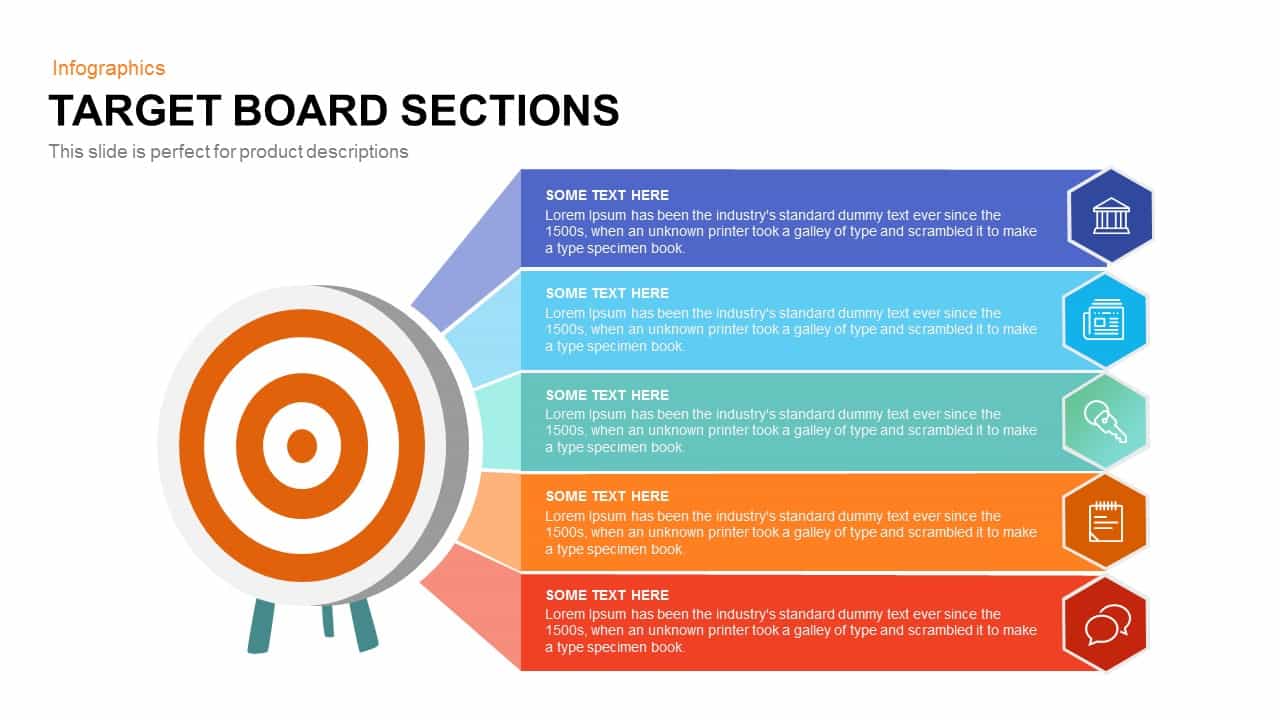
Target Board Sections Circular Diagram Template for PowerPoint & Google Slides
Circular
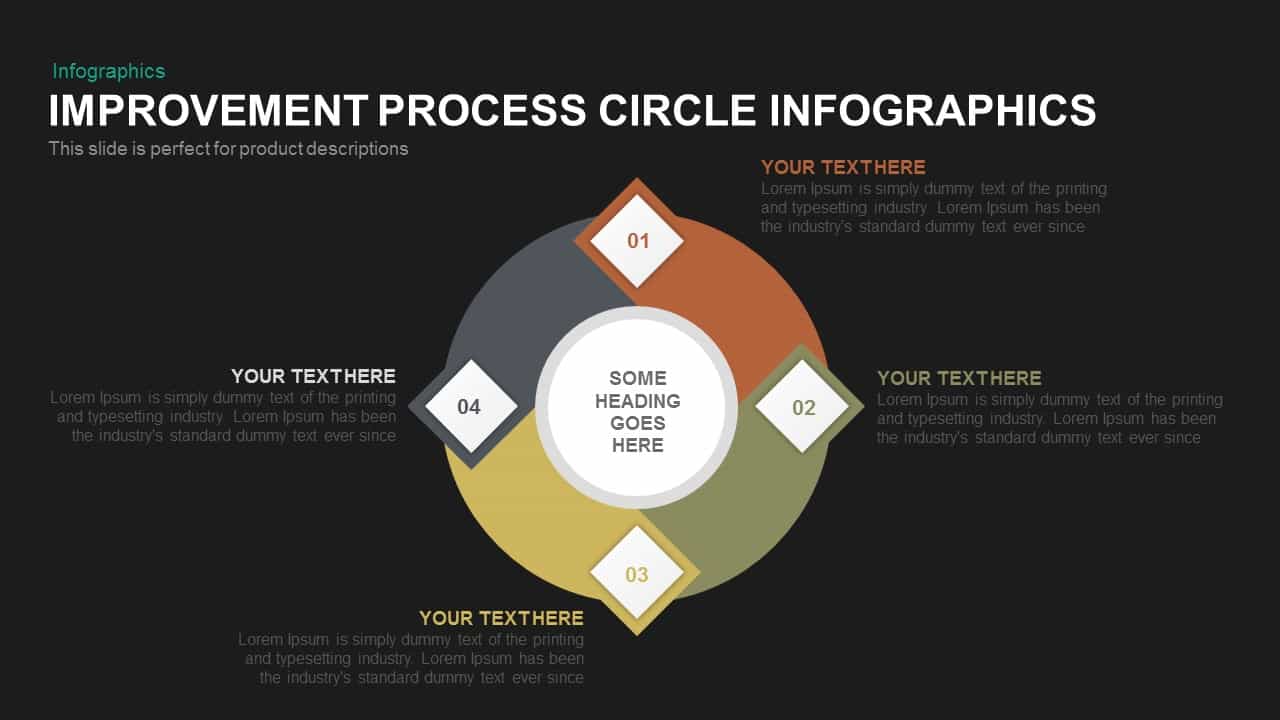
Circular Improvement Process Diagram Template for PowerPoint & Google Slides
Process
Six-Stage Circular Cycle Diagram Template for PowerPoint & Google Slides
Process
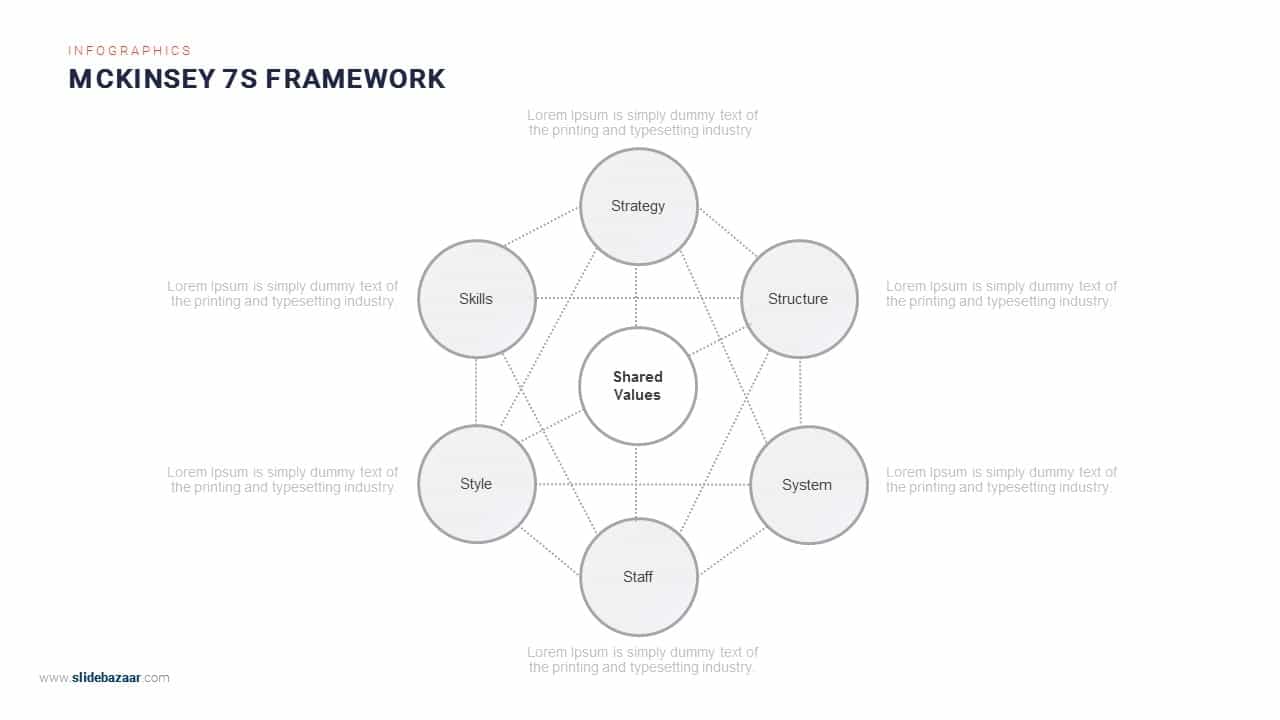
McKinsey 7S Framework Circular Diagram Template for PowerPoint & Google Slides
Circular
Seven-Segment Circular Arrow Diagram Template for PowerPoint & Google Slides
Arrow

Six-Process Circular Arrow Diagram Template for PowerPoint & Google Slides
Circular

Six-Stage Circular Process Diagram Template for PowerPoint & Google Slides
Process
Ten-Piece Circular Puzzle Diagram Template for PowerPoint & Google Slides
Circular
PEST Analysis Circular Diagram Template for PowerPoint & Google Slides
PEST
Six Stage Circular Diagram with Icons Template for PowerPoint & Google Slides
Circular
Six Segment Hexagon Circular Diagram Template for PowerPoint & Google Slides
Circular
9-Step Circular Arrows Process Diagram Template for PowerPoint & Google Slides
Process
Three to Six Staged Circular Diagram Template for PowerPoint & Google Slides
Process
Five Layer Circular Ring Diagram Template for PowerPoint & Google Slides
Circular
Five-Stage Circular Flow Diagram Template for PowerPoint & Google Slides
Circular
Four-Stage Circular Flow Diagram Template for PowerPoint & Google Slides
Circular
8-Step Circular Accounting Cycle Diagram Template for PowerPoint & Google Slides
Accounting
5-Step Circular Puzzle Diagram Template for PowerPoint & Google Slides
Circular
Multi-Color Enneagram Circular Diagram Template for PowerPoint & Google Slides
Circular
Quality Management System Circular Diagram template for PowerPoint & Google Slides
Process
Six-Step Circular Diagram Infographics Template for PowerPoint & Google Slides
Circular
ITIL Service Lifecycle Circular Diagram Template for PowerPoint & Google Slides
Circular
Capacity Planning Circular Diagram Template for PowerPoint & Google Slides
Circular
Growth Strategy Circular Diagram Template for PowerPoint & Google Slides
Circular
Three-Step Circular Arrows Diagram Template for PowerPoint & Google Slides
Process
10-Step Circular Process Diagram Template for PowerPoint & Google Slides
Process
10-Step Colorful Circular Diagram Template for PowerPoint & Google Slides
Circular
10-Step Circular Diagram Template for PowerPoint & Google Slides
Circular
Circular Revenue Generation Diagram Template for PowerPoint & Google Slides
Revenue
Multi-Variation Circular Chart Diagram Template for PowerPoint & Google Slides
Circular
Circular Key Growth Drivers Diagram Template for PowerPoint & Google Slides
Circular
AI Methods Circular Diagram Slide Template for PowerPoint & Google Slides
AI
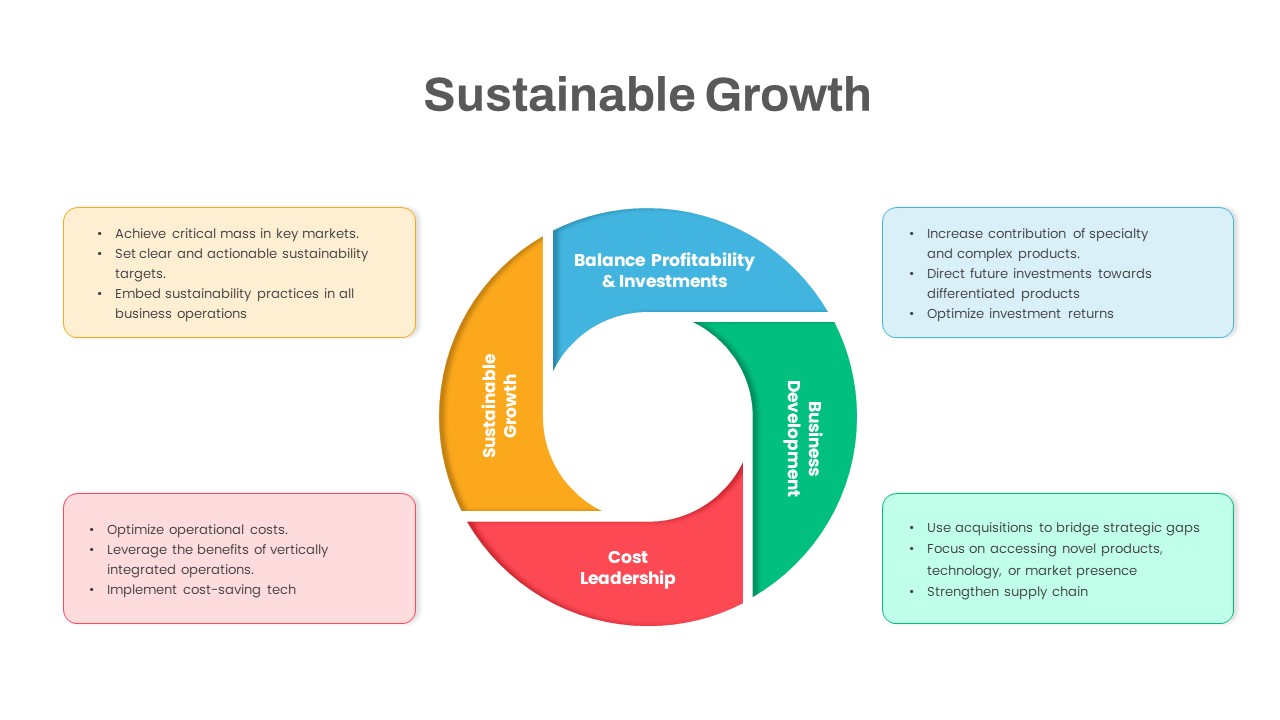
Sustainable Growth Circular Diagram Template for PowerPoint & Google Slides
Circular
5Cs of Network Effect Circular Diagram Template for PowerPoint & Google Slides
Circular
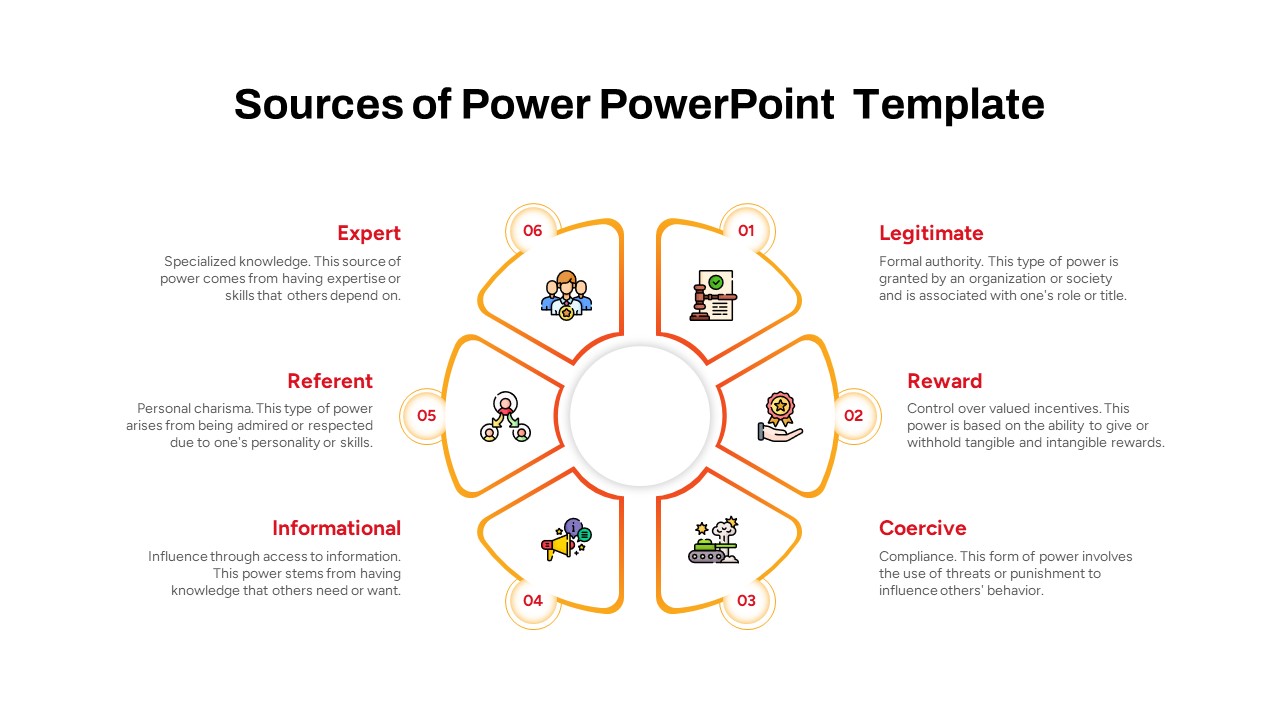
Sources of Power Circular Diagram Template for PowerPoint & Google Slides
Circular
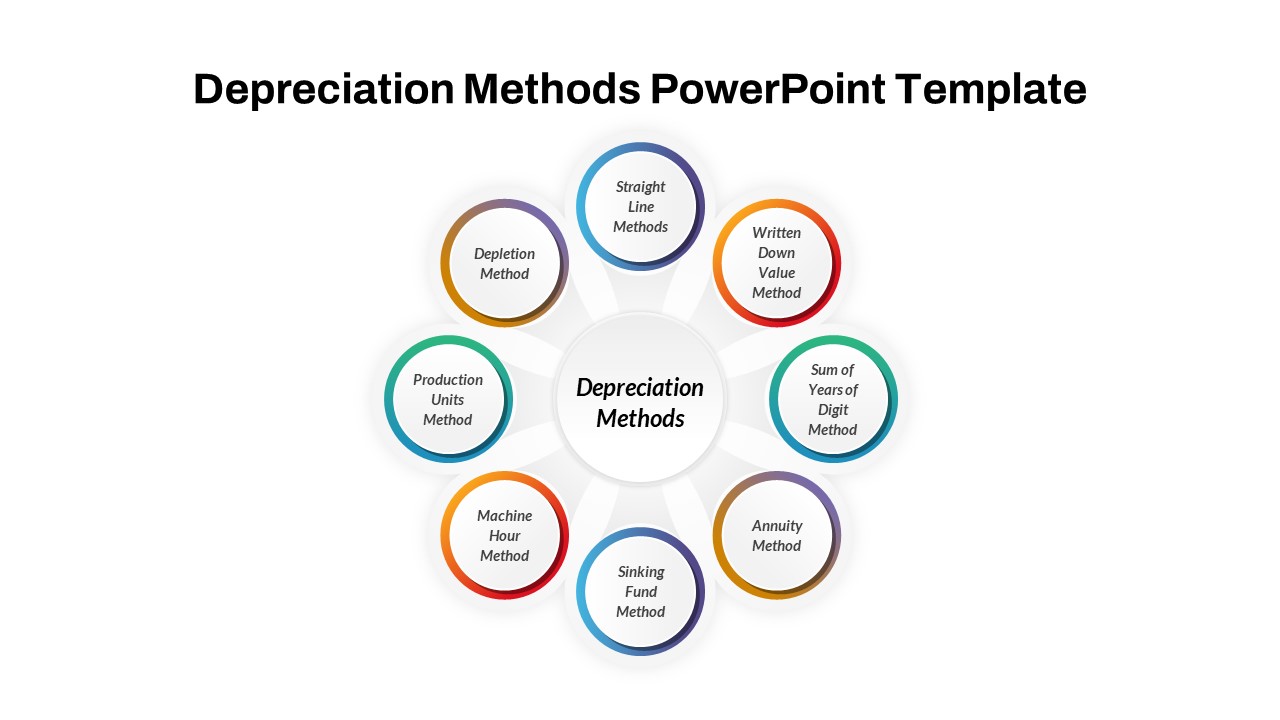
Depreciation Methods Circular Diagram Template for PowerPoint & Google Slides
Circular
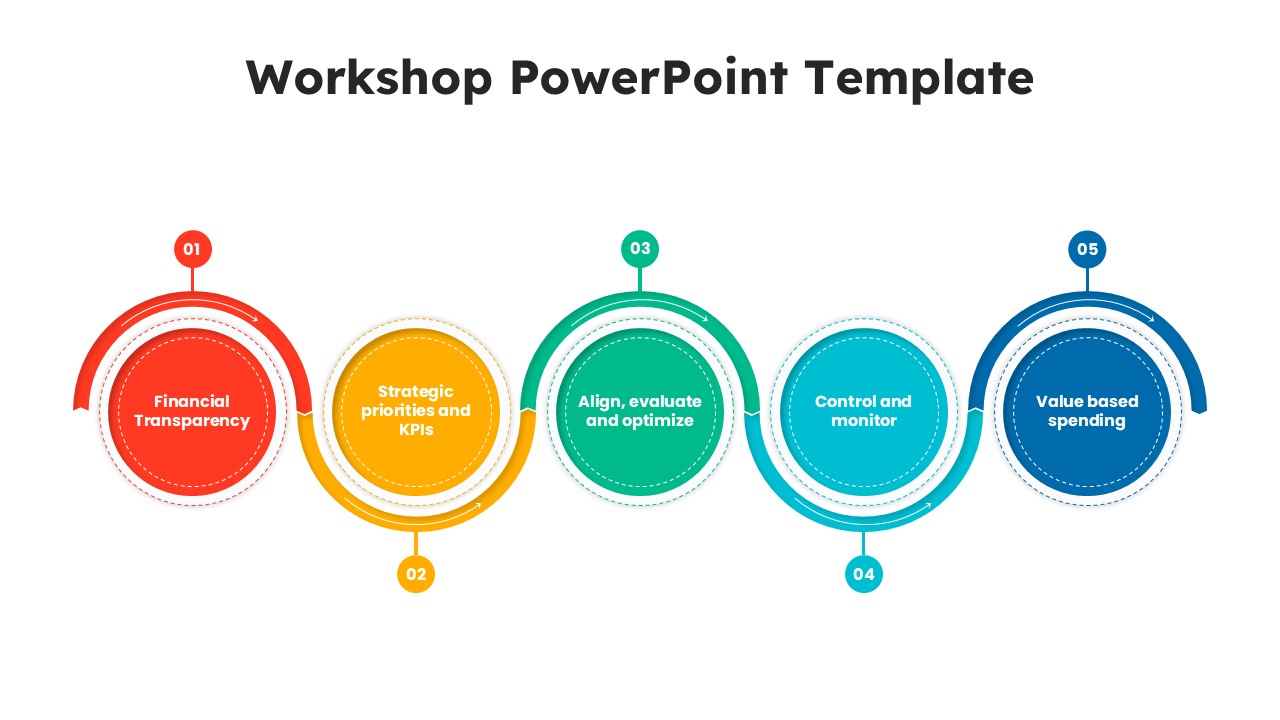
Workshop 5-Step Circular Process Diagram Template for PowerPoint & Google Slides
Circular
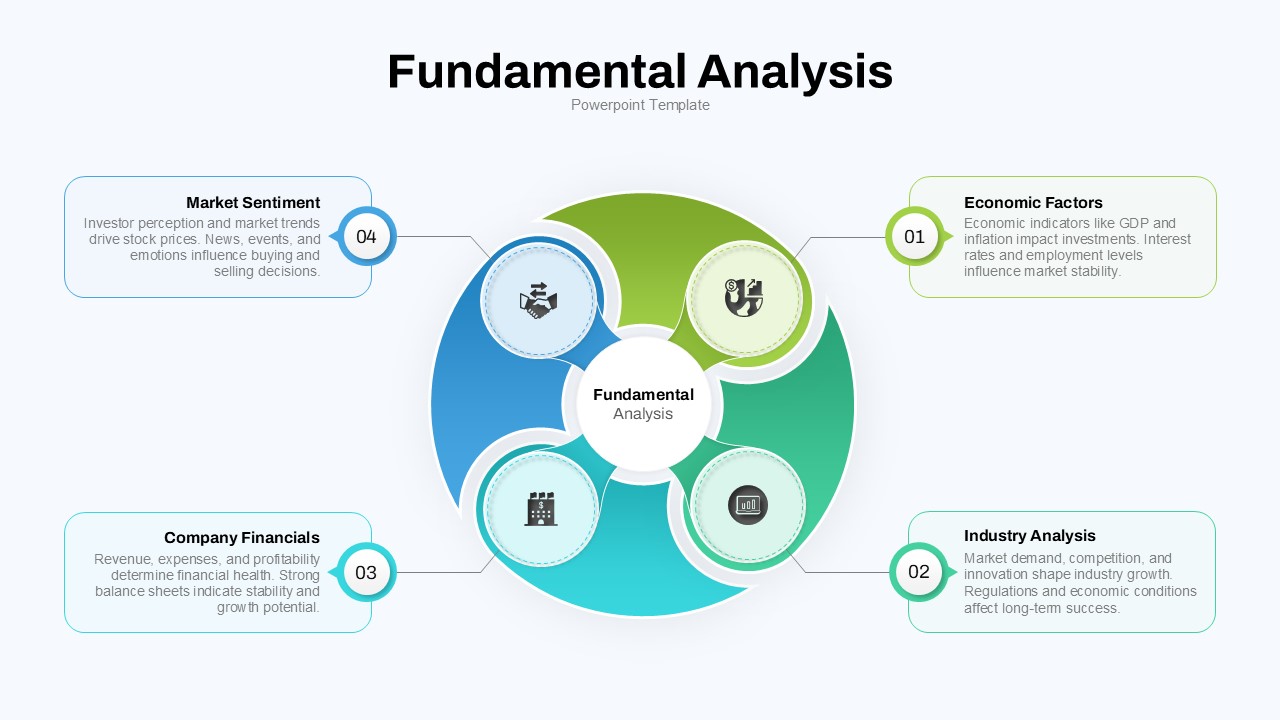
Fundamental Analysis Circular Diagram Template for PowerPoint & Google Slides
Circular
Cultural Web Analysis Circular Diagram Template for PowerPoint & Google Slides
Circular
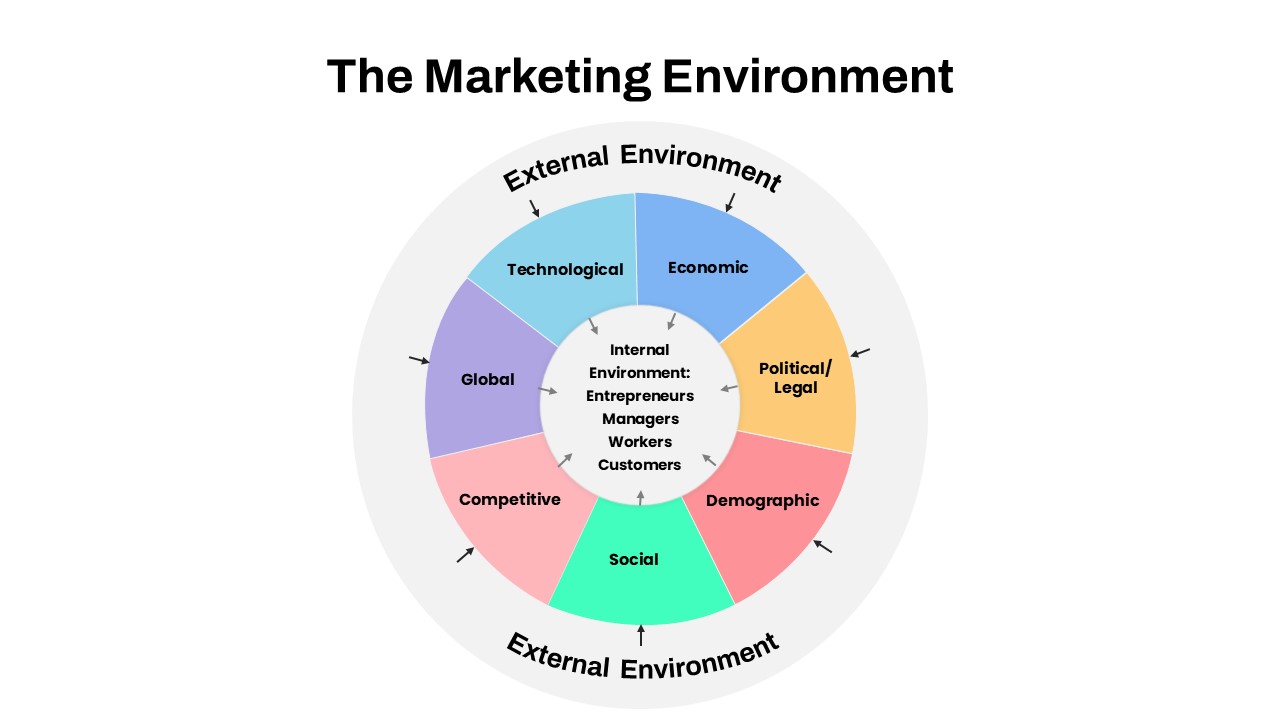
Marketing Environment Circular Diagram template for PowerPoint & Google Slides
Marketing
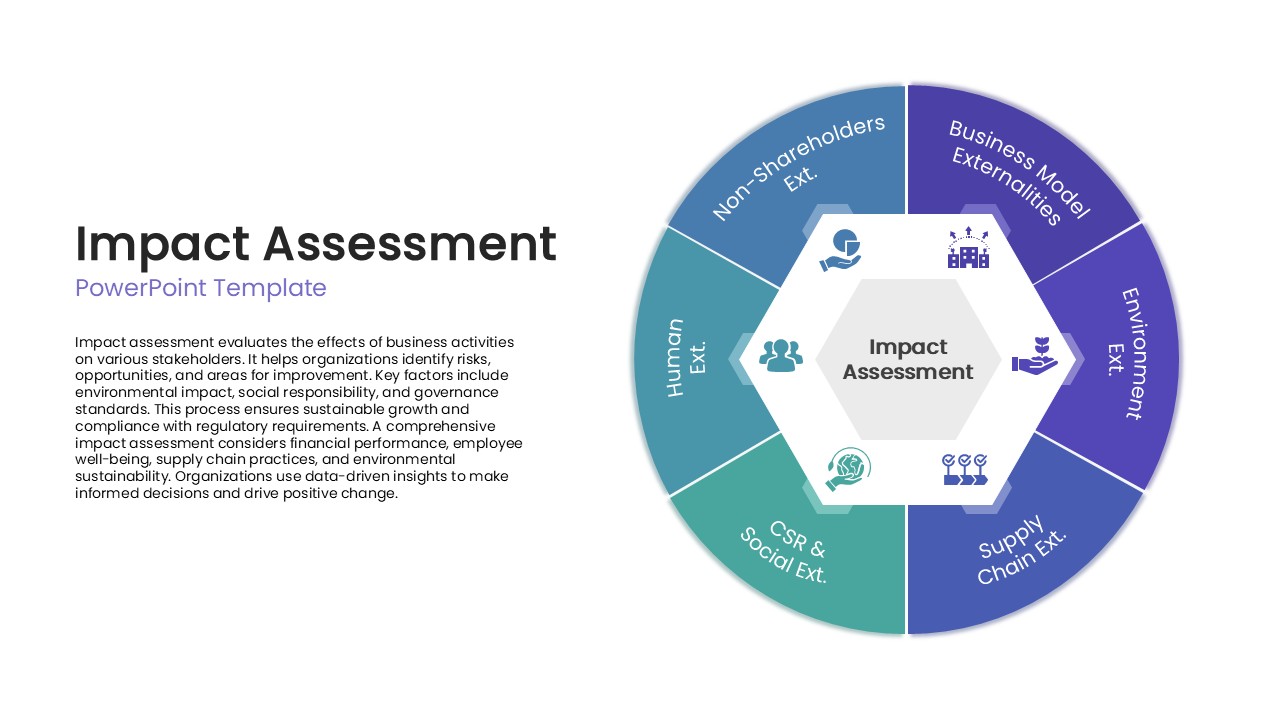
Impact Assessment Circular Diagram Template for PowerPoint & Google Slides
Circular
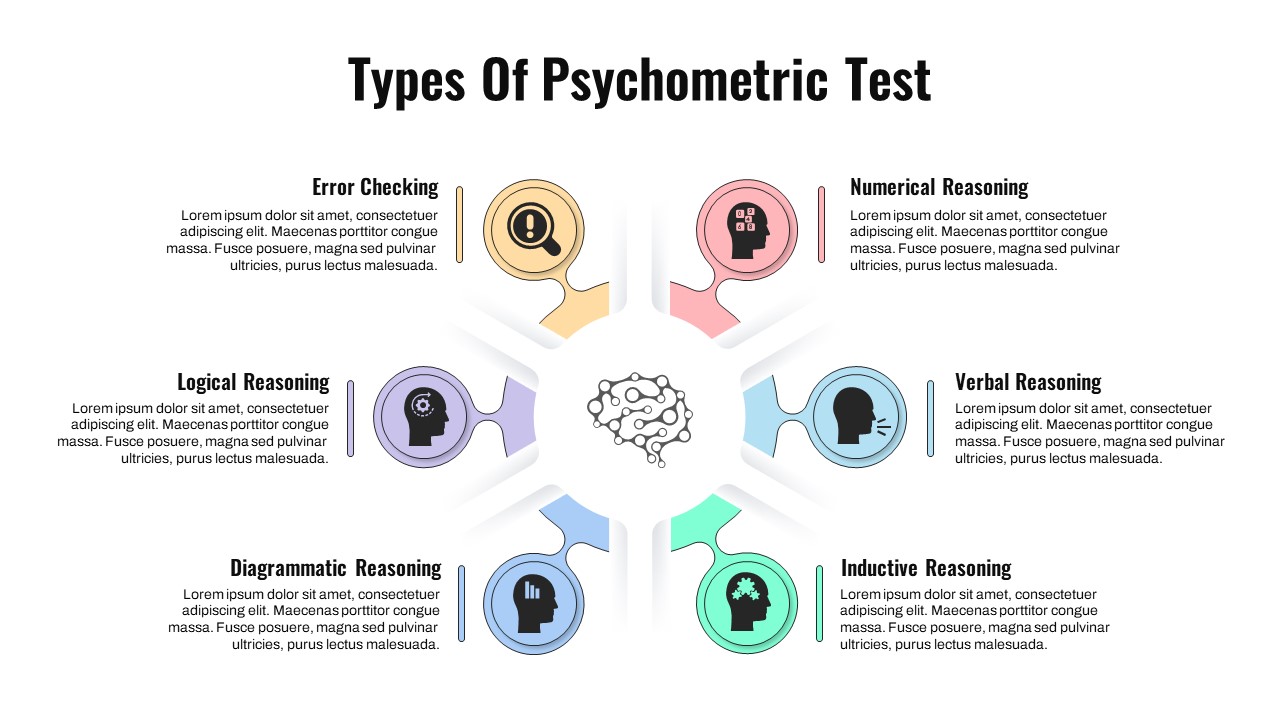
Psychometric Test Types Circular Diagram Template for PowerPoint & Google Slides
Circular
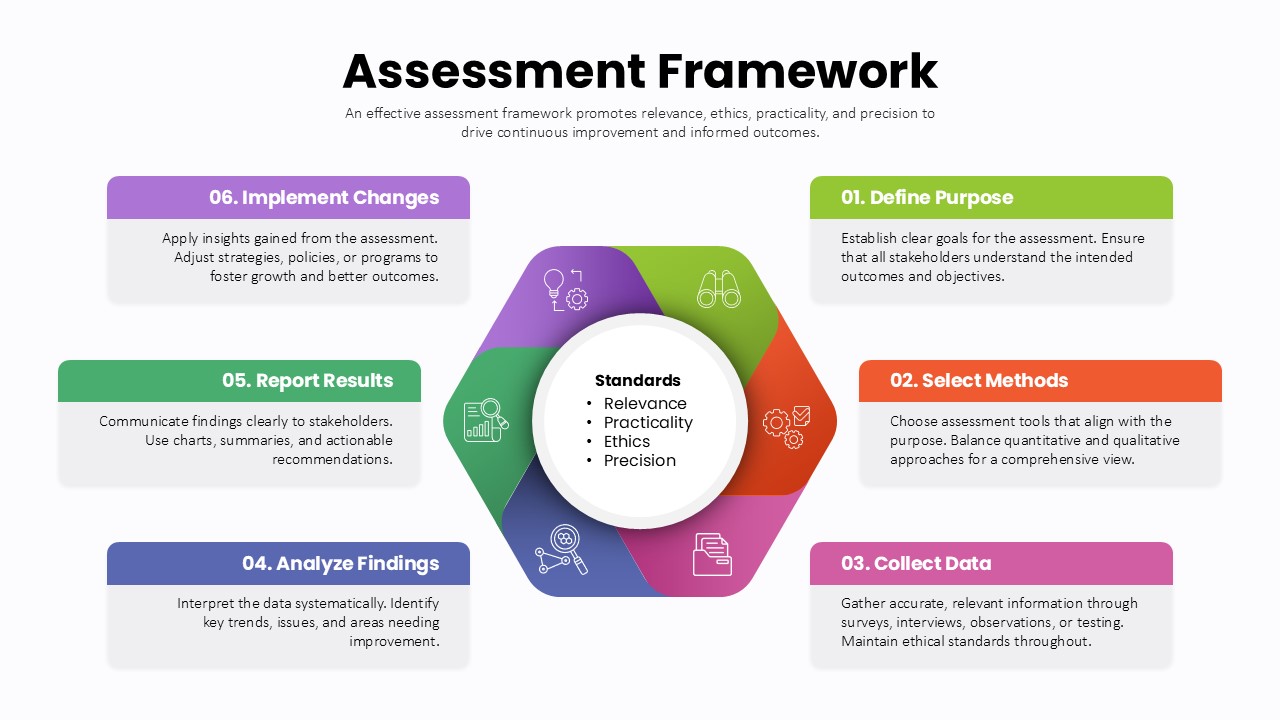
Assessment Framework Circular Diagram Template for PowerPoint & Google Slides
Circular
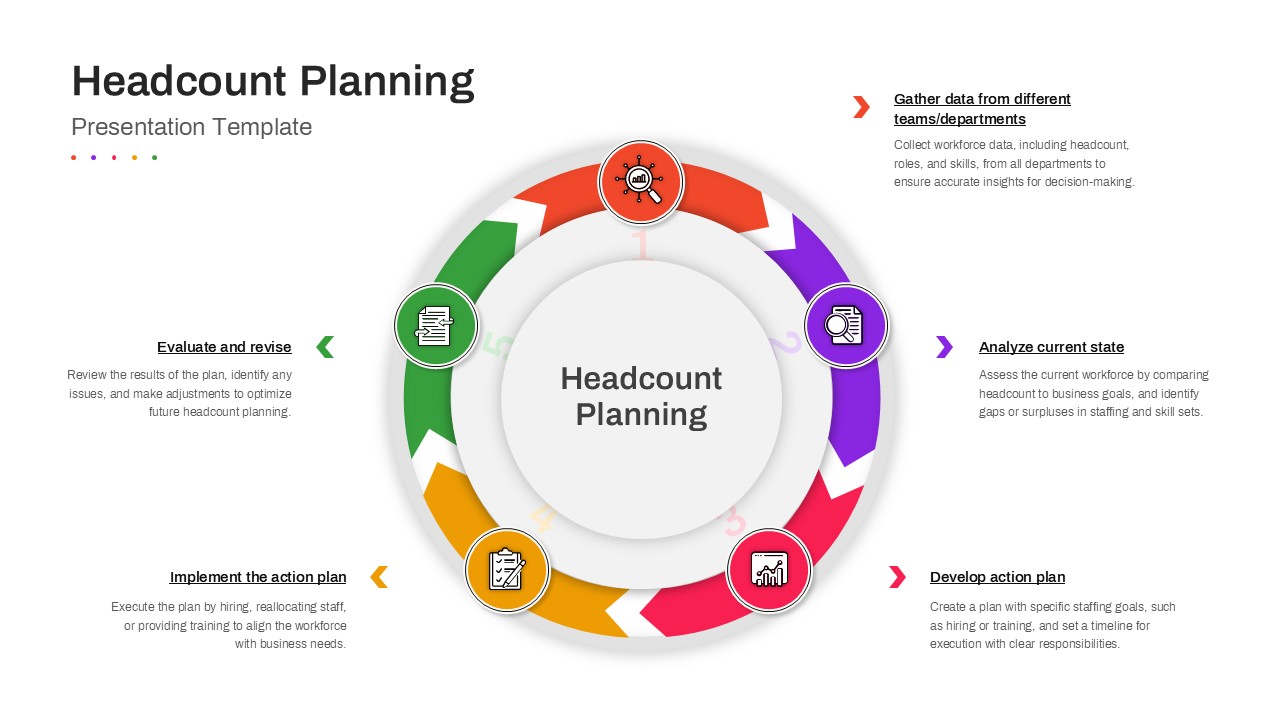
Headcount Planning Circular Process Diagram Template for PowerPoint & Google Slides
HR
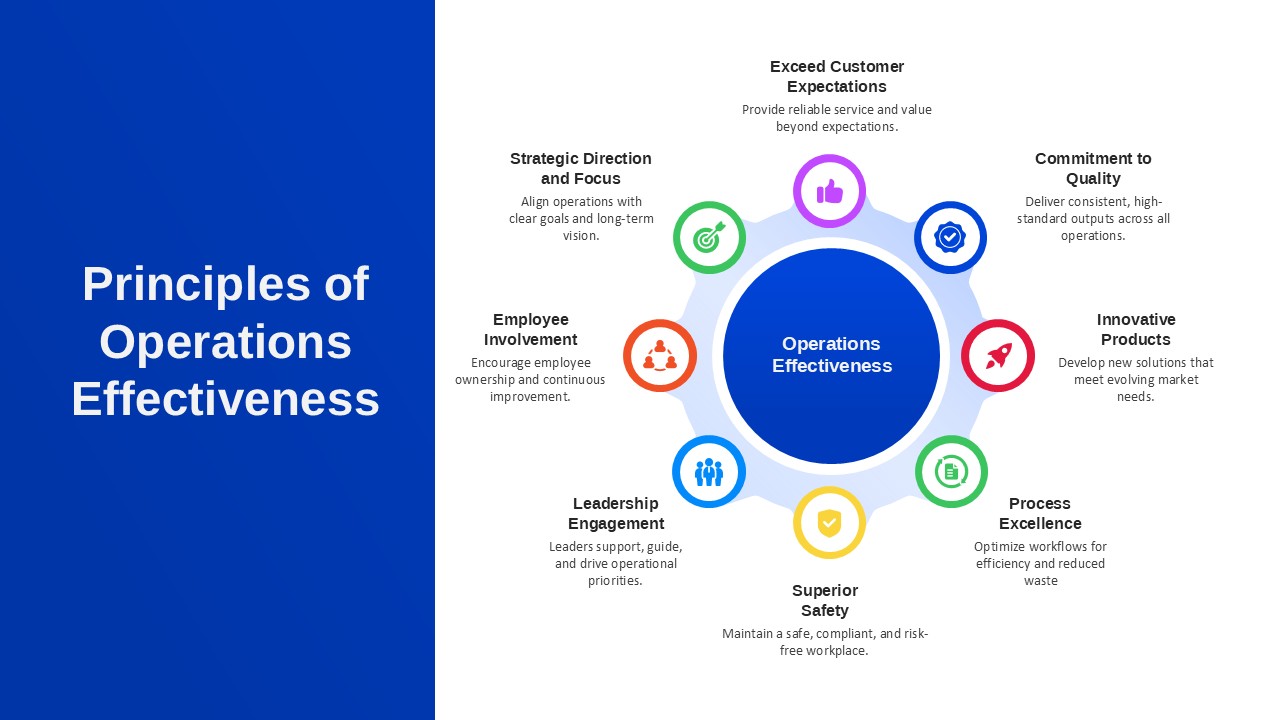
Principles of Operations Effectiveness Circular Diagram Template for PowerPoint & Google Slides
Leadership
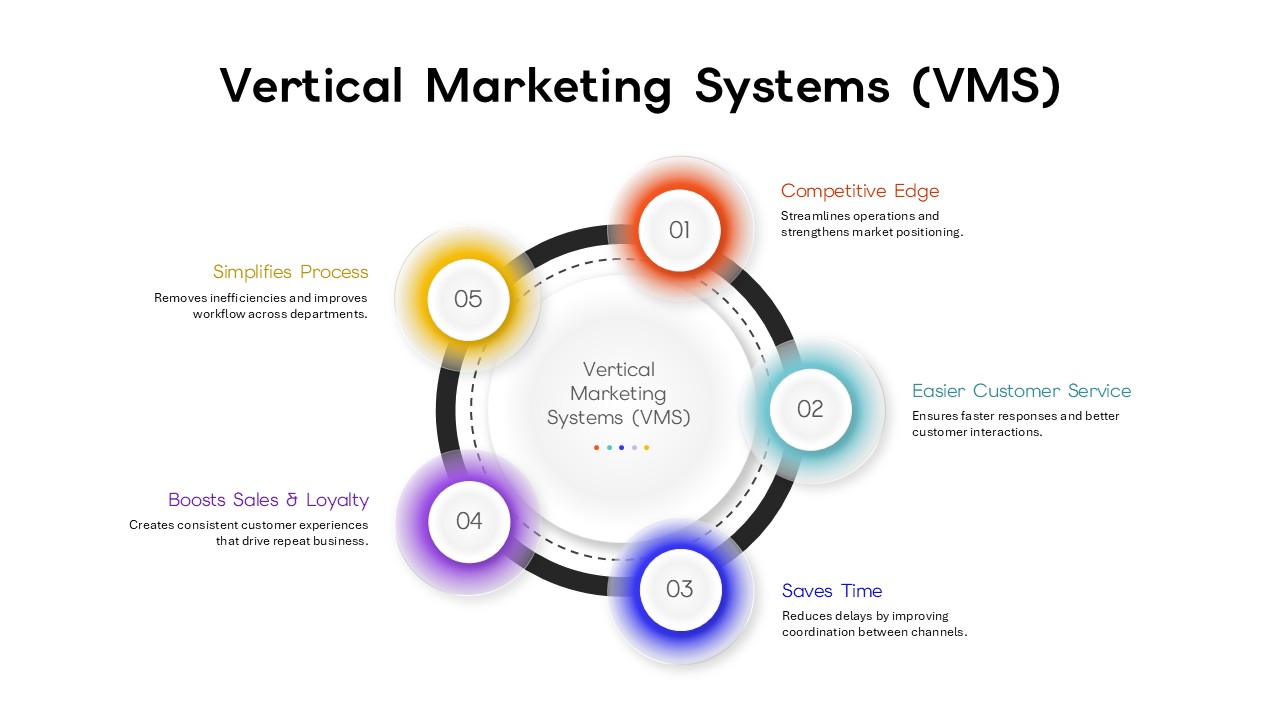
Vertical Marketing Systems (VMS) Circular Diagram Template for PowerPoint & Google Slides
Marketing