See all
Popular Search Terms
Timeline Infographic
Business Deck
Roadmap Template
Pitch Deck
Sales Deck
Pyramid
All Templates
Browse thousands of editable slides for business, marketing, education, and more.
Infographic Templates
Turn complex data into clear visuals with charts, timelines, and diagrams.
Deck Templates
Professional pitch decks, reports, and strategy templates ready to use.
Essentials
Must-have decks for quick wins
By Industry
Professionally tailored slides for every sector
By Style
Minimal, modern and creative designs
By Topic
Explore slides curated by purpose and theme
Planning & Strategy
Data & Comparison
Flow & Structure
Processes & Workflow
Team & Organization
Shapes
TimelineRoadmapStrategyGoalsTableComparisonSWOTAgendaArrowWorld MapMapsProcessFunnelTeamOrg ChartPyramidCircular
Business
Marketing & Sales
Business PlanBusiness StrategyBusiness ProposalBusiness ModelsDigital MarketingMarketing FunnelCustomer ExperienceProject StatusGantt ChartRecruitmentEmployee PerformanceLeadershipAIMachine Learning
AI Presentation Maker
Install the Windows plugin for quick access to templates and design tools.
AI Infographics Maker
Use our Office 365 add - in to access templates directly from the cloud.
Exe Version
Office 365
Mac Version
Get the Mac plugin to easily browse, insert, and customize templates and visuals within PowerPoint.
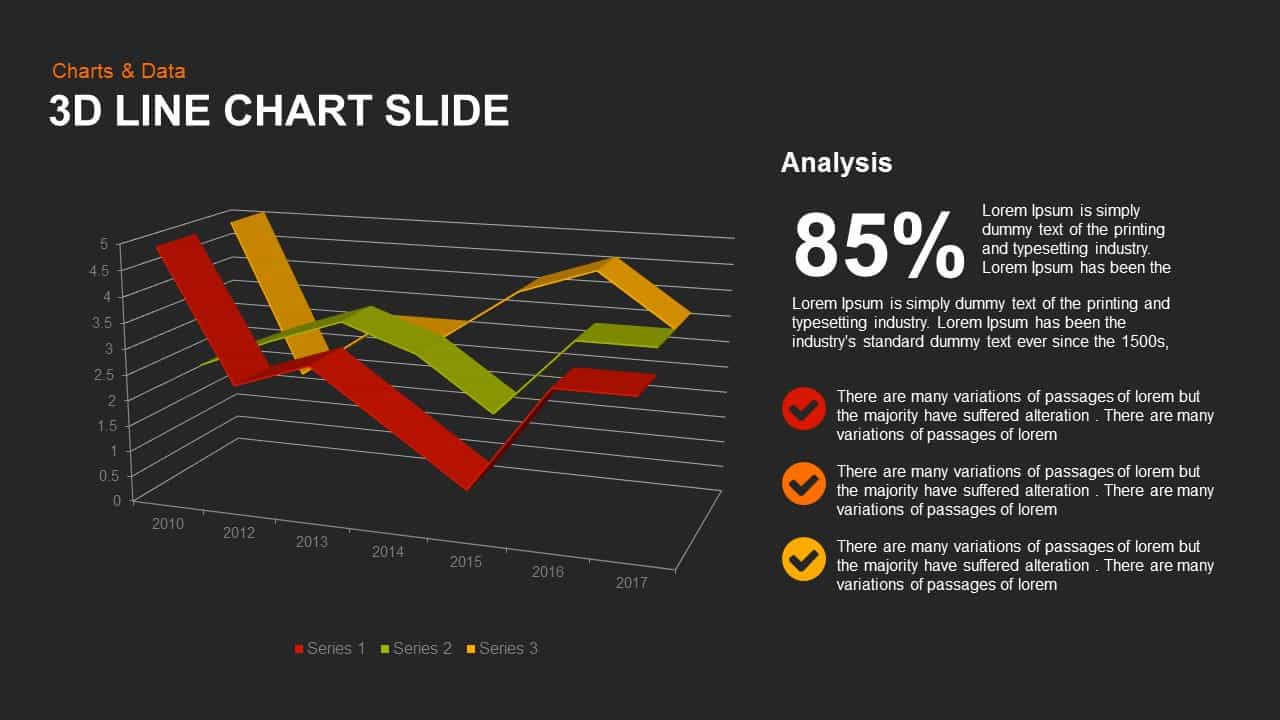
Home » 3D Line Chart for PowerPoint & Google Slides » 3d Line Chart Powerpoint and Keynote Slide 1
Login to download this file
Add to favorites
Add to collection
Category
No. of Slides
Item ID
Rating
0.0
(0 reviews)