Pert Chart PowerPoint Templates
Pert chart PowerPoint templates contain 21 slides of project management that may help your project UpToDate or help learn your subordinates how to use pert chats in working environments. This pert PowerPoint diagram has many designs that support your audience to focus more on the topic and then convince the importance of flowcharts in project management.
The four letters of PERT represent the “Program Evaluation Review Technique,” commonly used in the project management field. It will help to schedule, organize, and coordinate tasks within a project as a flow. This is a project timeline tool for project managers to deliver when and how projects start and end. As it is a graphical representation of project management, it will help break down the individual tasks for analysis. In addition, it will show the minimum amount of time needed to finish a project. So, project managers can easily pass the project schedule and its timeframe using PERT CHART POWERPOINT DIAGRAM.
PERT CHART template will ease organizing a complex project with a variety of moving parts by visualizing the connected variables between each step of the process. It is generally used with a Critical Path Method, which could not delay your project objectives.
There are many techniques used in a pert chart to show project developments. For example, Nodes are a visual representation of milestones within the project. The number boxes on the complex flowchart are nodes. You can see arrows, boxes, large and small columns, and connected lines in the Pert chart. All these elements have certain duties to carry.
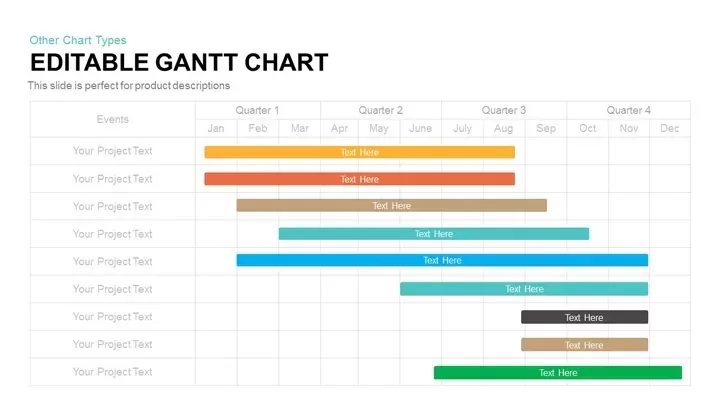
Pert charts are like Gantt charts because they identify task dependencies, but it isn’t easy to interpret the complex structure. These pert chart PowerPoint templates are high-definition charts for presenting project statistics. You can download these 21 slides of project management presentation with easy-to-customize features. Then, surprise your audience with the latest chart ppt designs that appeal to both domestic and global audiences.
Login to download this file


