Description
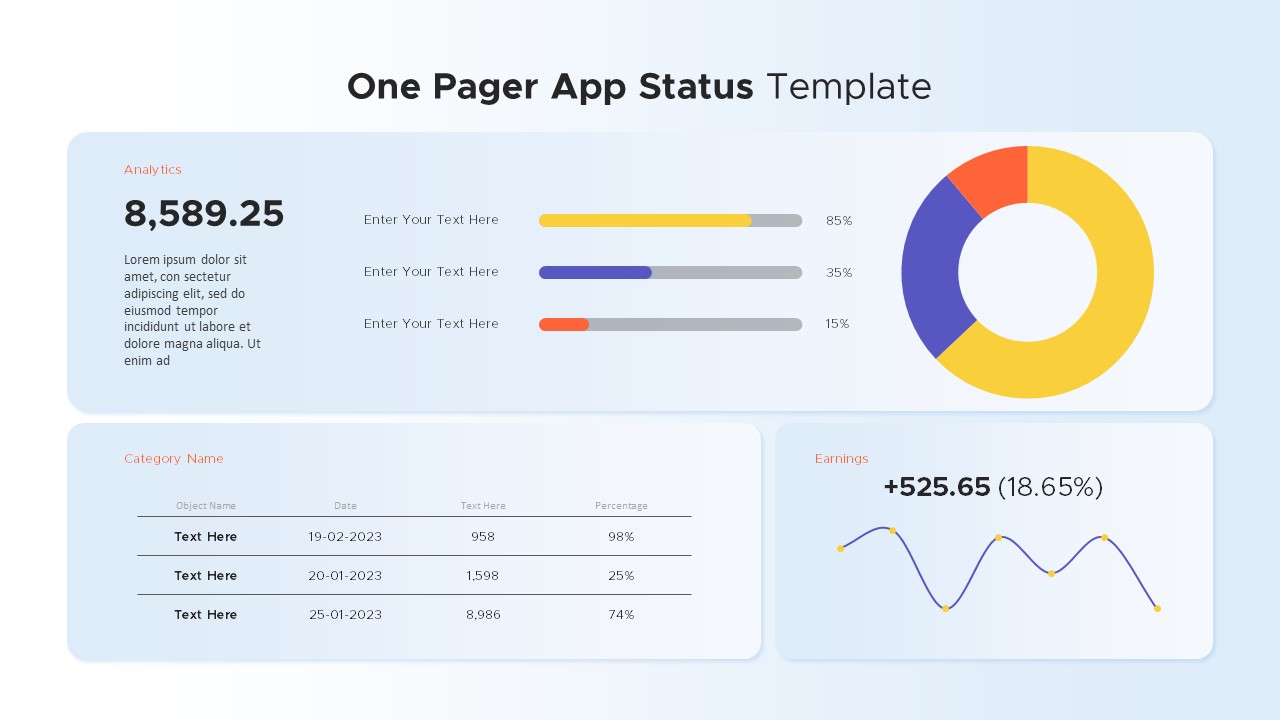
This One Page Marketing Status template is designed to present key marketing metrics in a clear and concise format, perfect for tracking campaign performance or reporting progress. The layout includes two dynamic charts: a bar chart (Chart 01) that compares categories and a line graph (Chart 02) to visualize data over time. This allows for quick comparisons and easy tracking of trends and changes in performance.
The template also features key performance indicators (KPIs) at the bottom, such as revenue, customer count, and other relevant statistics, providing a holistic view of marketing efforts. The use of soft gradients and vibrant colors makes the slide visually engaging, while keeping it professional and easy to understand.
Ideal for presenting marketing status reports, campaign updates, or monthly progress reviews, this template is fully customizable, making it easy to adjust the charts, data, and colors to suit your needs. It’s optimized for both PowerPoint and Google Slides, ensuring seamless integration and flexibility across devices and platforms.
Who is it for
This template is ideal for marketing managers, digital marketers, business owners, and data analysts who need to present marketing data and track performance over time. It’s great for internal meetings, client presentations, or stakeholder updates.
Other Uses
In addition to marketing status, this template can be adapted for any business or performance-related metrics, such as sales performance, project status updates, or product analytics. It’s versatile for various reporting and presentation needs.
Login to download this file
No. of Slides
2Item ID
SB03248Rating
0.0
(0 reviews)
Tags
Related Templates

One Page Marketing Plan Template for PowerPoint & Google Slides
Marketing

Product Landing Page Template for PowerPoint & Google Slides
Advertising

One-Page Business Strategy Plan Slide Template for PowerPoint & Google Slides
Business Strategy

One-Page Company Profile Overview Template for PowerPoint & Google Slides
Company Profile

Free Corporate Presentation Cover Page Deck Template for PowerPoint & Google Slides
Free
Free

1 Page Resume template for PowerPoint & Google Slides
Business

Free Facebook Page Analytics Slide for PowerPoint & Google Slides
Customer Experience
Free

RAG Status Infographic Comparison Template for PowerPoint & Google Slides
Project

Modern Project Status Report Dashboard Template for PowerPoint & Google Slides
Project Status

Clean Minimal Project Status Update Template for PowerPoint & Google Slides
Project

Project Status Dashboard Table Template for PowerPoint & Google Slides
Project Status

Project Status Dashboard with Metrics Template for PowerPoint & Google Slides
Project Status

Colorful Project Status Dashboard Template for PowerPoint & Google Slides
Project Status

Color-Coded Project Status Template for PowerPoint & Google Slides
Project Status

Color-Coded Project Status Slide Template for PowerPoint & Google Slides
Project Status

Project Status Table Template for PowerPoint & Google Slides
Project Status

Circular Project Status Template for PowerPoint & Google Slides
Project Status

Project Status Dashboard Template for PowerPoint & Google Slides
Project Status

Horizontal Timeline Project Status Template for PowerPoint & Google Slides
Project Status

Weekly Status Report Dashboard Template for PowerPoint & Google Slides
HR

Sprint Status Tracking Template for PowerPoint & Google Slides
Infographics

One Pager Website Status Template for PowerPoint & Google Slides
Digital Marketing

One Pager App Status template for PowerPoint & Google Slides
Business Report

One Pager Project Status Dashboard Template for PowerPoint & Google Slides
Project Status

One-Pager Business Status Report Slide Template for PowerPoint & Google Slides
Business Report

Weekly Project Status Dashboard Template for PowerPoint & Google Slides
Project Status

Free Traffic Light Status Indicator Slide Template for PowerPoint & Google Slides
Project Status
Free

Free Simple Weekly Project Status Report Template for PowerPoint & Google Slides
Project Status
Free

Ongoing Investments and Project Status Template for PowerPoint & Google Slides
Project Status

Monthly Status Report Template for PowerPoint & Google Slides
Project Status

Dynamic Project Status Tracking Table Template for PowerPoint & Google Slides
Project Status

Project Status Dashboard Report Template for PowerPoint & Google Slides
Project Status

Project Status Update Dashboard Table Template for PowerPoint & Google Slides
Project Status

Project Status Dashboard Template for PowerPoint & Google Slides
Project Status

Comprehensive Project Status Report Template for PowerPoint & Google Slides
Project Status

Dashboard Project Status Template for PowerPoint & Google Slides
Project Status

Project Status with Progress & Priority Template for PowerPoint & Google Slides
Table

Project Status Template Dashboard with Gauge for PowerPoint & Google Slides
Project Status

Project Status Dashboard with RAG Legend Template for PowerPoint & Google Slides
Project Status

Project Status Report Tracker Slide for PowerPoint & Google Slides
Project Status

Marketing Strategy PowerPoint template for PowerPoint & Google Slides
Marketing

Marketing Lead Generation Process Funnel PowerPoint Template for PowerPoint & Google Slides
Funnel

Multi-Level Marketing PowerPoint Template for PowerPoint & Google Slides
Business Models

Digital Marketing Roadmap PowerPoint Template for PowerPoint & Google Slides
Digital Marketing

4 Types of Target Marketing Strategies PowerPoint Template for PowerPoint & Google Slides
Comparison

Marketing Strategy Arrow Infographic Template for PowerPoint & Google Slides
Comparison

Seven-Part Marketing Mix Diagram Template for PowerPoint & Google Slides
Marketing

Data-Driven Marketing Cycle Diagram Template for PowerPoint & Google Slides
Customer Journey

Marketing Risk Management Gear Diagram Template for PowerPoint & Google Slides
Risk Management

Marketing Mix 4Ps Concept Illustration Template for PowerPoint & Google Slides
Comparison

Direct Marketing Research Surveys template for PowerPoint & Google Slides
Marketing

PESO Model Marketing Diagram Template for PowerPoint & Google Slides
Digital Marketing

Marketing Communication Mix Infographic Template for PowerPoint & Google Slides
Marketing

Internet Marketing Megaphone with Icons Template for PowerPoint & Google Slides
Process

Target Marketing Infographic Callouts Template for PowerPoint & Google Slides
Circle

Digital Marketing Media Plan Infographic Template for PowerPoint & Google Slides
Digital Marketing

Concentric Marketing Matrix Slide Template for PowerPoint & Google Slides
Circle

Channel Marketing Plan Layered Diagram Template for PowerPoint & Google Slides
Process

Marketing Mix Infographic Presentation Template for PowerPoint & Google Slides
Circle

Marketing 7C Compass Model Infographic Template for PowerPoint & Google Slides
Circle

Marketing Matrix Brand Quadrant Diagram Template for PowerPoint & Google Slides
Process

Dynamic Marketing Radar Chart Analytics Template for PowerPoint & Google Slides
Comparison

4Rs of Personalization Marketing Template for PowerPoint & Google Slides
Marketing

Product Marketing Tree Diagram Template for PowerPoint & Google Slides
Marketing

Free Marketing Agency Deck Template for PowerPoint & Google Slides
Pitch Deck
Free

8Ps of Marketing Model Infographic Template for PowerPoint & Google Slides
Marketing

Marketing Roadmap with Four Callouts Template for PowerPoint & Google Slides
Roadmap

8Ps of Marketing Strategy Infographic Template for PowerPoint & Google Slides
Marketing

Success Marketing Gradient Pamphlet Template for PowerPoint & Google Slides
Marketing

Modern Marketing Agency Pitch Deck Template for PowerPoint & Google Slides
Pitch Deck

RABOSTIC Marketing Model Process Diagram Template for PowerPoint & Google Slides
Process

Free Blue Gradient Marketing Plan Slide Deck Template for PowerPoint & Google Slides
Marketing
Free

Circular Hub Digital Marketing Strategy Template for PowerPoint & Google Slides
Digital Marketing

Inverted Sales Funnel Marketing Stages Template for PowerPoint & Google Slides
Marketing Funnel

Free Vertical Marketing Consultancy Presentation Template for PowerPoint & Google Slides
Company Profile
Free

Car Dealership Marketing Presentation Template for PowerPoint & Google Slides
Company Profile

Dagmar Model Marketing Funnel Diagram Template for PowerPoint & Google Slides
Funnel

Email Marketing Strategy Circular Template for PowerPoint & Google Slides
Process

Marketing Operations Venn Diagram Template for PowerPoint & Google Slides
Circle

5D Digital Marketing Flow Diagram Template for PowerPoint & Google Slides
Digital Marketing

Product Marketing Framework Circular Template for PowerPoint & Google Slides
Circle

DESTEP Marketing Analysis Diagram Template for PowerPoint & Google Slides
Circle

Podcast Marketing Strategy and Key Types Template for PowerPoint & Google Slides
Digital Marketing

Digital Marketing KPIs Dashboard Dark Template for PowerPoint & Google Slides
Business Report

Digital Marketing Client Testimonials Template for PowerPoint & Google Slides
Accomplishment

Product Marketing Company Profile Deck Template for PowerPoint & Google Slides
Company Profile

Social Proof and Reviews in Marketing template for PowerPoint & Google Slides
Customer Journey

Influencer Marketing Overview template for PowerPoint & Google Slides
Business

Email Marketing Template for PowerPoint & Google Slides
Digital Marketing

Marketing Campaign Calendar template for PowerPoint & Google Slides
Business

Outbound Marketing Circular Diagram Template for PowerPoint & Google Slides
Advertising

Marketing Case Study Overview template for PowerPoint & Google Slides
Digital Marketing

Data-Driven Marketing Lifecycle Diagram Template for PowerPoint & Google Slides
Process

Account Based Marketing Circular Infographic Template for PowerPoint & Google Slides
Marketing

Digital Marketing Channels Comparison template for PowerPoint & Google Slides
Business

Four-Stage Marketing Funnel Template for PowerPoint & Google Slides
Marketing Funnel

5-Step Marketing Funnel Template for PowerPoint & Google Slides
Marketing Funnel

Marketing Budget Table Template for PowerPoint & Google Slides
Business

Marketing Budget Allocation Breakdown Template for PowerPoint & Google Slides
Finance

HCP Marketing Strategy Template for PowerPoint & Google Slides
Marketing


