Key Numbers Grid Layout Infographic Template for PowerPoint & Google Slides
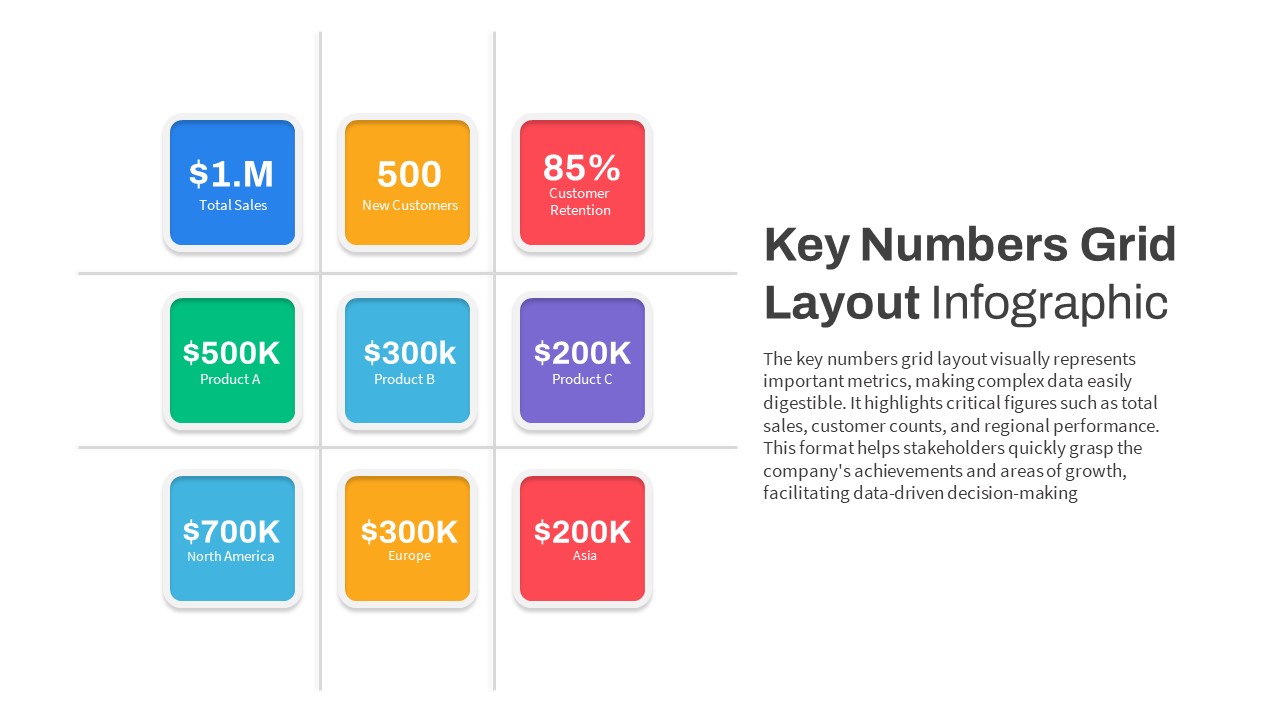
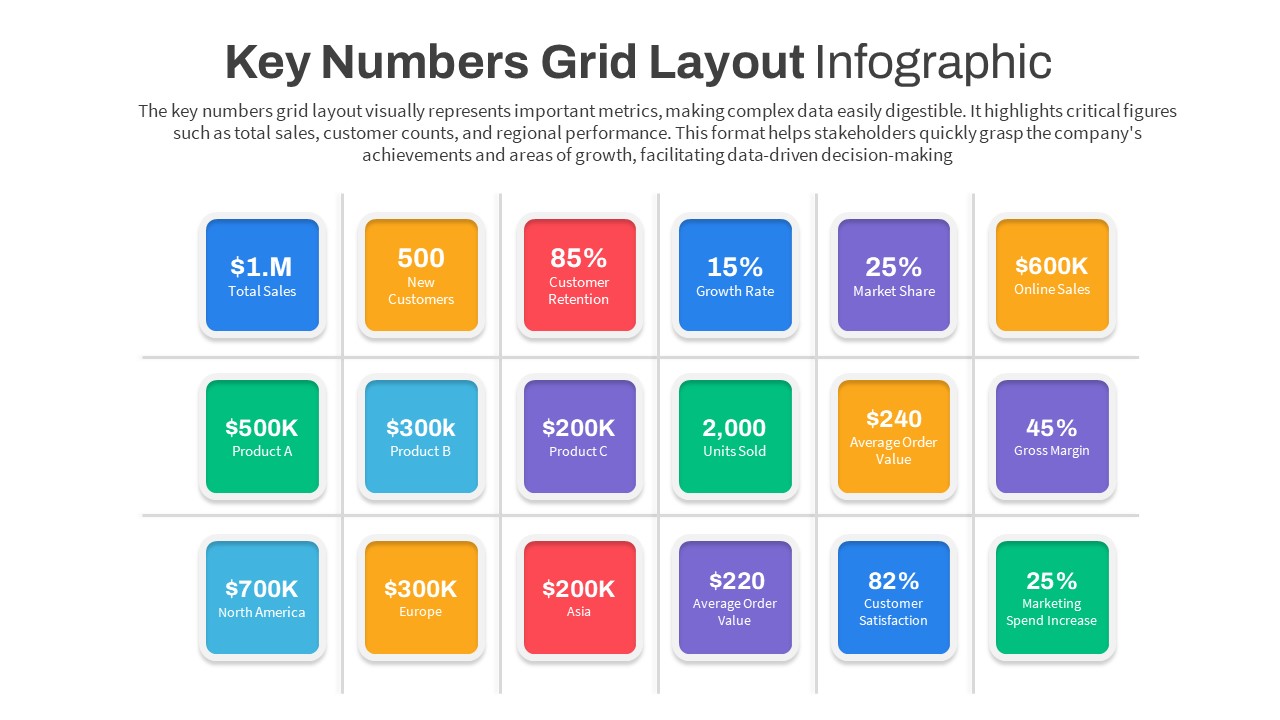
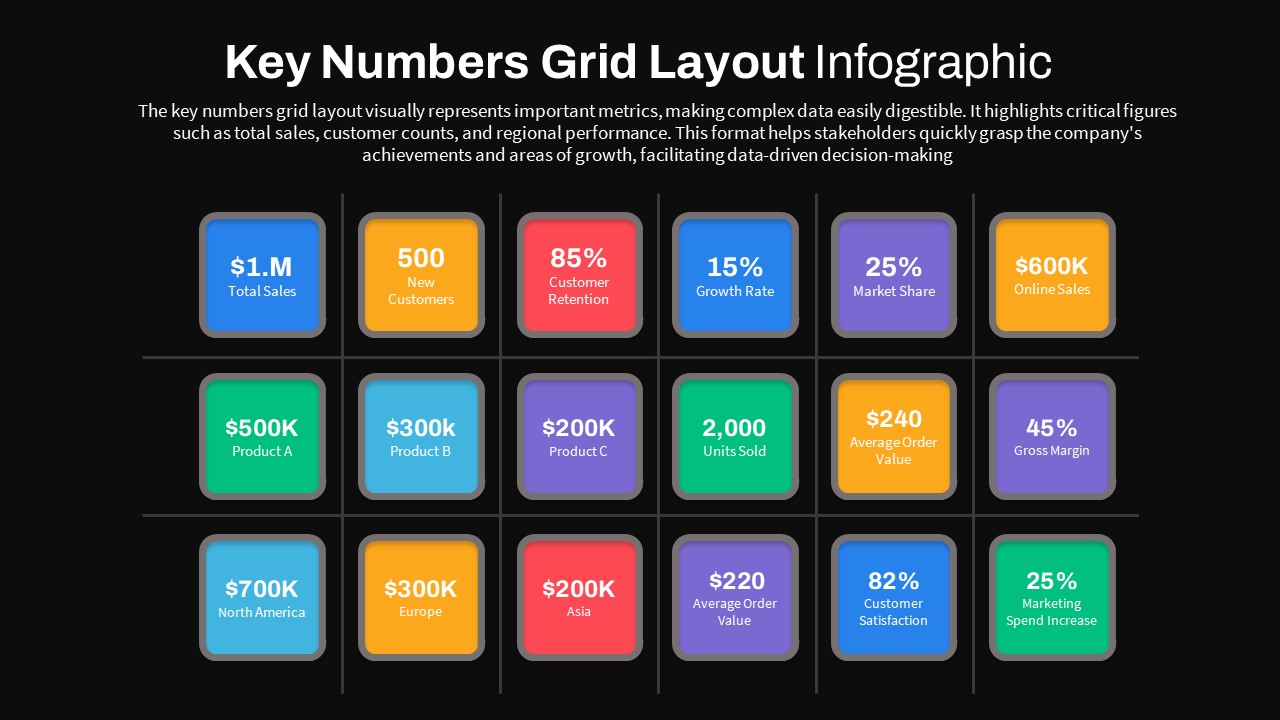
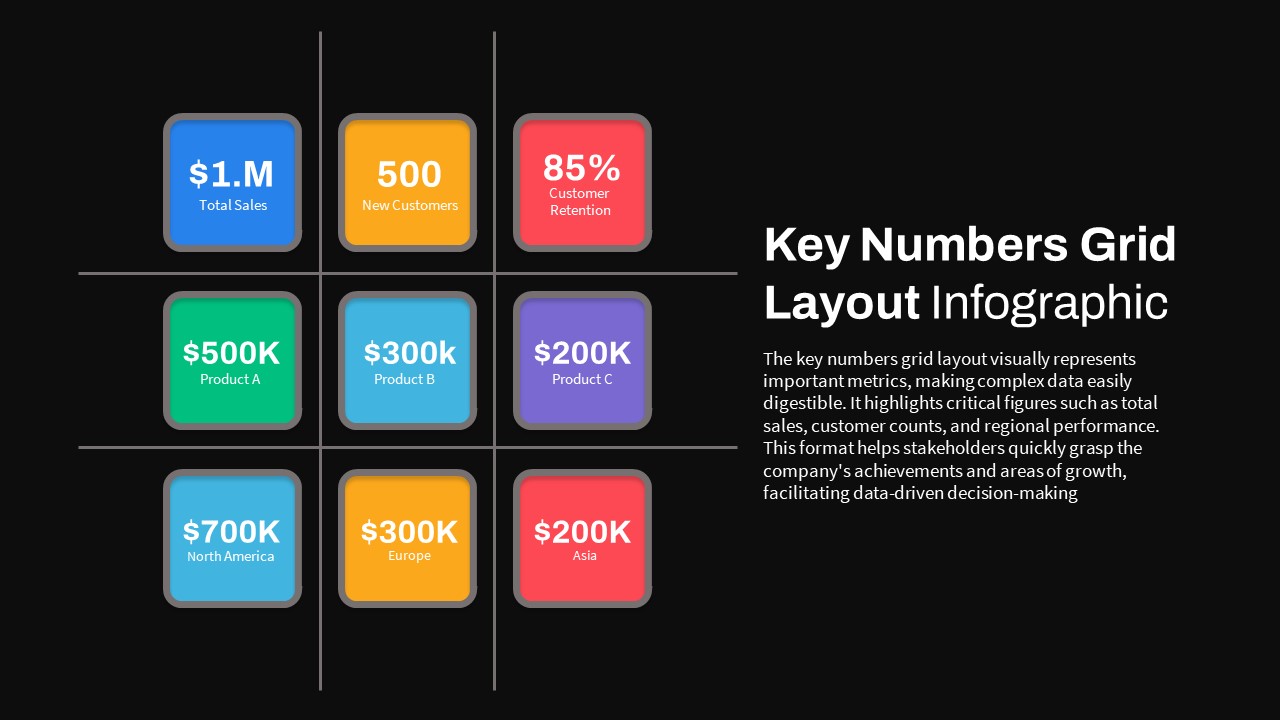


Leverage this key numbers grid layout infographic template to present critical metrics in a structured and vibrant format. The slide features a customizable grid of rounded-square tiles with contrasting backgrounds and subtle drop shadows, each highlighting a specific KPI. Every tile includes a bold number headline and a supporting label, making it easy to showcase total sales, new customers, retention rates, regional performance, or any data point at a glance. Optional dividing lines reinforce grid alignment and content hierarchy, guiding audience focus and improving readability.
Designed for seamless editing, master slides allow you to adjust grid dimensions, tile colors, and typography without altering the overall layout. Replace placeholder text with your own figures, swap icons or reorder tiles in seconds. Editable vector shapes ensure crisp visuals at any resolution, while theme-aware color palettes and font settings propagate automatically across all elements. This streamlined workflow helps you deliver professional-quality presentations with minimal effort.
Beyond core financial dashboards, this flexible layout adapts to a wide range of use cases—product feature summaries, market comparisons, sales results, and performance reviews. Expand or contract the grid, alter tile labels, or integrate icons and images to fit any context. The high-contrast color treatments preserve brand integrity and facilitate quick metric recognition, whether you’re presenting in a boardroom or sharing remotely.
Fully compatible with PowerPoint and Google Slides, this template guarantees consistent rendering across devices and screen sizes. Vector-based tiles and intuitive placeholders deliver sharp visuals on projectors, monitors, and printed handouts. Global theme settings let you swap brand colors or fonts across every tile simultaneously, maintaining design cohesion and saving preparation time.
Who is it for
Financial analysts, marketing managers, executive teams, and investor relations professionals will benefit from this infographic when reporting quarterly results, annual reviews, or performance KPIs. Consultants and trainers can also use it to illustrate benchmarks and comparisons clearly.
Other Uses
Repurpose this layout for product roadmaps, competitive analyses, sales pipeline snapshots, or organizational performance summaries. Its versatile grid design makes it ideal for dashboards, scorecards, or any data-driven storytelling.
Login to download this file

Item ID
SB04298
Related Templates

Elegant Diamond Photo Grid Layout Template for PowerPoint & Google Slides
Graphics
Modern Mosaic Photo Grid Layout Template for PowerPoint & Google Slides
Graphics
Creative Photo Collage Grid Layout Template for PowerPoint & Google Slides
Graphics
Dessert Photo Collage Grid Layout Template for PowerPoint & Google Slides
Graphics
Rounded Numbers List Infographic Template for PowerPoint & Google Slides
Comparison
SWOT Analysis Grid Infographic Template for PowerPoint & Google Slides
SWOT
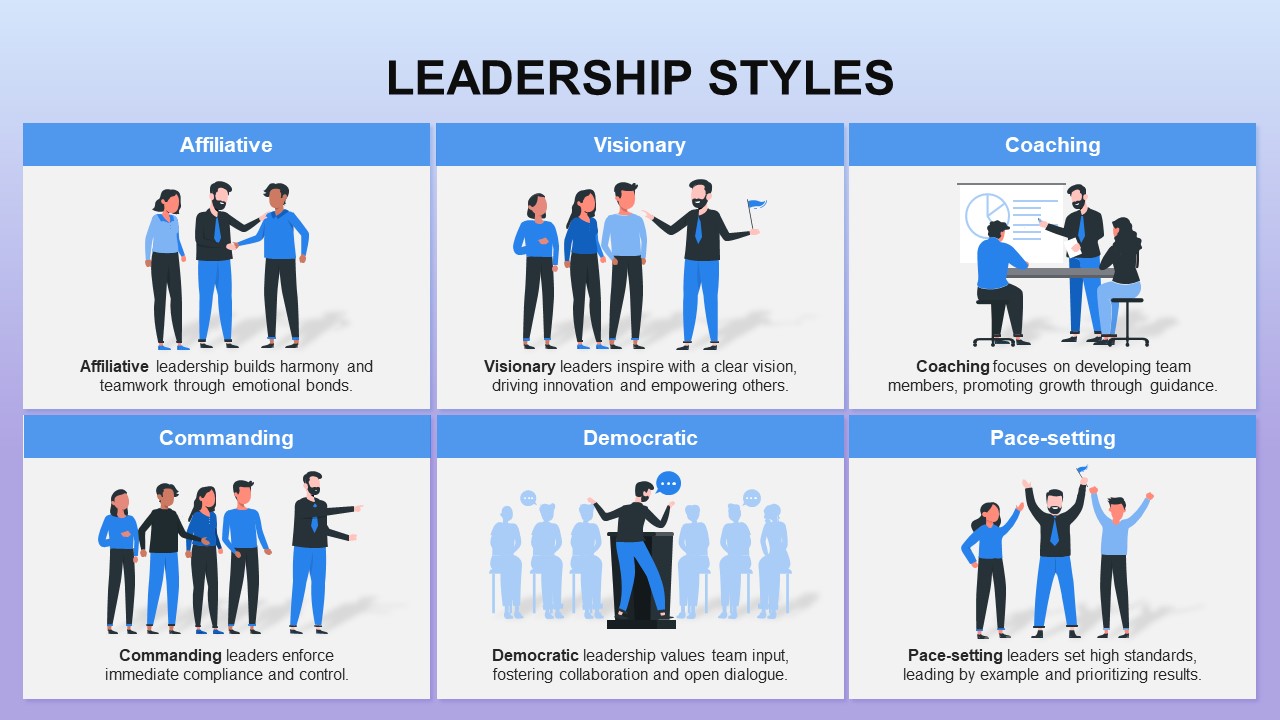
Six Leadership Styles Grid Infographic Template for PowerPoint & Google Slides
Leadership
Professional Key Highlights Layout Template for PowerPoint & Google Slides
Business
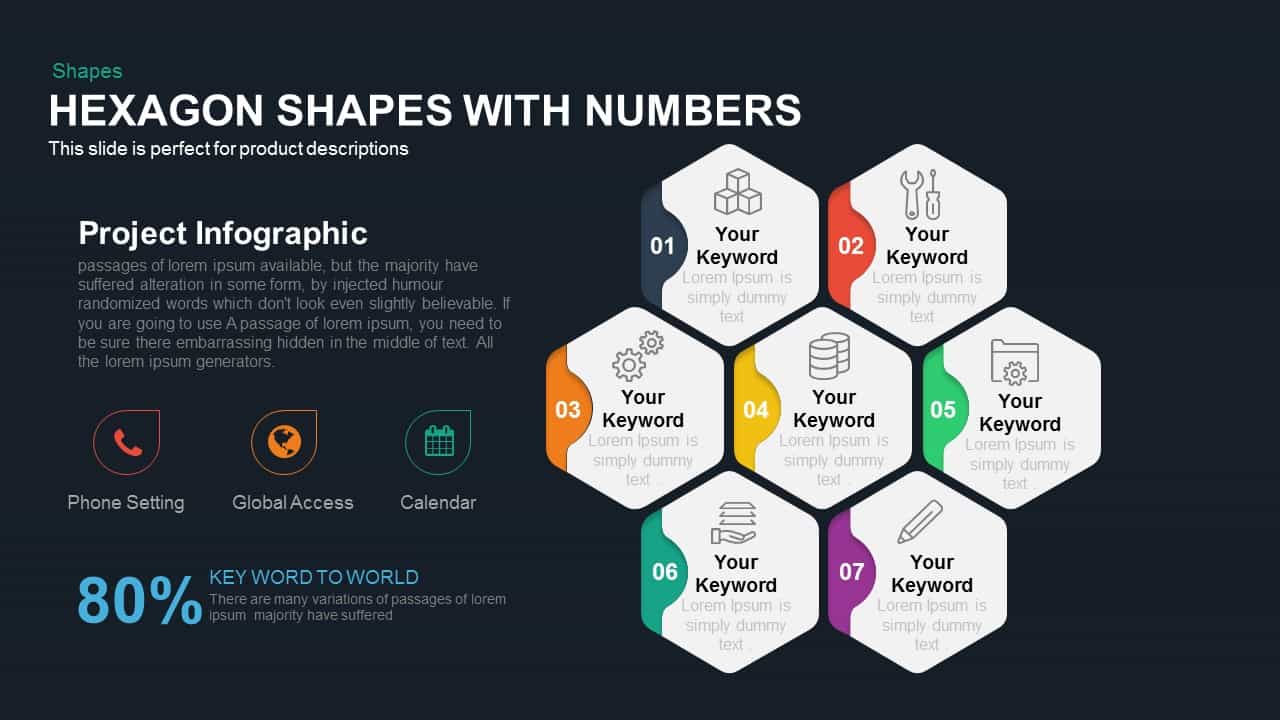
Hexagon Shapes with Numbers Process Template for PowerPoint & Google Slides
Process
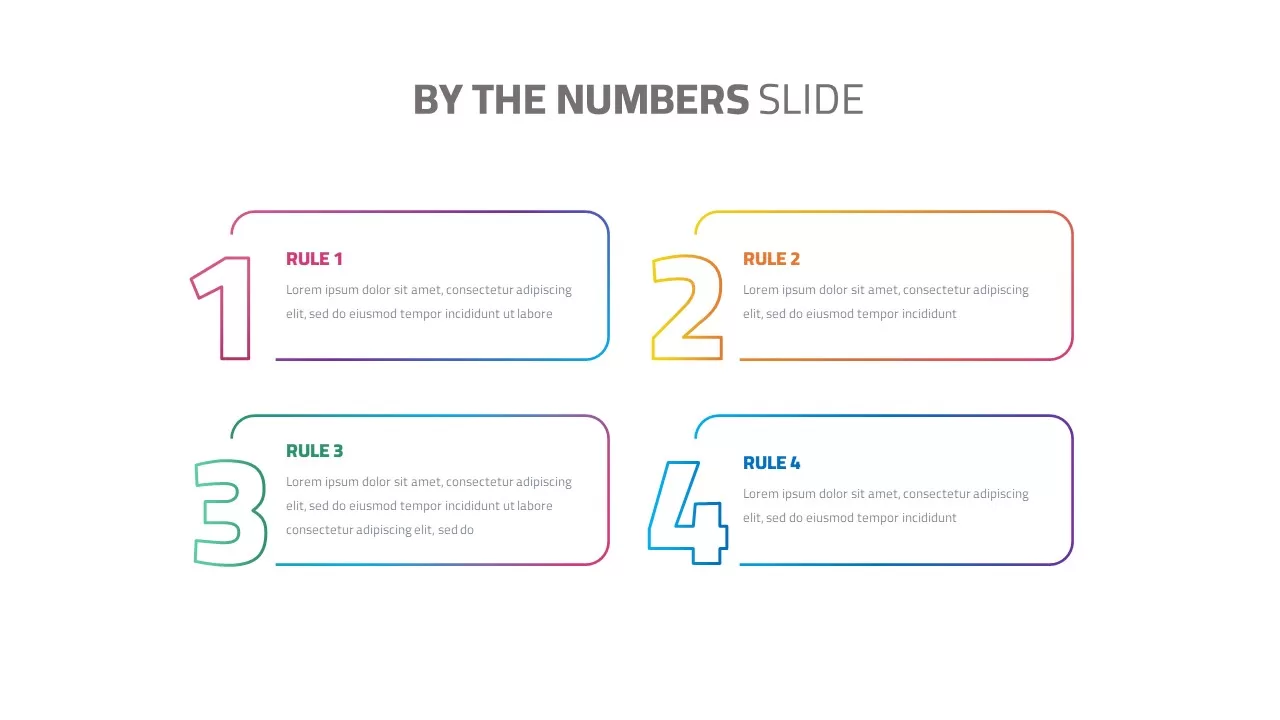
By the Numbers Slide template for PowerPoint & Google Slides
Infographics
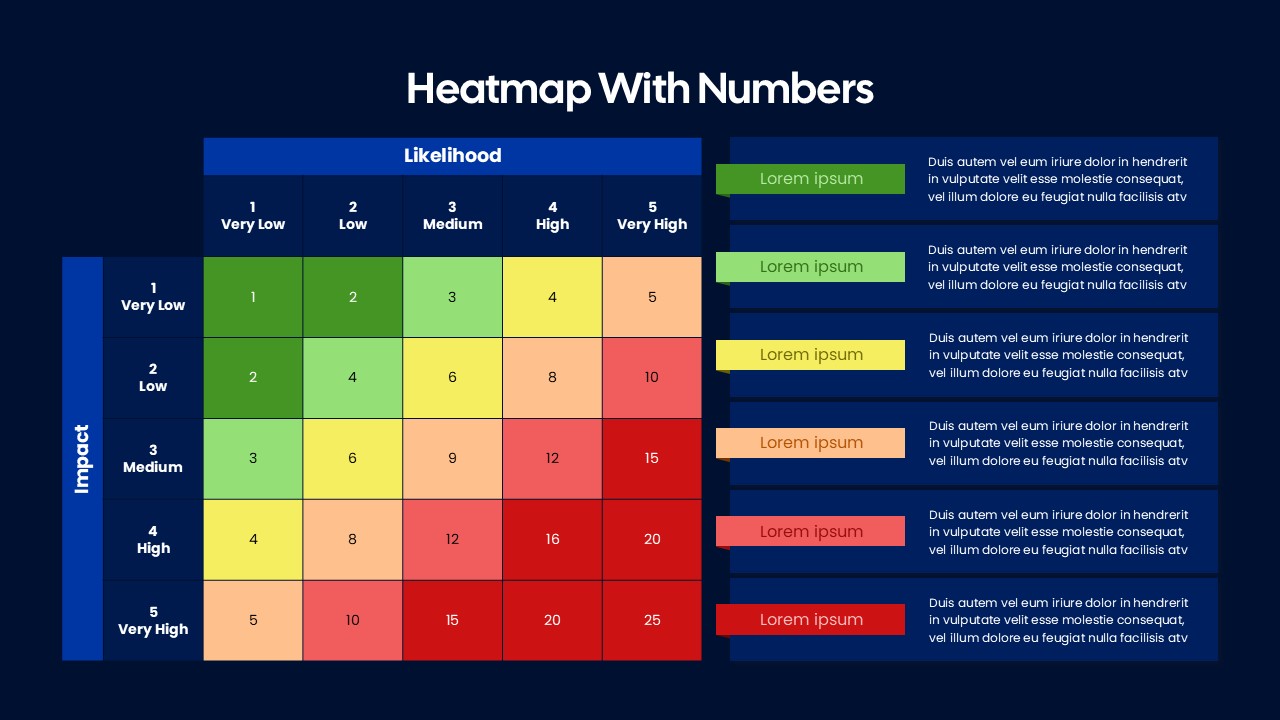
Heatmap Matrix with Numbers Template for PowerPoint & Google Slides
Project
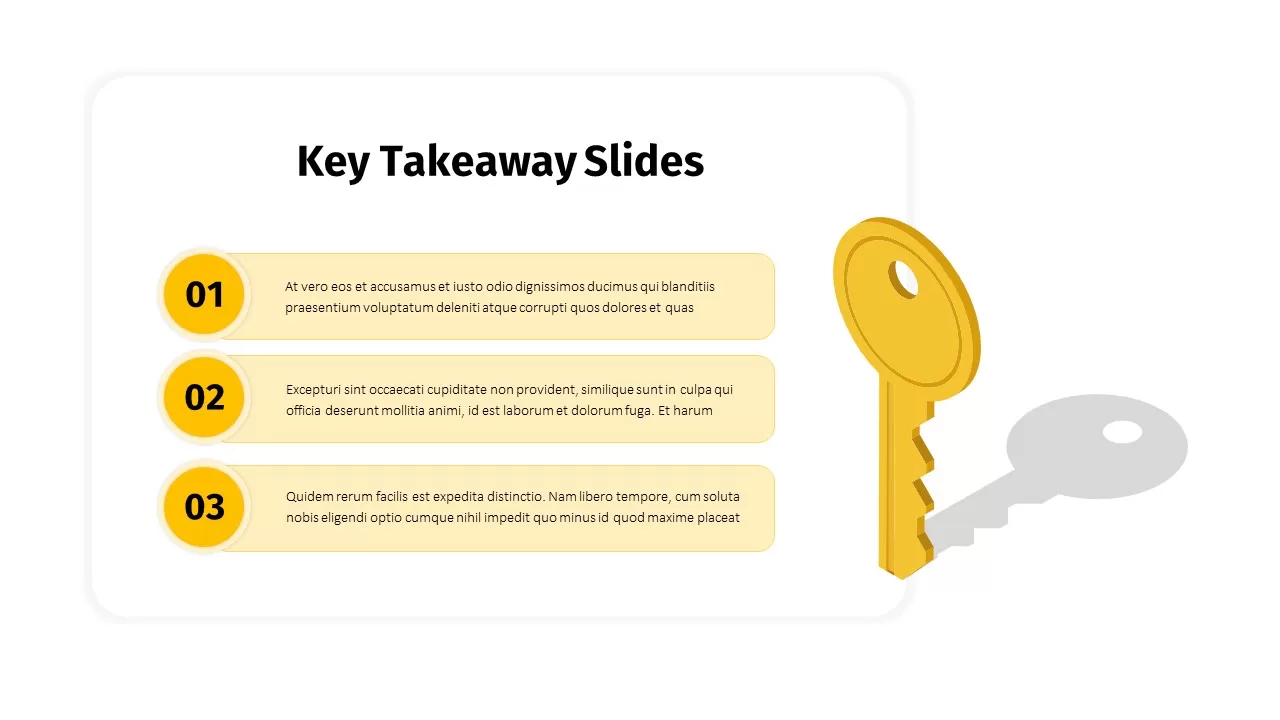
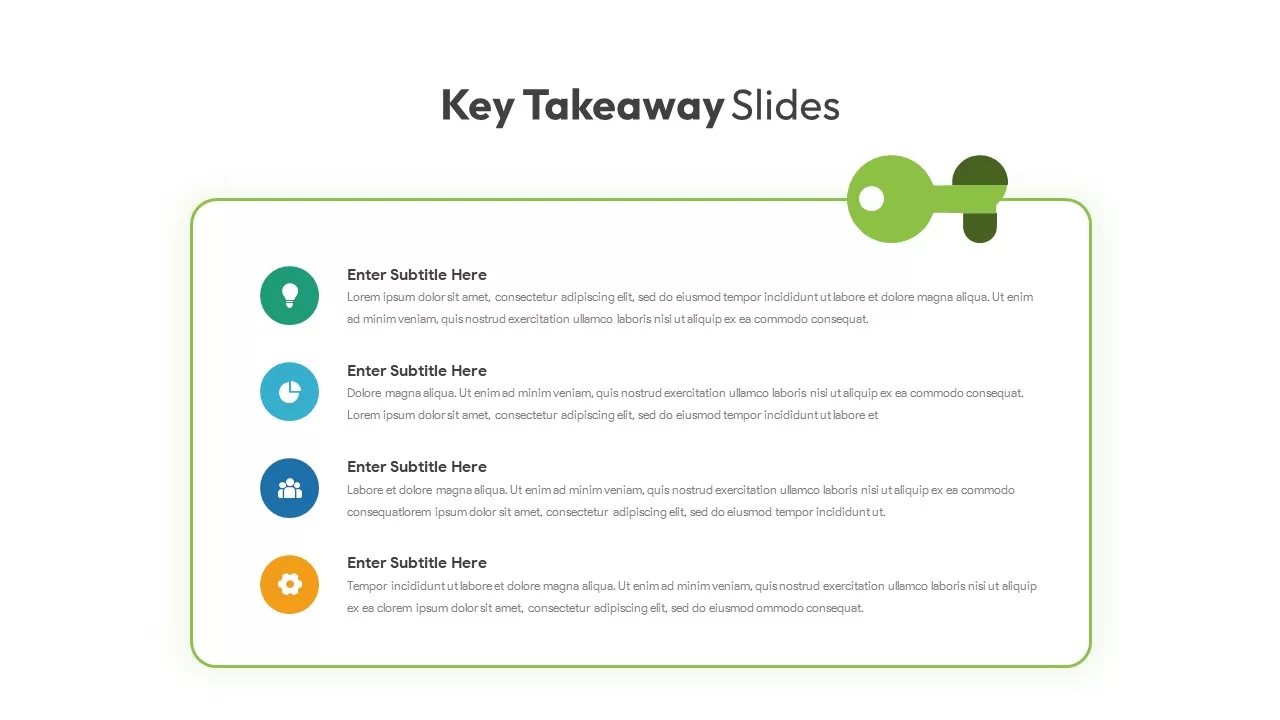
Key Takeaway Slide Template with Key Graphic for PowerPoint & Google Slides
Process
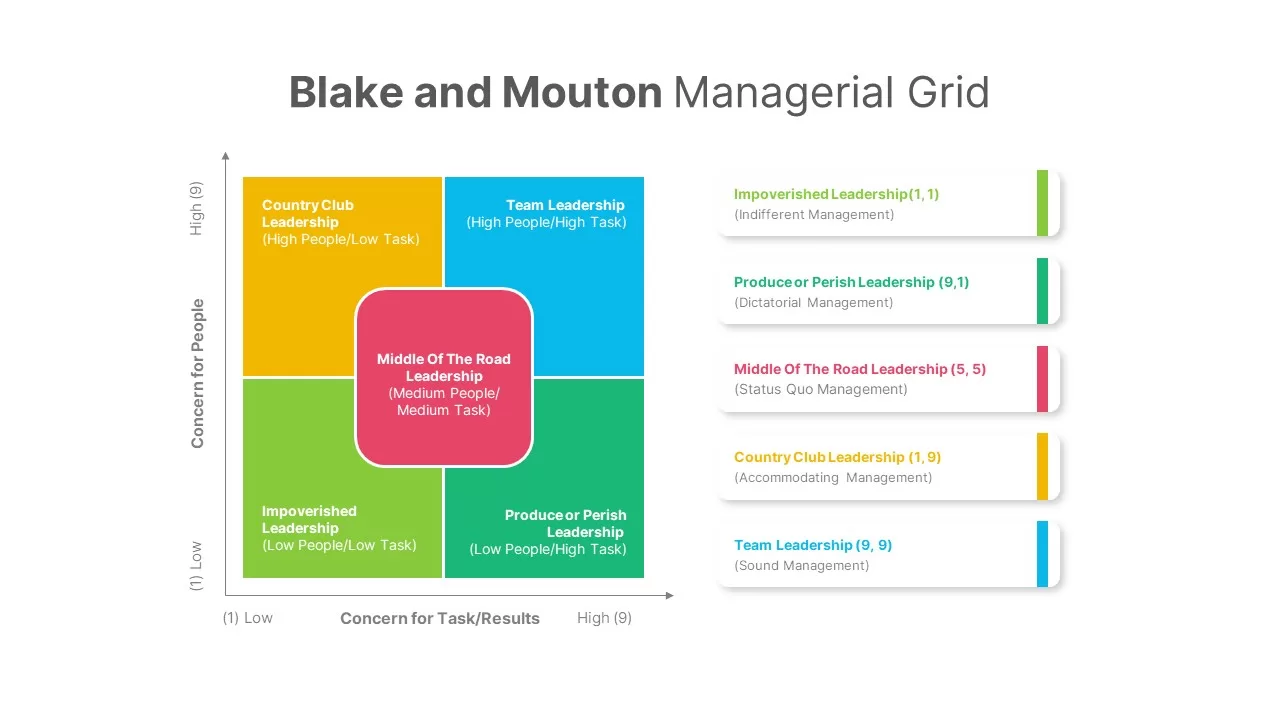
Free Blake and Mouton Leadership Grid Template for PowerPoint & Google Slides
Comparison Chart
Free
Contemporary Mosaic Photo Grid Cover Slide Template for PowerPoint & Google Slides
Company Profile
Popular Social Media Comparison Grid Template for PowerPoint & Google Slides
Digital Marketing
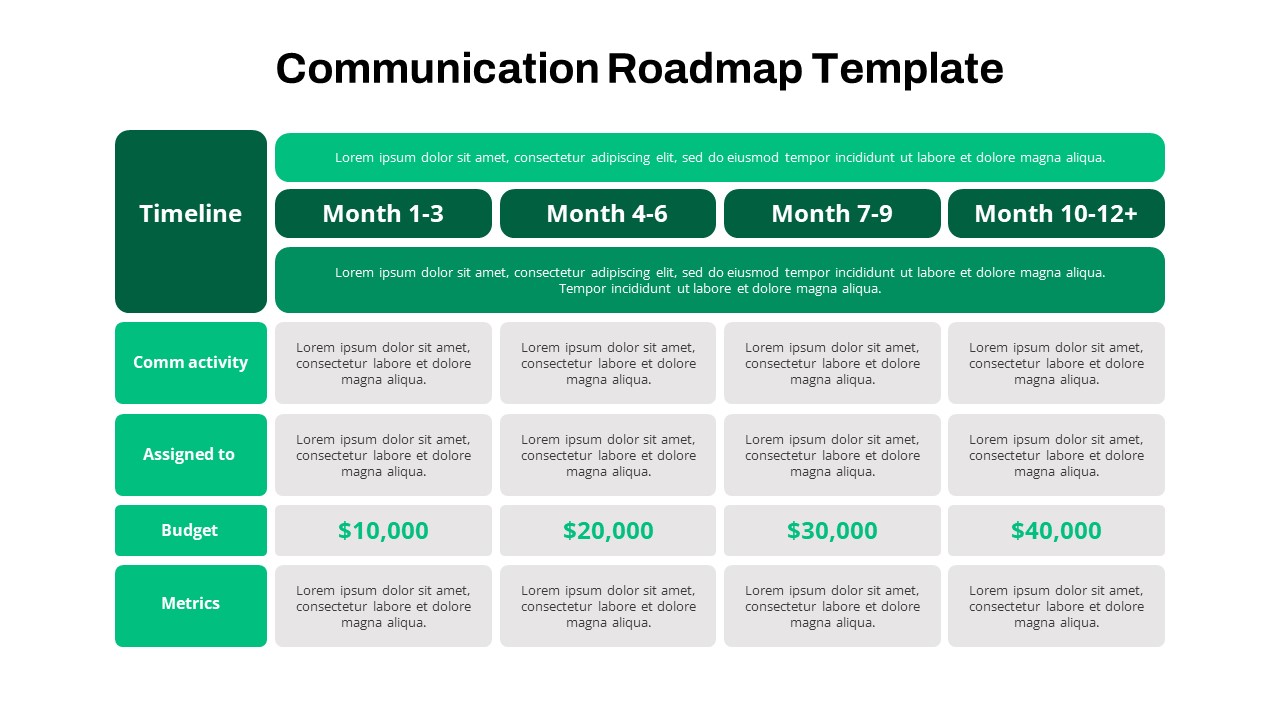
Quarterly Communication Roadmap Grid Template for PowerPoint & Google Slides
Marketing
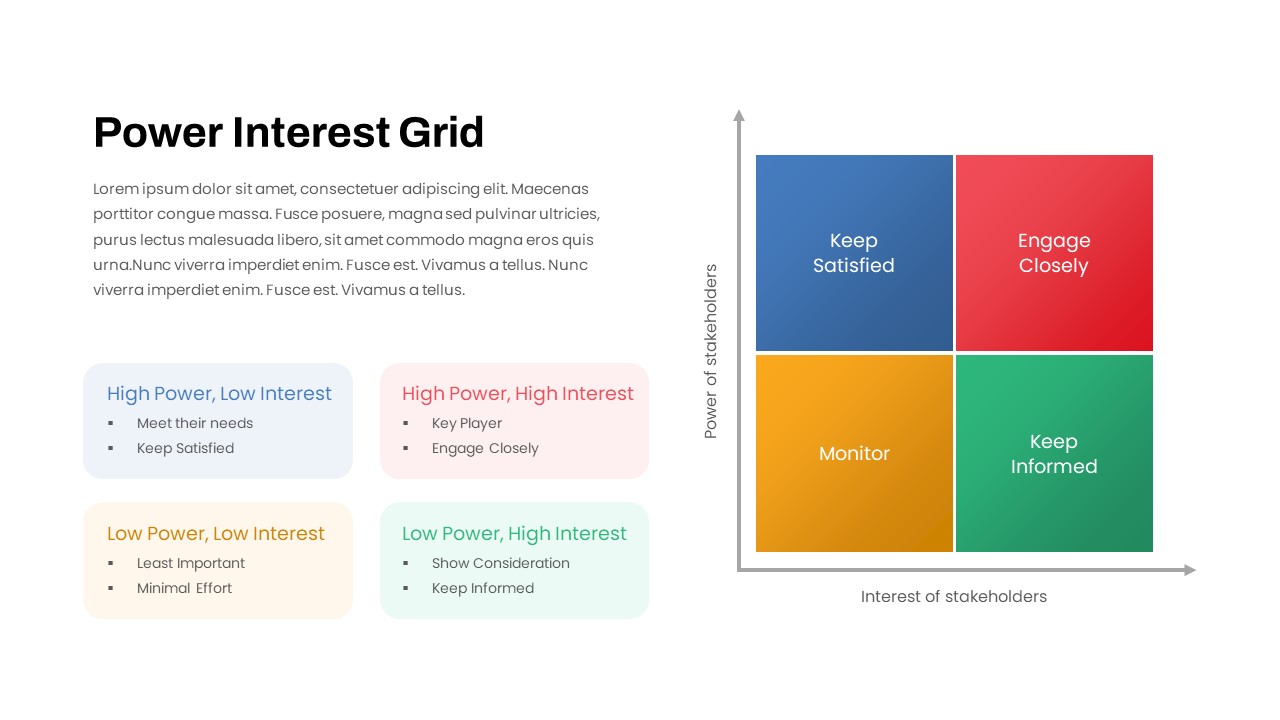
Stakeholder Power Interest Grid Template for PowerPoint & Google Slides
Comparison
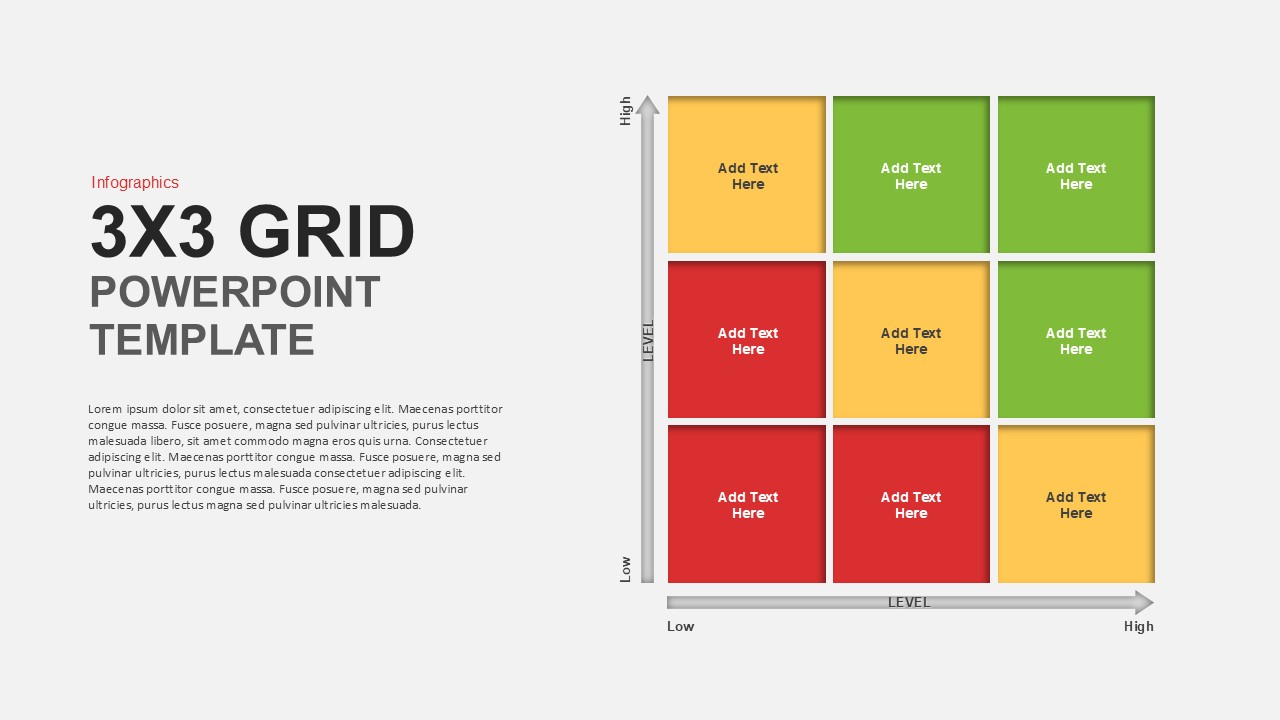
Matrix Grid Diagram Template for PowerPoint & Google Slides
Comparison
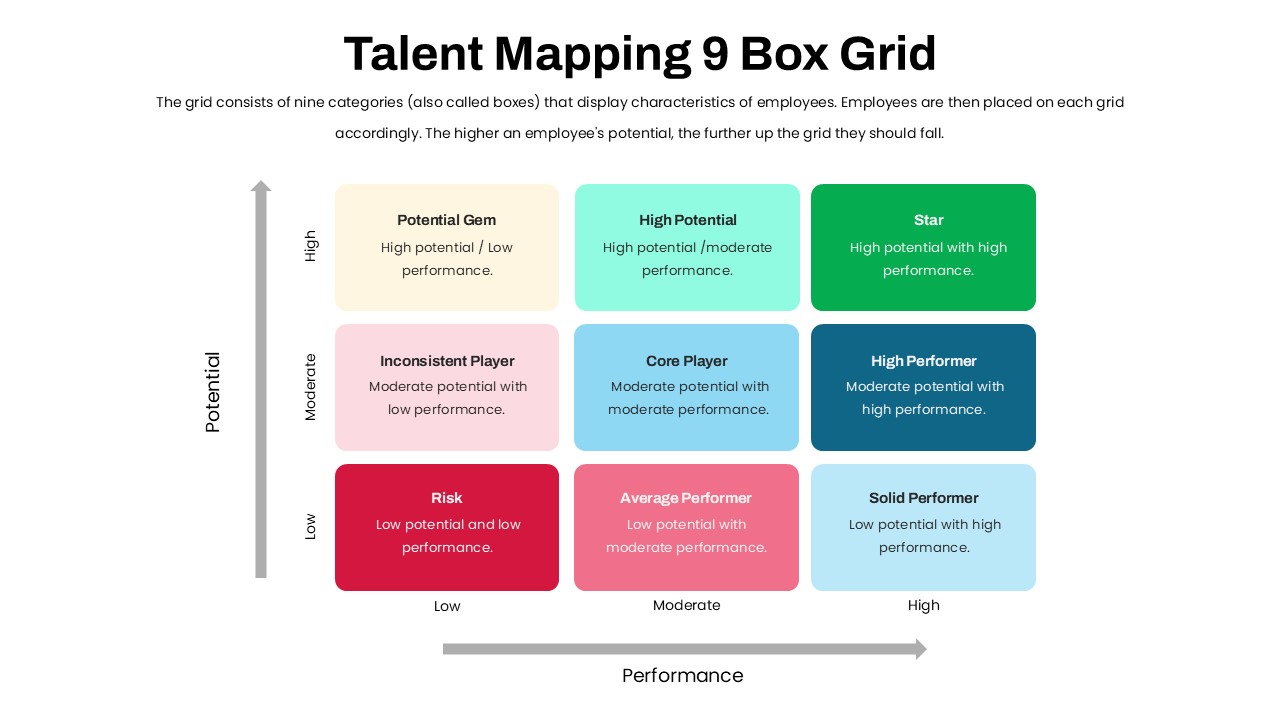
Talent Mapping 9-Box Grid Template for PowerPoint & Google Slides
Employee Performance
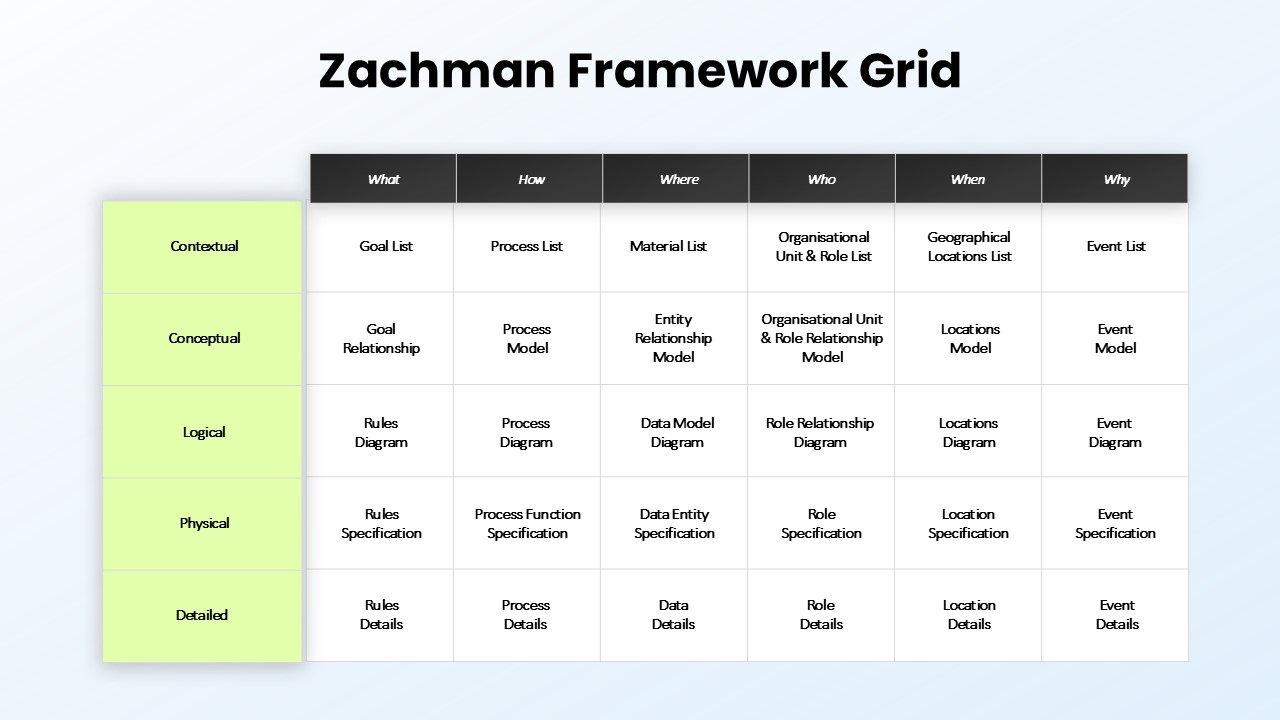
Zachman Framework Grid Overview template for PowerPoint & Google Slides
Process
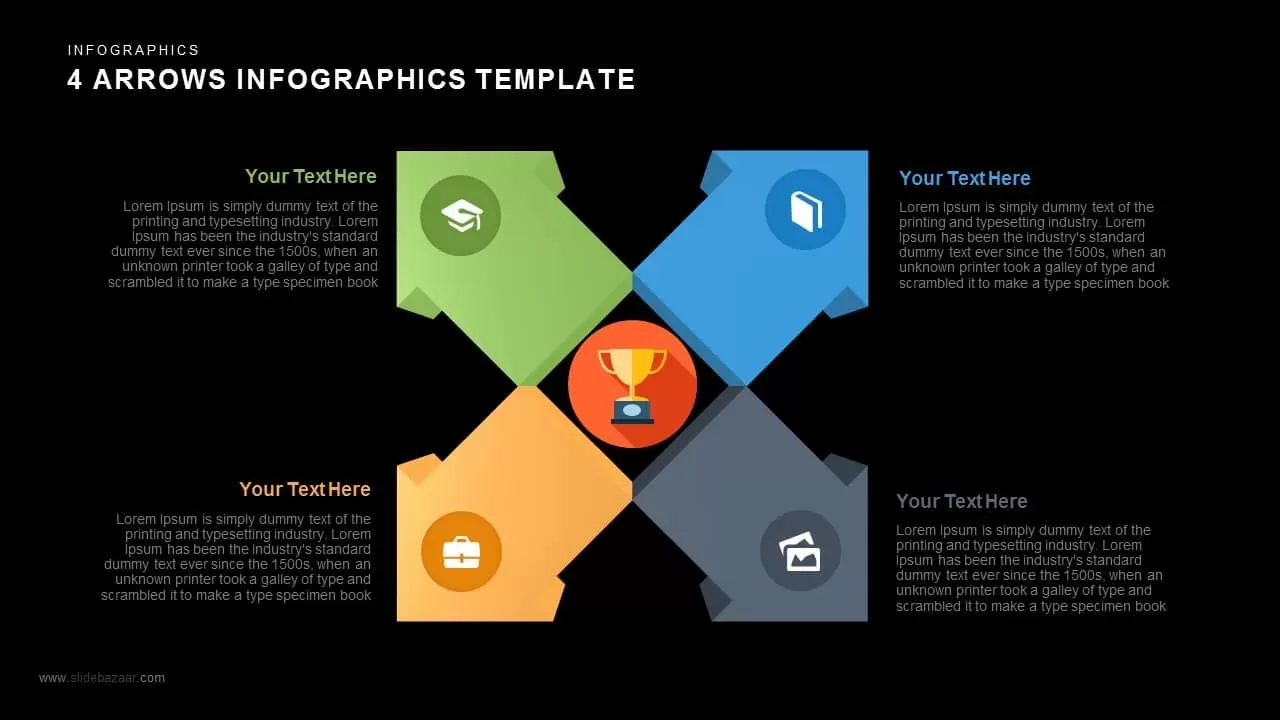
Four Arrows Layout Infographic with Icon Template for PowerPoint & Google Slides
Arrow
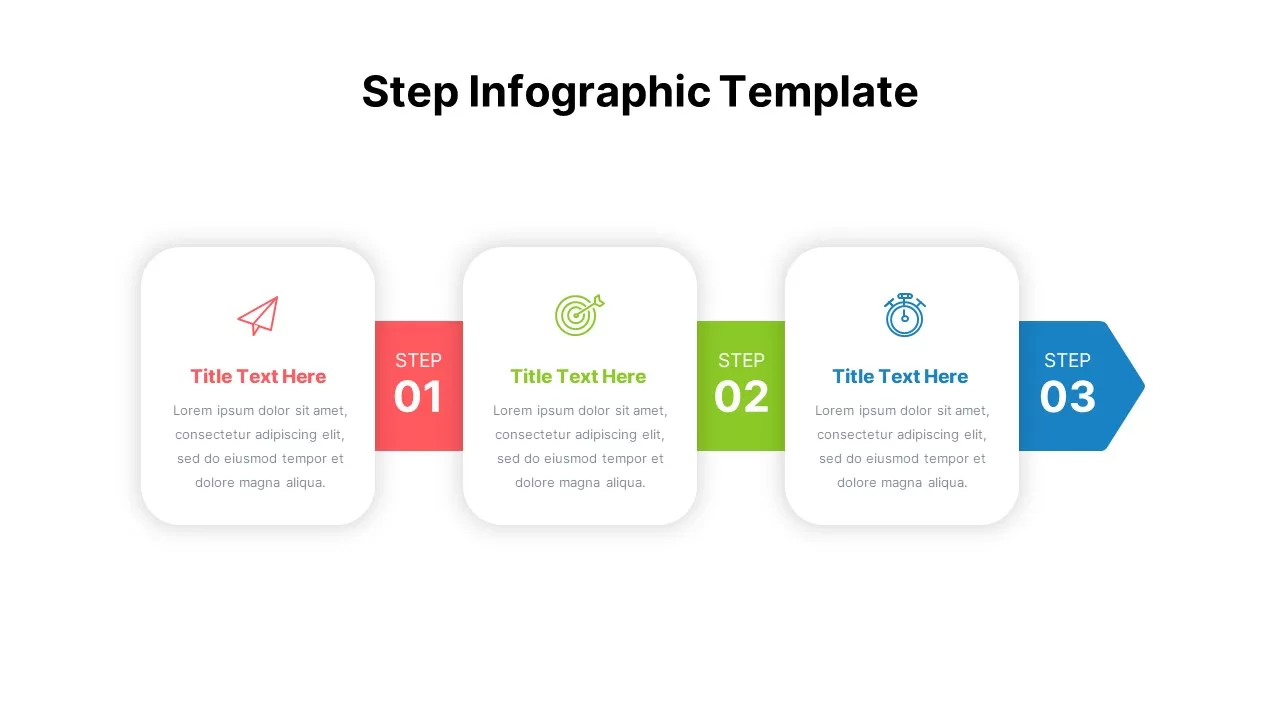
Multi-Step Infographic Process Layout Template for PowerPoint & Google Slides
Process
Six-Step Hexagon Infographic Layout Template for PowerPoint & Google Slides
Infographics
Six-Part Hexagon Infographic Layout Template for PowerPoint & Google Slides
Infographics
Automotive Infographic Multi-Layout Template for PowerPoint & Google Slides
Comparison
Hub-and-Spoke Infographic Layout Template for PowerPoint & Google Slides
Circular
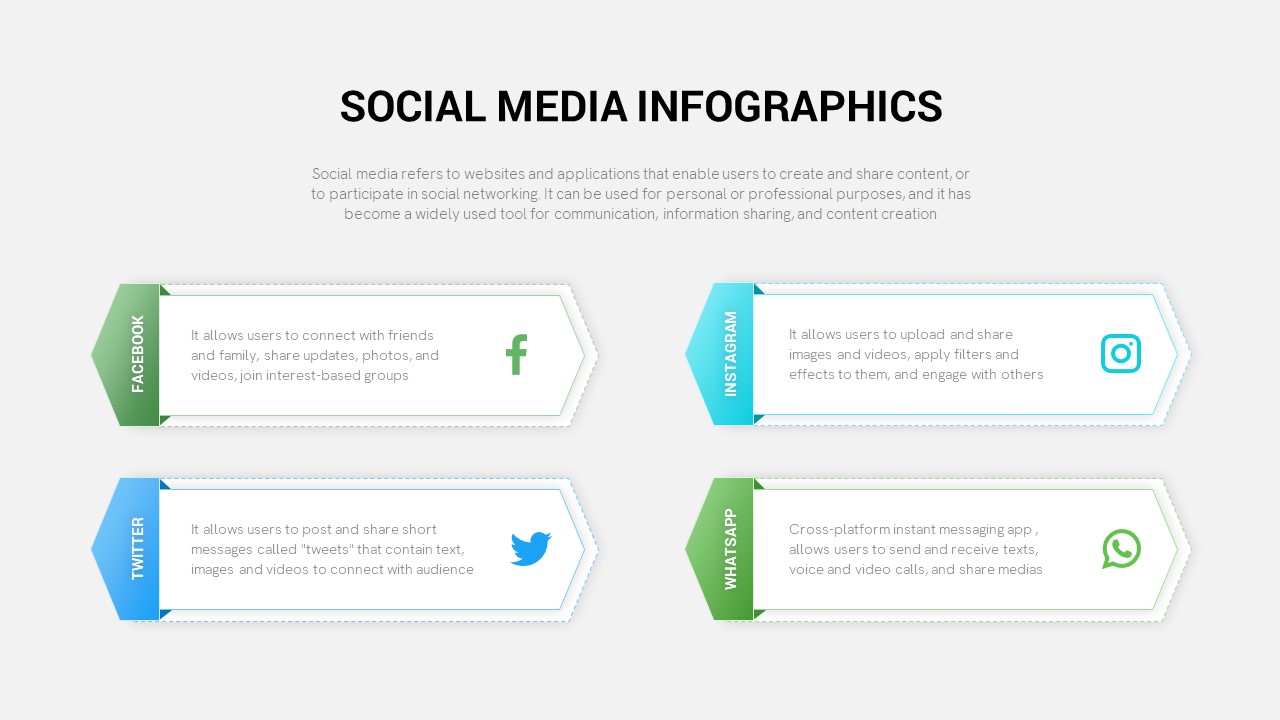
Social Media Infographic Arrow Layout Template for PowerPoint & Google Slides
Arrow
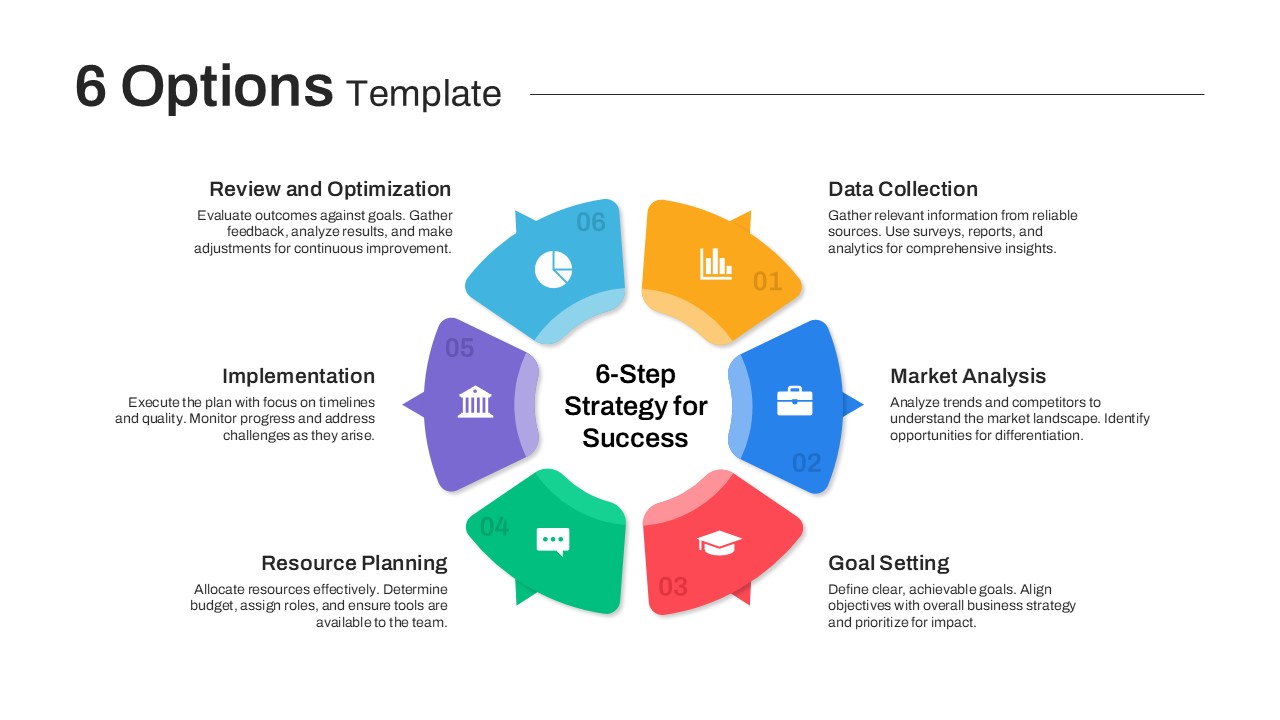
Versatile 6 Options Infographic Layout Template for PowerPoint & Google Slides
Process
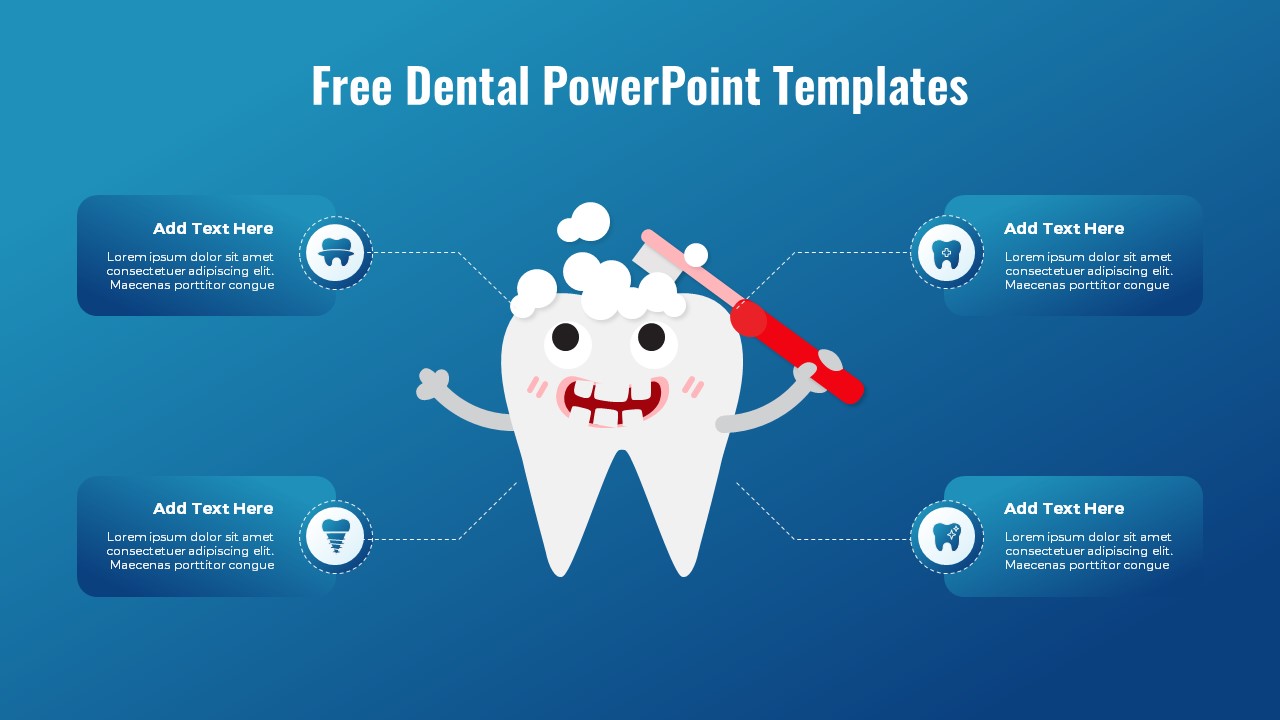
Free Cute Dental Health Infographic Layout for PowerPoint & Google Slides
Health
Free

Key Metaphor Infographic Slide Template for PowerPoint & Google Slides
Process
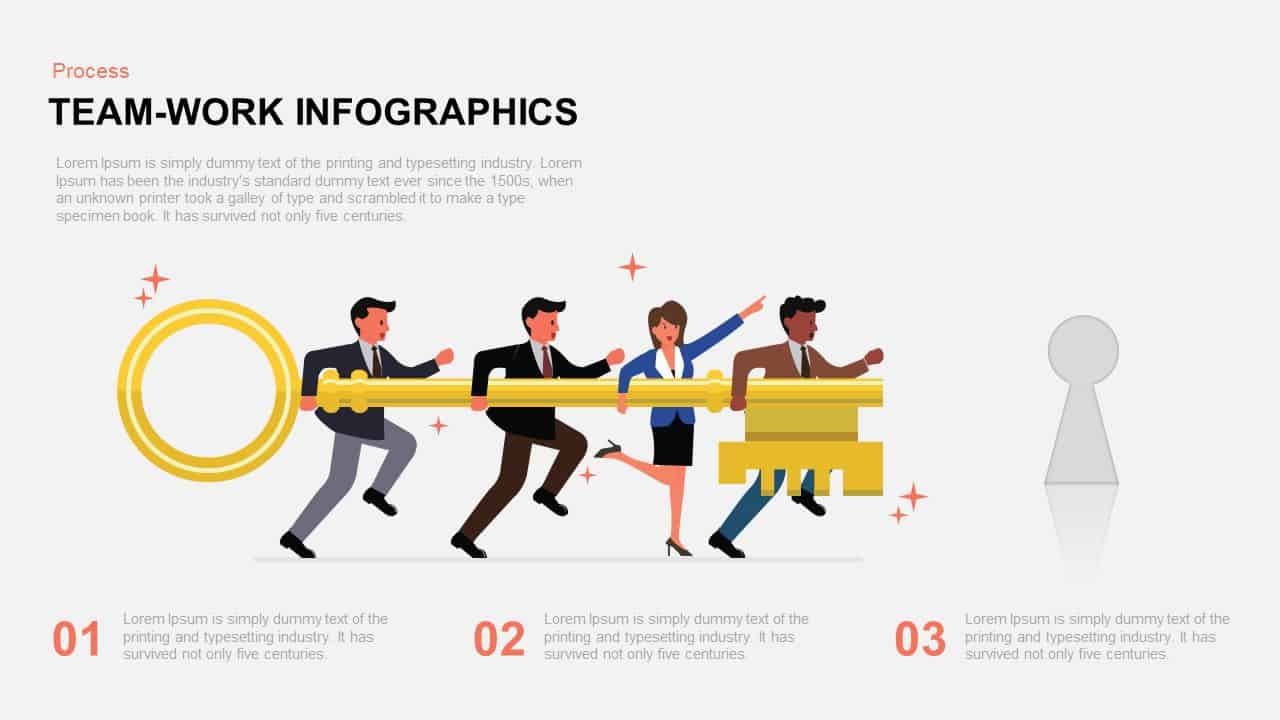
Teamwork Key Infographic Slide Template for PowerPoint & Google Slides
Process
Bird Branch Four Key Points Infographic Template for PowerPoint & Google Slides
Agenda
Five Key Flashlight Infographic Points Template for PowerPoint & Google Slides
Agenda
5 Key Points Infographic Diagram Template for PowerPoint & Google Slides
Process
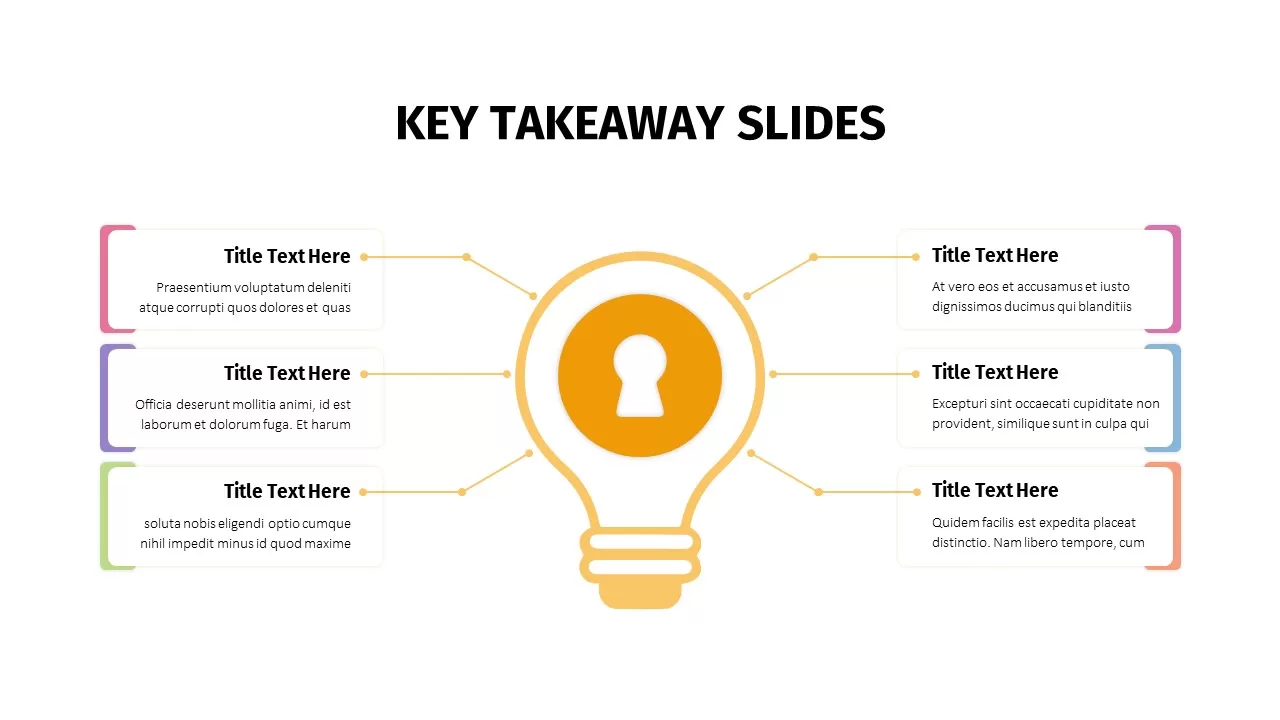
Key Takeaway Slide Infographic Template for PowerPoint & Google Slides
Process
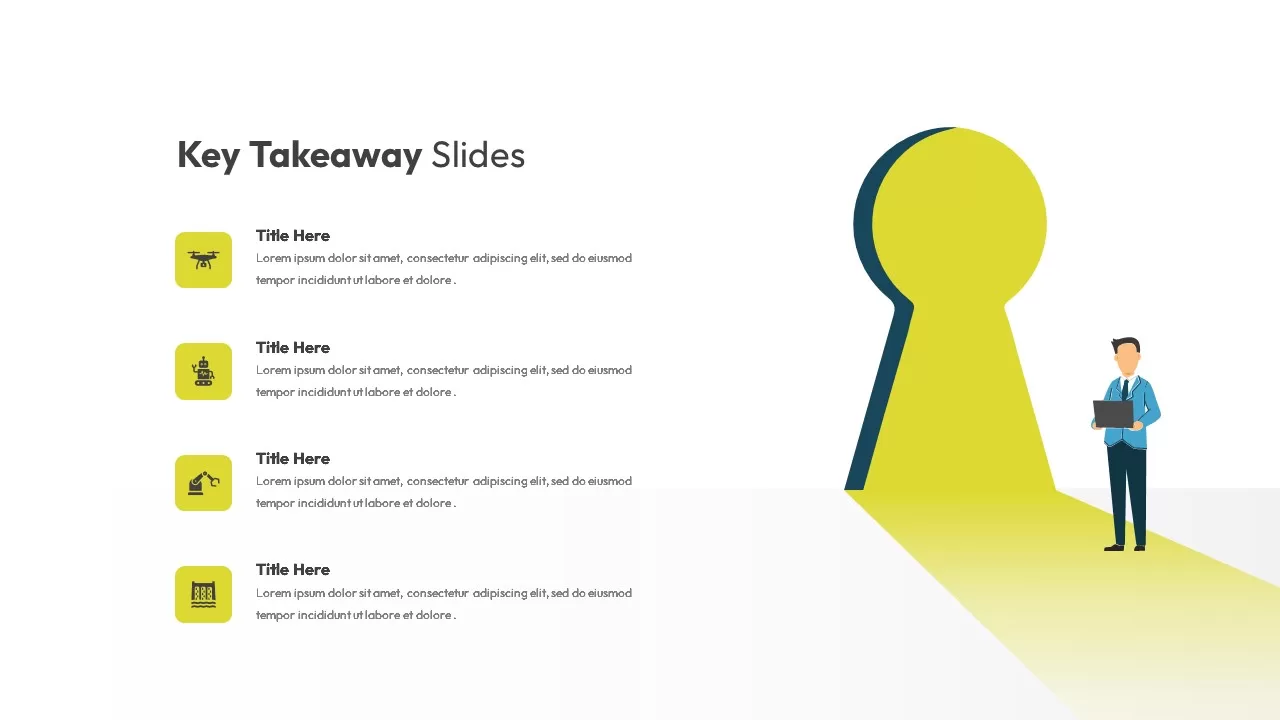
Key Takeaway Infographic Keyhole Diagram Template for PowerPoint & Google Slides
Process
Key Takeaway Infographic Slide Deck Template for PowerPoint & Google Slides
Process
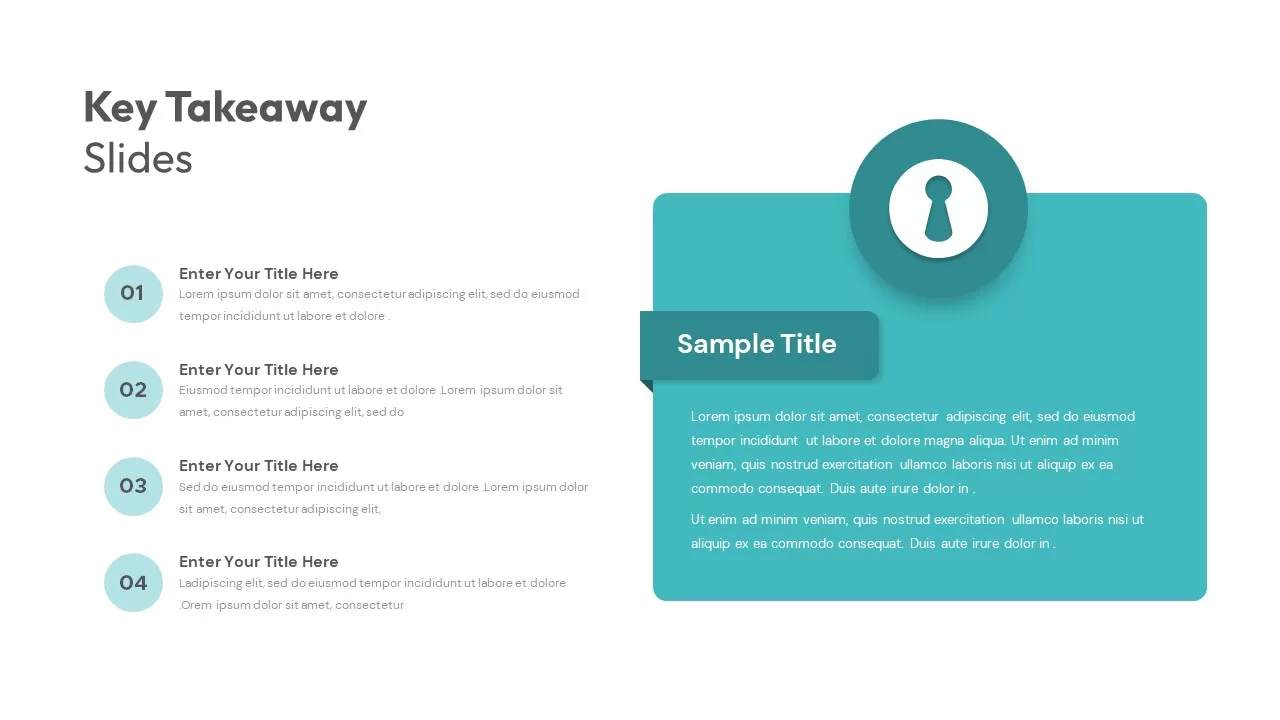
Key Takeaway Keyhole Infographic Slide Template for PowerPoint & Google Slides
Process
Animated Key Takeaway Spoke Infographic Template for PowerPoint & Google Slides
Infographics
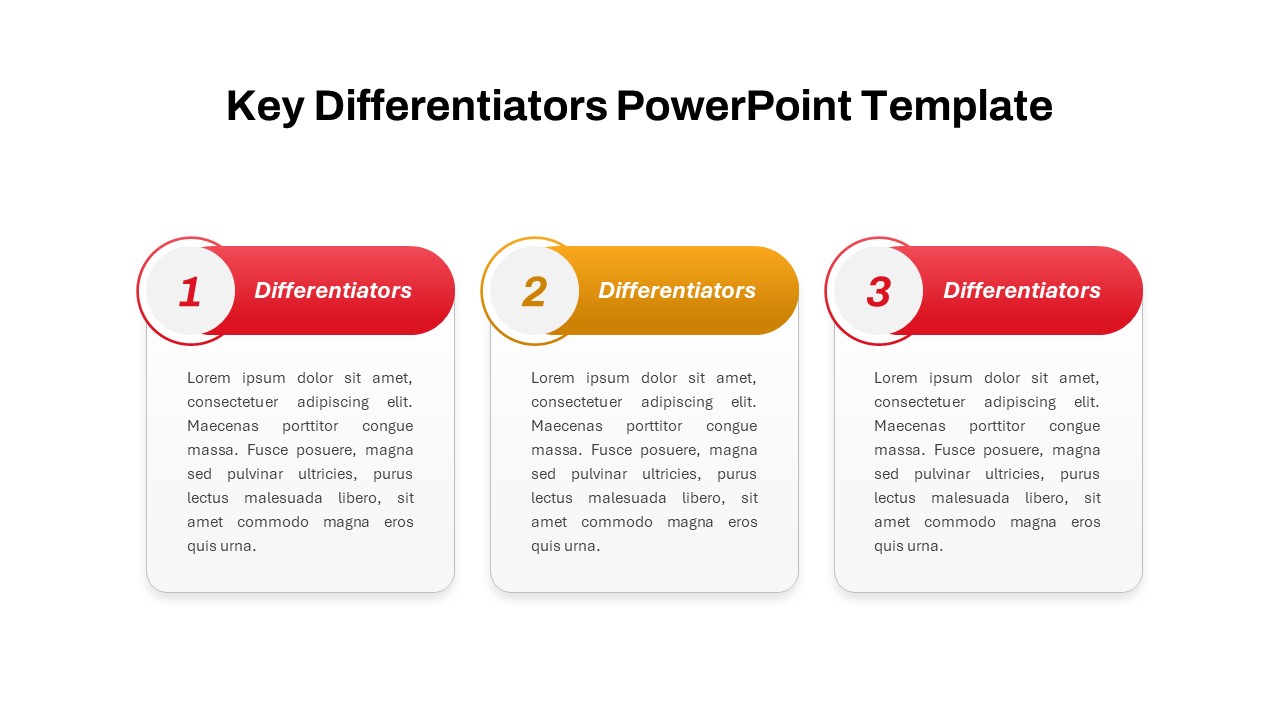
Key Differentiators Infographic Template for PowerPoint & Google Slides
Process
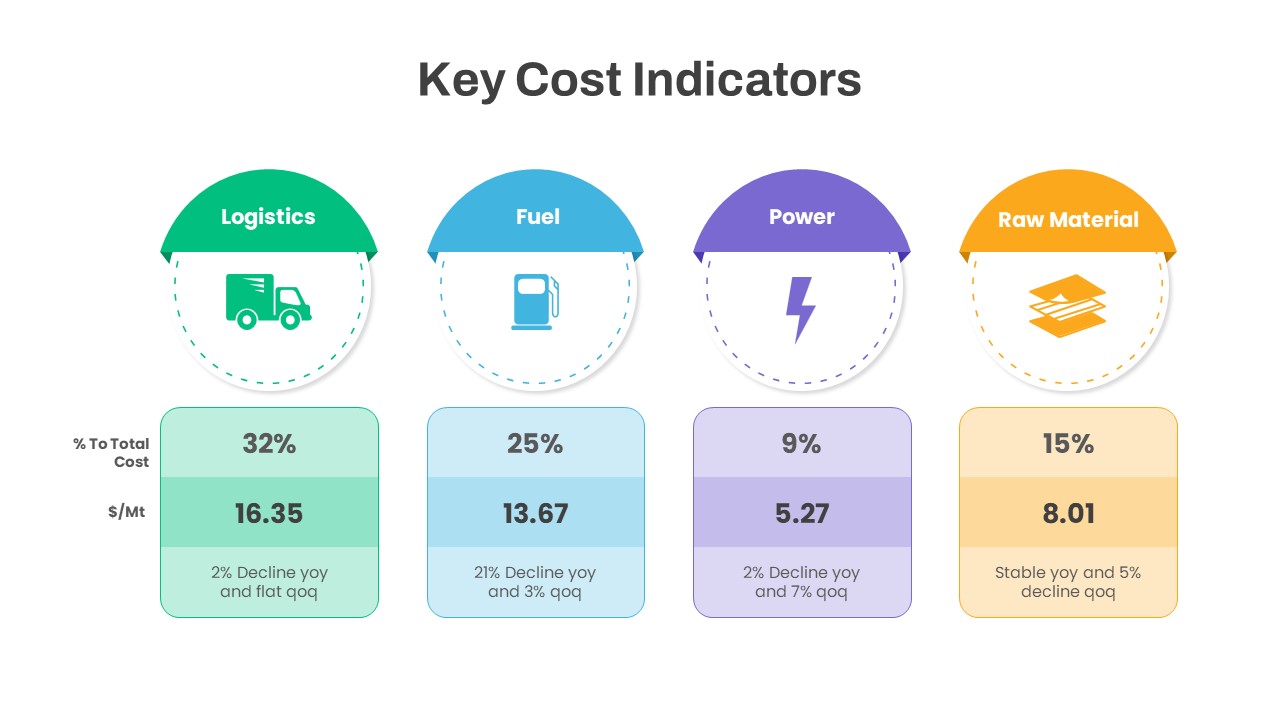
Key Cost Indicators Infographic Template for PowerPoint & Google Slides
Finance
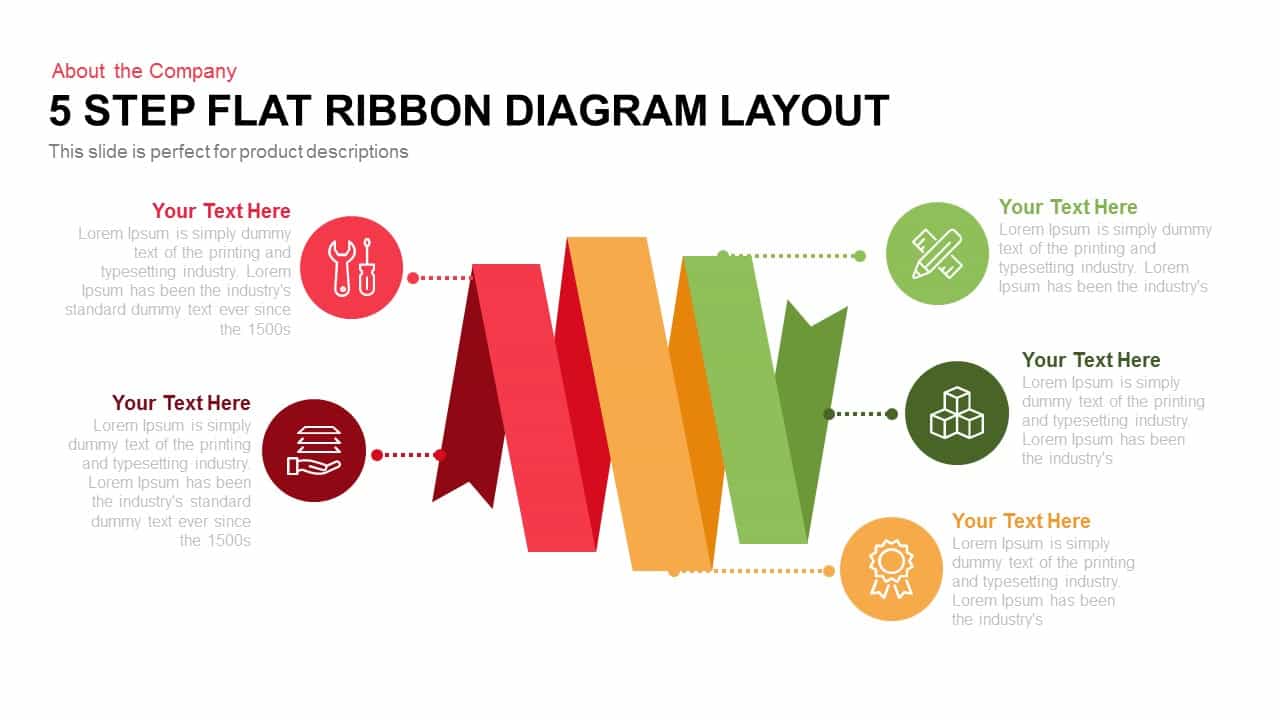
Five-Step Flat Ribbon Diagram Layout template for PowerPoint & Google Slides
Process
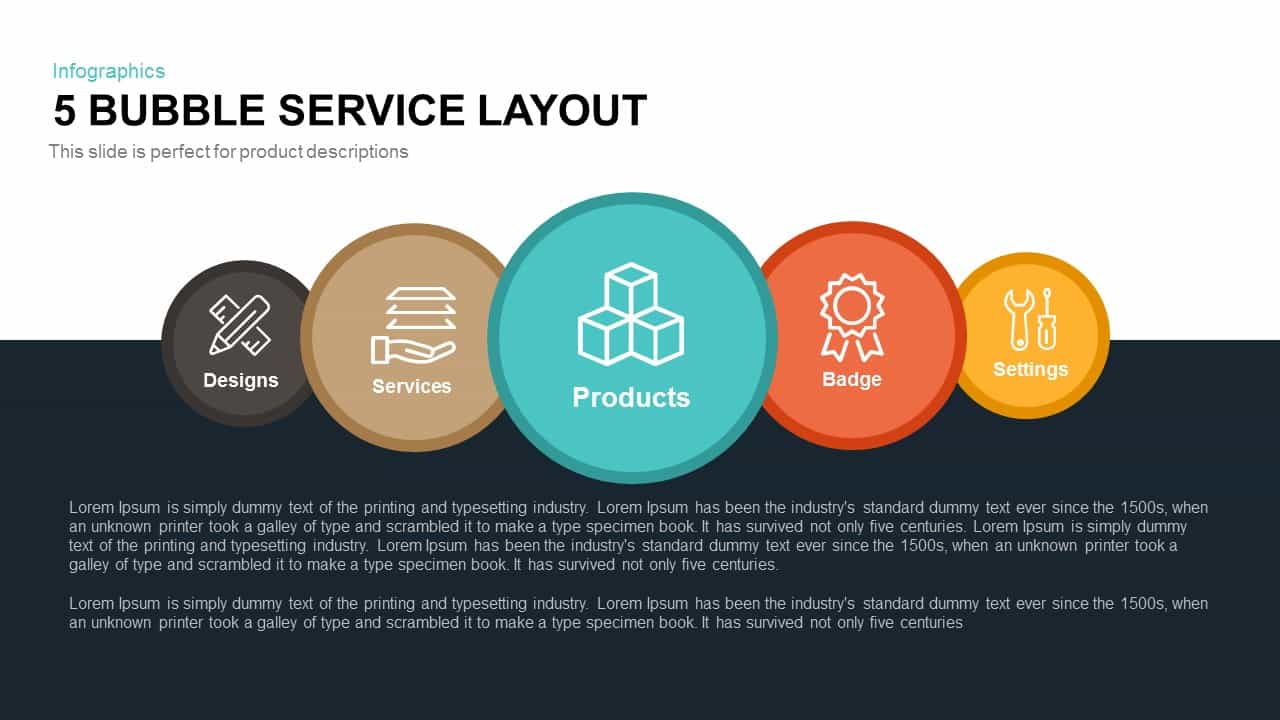
5 Bubble Service Layout Diagram Template for PowerPoint & Google Slides
Process
Multi-layout Circle Spoke Diagram Template for PowerPoint & Google Slides
Circular
Client Testimonials Feedback Layout Template for PowerPoint & Google Slides
Infographics
Canada Provinces Map Multi-Layout Template for PowerPoint & Google Slides
World Maps
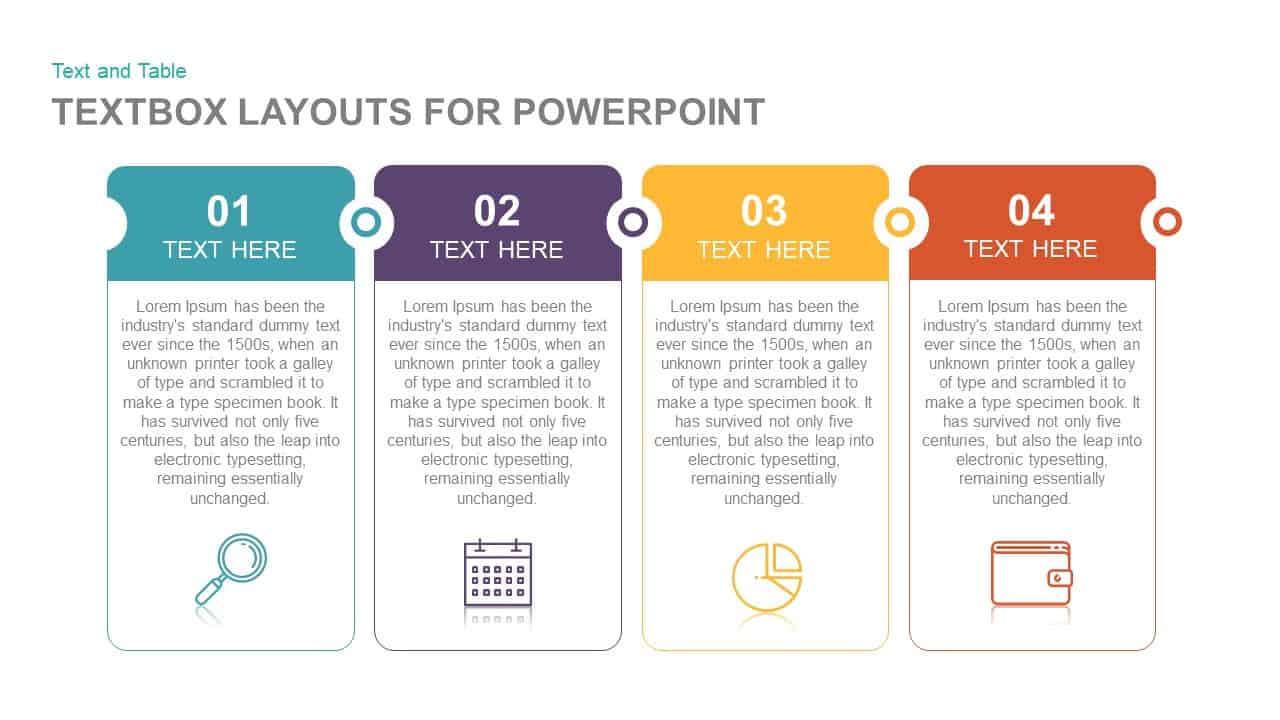
Two To Six Textbox Layout Template for PowerPoint & Google Slides
Agenda
Dynamic Five-Step Ribbon Agenda Layout Template for PowerPoint & Google Slides
Agenda

Flat Four-Box Business Layout Diagram Template for PowerPoint & Google Slides
Process
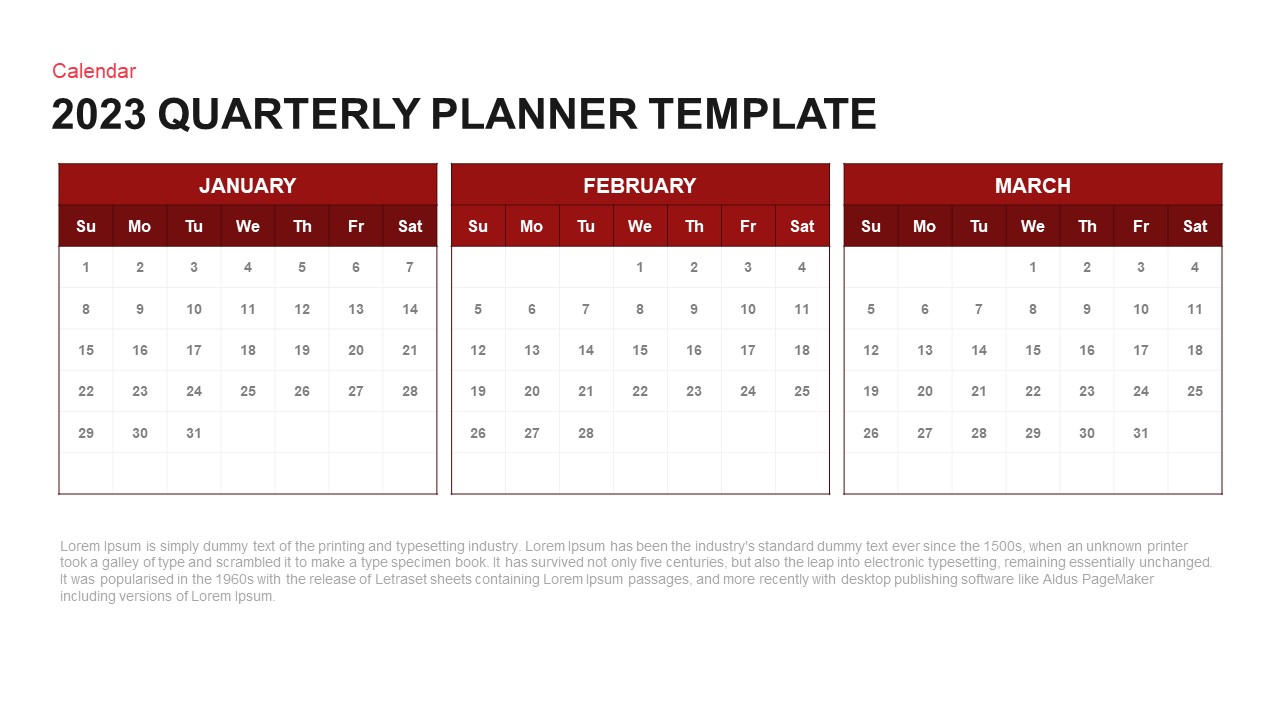
Quarterly Planner Calendar Layout Template for PowerPoint & Google Slides
Project
PESTLE Analysis Table Layout Diagram Template for PowerPoint & Google Slides
PEST
Four-Step Textbox Layout Diagram Template for PowerPoint & Google Slides
Business Report
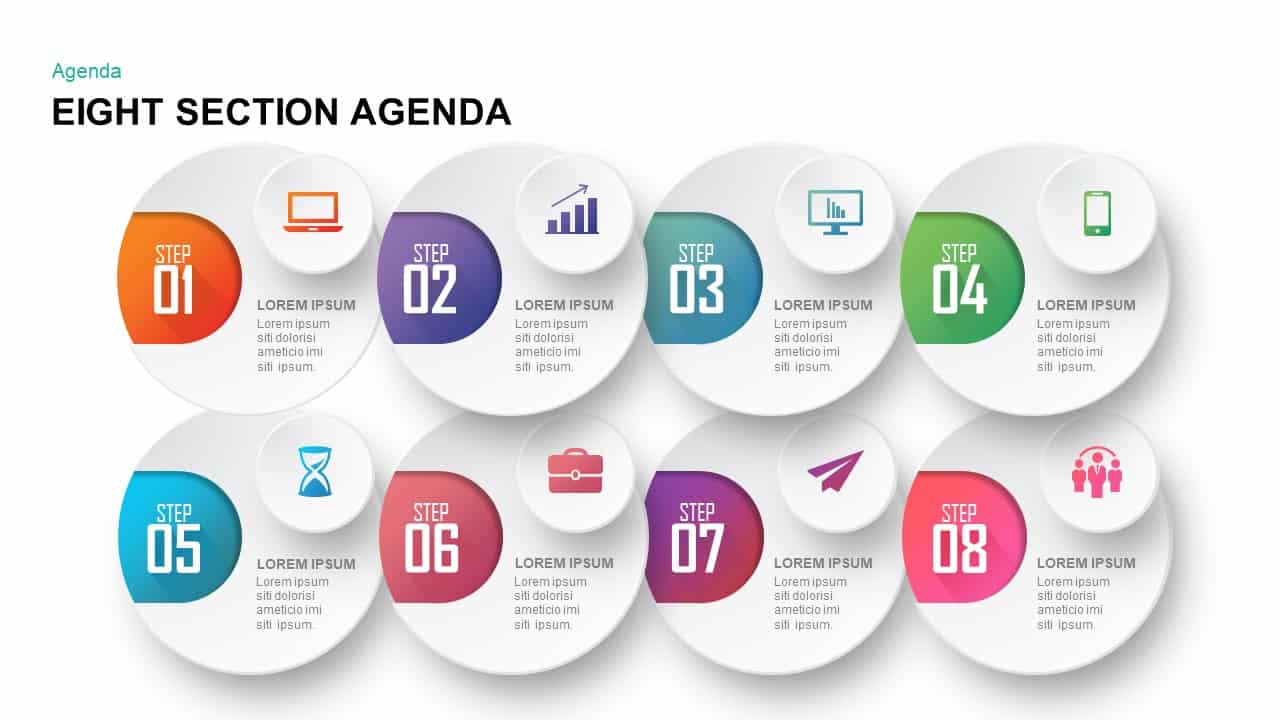
Eight Section Agenda Slide Layout Template for PowerPoint & Google Slides
Agenda
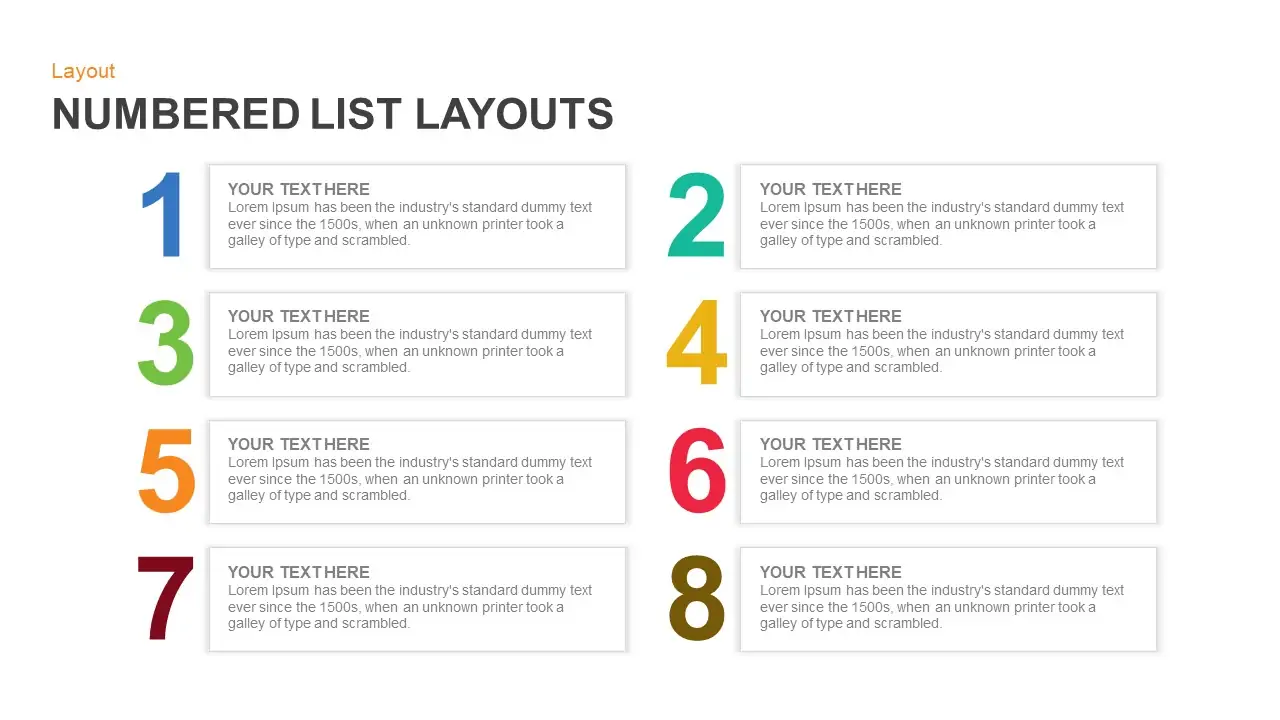
Numbered List Layout Slide Template for PowerPoint & Google Slides
Agenda
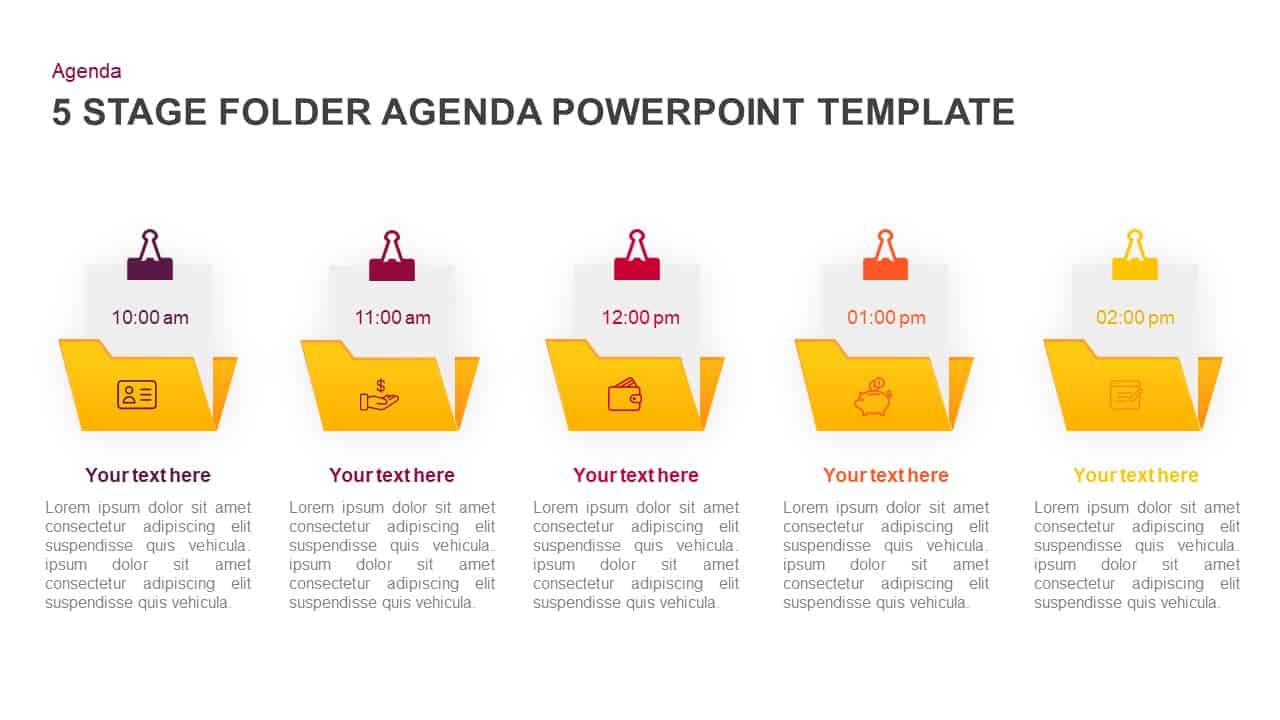
Modern 5-Stage Folder Agenda Layout Template for PowerPoint & Google Slides
Agenda
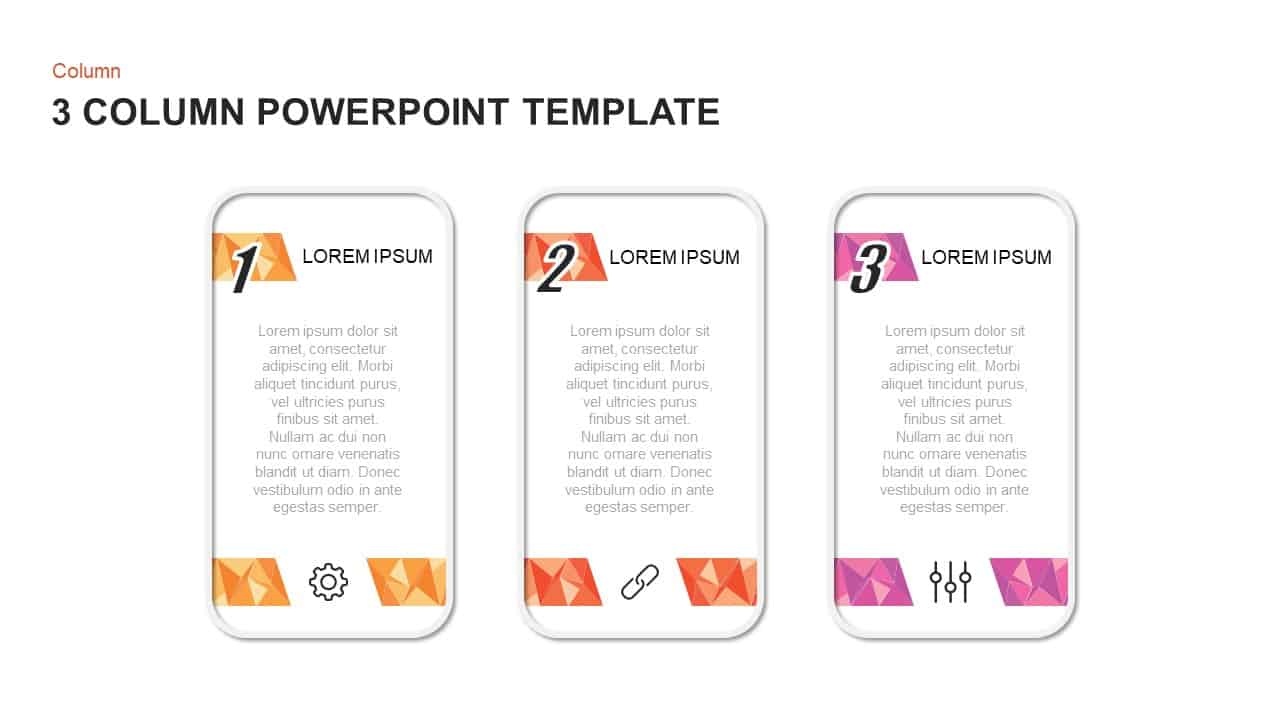
Three and Four-Column Card Layout Template for PowerPoint & Google Slides
Infographics
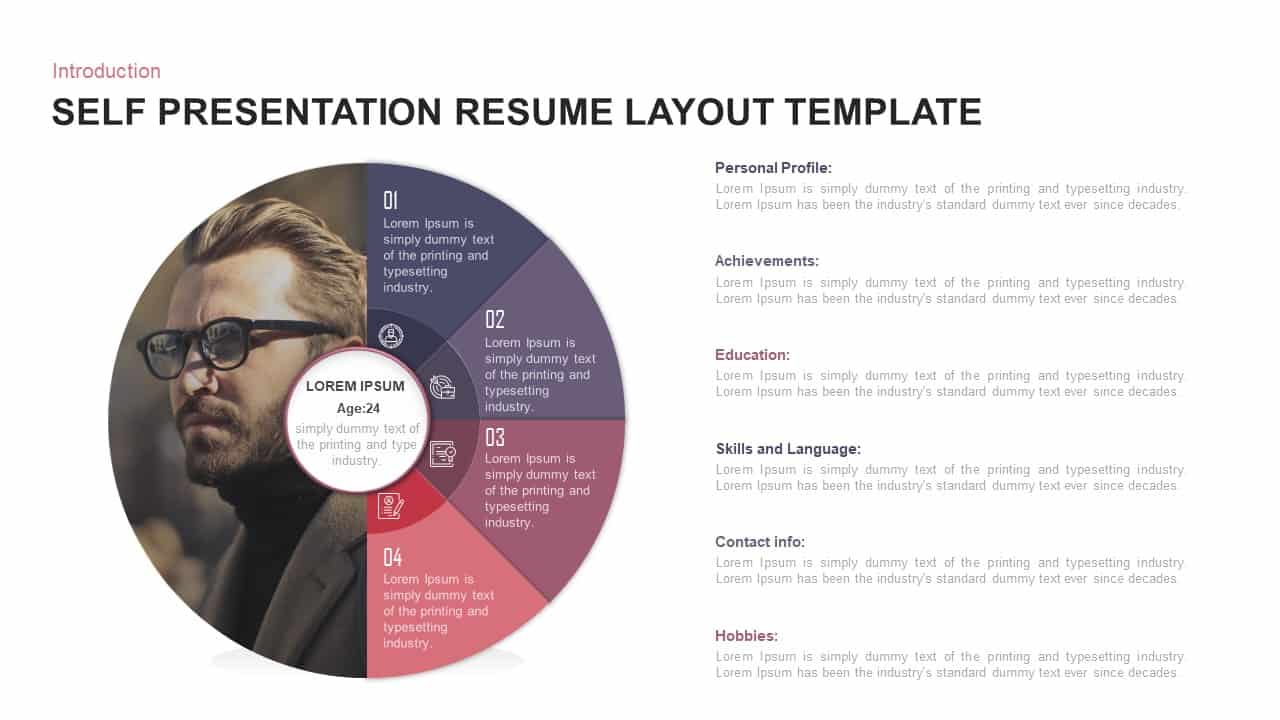
Self Presentation Resume Layout Template for PowerPoint & Google Slides
Recruitment
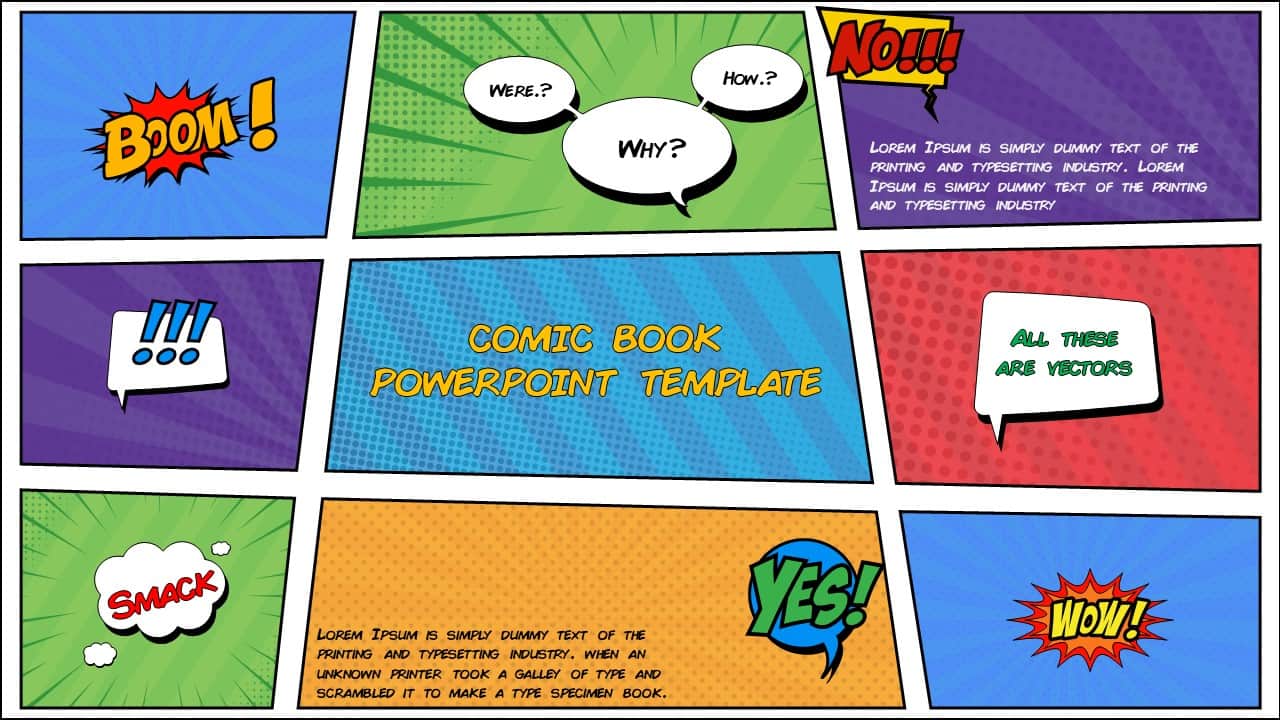
Free Comic Book Panel Layout Template for PowerPoint & Google Slides
Free
Free
Yearly Calendar Layout Template for PowerPoint & Google Slides
Graphics
Free
Modern Four-Step Agenda Slide Layout Template for PowerPoint & Google Slides
Agenda
Four-Step Business Agenda Slide Layout Template for PowerPoint & Google Slides
Agenda
3D Five-Step Roadmap Diagram Slide Layout Template for PowerPoint & Google Slides
Roadmap
Colorful Vertical SWOT Analysis Layout Template for PowerPoint & Google Slides
SWOT
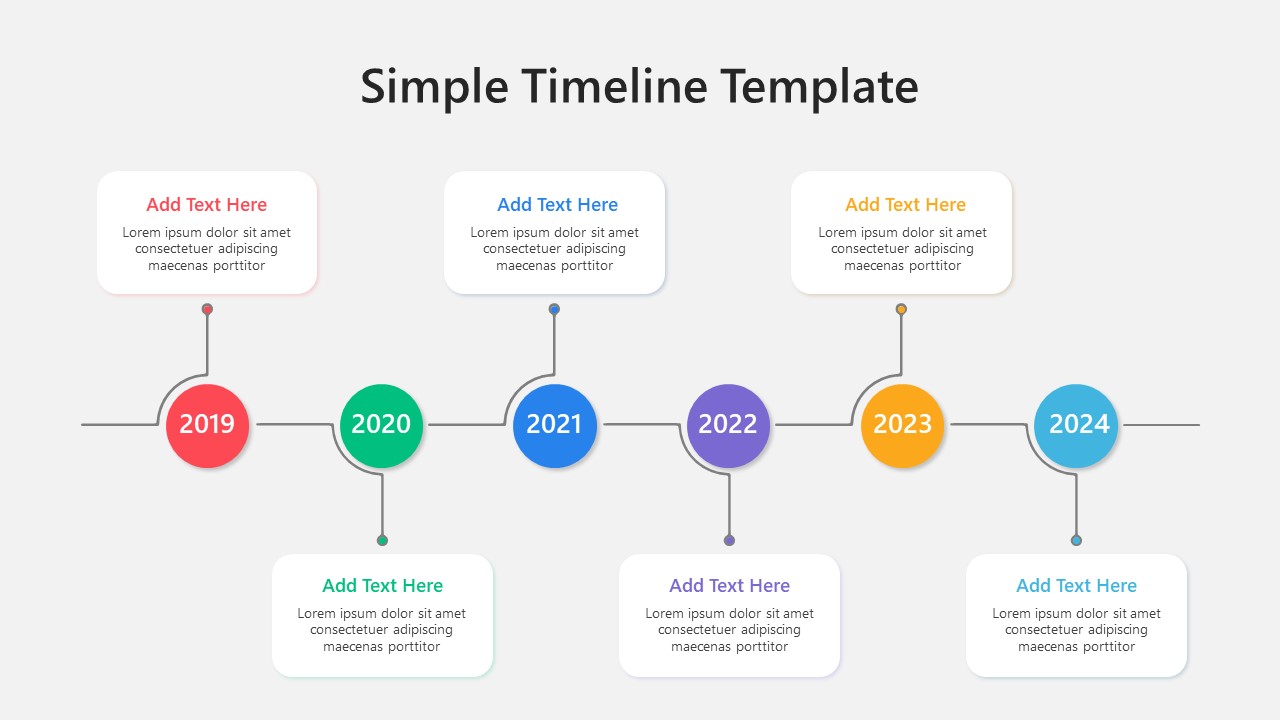
Colorful Four-Year Timeline Layout Template for PowerPoint & Google Slides
Timeline
Staggered Five-Hexagon Agenda Layout Template for PowerPoint & Google Slides
Agenda
Colorful Five-Year Timeline Layout Template for PowerPoint & Google Slides
Timeline
Layered Circular Four-Step Agenda Slide Layout Template for PowerPoint & Google Slides
Agenda
Four-Layout Day-to-Day Operations Template for PowerPoint & Google Slides
Process
Project Scope Hub & Spoke Layout Template for PowerPoint & Google Slides
Process
Photo Collage Slide Layout Template for PowerPoint & Google Slides
Business
Photo Gallery Team Introduction Layout Template for PowerPoint & Google Slides
Graphics
Six-Day Weekly Planner Layout Template for PowerPoint & Google Slides
Infographics
Dark Photo Collage Gallery Layout Template for PowerPoint & Google Slides
Graphics
Green Photo Collage Masonry Layout Template for PowerPoint & Google Slides
Graphics
Elegant Stacked Photo Collage Layout Template for PowerPoint & Google Slides
Graphics
Modern Cosmetics Photo Collage Layout Template for PowerPoint & Google Slides
Graphics
Circular Organizational Structure Layout Template for PowerPoint & Google Slides
Org Chart
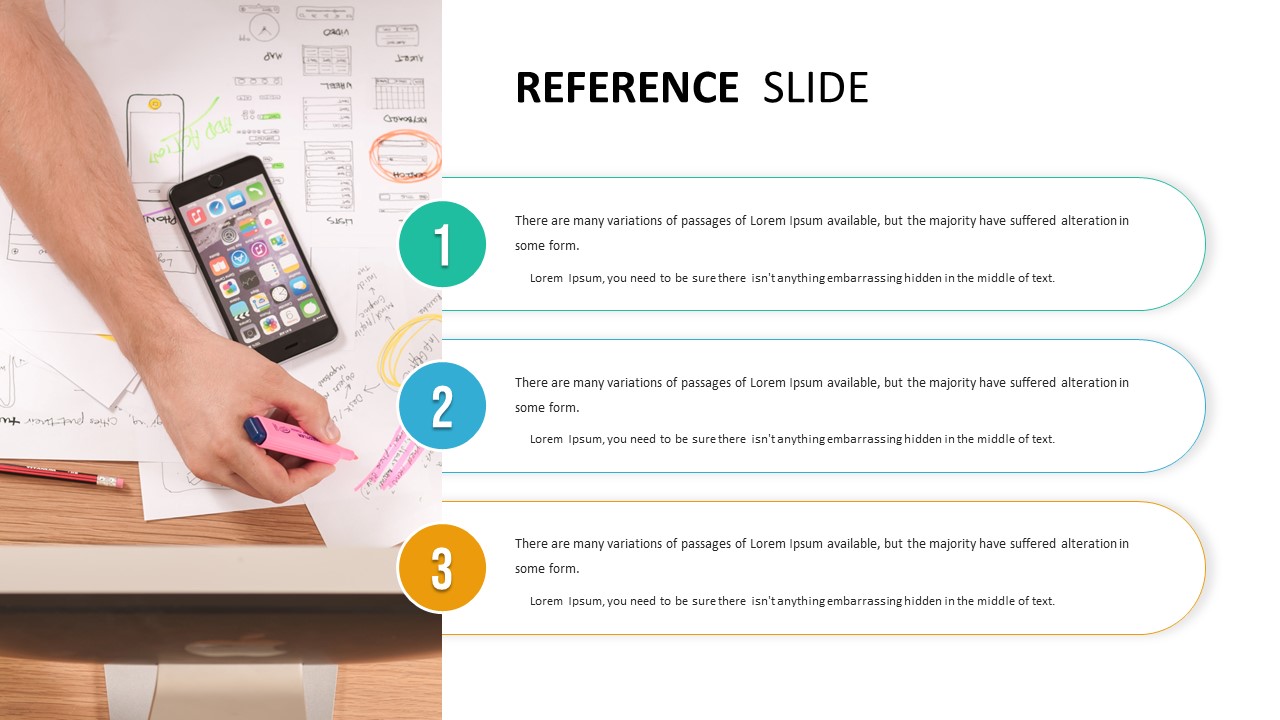
Three-Step Reference Slide Layout Template for PowerPoint & Google Slides
Infographics
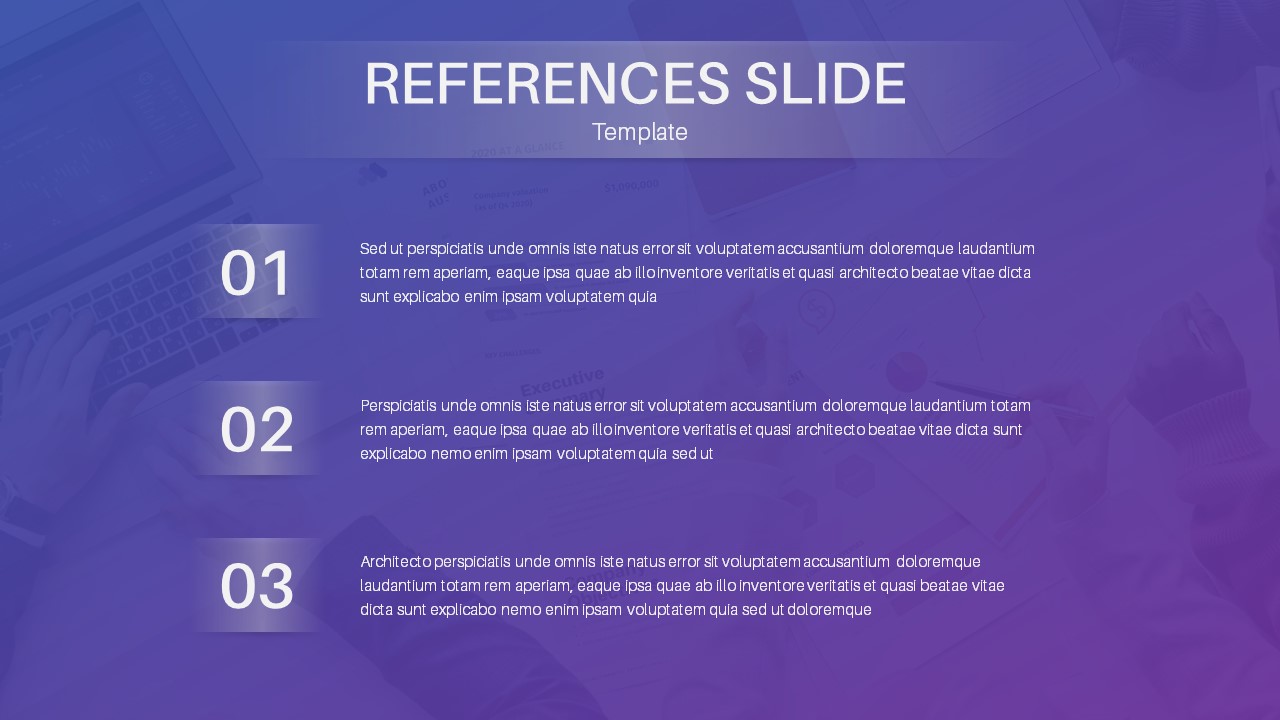
Professional References Slide Layout Template for PowerPoint & Google Slides
Infographics
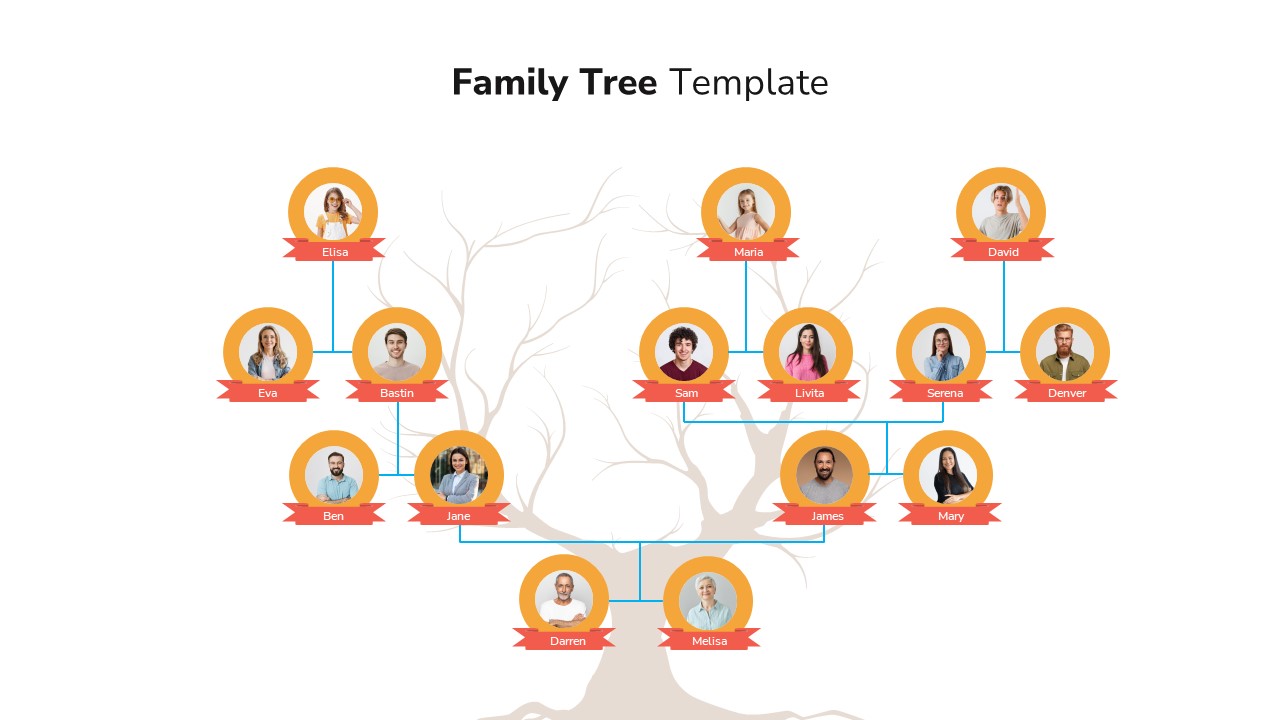
Classic Family Tree Diagram Layout Template for PowerPoint & Google Slides
Infographics
Professional Quad Chart Layout Template for PowerPoint & Google Slides
Pie/Donut
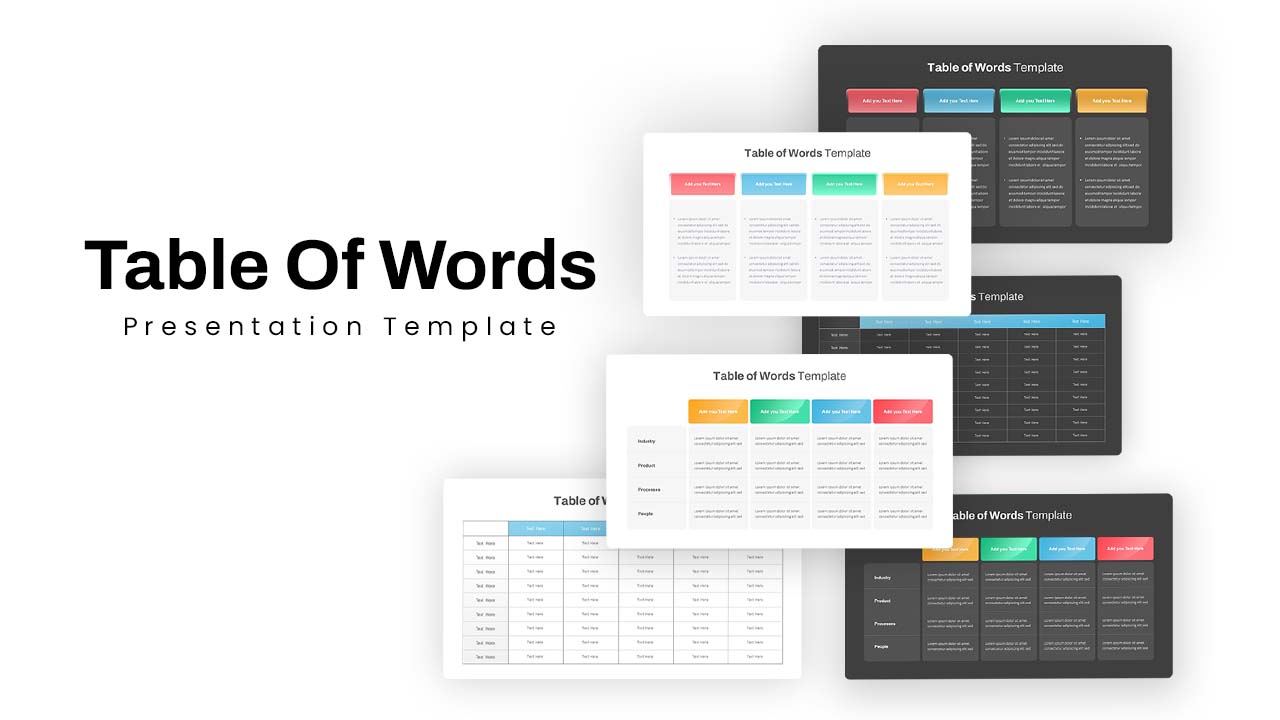
Versatile Table of Words Layout Template for PowerPoint & Google Slides
Table
Multi-Color Milestone Timeline Layout Template for PowerPoint & Google Slides
Timeline
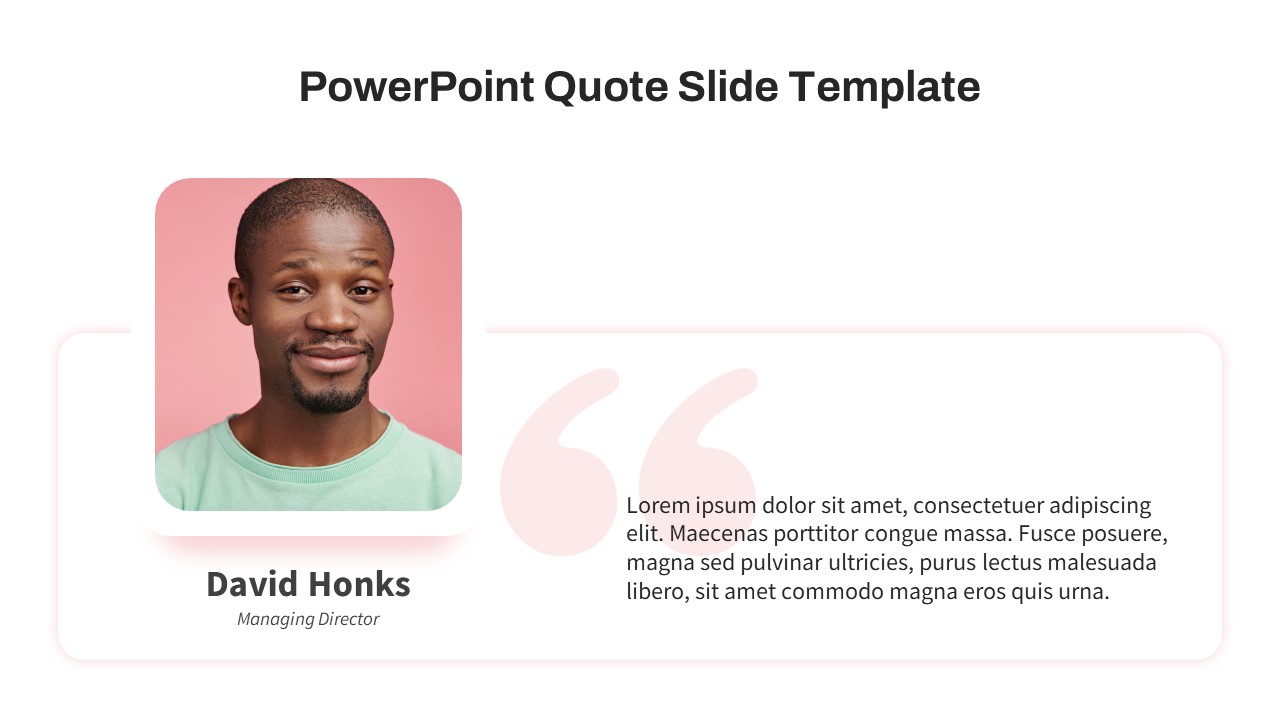
Free Elegant Executive Quote Slide Layout Template for PowerPoint & Google Slides
Our Team
Free
Free Balanced Scorecard Quadrant KPI Layout Template for PowerPoint & Google Slides
Employee Performance
Free
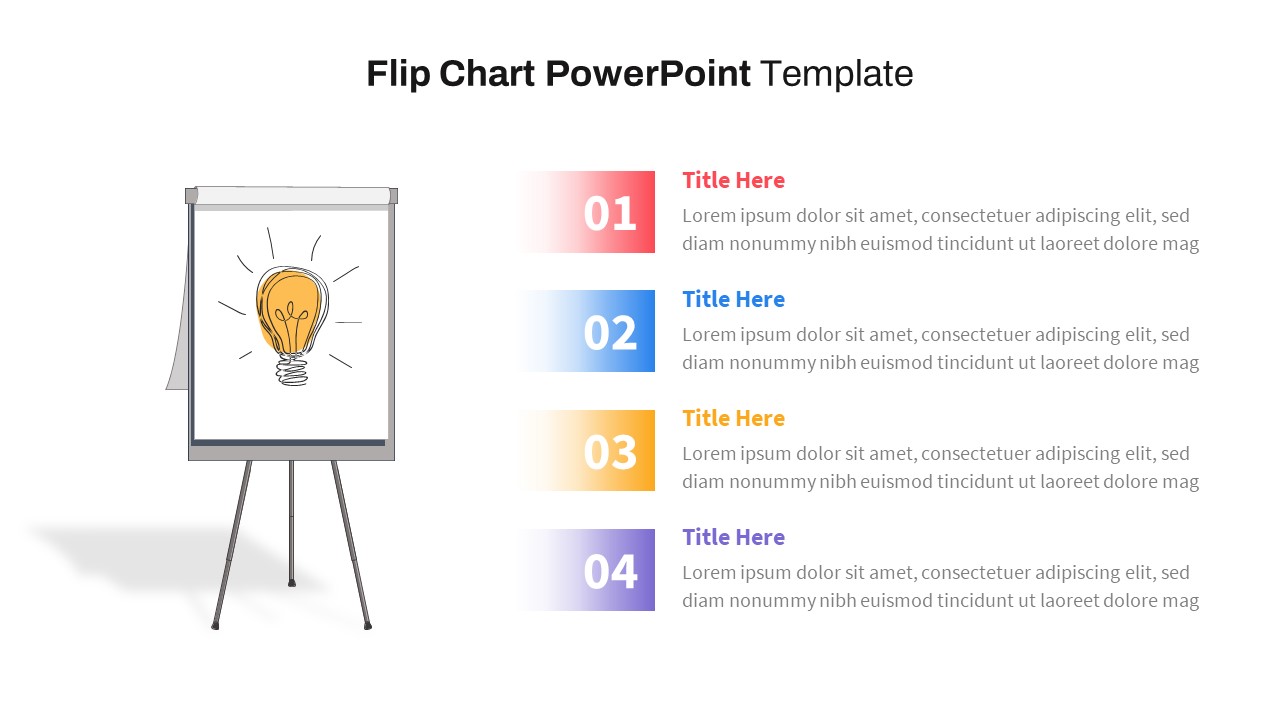
Flip Chart Four-Step List Layout Template for PowerPoint & Google Slides
Process
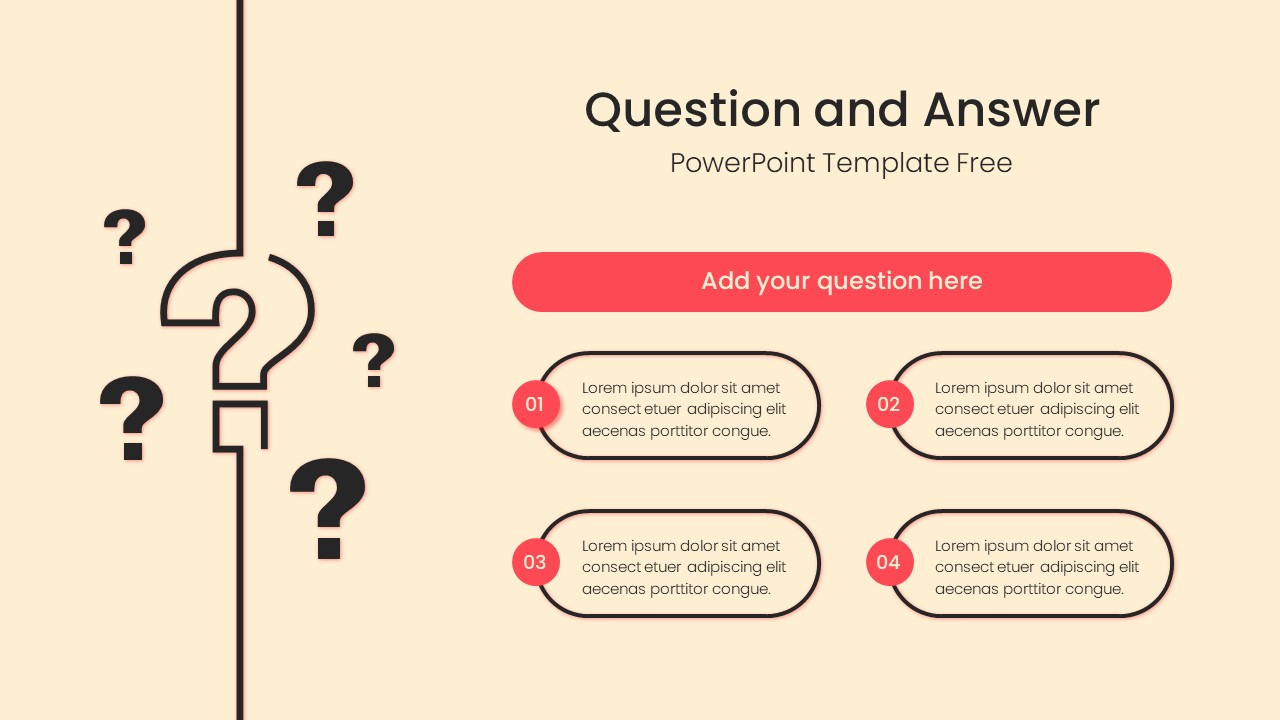
Free Q&A Layout with Four Answer Pods Template for PowerPoint & Google Slides
Free
Free

Medical Hexagon Layout Presentation Template for PowerPoint & Google Slides
Health
Today’s Panelists Profile Layout Template for PowerPoint & Google Slides
Our Team
Discussion Points Layout Template for PowerPoint & Google Slides
Agenda
Our Principles Slide with Icons Layout Template for PowerPoint & Google Slides
Vision and Mission
Free Choice Board Six-Option Layout Template for PowerPoint & Google Slides
Comparison
Free
Training Plan Table Layout Template for PowerPoint & Google Slides
Employee Performance
Our Team Profile Layout Template for PowerPoint & Google Slides
Our Team
Colorful Four-Column Table Layout Template for PowerPoint & Google Slides
Table
Five Column Comparison Table Layout Template for PowerPoint & Google Slides
Comparison
Team & Expertise Profile Layout Template for PowerPoint & Google Slides
Our Team
Progress Bar Graph Layout Design for PowerPoint & Google Slides
Charts
Free Stylized Book Review Layout for PowerPoint & Google Slides
Company Profile
Free
Free Internship Program Hexagon Layout for PowerPoint & Google Slides
Recruitment
Free