By the Numbers Slide template for PowerPoint & Google Slides


Description:
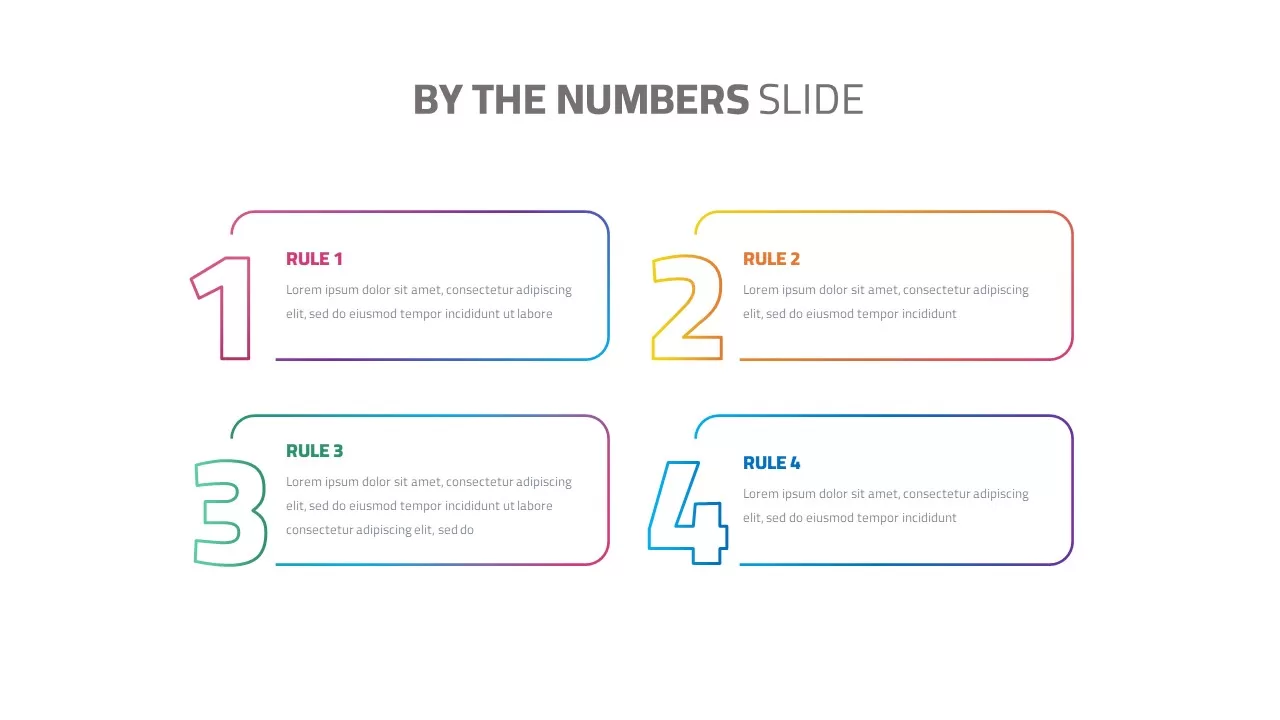
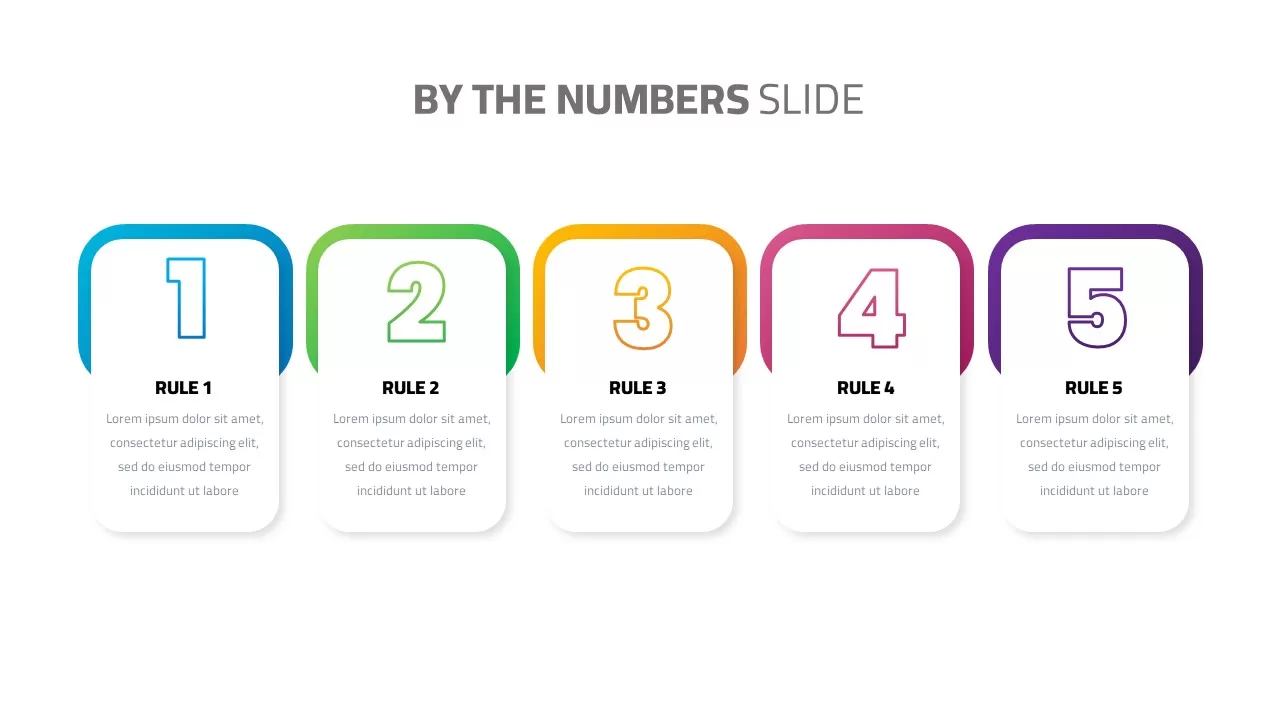
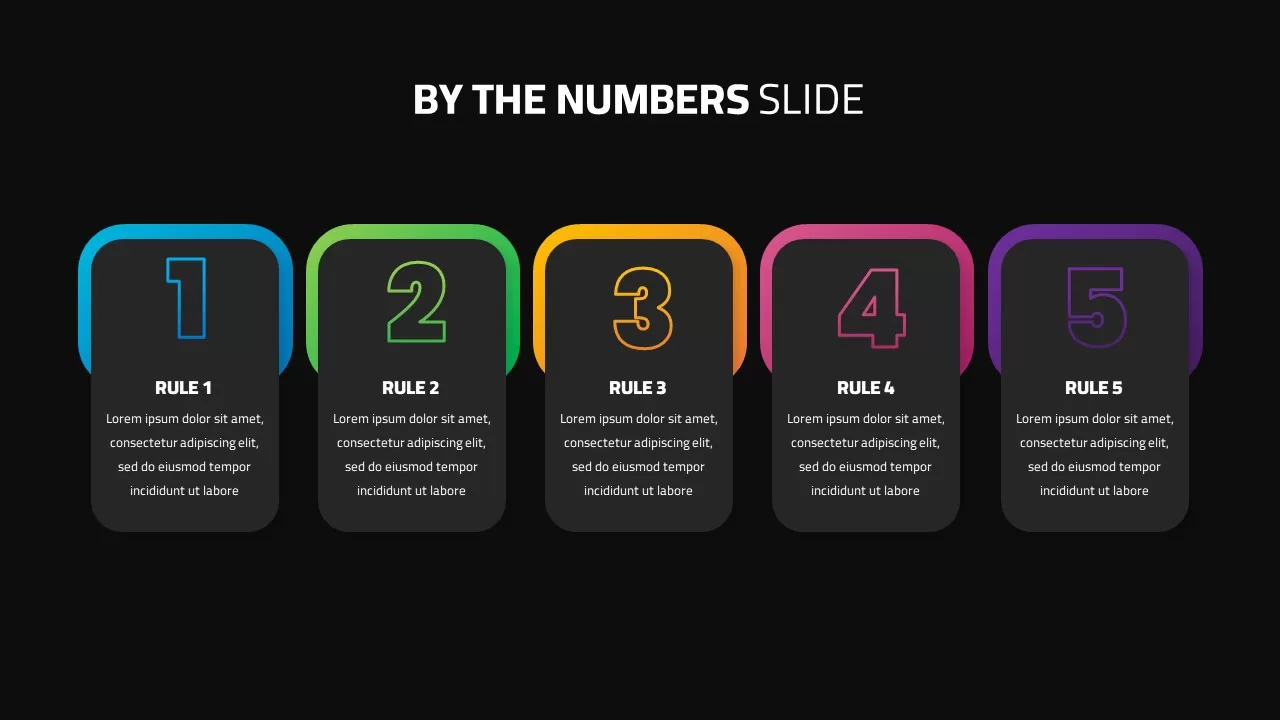
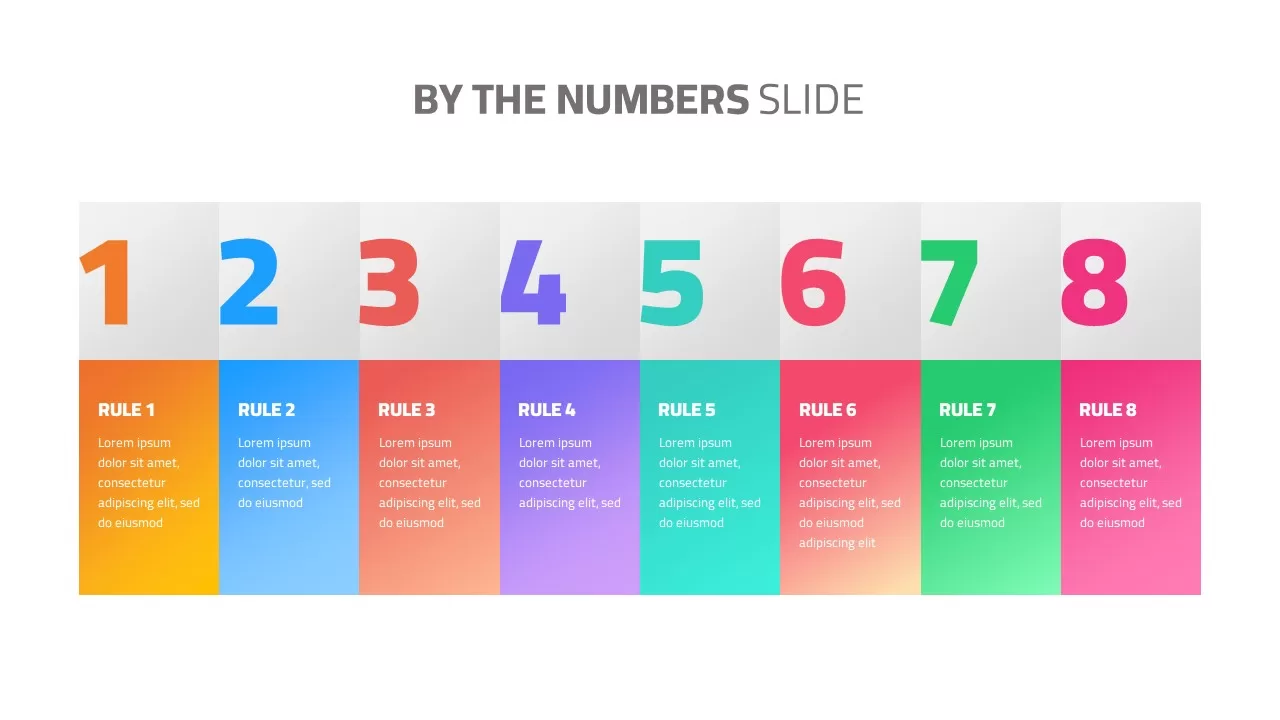
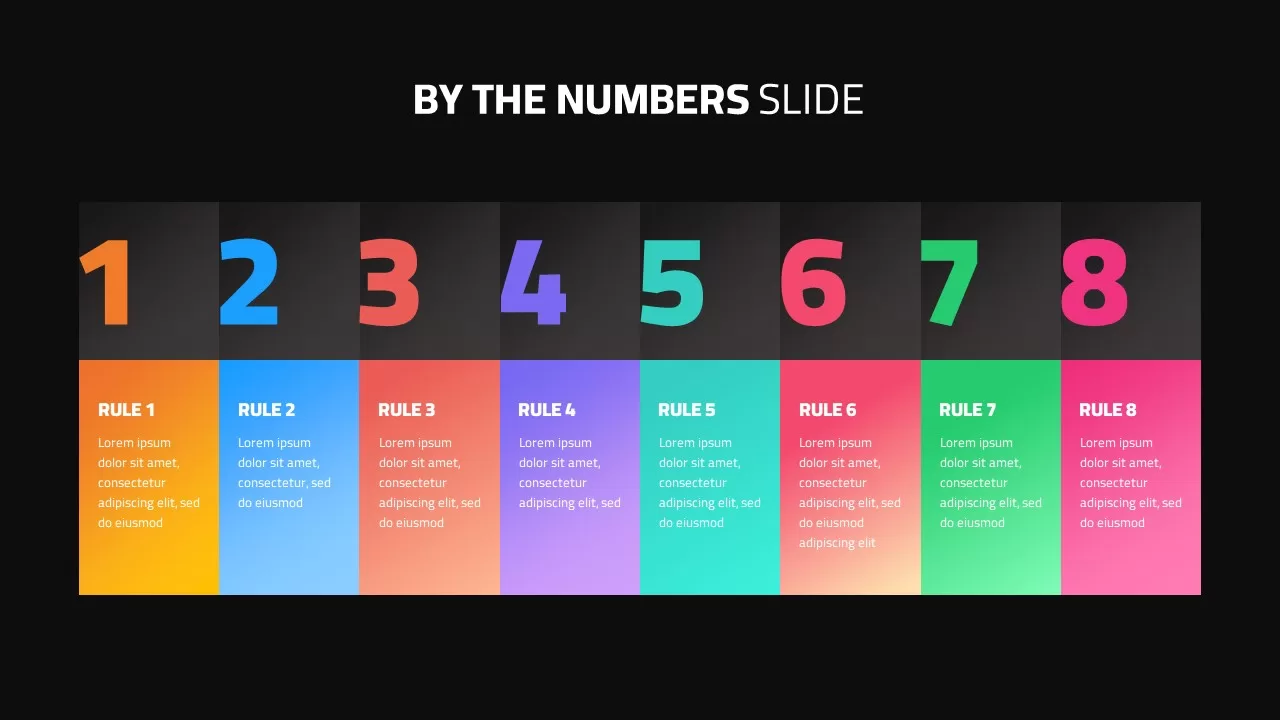
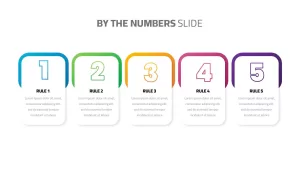
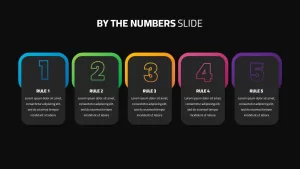
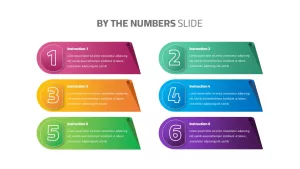
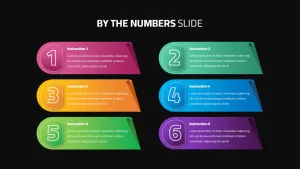
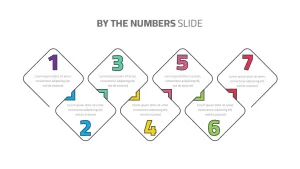
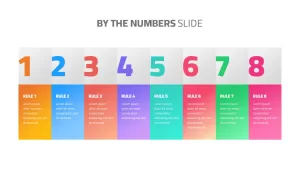
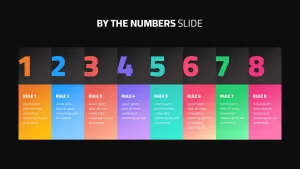
The “By the Numbers” Slide template offers a versatile and visually appealing way to present information in a clear, sequential format. This dynamic template is designed to showcase data, instructions, or rules in numbered blocks, ideal for step-by-step guides, process overviews, or strategic presentations. Each number is highlighted within a colorful block, which can be customized to fit your brand’s style, making it easy for your audience to follow along and stay engaged.
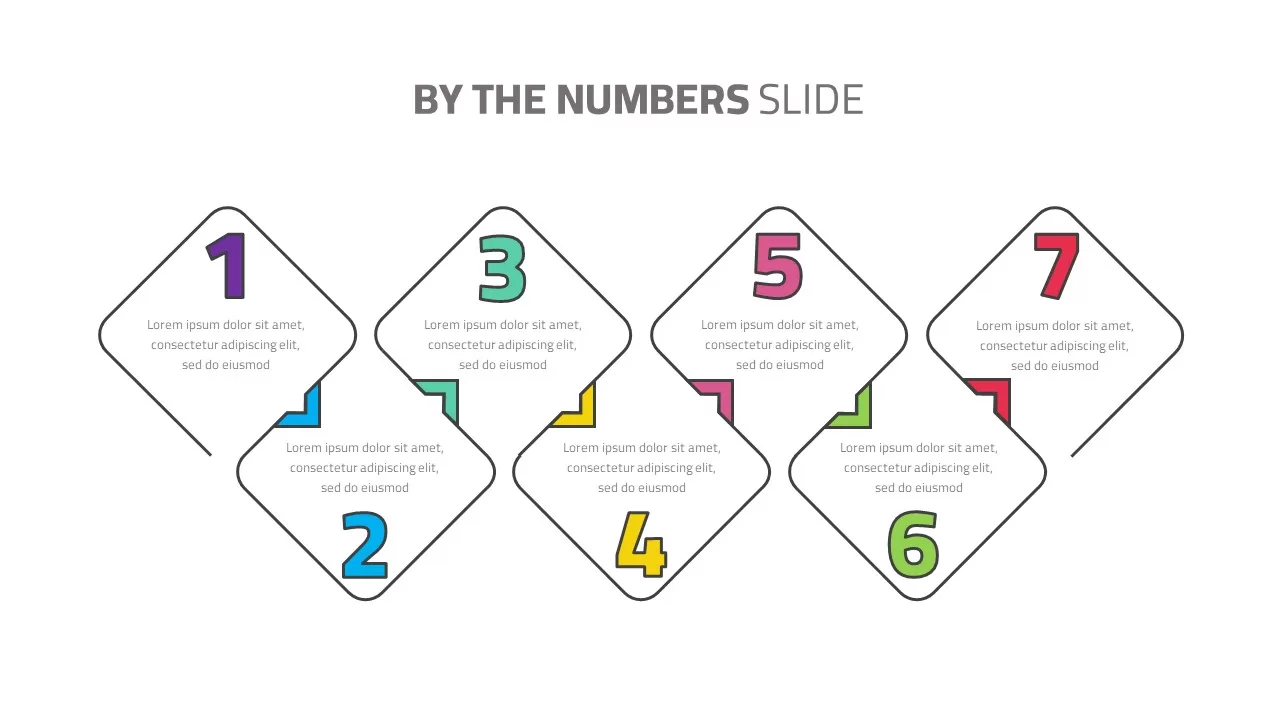
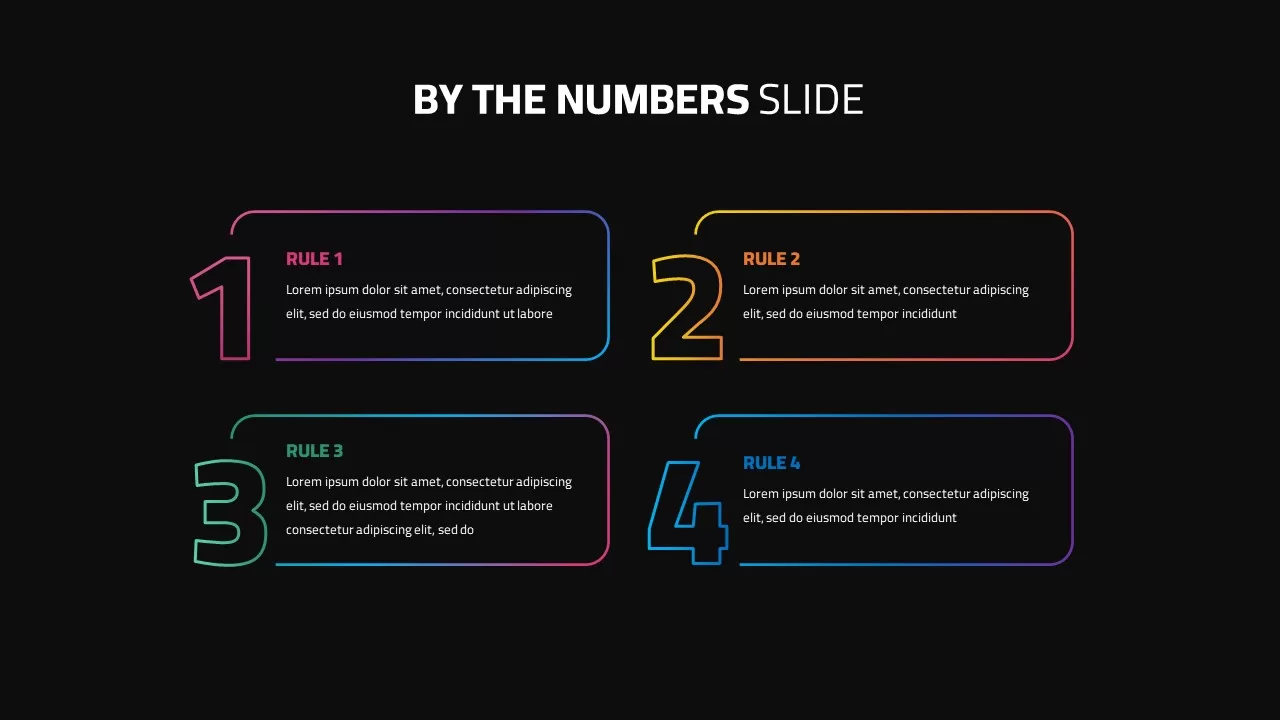
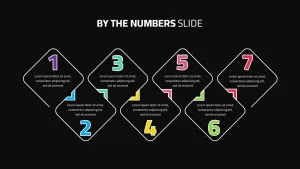
Perfect for organizing any kind of sequential information, the template includes layouts where numbers are presented with varying visual styles—rounded corners, angular blocks, or even creative shapes such as diamonds or arrows—each offering a unique aesthetic to complement your message. With a modern design, a range of color options, and adjustable text areas, this slide can be customized to emphasize important rules, instructions, or stages in a process.
Additionally, this template is fully compatible with both PowerPoint and Google Slides, ensuring seamless presentation experience across different devices. Whether used for business proposals, project timelines, or educational content, it’s designed for flexibility and ease of use, making your presentations both effective and visually striking.
Who is it for
This slide is ideal for project managers, educators, consultants, and business leaders who need to clearly communicate step-by-step processes, rules, or guidelines. It’s also perfect for marketers and sales teams who want to present key selling points, product features, or campaign steps in an easily digestible format.
Other Uses
The “By the Numbers” Slide can be used for process walkthroughs, tutorials, onboarding sequences, product descriptions, and even customer journey mapping. It can also be repurposed for financial summaries, project milestones, and strategy outlines, making it a flexible tool for diverse professional fields.
Login to download this file

Item ID
SB02341
Related Templates

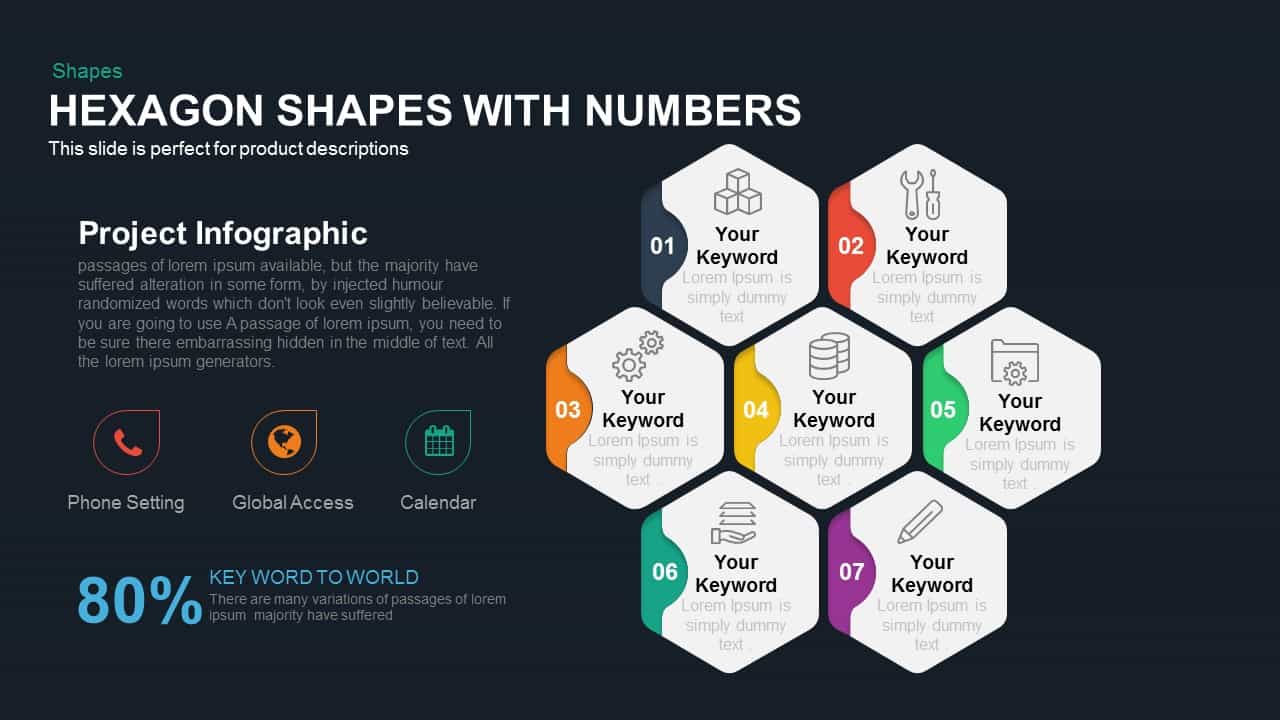
Hexagon Shape Template with Numbers PowerPoint
Process
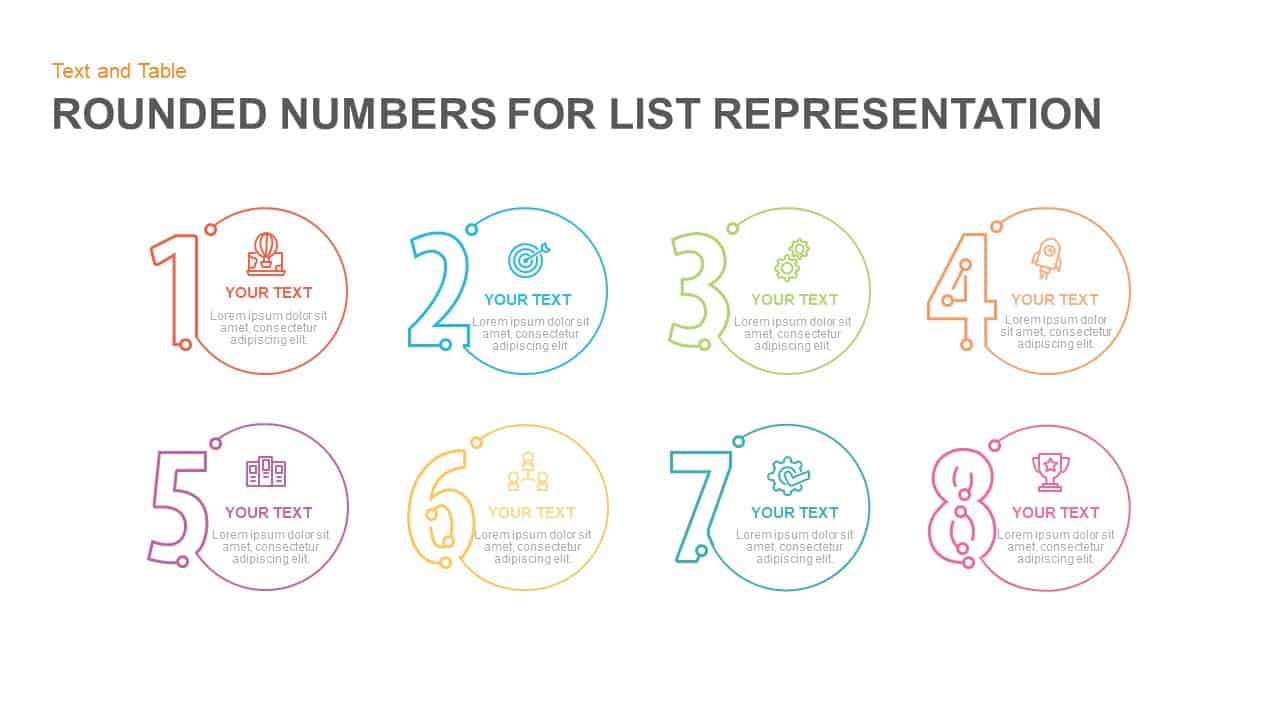
Rounded Numbers List Infographic Template for PowerPoint & Google Slides
Comparison
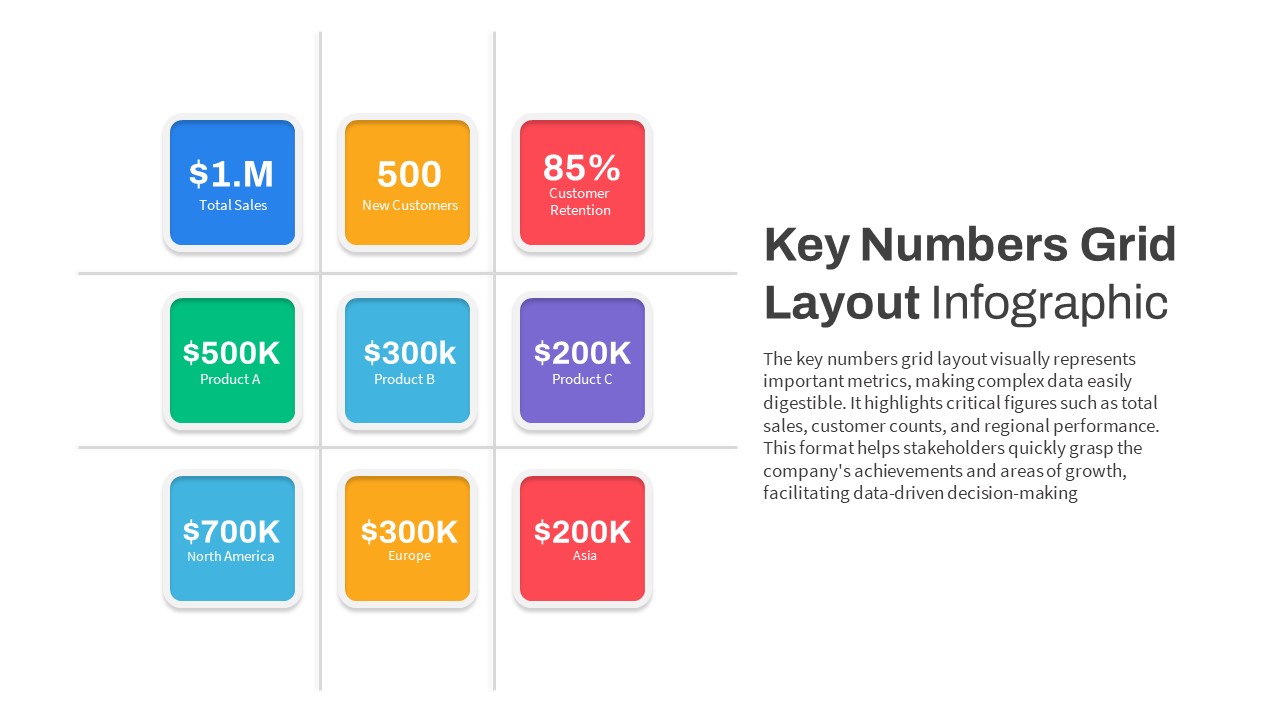
Key Numbers Grid Layout Infographic Template for PowerPoint & Google Slides
Business Report
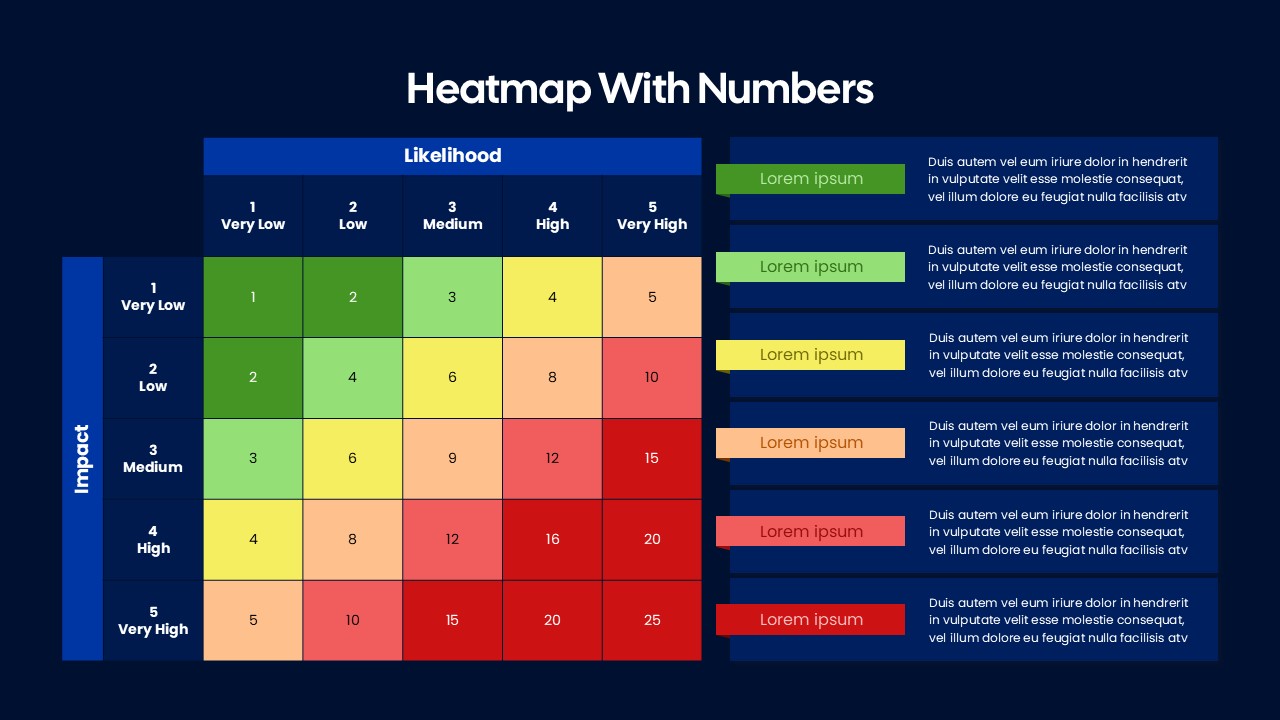
Heatmap Matrix with Numbers Template for PowerPoint & Google Slides
Project