GDP Growth Template
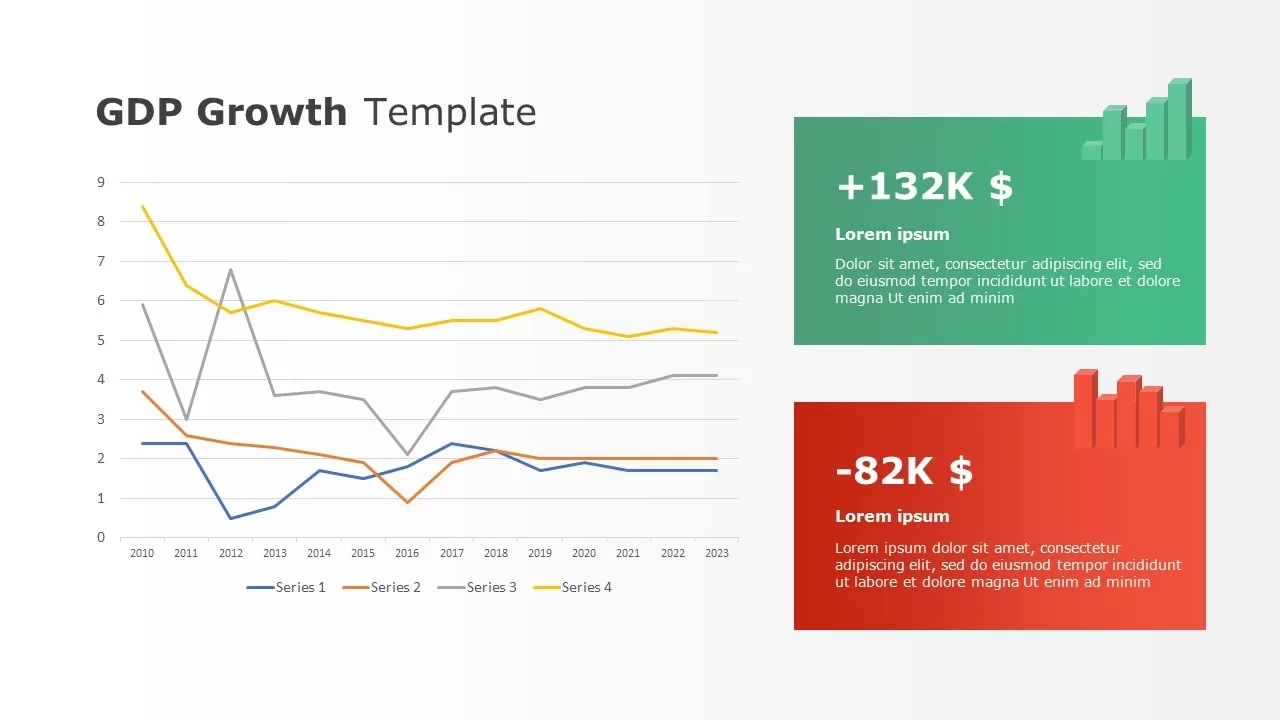
GDP growth is an index scale of a country’s economic health. GDP stands for Gross Domestic Product means the total monetary value of all finished products and services within a specific period. Normally, GDP growth is measured year to year or quarter to quarter. Nevertheless, it will give a comprehensive scorecard of a nation and how it performs in economic matters. The four-slide presentation PowerPoint GDP growth template is an education ppt template that helps teachers and even business professionals depict the powerful techniques of GDP measurement.
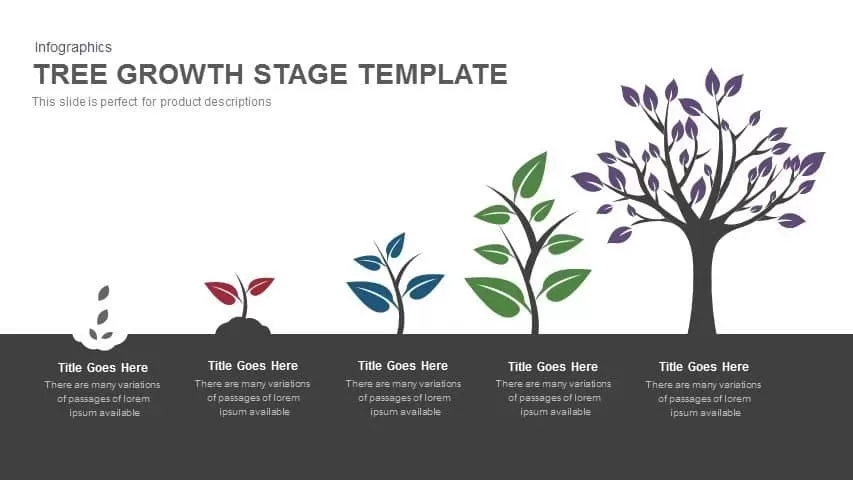
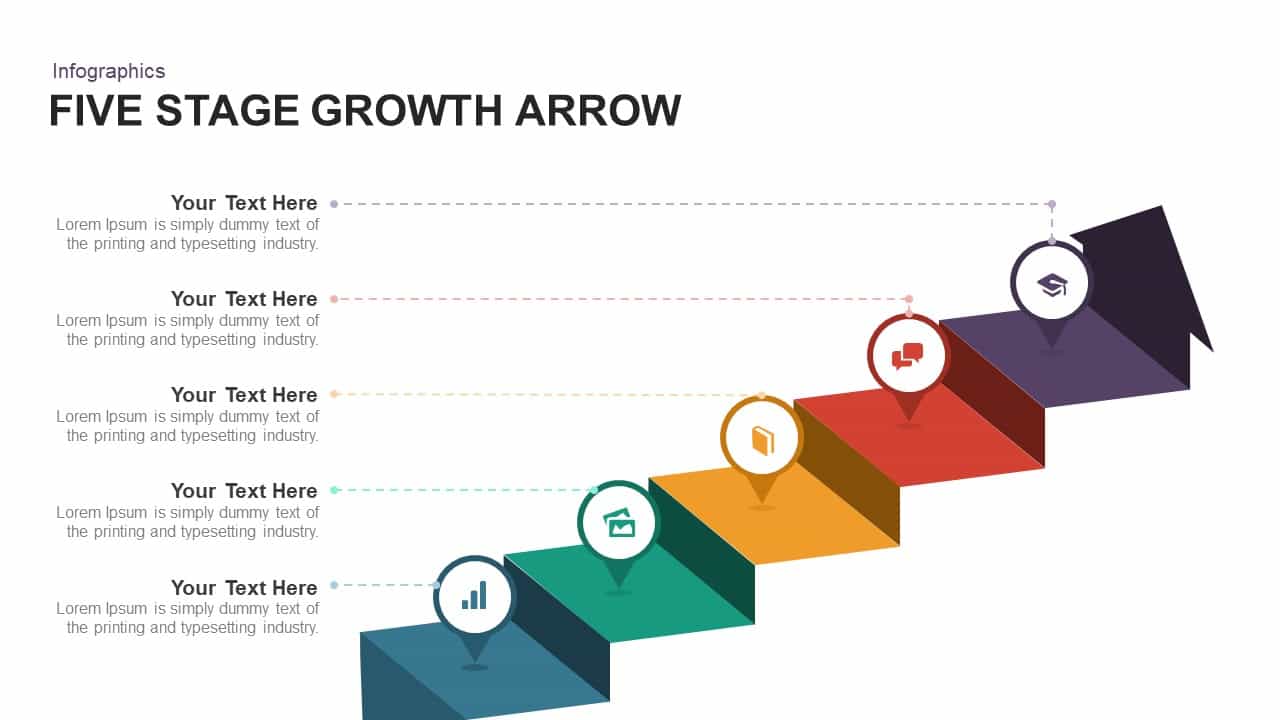
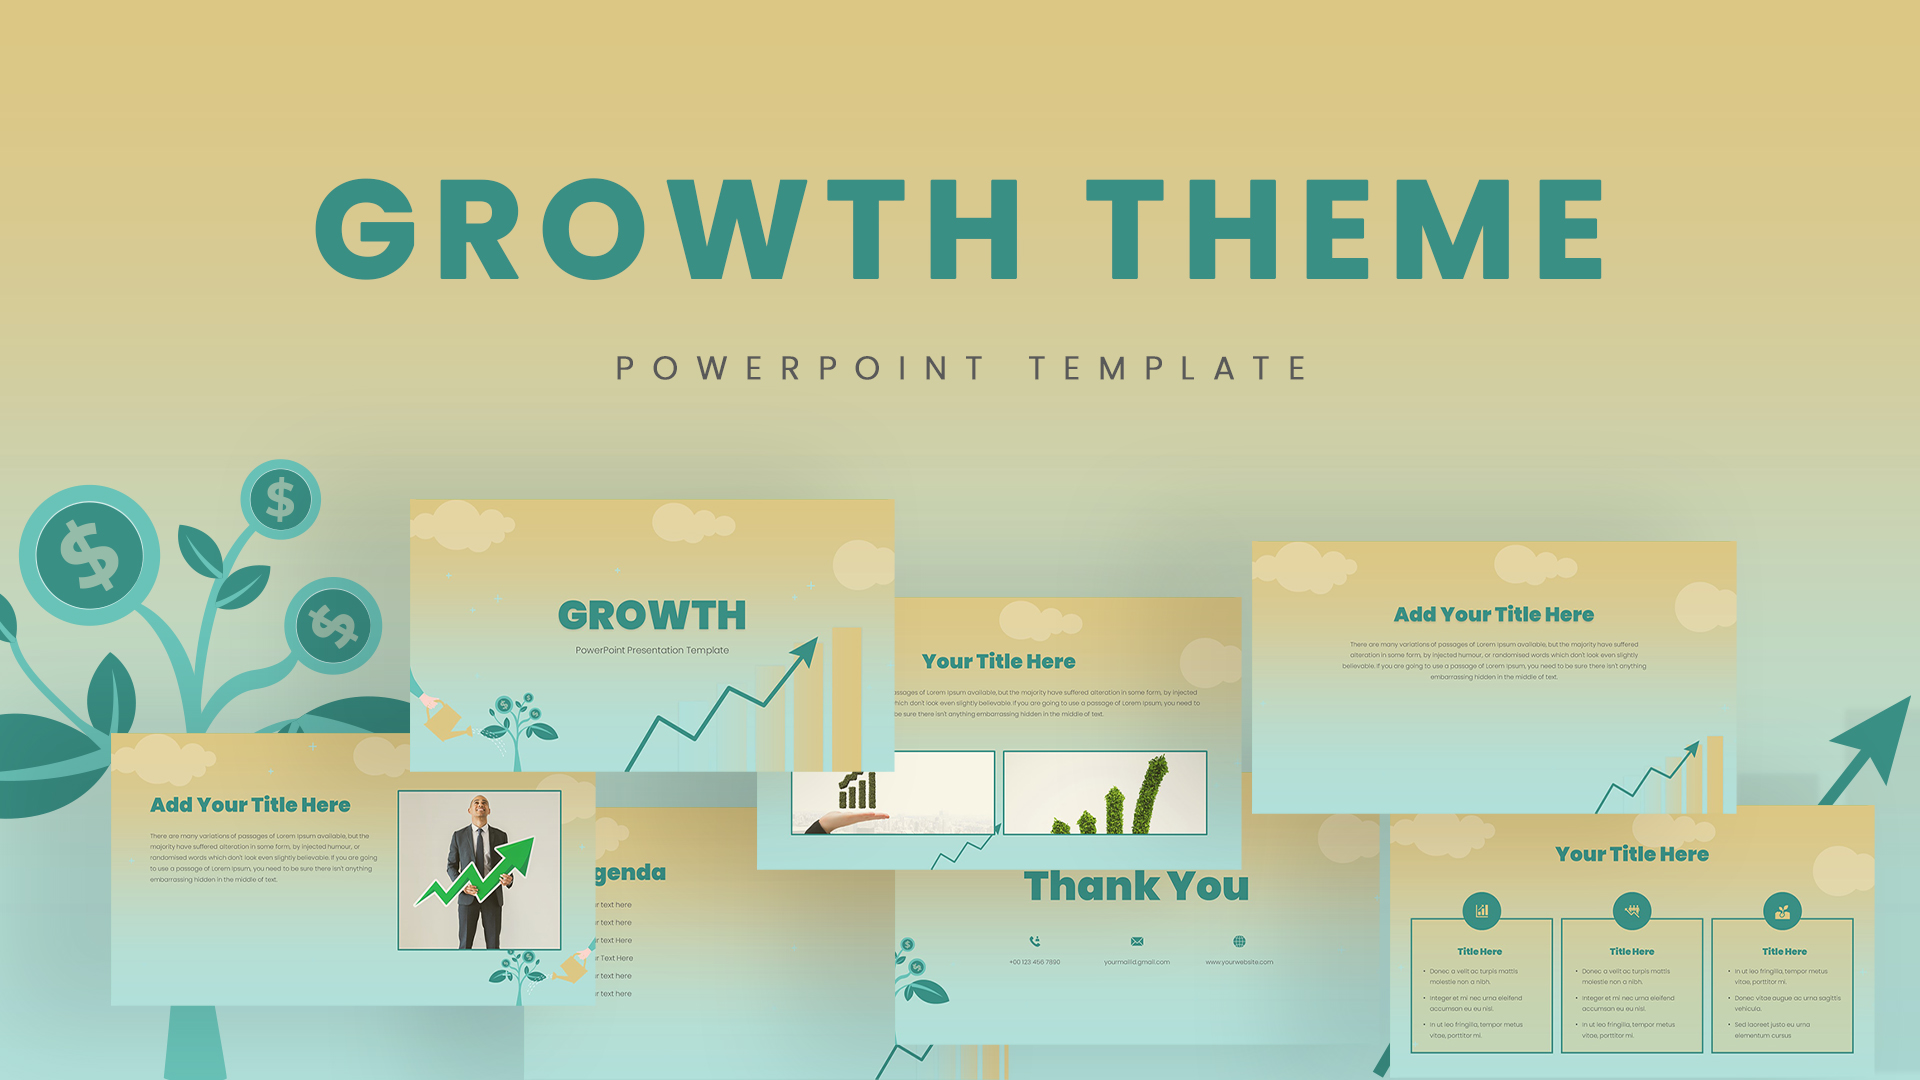
The Growth infographic has four slides in 2 variant Powerpoint designs. The master slide is created with a GDP growth metaphor that symbolically showcases the concept of GDP and growth. Presenters need these kinds of growth slides to show growth statistics through an animated analogy. The master slides are depicted as coins, a growth arrow design, and a cartoon of an executive on the board. This is a typical GDP growth infographic. You can see a line graph PowerPoint template to the very next. It also perfectly shows how GDP moves. All the features are open to customization, so you can make multiple presentations using the possibilities of the GDP growth template. Also, try out our finance infographic template and create a complete finance presentation.
Login to download this file


