
How to Create a Venn Diagram in PowerPoint


This article will guide you on creating Venn diagrams in PowerPoint. Venn diagrams are powerful tools for visually representing relationships and comparisons between different sets of information. It can be used to represent overlapping skills, contrasting product features, or even to showcase shared characteristics. Venn diagrams offer a clear and concise way to communicate ideas.
This article will equip you with the knowledge and skills you need to create professional-looking Venn diagrams in PowerPoint. Let’s begin.
There are 2 ways you can build Venn diagrams in PowerPoint. You can use SmartArt, or create them using shapes. The first method is ideal for beginners and offers pre-designed templates, while the latter offers more flexibility for customization, but it requires a bit more effort from your side. Let’s explore both sides, and you can choose the method you like. Sounds good?
Creating a Venn Diagram in PowerPoint with SmartArt:
Go to the Insert tab and click on SmartArt.
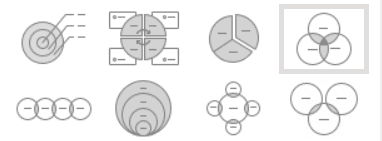
In the Choose a SmartArt Graphic window, and then navigate to the Relationship category.
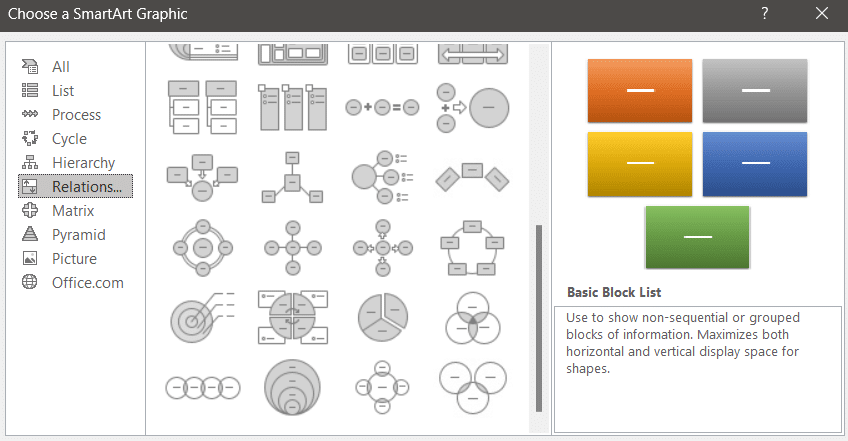
Select a suitable Venn diagram layout, such as Basic Venn with 3 Overlapping Circles for three sets.
Click OK to insert the chosen diagram template onto your slide.
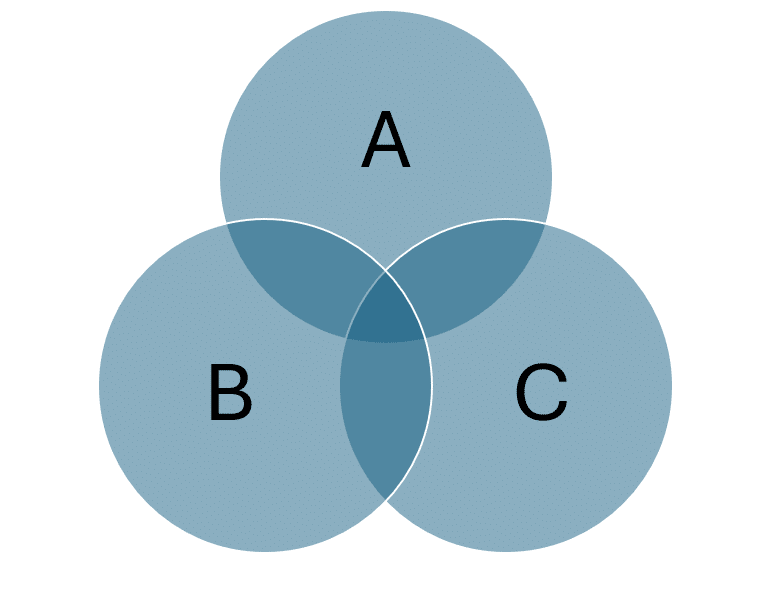
You now have a Venn diagram in your PowerPoint presentation. Click on the text placeholders inside the circles to add your text. You can also right-click on the diagram and choose Format Shape to customize colors, line styles, and other visual elements.
Creating a Venn Diagram with Shapes:
Go to the Insert tab and click on Shapes.
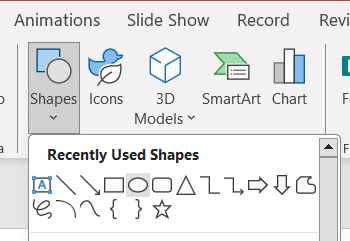
Choose the Oval shape and hold Shift while dragging to create a perfect circle.
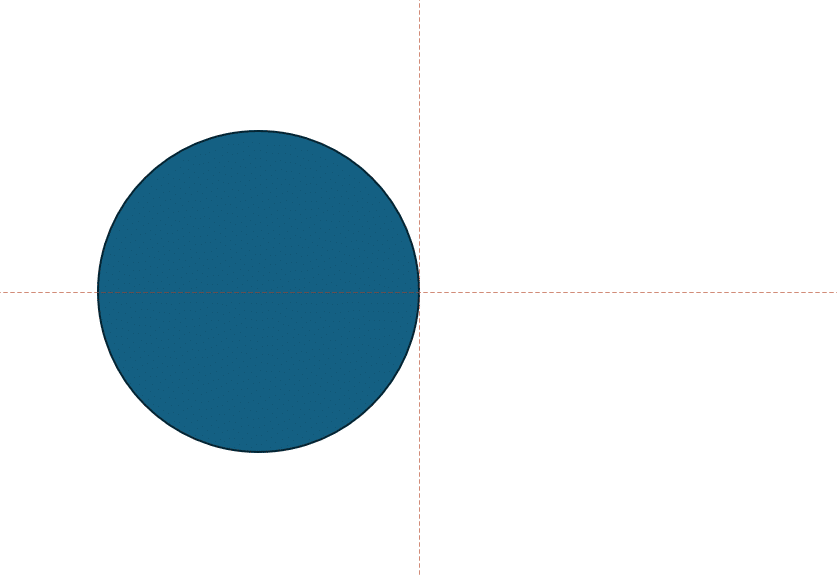
Duplicate the circle by clicking on it and pressing CTRL+D.
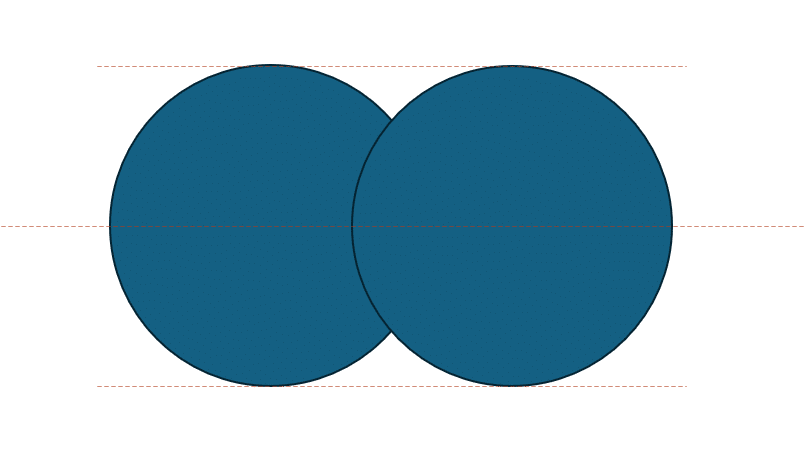
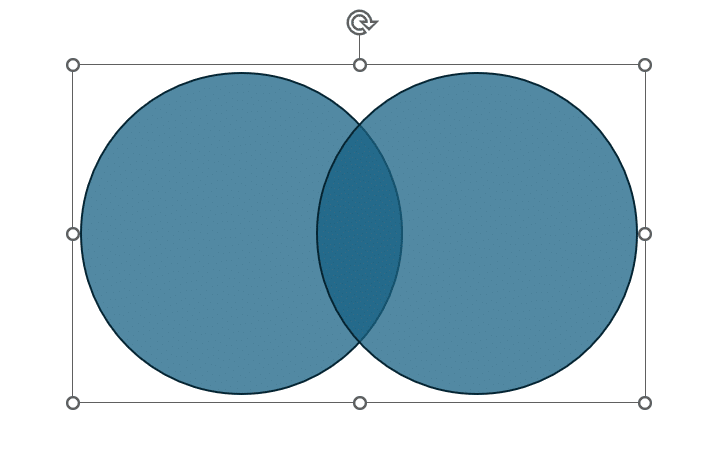
Position them slightly overlapping to form the Venn diagram base.
You can duplicate the circles as many times as you want, if you want.
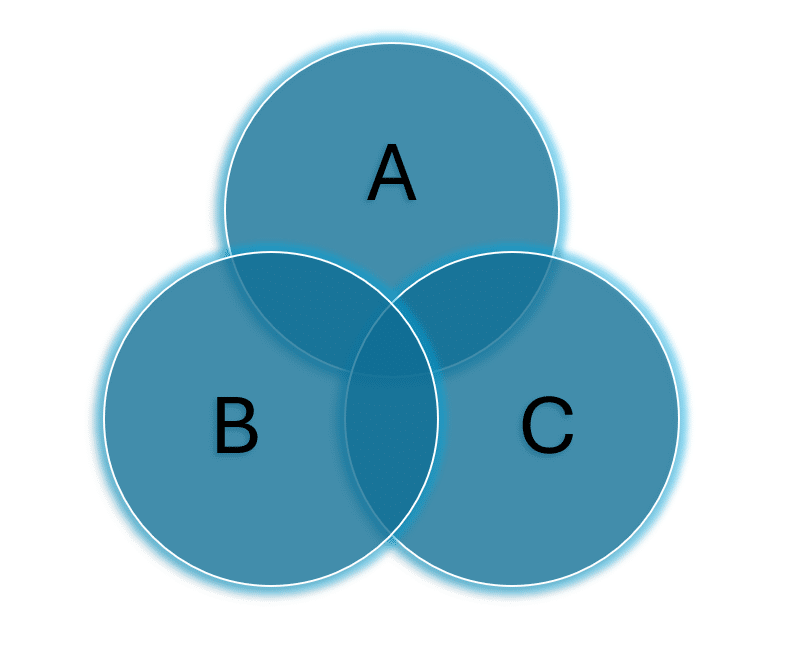
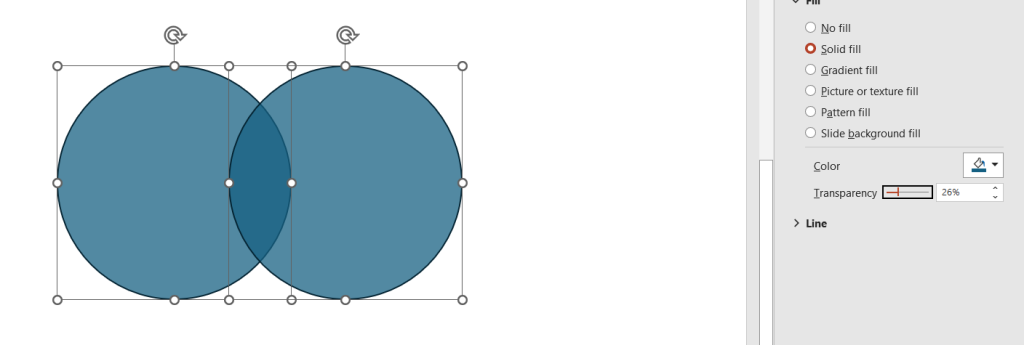
Now select both circles, and right-click, and select Format Object. In the sidebar that appears, find and adjust Transparency to get the overlapping effect shown below.
Finally group all elements (select all shapes and press Ctrl+G) to ensure they move together as one diagram. This makes it so much easier to move them around if needed, and also prevents you from accidentally moving the circles.
Your basic Venn diagram is now complete. Feel free to duplicate the circles as many times as you want.
Here’s a pro tip:
For quicker workflow, consider using SlideBazaar’s productivity add-in for PowerPoint. The add-in has a useful feature that lets you duplicate and arrange any shapes with ease:

You can also do the following steps to enhance your Venn diagrams:
Use different colors to distinguish between different sets and overlapping areas.
Adjust the text size and font for optimal readability.
Incorporate arrows or lines to highlight specific relationships between sets.
Consider adding subtle shading to differentiate overlapping areas from individual sets.
Some Tips for Effective Venn Diagrams:
Limit the number of sets: Aim for two or three sets for clear and concise communication.
Use concise and clear labels: Ensure the text within each set is easily understandable.
Maintain visual balance: Arrange the circles and text for a visually appealing and balanced presentation.
So, there you have it, a very quick and easy to follow tutorial on creating Venn diagrams in PowerPoint. I hope this article helped, do check out SlideBazaar’s blog for more useful articles related to PowerPoint and presentations.
Related Articles
-
 October 15th, 2025
Should Your Team Learn Video and Voice-Enhanced Presentations? (Trend Analysis for Leaders)
Blog Post -
 October 17th, 2025
Track These 3 Metrics to Double Your Team’s Presentation Output (Without Working Weekends)
Blog Post -
 May 19th, 2023
15+ Best Title Slides and Intro Slide Templates for Your PowerPoint Presentation
Blog Post