Animated Six-Stage 3D Process Diagram Template for PowerPoint & Google Slides
Description
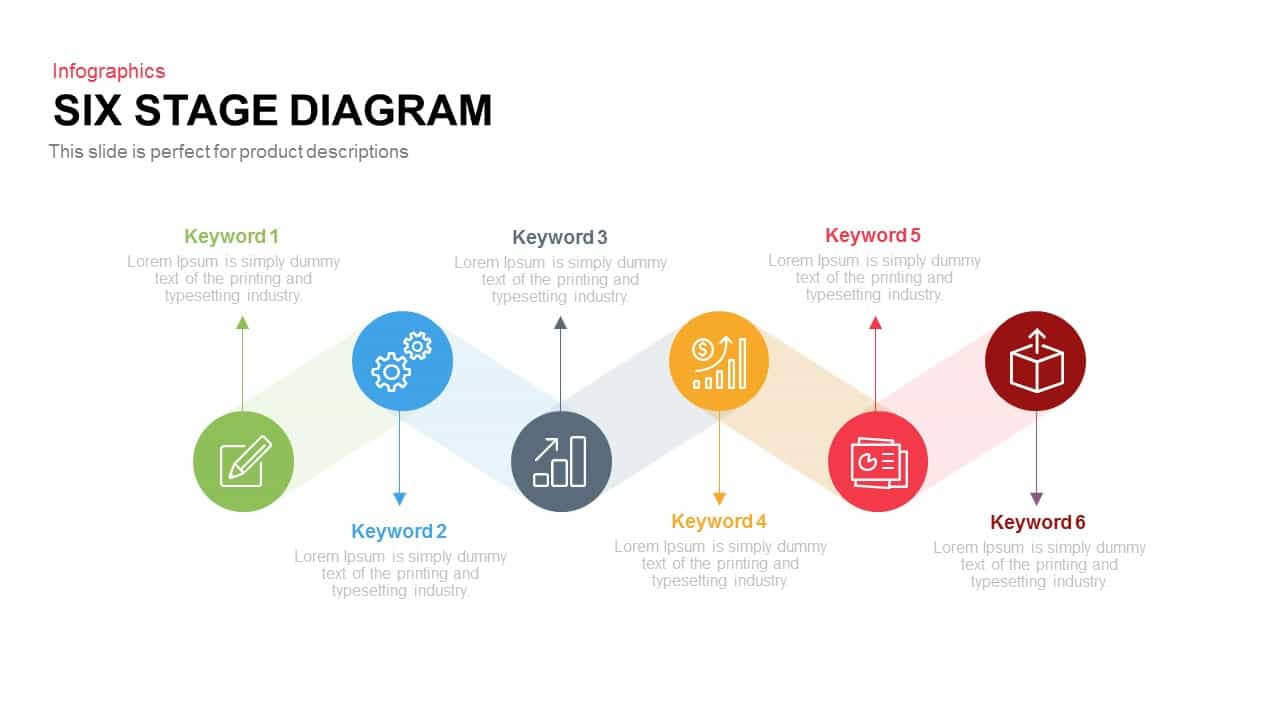
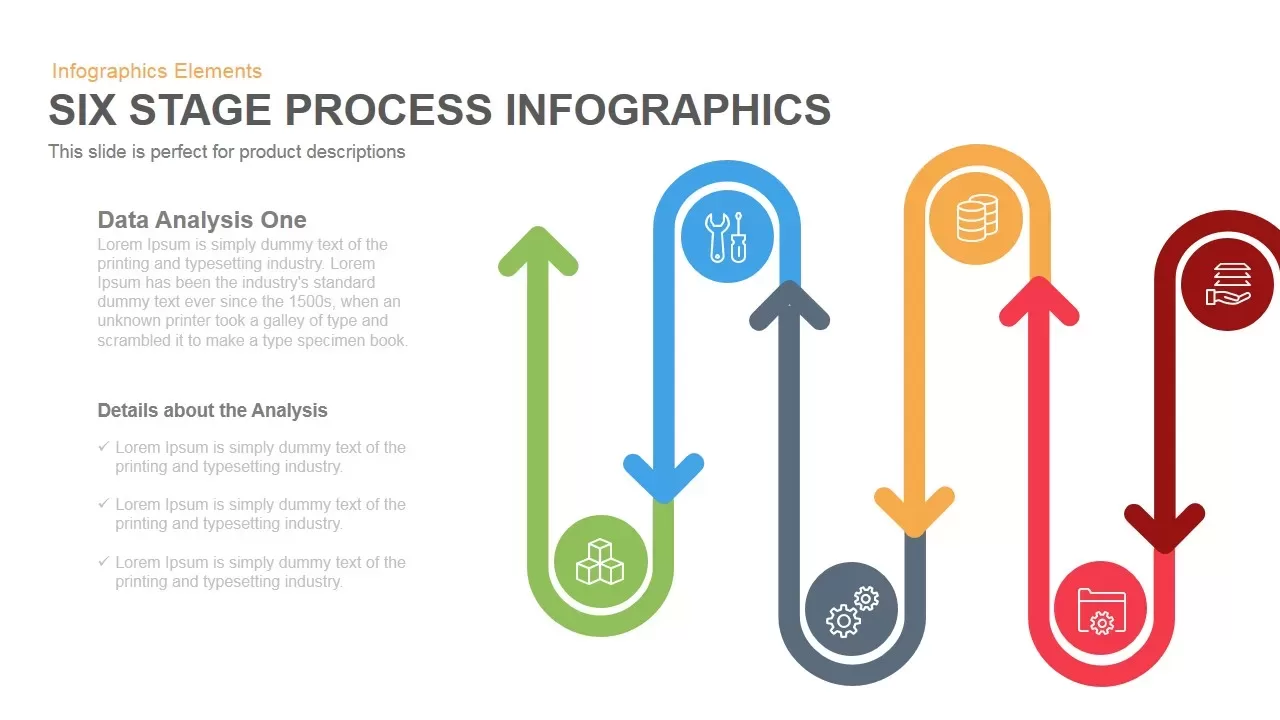
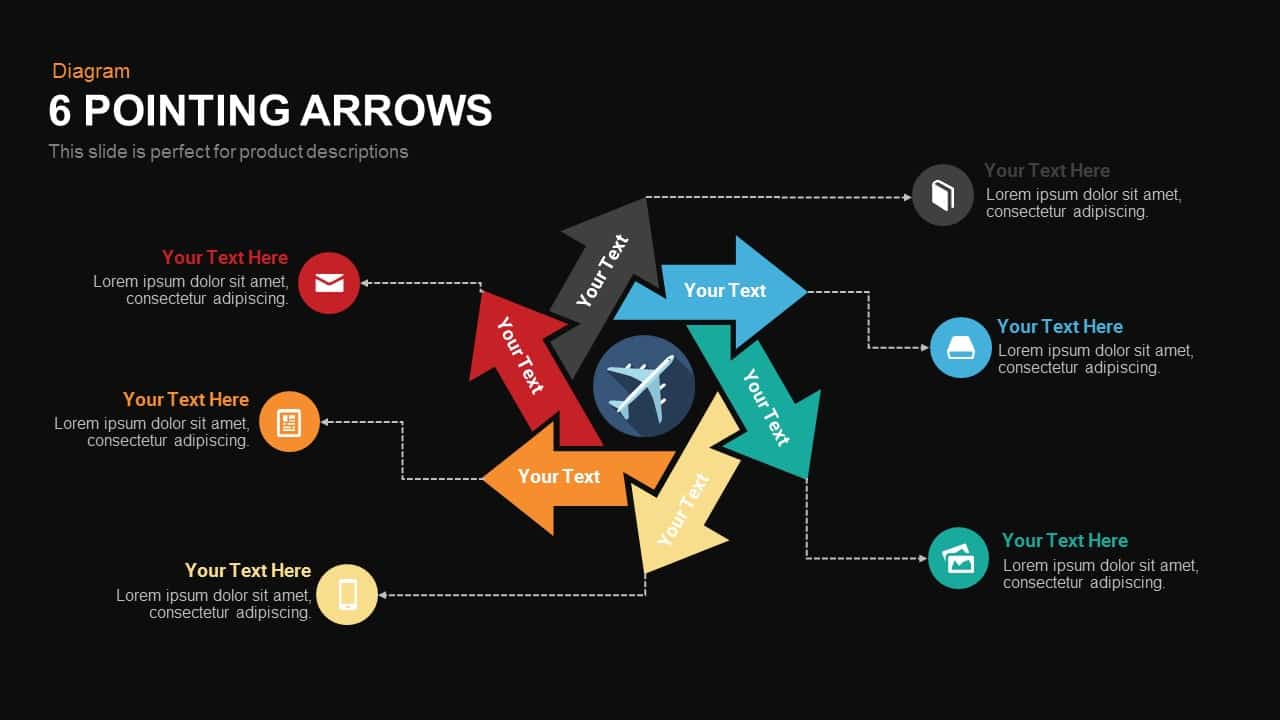
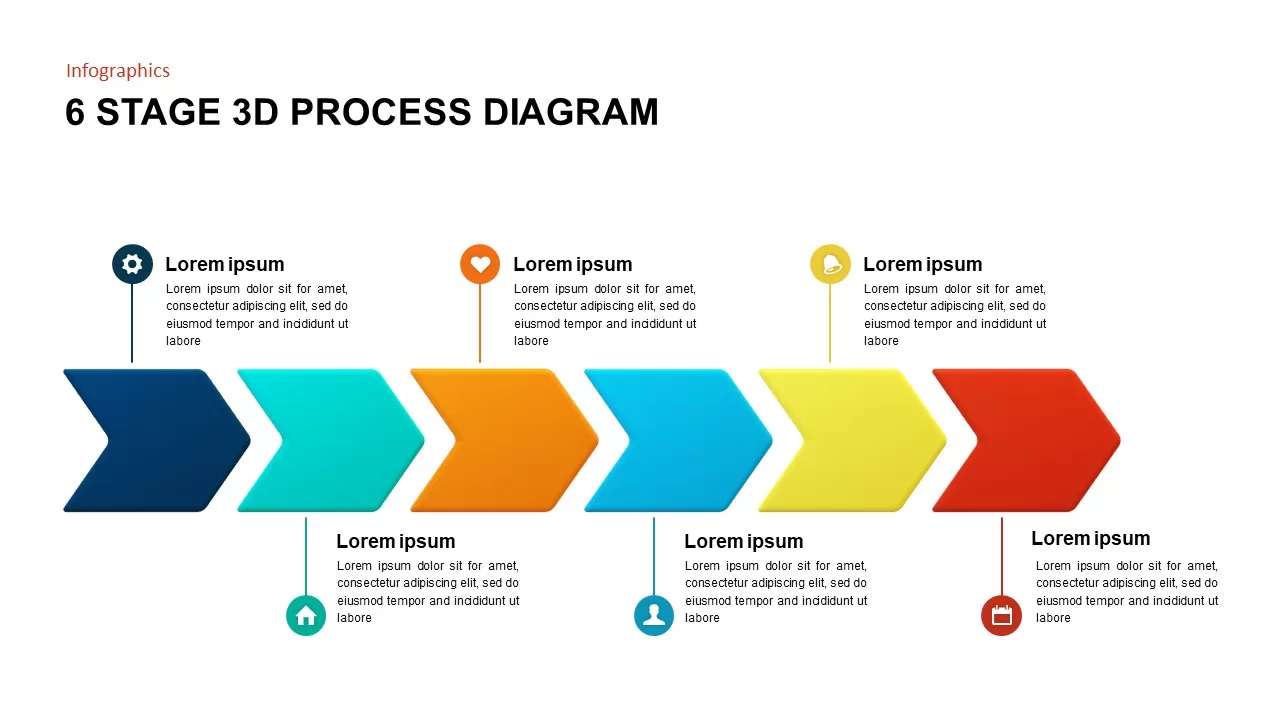
Leverage this animated six-stage 3D process diagram to convey complex workflows with striking visual depth and clarity. This dynamic infographic features six 3D arrow shapes in vibrant colors—dark blue, cyan, orange, light blue, yellow, and red—each paired with customizable icons and text placeholders. The three-dimensional shading and angled perspective draw attention to every stage while maintaining a clean horizontal flow. With readily editable shapes, text, and color schemes, you can adapt the slide to align with corporate branding or thematic palettes in seconds. Subtle built-in animations highlight each step sequentially, creating engaging transitions that guide your audience through each phase without distraction.
Designed on a flexible master slide, this template supports effortless resizing, redistribution of arrows, and icon replacement via intuitive drag-and-drop functionality. Whether you’re visualizing product development phases, operational procedures, or strategic roadmaps, this six-step process diagram breaks down workflows into digestible segments. Fully compatible with PowerPoint and Google Slides, it guarantees consistent formatting and crisp resolution across different devices and platforms. Replace placeholder icons with industry-specific symbols, adjust arrow orientation, or modify animation timings to suit your presentation style. Save time on design and focus on content by leveraging this plug-and-play slide layout.
Combine multiple instances to build complex timelines, compare project milestones, or showcase continuous improvement cycles. Duplicate the slide, reorder the arrows, and update text fields to track progress, emphasize key deliverables, or facilitate decision-making workshops. With this versatile infographic at your disposal, you can drive stakeholder engagement, clarify intricate processes, and deliver memorable presentations that resonate.
Who is it for
Project managers, business analysts, and operations teams will benefit from this six-step diagram when presenting process workflows, strategic roadmaps, or product development phases. Marketing teams and strategy consultants can illustrate campaign lifecycles, while educators and trainers can depict instructional sequences with impact.
Other Uses
Beyond standard process workflows, repurpose this diagram for visualizing customer journeys, sales funnels, Six Sigma DMAIC steps, risk assessments, training modules, production cycles, or continuous improvement loops. Use the arrow shapes to compare parallel processes, highlight project milestones, define onboarding procedures, or map cross-departmental handoffs.
Login to download this file
Add to favorites
Add to collection

Item ID
SB02146
Related Templates

Six Stage Zigzag Process Diagram Template for PowerPoint & Google Slides
Process
Premium
Six-Stage Zig-Zag Process Flow Diagram Template for PowerPoint & Google Slides
Process
Premium
Free Six Stage Bubble Process Diagram template for PowerPoint & Google Slides
Process
Free

Six-Stage Circular Process Diagram Template for PowerPoint & Google Slides
Process
Premium
Six-Stage Circle Process Diagram Template for PowerPoint & Google Slides
Process
Premium
Free Six-Stage Arrow Process Diagram Template for PowerPoint & Google Slides
Process
Free
Six-Stage Circular Diagram Process Template for PowerPoint & Google Slides
Circle
Premium
Six Stage Hexagon Process Diagram Template for PowerPoint & Google Slides
Process
Premium
Six-Stage Infinity Loop Process Diagram Template for PowerPoint & Google Slides
Process
Premium
Six-Stage Process Infographics Template for PowerPoint & Google Slides
Process
Premium
Six-Stage Connected Process Infographics Template for PowerPoint & Google Slides
Process
Premium
Six-Stage Service Process Workflow Template for PowerPoint & Google Slides
Process
Premium
Six-Stage Pyramid Process Slide Template for PowerPoint & Google Slides
Pyramid
Premium
Six-Stage Semi-Circle Diagram with Icons Template for PowerPoint & Google Slides
Circle
Premium
Six-Stage Circular Cycle Diagram Template for PowerPoint & Google Slides
Process
Premium
Six Stage Circular Diagram with Icons Template for PowerPoint & Google Slides
Circle
Premium
Six-Stage Gear Wheel Diagram Template for PowerPoint & Google Slides
Circle
Premium
Six-Stage Arrow Timeline Diagram Template for PowerPoint & Google Slides
Timeline
Premium
Six-Stage Clockwise Circular Diagram Template for PowerPoint & Google Slides
Circle
Premium
Six Stage Agenda Timeline Diagram template for PowerPoint & Google Slides
Agenda
Premium
Six-Stage Circular Flow Diagram Template for PowerPoint & Google Slides
Circle
Premium
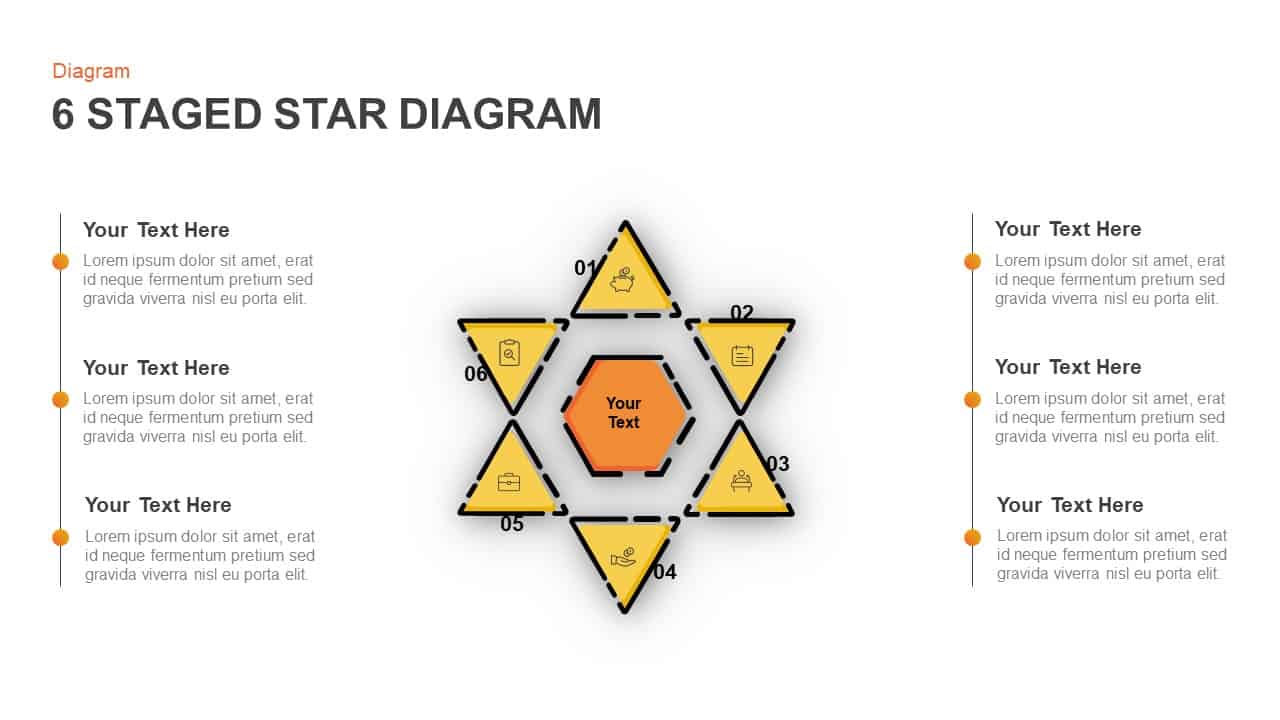
Six-Stage Star Diagram Infographic Template for PowerPoint & Google Slides
Process
Premium

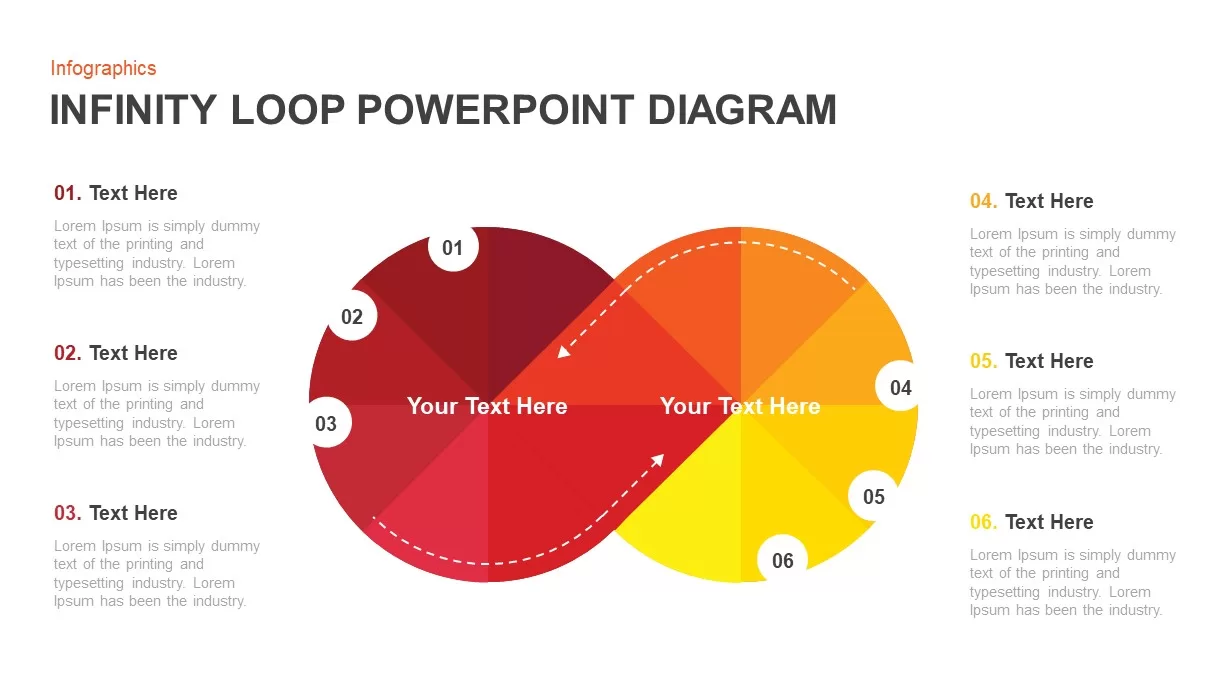
Six-Stage Infinity Loop Diagram Template for PowerPoint & Google Slides
Process
Premium
Six Stage Timeline Diagram for PowerPoint & Google Slides
Timeline
Premium
Five and Six Step Line Linear Stage Diagram for PowerPoint & Google Slides
Infographics
Premium
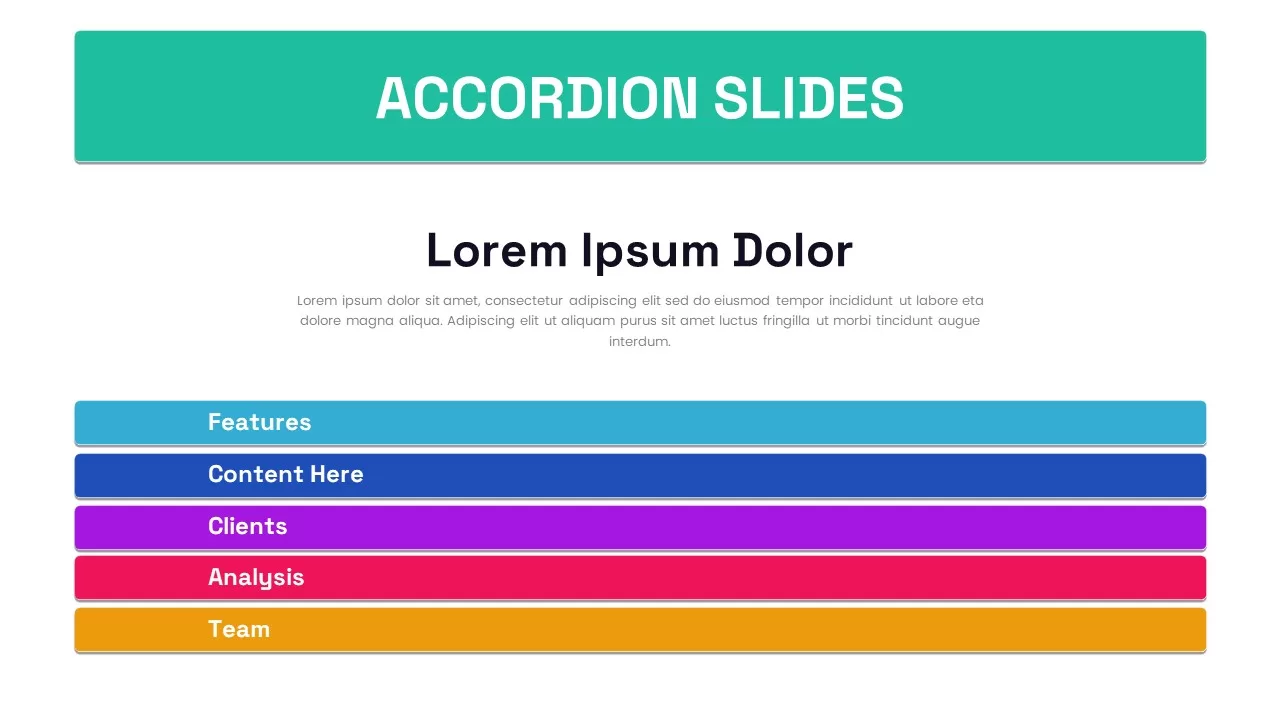
Six-Slide Animated Accordion Pack Template for PowerPoint & Google Slides
Business
Premium
Six-Stage Hexagon template for PowerPoint & Google Slides
Process
Premium
Six-Stage Zig-Zag Roadmap Infographics Template for PowerPoint & Google Slides
Roadmap
Premium
Six-Stage Colorful Spiral Timeline Template for PowerPoint & Google Slides
Timeline
Premium
Six-Stage Time Arrow Infographics Template for PowerPoint & Google Slides
Arrow
Premium
Six Stage Timeline Infographics Template for PowerPoint & Google Slides
Timeline
Premium
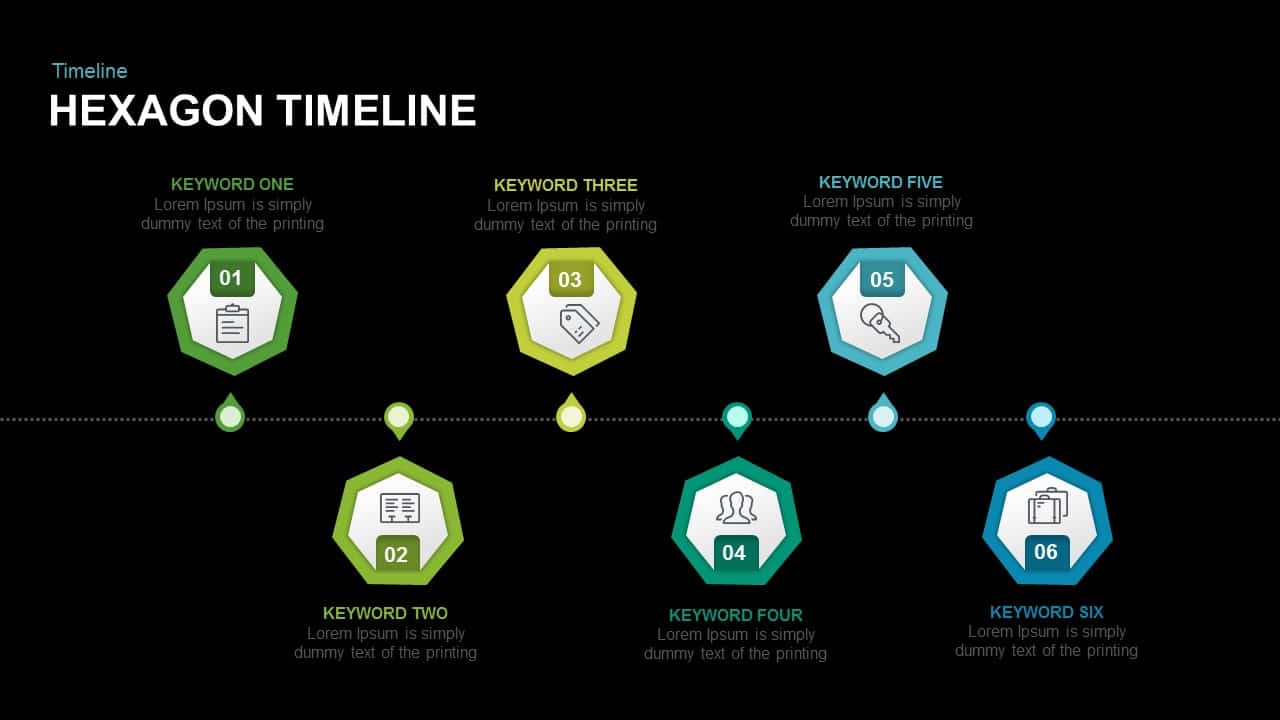
Six-Stage Hexagon Timeline Infographic Template for PowerPoint & Google Slides
Timeline
Premium
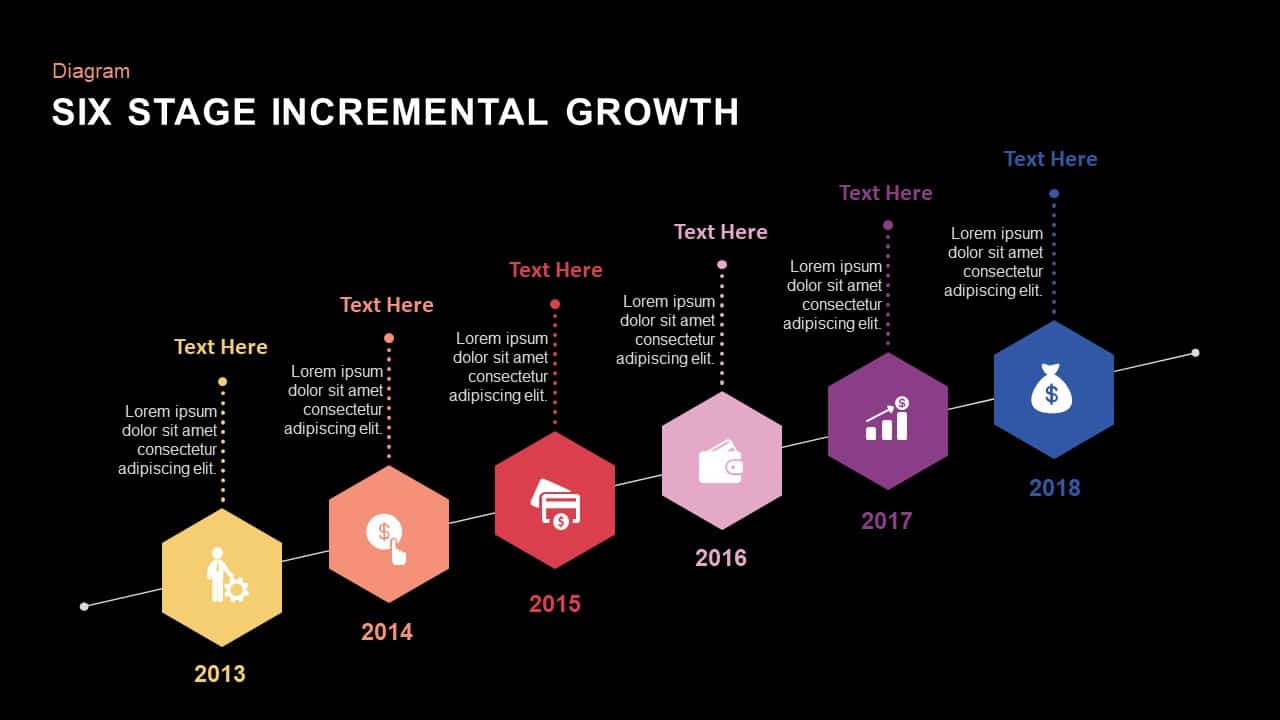
Six Stage Incremental Growth template for PowerPoint & Google Slides
Timeline
Premium
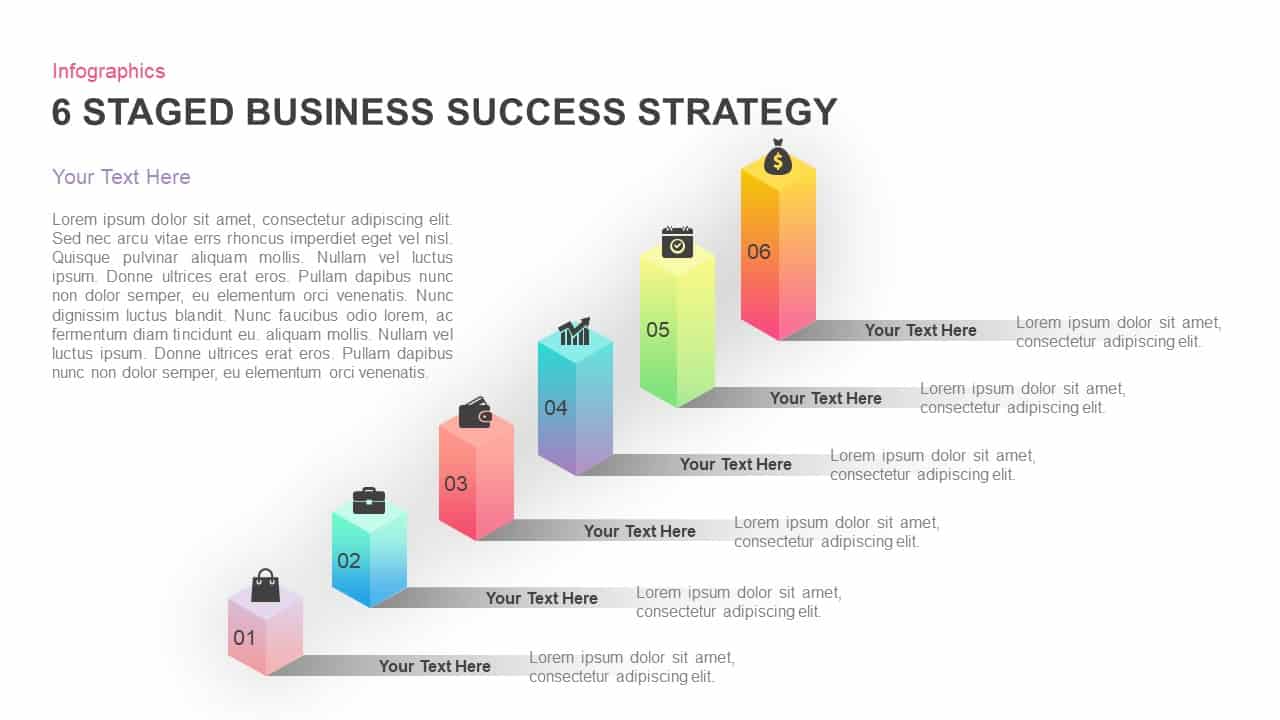
Six-Stage Business Success Strategy Template for PowerPoint & Google Slides
Business Strategy
Premium
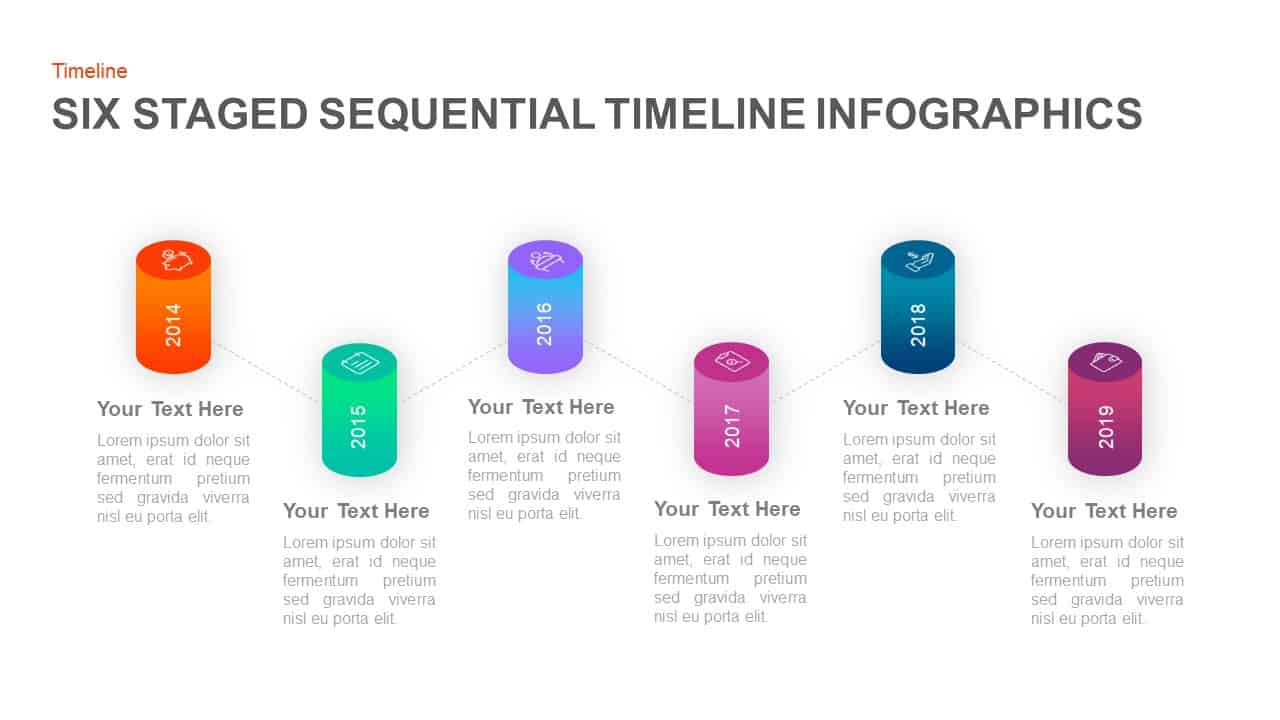
Six-Stage Timeline Infographic Template for PowerPoint & Google Slides
Timeline
Premium
Six-Stage Timeline Infographics Slide Template for PowerPoint & Google Slides
Timeline
Premium
Six-Stage Road Map Infographic Timeline Template for PowerPoint & Google Slides
Roadmap
Premium
Six Arrow Radial Process Diagram template for PowerPoint & Google Slides
Infographics
Premium
Six Hexagon Stages Process Flow Diagram Template for PowerPoint & Google Slides
Process
Premium
Roadmap Six-Step Process Diagram Template for PowerPoint & Google Slides
Roadmap
Premium
Six Pointing Arrow Process Diagram Template for PowerPoint & Google Slides
Arrow
Premium
Six-Sided Shutter Diagram Process Flow Template for PowerPoint & Google Slides
Process
Premium

Editable Six-Step Bubble Process Diagram Template for PowerPoint & Google Slides
Process
Premium
Six-Process Circular Arrow Diagram Template for PowerPoint & Google Slides
Circle
Premium
Six-Step Hexagon Process Diagram Template for PowerPoint & Google Slides
Process
Premium
Six-Step Vertical Process Diagram Template for PowerPoint & Google Slides
Process
Premium
Six Sigma Gear Process Diagram Template for PowerPoint & Google Slides
Process
Premium
Six-Step Linear Arrow Process Diagram Template for PowerPoint & Google Slides
Process
Premium
Six-Step Hexagon Process Flow Diagram Template for PowerPoint & Google Slides
Process
Premium
Compass-Themed Six-Step Process Diagram Template for PowerPoint & Google Slides
Process
Premium
Six-Step Infinity Loop Process Diagram Template for PowerPoint & Google Slides
Process
Premium
Six Sigma 6S Process Infographic Diagram Template for PowerPoint & Google Slides
Process
Premium
Six Sigma 6S Process Diagram Template for PowerPoint & Google Slides
Process
Premium
Six-Circle Process Infographic Diagram Template for PowerPoint & Google Slides
Circle
Premium
Six-Step Output Process Diagram Template for PowerPoint & Google Slides
Process
Premium
Six-Point Star Process Diagram Template for PowerPoint & Google Slides
Process
Premium
Animated 5-Stage Puzzle Timeline Infographic Template for PowerPoint & Google Slides
Timeline
Premium
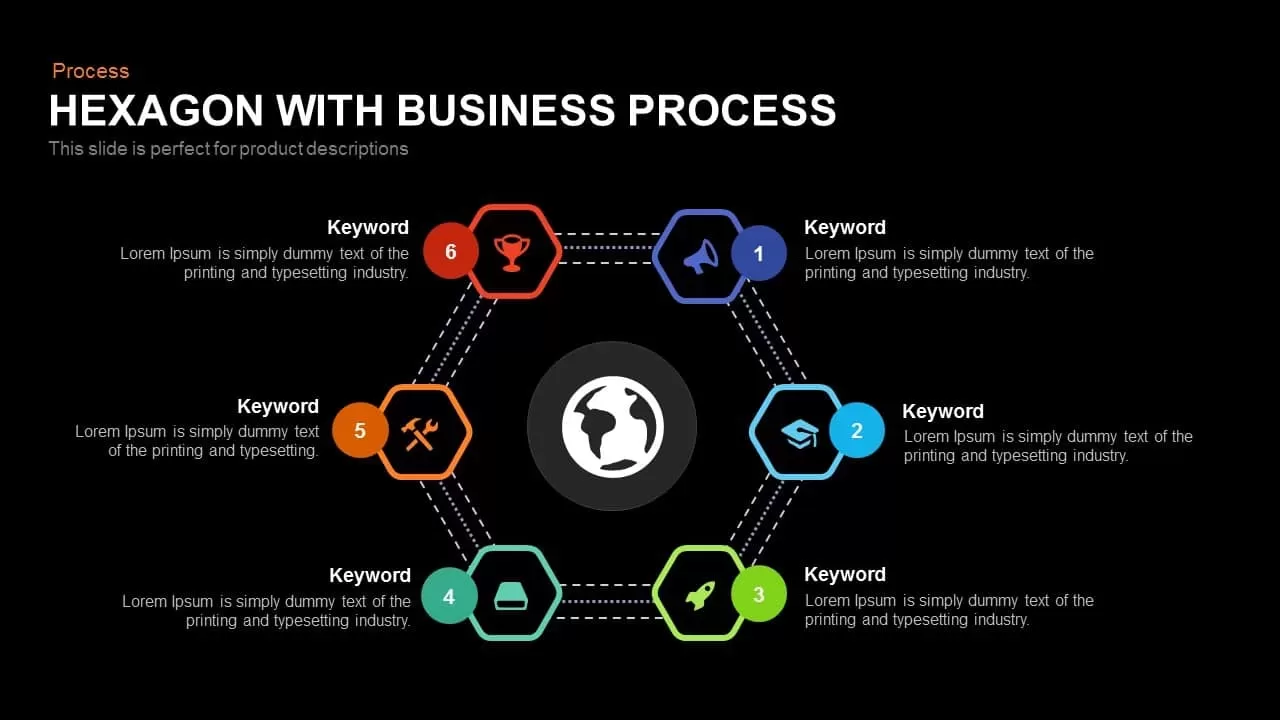
Global Hexagon Six-Step Business Process Template for PowerPoint & Google Slides
Process
Premium
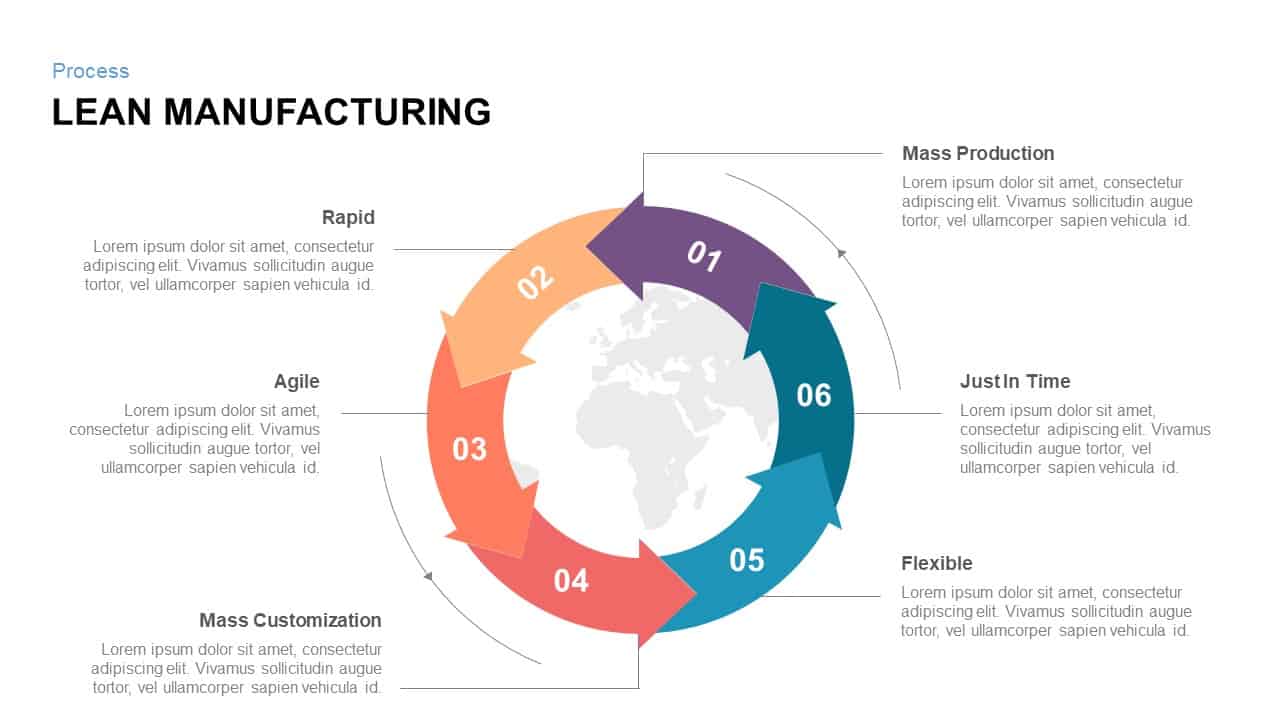
Six-Step Lean Manufacturing Process Template for PowerPoint & Google Slides
Process
Premium
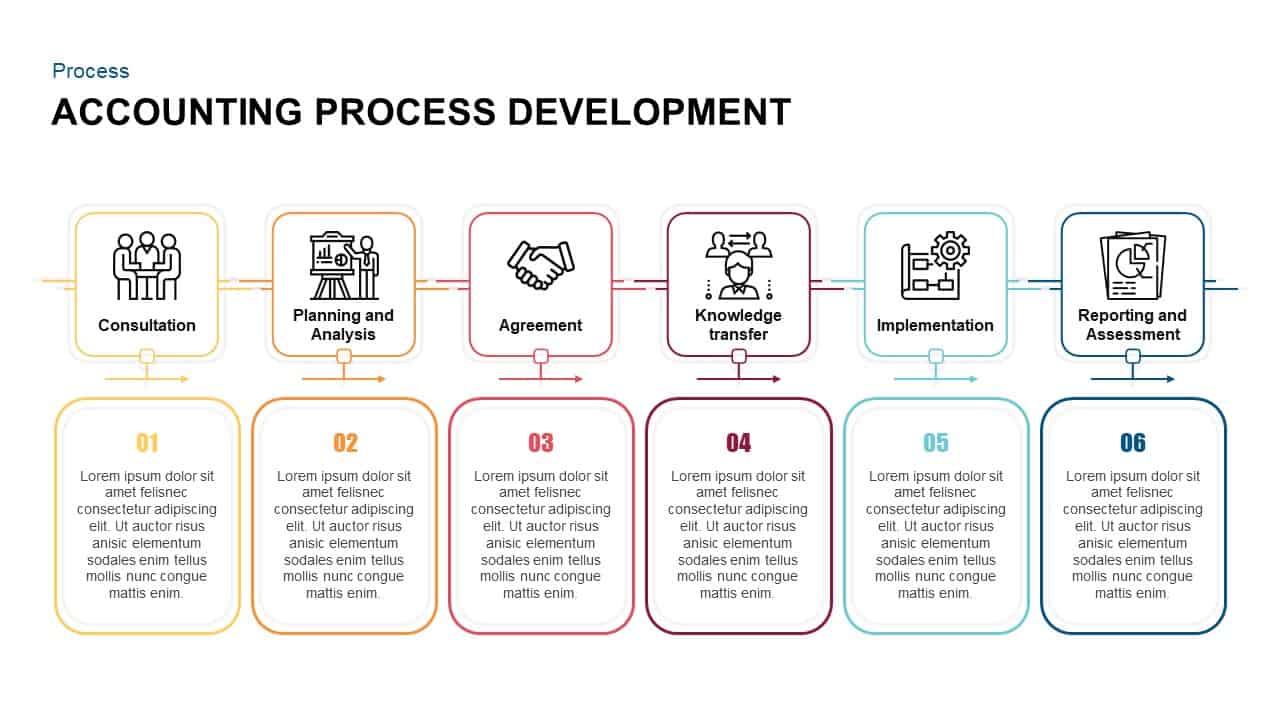
Six-Step Accounting Process Development Template for PowerPoint & Google Slides
Process
Premium
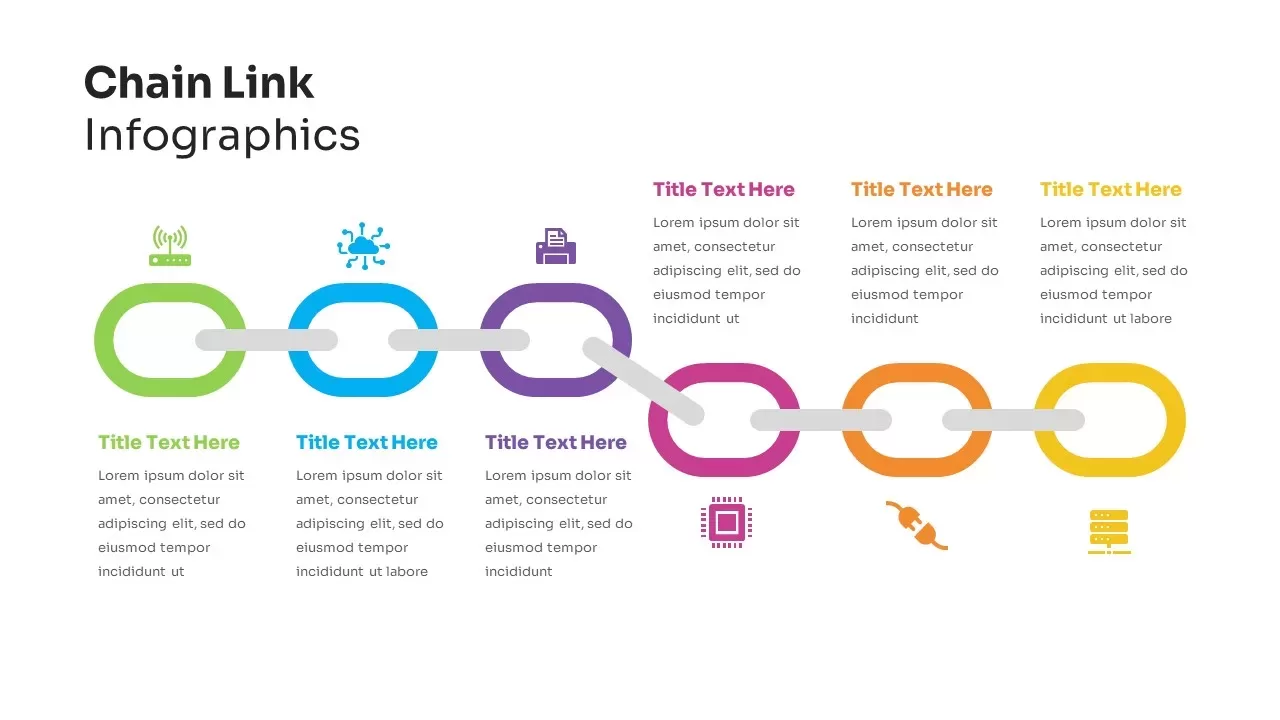
Six-Step Chain Link Technology Process Template for PowerPoint & Google Slides
Process
Premium
Six-Step Social Media Management Process Template for PowerPoint & Google Slides
Process
Premium
Free Six-Phase Market Research Process Template for PowerPoint & Google Slides
Process
Free
Animated Gears Process Flow Diagram Template for PowerPoint & Google Slides
Process
Premium
6 Stage Process Diagram Infographic Template for PowerPoint & Google Slides
Process
Premium

Three Stage 3D Arrow Process Diagram Template for PowerPoint & Google Slides
Process
Premium

5 Stage Process Diagram Slide Overview Template for PowerPoint & Google Slides
Process
Premium
Ten-Stage Zig-Zag Process Diagram Template for PowerPoint & Google Slides
Process
Premium
Modern Five-Stage Cycle Process Diagram Template for PowerPoint & Google Slides
Process
Premium
Engaging Five-Stage Process Diagram Template for PowerPoint & Google Slides
Process
Premium
Engaging Three-Stage Process Diagram Template for PowerPoint & Google Slides
Process
Premium
Five Stage Process Diagram Infographic Template for PowerPoint & Google Slides
Process
Premium
Eight Stage Process Diagram template for PowerPoint & Google Slides
Process
Premium
Five Stage Process Diagram template for PowerPoint & Google Slides
Process
Free
Nine-Stage 3D Funnel Process Diagram Template for PowerPoint & Google Slides
Funnel
Premium
Five-Stage Cyclic Process Arrow Diagram Template for PowerPoint & Google Slides
Process
Premium
Ten-Stage Hub and Spoke Process Diagram Template for PowerPoint & Google Slides
Process
Premium

Eight-Stage Radial Process Flow Diagram Template for PowerPoint & Google Slides
Process
Premium
Ten-Stage Business Process Diagram Template for PowerPoint & Google Slides
Process
Premium
12-Stage Zig Zag Process Diagram Template for PowerPoint & Google Slides
Process
Premium
Five-Stage Process Diagram Template for PowerPoint & Google Slides
Process
Premium
Five Stage Linear Process Flow Diagram Template for PowerPoint & Google Slides
Process
Premium
Five-Stage Linear Process Flow Diagram Template for PowerPoint & Google Slides
Process
Premium
Five-Stage Circular Process Diagram Template for PowerPoint & Google Slides
Circle
Premium
Four-Stage Gear Process Diagram Template for PowerPoint & Google Slides
Process
Premium
Four-Stage Cycle Process Diagram Template for PowerPoint & Google Slides
Process
Premium
Five-Stage Circular Process Flow Diagram Template for PowerPoint & Google Slides
Circle
Premium
5-Stage Gear Process Flow Diagram Template for PowerPoint & Google Slides
Process
Premium
3D Seven-Stage Process Flow Diagram Template for PowerPoint & Google Slides
Process
Premium
Four-Stage Linear Process Flow Diagram Template for PowerPoint & Google Slides
Process
Premium
5-Stage Linear Process Flow Diagram Template for PowerPoint & Google Slides
Process
Premium
Five-Stage Process Flow Diagram Template for PowerPoint & Google Slides
Process
Premium
7 Stage Linear Process Flow Diagram Template for PowerPoint & Google Slides
Process
Premium
4 Stage Linear Process Flow Diagram Template for PowerPoint & Google Slides
Process
Premium
Three-Stage Loop Process Diagram Template for PowerPoint & Google Slides
Process
Premium
4-Stage Linear Process Flow Diagram Template for PowerPoint & Google Slides
Process
Premium
Eight-Stage Gear Diagram Process Template for PowerPoint & Google Slides
Process
Premium
Colorful 8-Stage Droplet Process Flow Diagram Template for PowerPoint & Google Slides
Process
Premium
Project Stage Gate Process Diagram Template for PowerPoint & Google Slides
Process
Premium
Modern 8-Stage Funnel Process Diagram Template for PowerPoint & Google Slides
Funnel
Premium