SWOT Analysis Circular Infographic Template for PowerPoint & Google Slides
Description
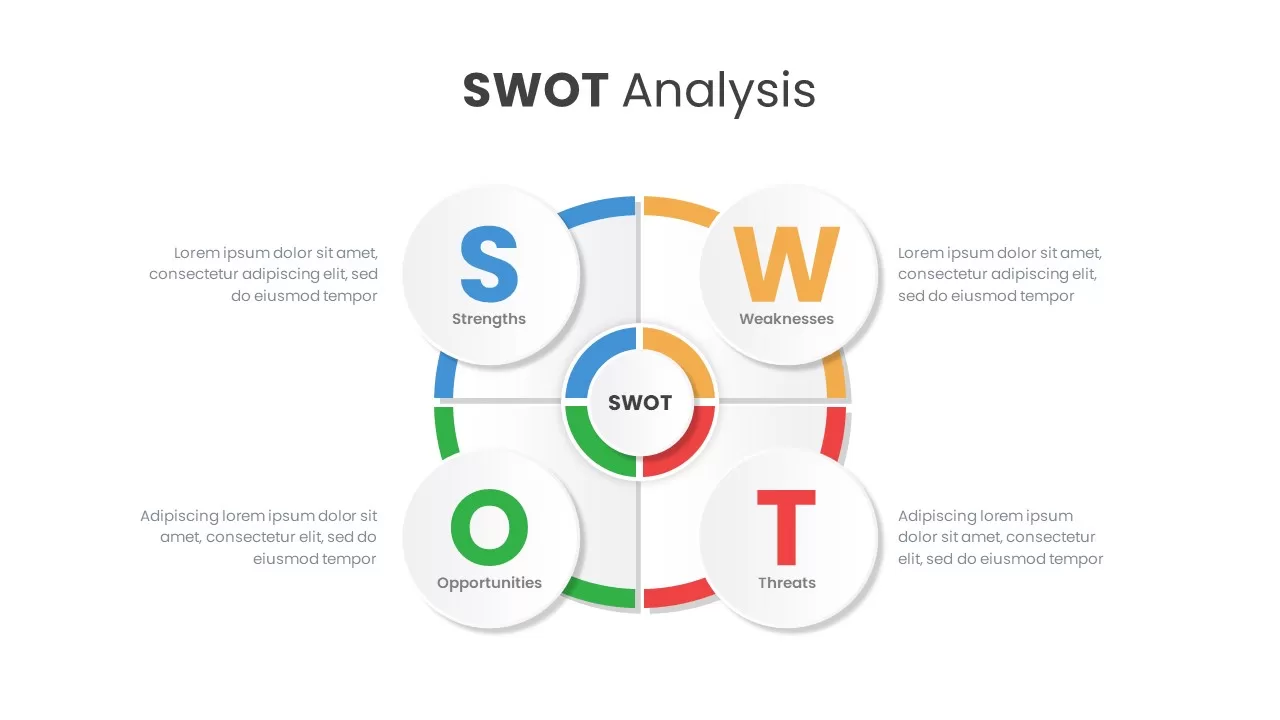
Visualize your SWOT analysis with this clean, four-quadrant circular infographic template for PowerPoint & Google Slides. Each quadrant highlights one element of SWOT—Strengths, Weaknesses, Opportunities, and Threats—in distinct, vibrant colors: golden yellow for Strengths, fiery red for Weaknesses, teal for Opportunities, and olive green for Threats. The central hub clearly displays “SWOT” to anchor your strategic overview. Surrounding each icon-labeled circle, ample text placeholders allow concise descriptions of key factors. The minimalist white background and subtle drop shadows ensure clarity and focus on your content. All shapes are fully editable and resizable, letting you adjust color themes, icon styles, and text with ease. With built-in master layouts, users can add or remove quadrants, change color schemes, and scale graphics without losing resolution. Optimized for collaboration, this slide works seamlessly in both PowerPoint and Google Slides, maintaining consistent formatting across platforms. Designed with built-in alignment guides and a cohesive icon library, this template ensures professional layout integrity and typographic consistency. Users can swap icons, tweak quadrant sizes, and apply alternate color themes to emphasize priority factors. The infographic preserves crisp legibility and quality for both virtual presentations and printed handouts.
Who is it for
Business leaders, marketing managers, consultants, startup founders, and strategists can leverage this template to communicate competitive analyses, market assessments, product positioning, and risk evaluations. It suits corporate presentations, boardroom briefings, and academic projects that require a structured strategic overview.
Other Uses
Beyond SWOT analysis, repurpose this circular infographic to showcase four-part processes, project phases, performance metrics, or departmental comparisons. Use the quadrant layout for risk assessments, vendor evaluations, priority matrices, or balanced scorecards. Duplicate and customize the slide to create consistent visuals across reports, training modules, and stakeholder communications.
Login to download this file


