5-Stage Timeline Infographic Slide Template for PowerPoint & Google Slides
Description
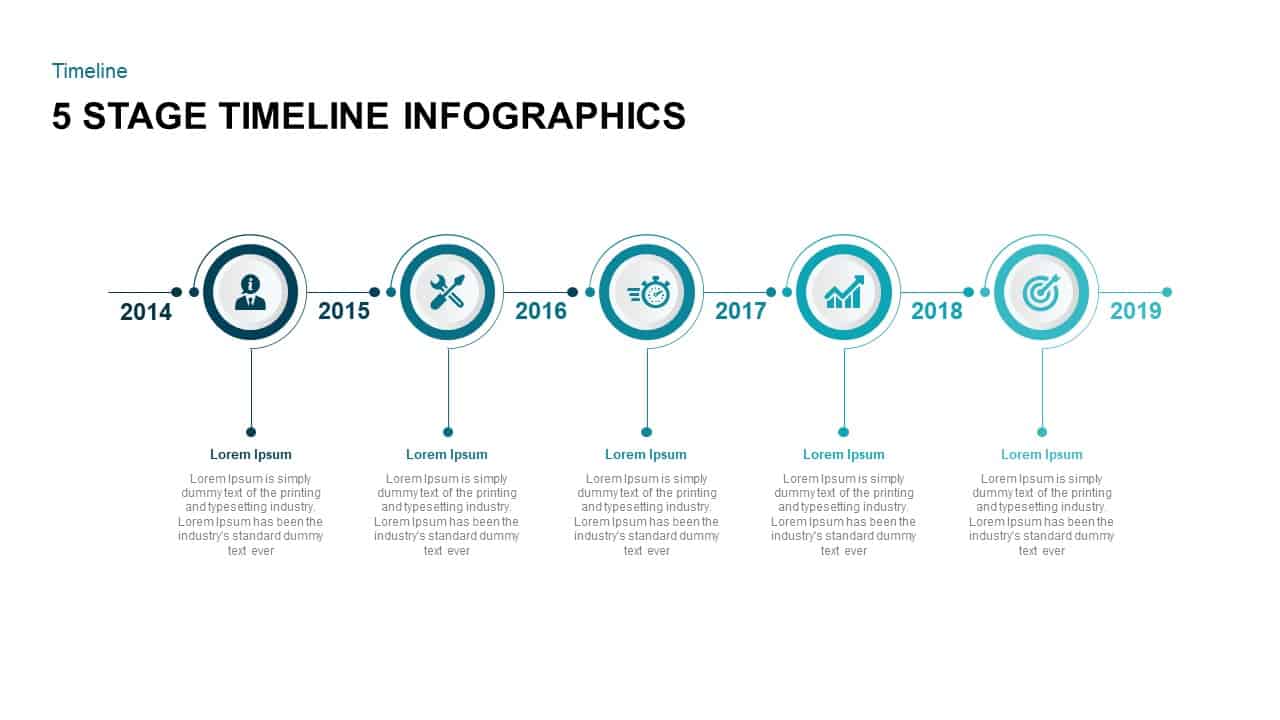
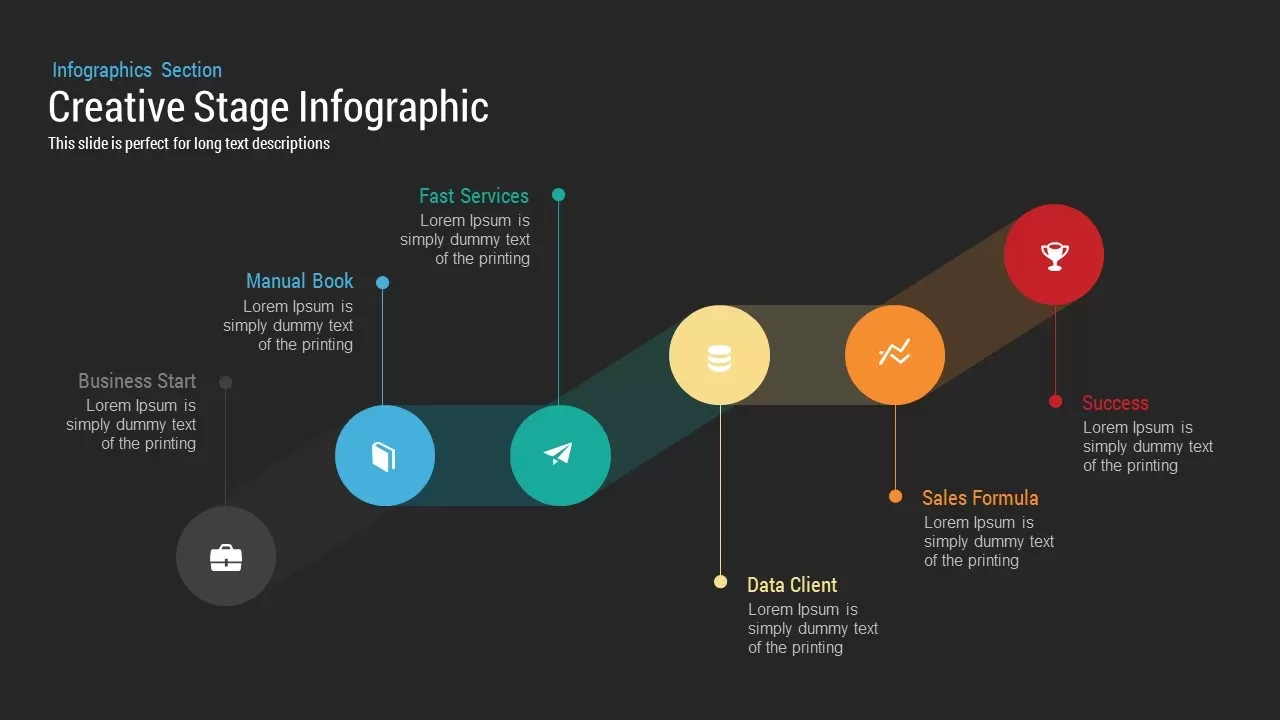
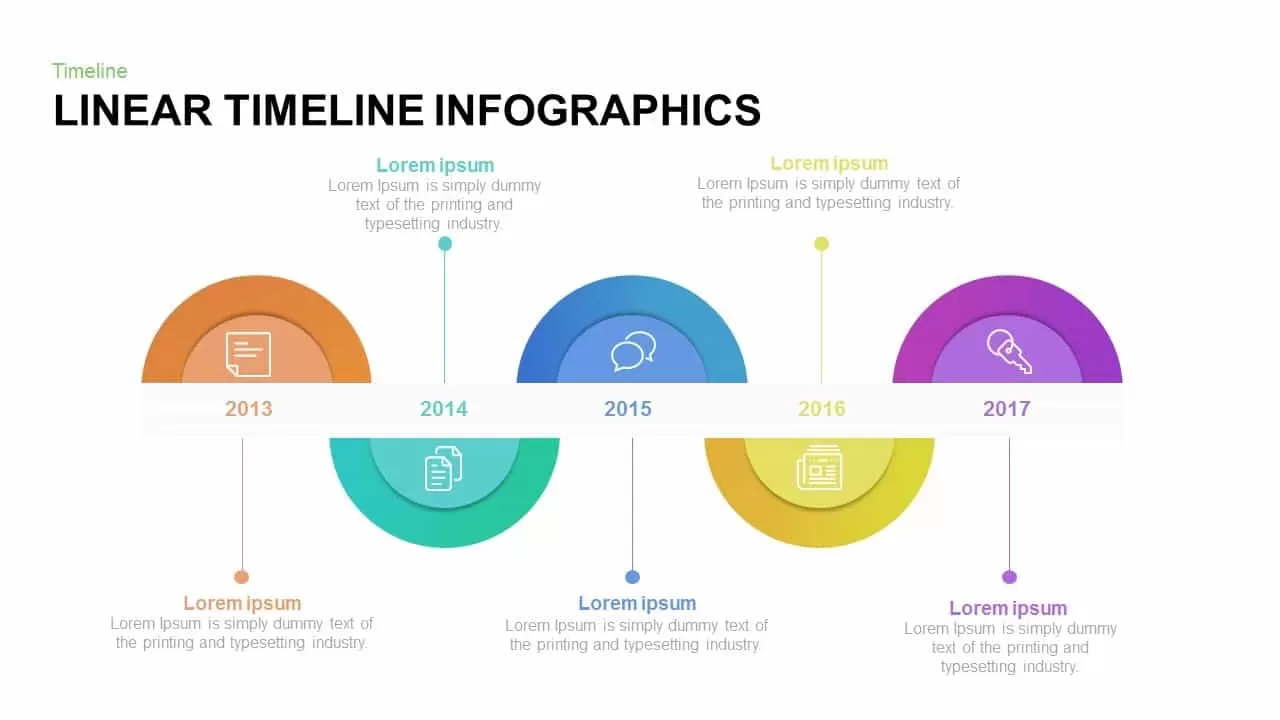
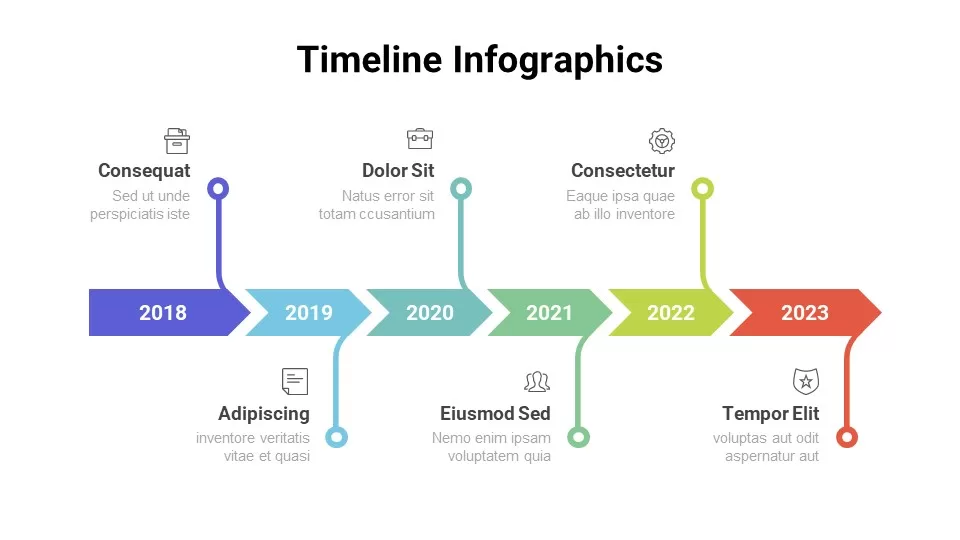
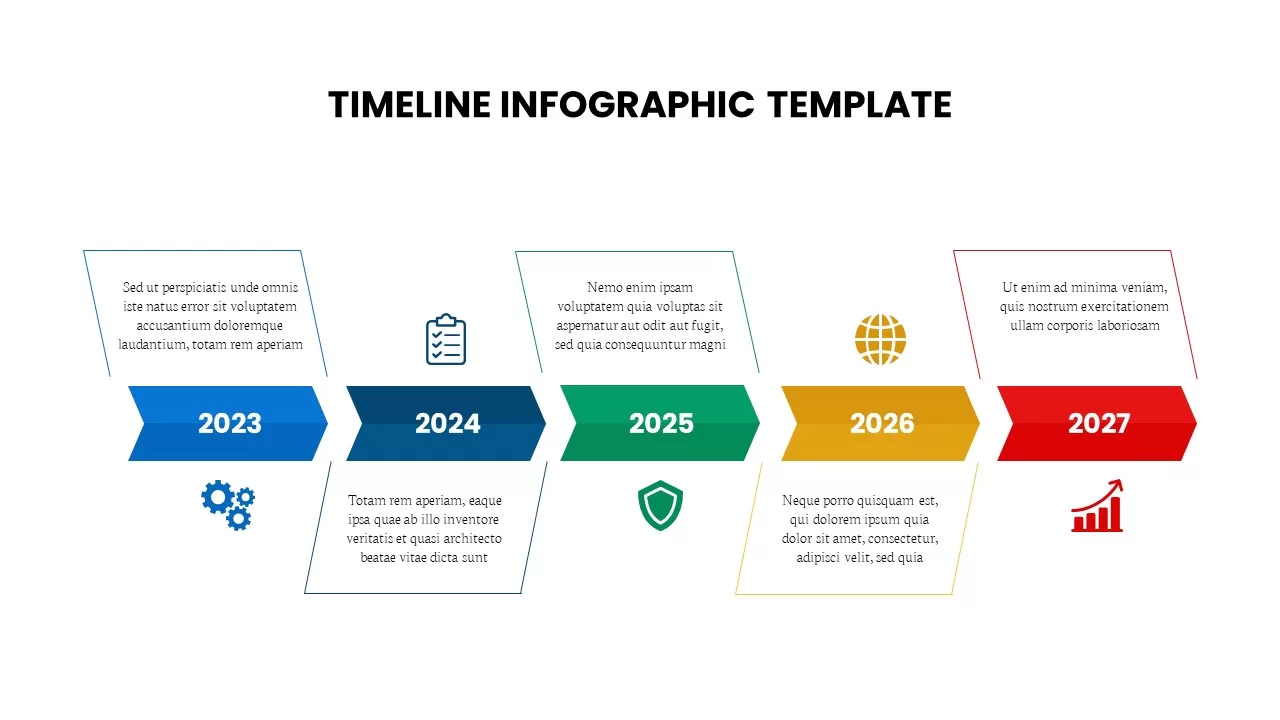
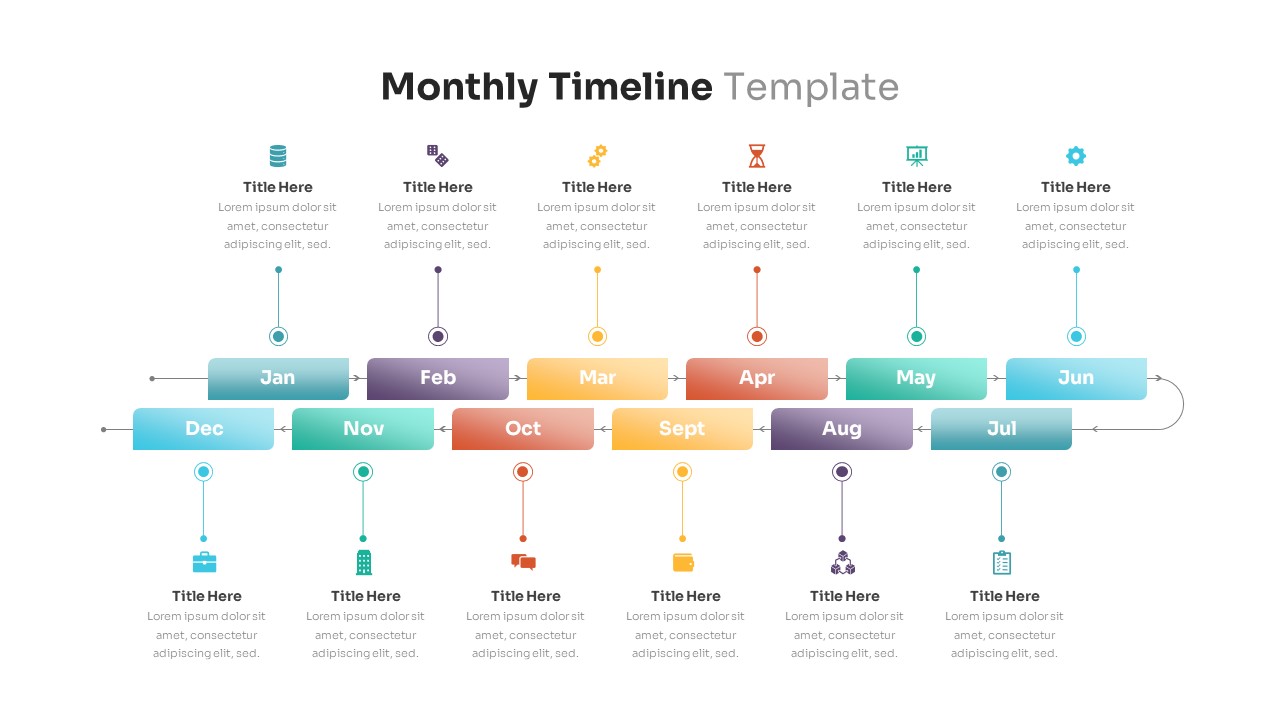
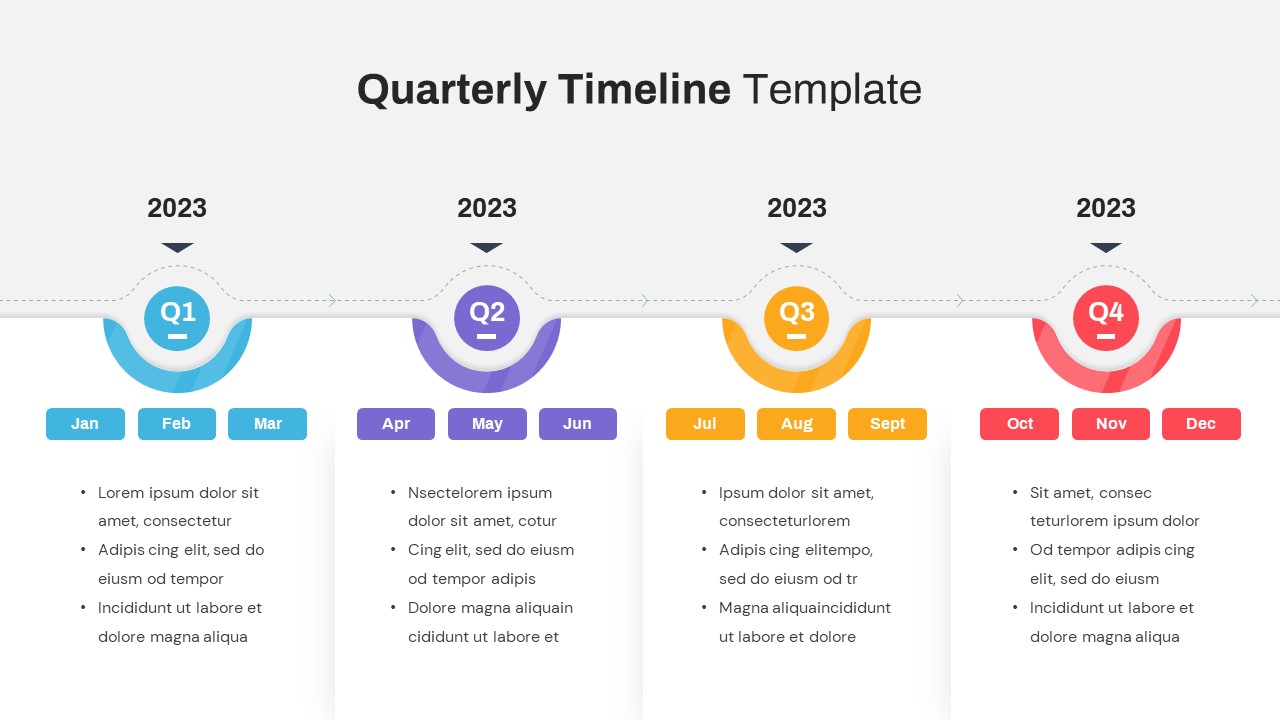
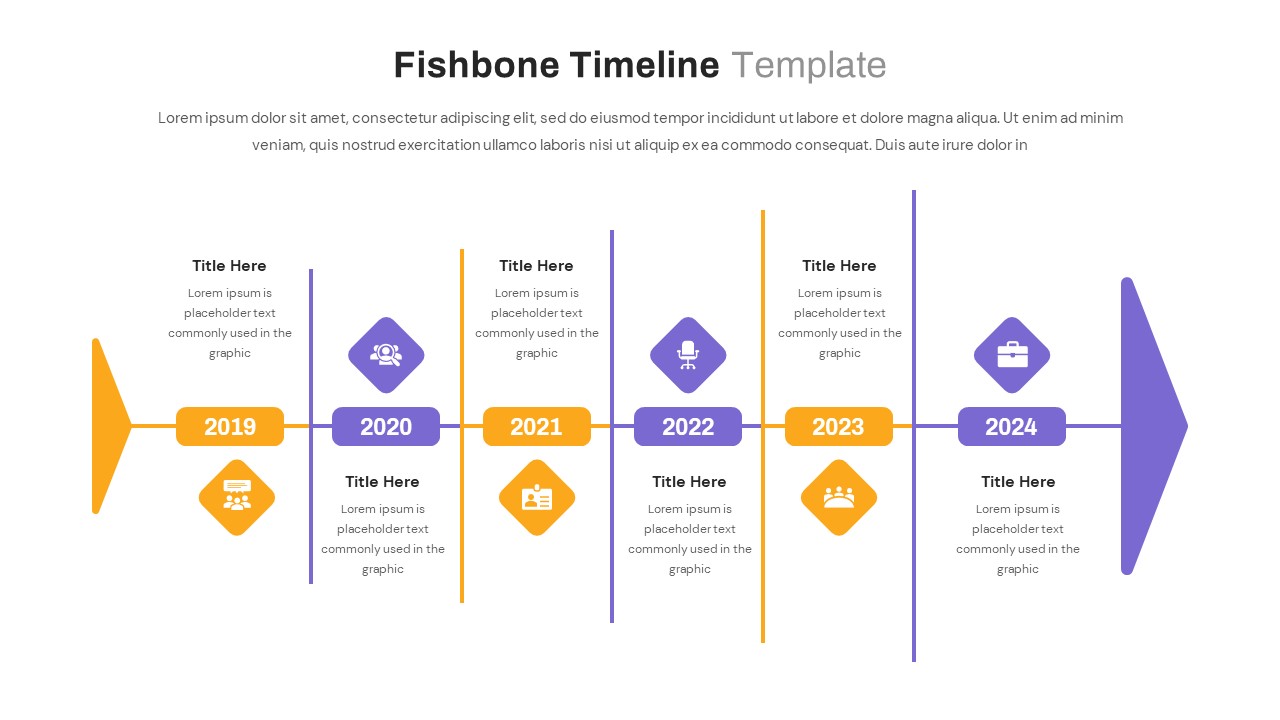
Leverage this dynamic 5-stage timeline infographic slide to convey sequential milestones or project phases with clarity and visual appeal. The horizontal timeline features five circular milestone markers evenly distributed along a central axis, each anchored by year labels from 2015 to 2019. Each marker contains a contrasting icon—user, tools, stopwatch, growth chart, target—enclosed in concentric rings with a smooth teal-to-cyan color progression. Beneath each milestone, editable text placeholders include bold subheadings and light-gray body copy that maintain consistent alignment and spacing, ensuring a clean, professional layout.
Built on master slide layouts, this fully editable infographic empowers presenters to customize colors, icons, text, and timeline spacing in seconds. Swap any icon from the integrated library, adjust ring thickness, or update the color palette to reflect company branding. Every element is grouped and labeled for effortless drag-and-drop repositioning, while preconfigured data placeholders simplify content entry. With crisp vector graphics and high-resolution clarity, this timeline infographic renders perfectly on all devices and screen sizes without distortion.
Optimized for both PowerPoint and Google Slides, the slide offers organized theme colors, unified font styles, editable icons, and optional subtle animations. Animate each milestone sequentially to guide audience focus and build narrative momentum. The clean white background enhances readability, while the gradient teal accents draw attention to key dates and icons. Whether you’re presenting business roadmaps, product launch schedules, or training agendas, this 5-stage timeline infographic balances data density with design elegance, enabling you to communicate complex sequences in a structured, distinctly memorable format.
Who is it for
Marketing managers, strategy consultants, and project leaders can use this timeline to outline campaign phases, development milestones, or implementation plans. Educators and trainers will find it ideal for visualizing course modules or curriculum schedules.
Other Uses
Repurpose this slide for product roadmaps, change-management rollouts, sales-pipeline stages, quarterly goal tracking, or risk-assessment timelines. Simply update icons and text blocks to fit any sequential narrative.
Login to download this file


